Abstract
The COVID-19 pandemic highlighted the importance of indoor air quality in buildings for the well-being of their occupants. In long-term occupancy buildings such as schools, where environmental conditions also impact academic performance, this importance was heightened. Despite the significant changes in ventilation practices resulting from the pandemic, recommendations have varied across different countries. This study aimed to provide a comparative analysis of the environmental conditions and air quality in classrooms in southern Spain and northern Italy (representative Mediterranean locations with different post-pandemic heating and natural ventilation approaches). Data measured on-site during periods with similar outdoor conditions were analysed to ascertain how ventilation strategies influence thermal comfort and indoor air quality. According to the results, during mild periods, high-intensity ventilation ensures excellent indoor air quality results based on CO2 concentrations, without compromising thermal comfort. Nevertheless, ventilation rates should be controlled in more adverse climate conditions to avoid negative effects on thermal comfort.
1. Introduction
Since the COVID-19 pandemic, the positive effect of higher indoor air quality (IAQ) for the mitigation of contagion risks among individuals has been emphasised. In this regard, schools, where children and adolescents spend many hours daily, have been under intense scrutiny. This younger population is more vulnerable than the adult population given their lower adaptive capacity and higher sensitivity to environmental changes [1]. It therefore becomes essential to understand the current state of learning environments, as an inadequate environment can negatively affect the health and academic performance of young people [2].
During the COVID-19 pandemic, natural ventilation of high-occupancy spaces became a particularly significant general action to mitigate the risk of contagion, as recommended by governments and the World Health Organization (WHO) [3]. In the specific case of schools, the WHO recommendation was to increase the total air supply to occupied spaces, prioritizing an increased supply of fresh outdoor air by manually opening windows and doors in classrooms [4]. The Federation of European Heating, Ventilation and Air Conditioning Associations (REHVA) also published guidance [5], advising ‘to actively use openable windows (much more than normal, even when this causes some thermal discomfort)’. As specified in this guidance, a ventilation rate of 4 l/s per floor m2 (corresponding to 8–10 l/s per person and 5 ACH)—in accordance with ISO 17772-1:2017 [6] and EN 16798-1:2019 [7]—may be appropriate to reduce the risk of contagion in classrooms.
Although several studies questioned the sustainability of these measures [8], it was clearly necessary to improve the IAQ of educational spaces, which often fell short of the required health standards, even pre–pandemic [9]. In general, combined assessments of air quality and thermal comfort conclude that prior to the COVID-19 pandemic, comfort in classrooms was prioritised at the cost of high CO2 concentrations. During the pandemic, efforts focused on increasing ventilation rates to reduce the risk of contagion, thereby significantly improving CO2 levels to the generalised detriment of comfort conditions [10,11].
In the research conducted in southern Spain by Alonso et al. [12], winter IEQ data measurements were evaluated from a pre-pandemic and pandemic phase. Before the pandemic, inadequate IAQ conditions were found, with a weekly average of 1000 ppm, while during the pandemic, a weekly average of under 700 ppm was measured but at the cost of a significant worsening of comfort. In another study in the northwest region of Spain, Meiss et al. [13] examined the effects of increased natural ventilation rates during winter in a school. In an initial pre-pandemic phase, excessively high CO2 and total volatile organic compound (TVOC) concentrations were recorded around 90% of the time. New strategies were proposed based on cross-ventilation to increase ventilation rates and thus reduce the risk of infection, with no significant decrease in hygrothermal comfort. However, in severe climates, the implications of overventilation for the thermal environment of classrooms can be much harsher, as reported by Monge-Barrio et al. [14] in northern Spain during the pandemic.
Similar results were found in pre-pandemic studies investigating schools in Italy. Di Perna et al. [15] monitored a school in eastern Italy, where CO2 concentrations of up to 2400 ppm were recorded, while comfort conditions were quite acceptable. Stabile et al. [16] evaluated different natural ventilation strategies in central Italy to determine their influence on indoor air quality. It was concluded that with short periods of window opening (the common strategy), the average CO2 levels were around 1800 ppm, and to ensure levels under 1000 ppm, longer periods (at least 20 min) are necessary.
As the incidence of COVID decreased, schools relaxed their preventive measures and ventilation protocols, and intermediate solutions—which could differ between climate zones—were taken. This provided a new opportunity to analyse the measures implemented in the different climate zones in order to ascertain whether air quality and comfort can be guaranteed simultaneously, without the prevalence of either of them. In northern Spain, Miao et al. [17] conducted a large on-site measurement campaign in primary and secondary schools, detecting widespread natural cross-ventilation and compliance with the minimum IAQ requirement but poor thermal comfort, mainly in summer. Llanos et al. [18] monitored secondary schools located in southern Spain, identifying more hours of discomfort (in summer) than bad IAQ. Similarly, Torriani et al. [19] explored the relationship between thermal comfort and IAQ in 26 classrooms in central Italy. They found overall adequate average levels of CO2 but quite high indoor maximum temperatures even in winter. However, despite the above-mentioned studies, in general, few published works address this combined approach of analysing thermal comfort and IAQ, taking into consideration different European climates [20].
Regarding current regulations, the Spanish requirements on the ventilation of educational spaces [21] establish the mandatory implementation of mechanical ventilation systems in non-residential buildings constructed after 2007 (a system not usually found in schools built earlier). For the purposes of this study, focus is placed on two IAQ categories defined in this regulation: IDA 1 (optimal air quality, not mandatory in schools), specifying a minimum outdoor air ventilation rate of 20 l/s per person or a maximum CO2 concentration of 350 ppm above outdoor level, and IDA 2 (good air quality, mandatory for classrooms), specifying 12.5 l/s per person or 500 ppm above outdoor level CO2 concentration. According to the Spanish Ministry of Health indications during the COVID-19 pandemic, concentrations above 800 ppm measured over outdoor levels indicate poor air quality [22].
In Italy, the first regulation related to IAQ in school buildings was introduced with DM 1975 [23], which requires air exchange to be ensured according to the grade of the classroom (3.5 ACH for middle schools, and 5 ACH for high schools). During the COVID-19 pandemic, [23] was the only legislative reference in Italy. Since the pandemic, the Italian government has made the installation of mechanical ventilation systems mandatory for public school building renovations and energy requalification [24]. Ventilation system designs must now comply with UNI 10339:1995 [25] or EN 16798-1:2019 [7]. In the case of the former, minimum outdoor air ventilation rates of 6 l/s per person and 7 l/s per person are required for middle schools and high schools, respectively. In the European reference, Category II is defined with specifications of a minimum outdoor air ventilation rate of 7 l/s per person or a maximum CO2 concentration of 800 ppm above the outdoor level.
Nevertheless, regulations are focused on IAQ or thermal comfort, and there is a lack of proposals using combined standards [26]. This, coupled with the gap detected in the literature on recent combined studies in the Mediterranean context, induced us to focus the aim of this work on providing a characterisation of different natural ventilation protocols that are being applied post-pandemic (influenced by local climate adaptations factors), analysing their influence on air quality and thermal comfort. A comparison was carried out on the on-site measurements of environmental and air quality conditions in eight characteristic classrooms located in the Mediterranean region, specifically in southern Spain and northern Italy. These locations were selected as representative of different heating and natural ventilation patterns, applied post-pandemic, within the Mediterranean climatic context of southern Europe. Ultimately, the aim was to determine whether natural ventilation strategies can simultaneously guarantee IAQ and thermal comfort in equal measure in mild climates. Air change rate estimation methods were also applied to roughly establish indicative minimum rates for ensuring adequate CO2 levels in schools with similar characteristics.
2. Materials and Methods
This section provides a description of the case studies selected for measurement campaigns of environmental and air quality conditions in school facilities, as well as the data collection and analysis methods used for these measurements. In addition, the methods and standards applied for the analysis of thermal comfort, air quality, and the estimation of the natural ventilation rate are defined.
2.1. Case Studies
In order to compare the effects of different natural ventilation strategies applied in educational centres for reducing the risk of contagion, four schools were selected for measurement campaigns: two in southern Spain (Sevilla and Córdoba) and two in northern Italy (Milan). The locations of the four case studies are presented in Figure 1. The case studies were selected by taking into account the most common building (the class–corridor–class structure) and constructive typology in Mediterranean schools [27].
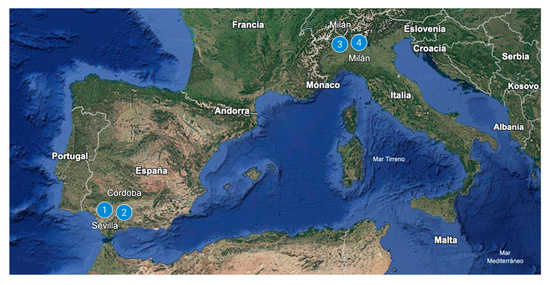
Figure 1.
Case studies location: 1—Sevilla (Spain), 2—Córdoba (Spain), 3 and 4—Milano (Italy).
Significant variations in the climate can be found between northern and southern locations in the Mediterranean, leading to substantial differences in general habits in the use of heating and ventilation systems in buildings. Therefore, the case studies selected were in locations with distinct natural ventilation strategies and heating usage. To focus the research on these differences, specific measurement periods were defined for the four case studies, aiming to ensure similar outdoor conditions. Table 1 summarises the main data for the four schools. In each school, measurements were taken in two classrooms with different orientations over a one-week period with occupancy.

Table 1.
Characteristics of the case studies in Spain (cases 1 and 2) and Italy (cases 3 and 4).
All four schools are located in compact urban areas, and the morphological conditions of the eight classrooms are similar, with a floor area of between 47 and 52 m2 and a ceiling height of between 3 and 3.28 m. However, the classrooms in the case studies in southern Spain have higher occupancy and older students, resulting in a slightly higher thermal load and contaminant levels. Figure 2 shows the typology of the classrooms through plans and images.
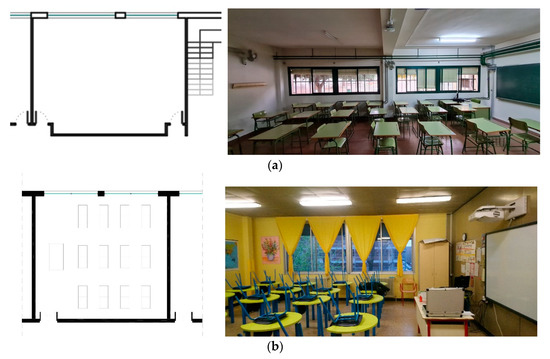
Figure 2.
Floor plan and interior view illustrating classroom typologies for (a) southern Spain and (b) northern Italy.
To establish behavioural patterns in the different classrooms, teachers were asked to complete a survey detailing the times and durations of periods with open windows, as well as the use of heating. In classrooms in southern Spain, natural ventilation through windows was consistently maintained during the measurement periods, with all operable window surfaces fully open. Further details on the ventilation capacity of the individual classrooms are provided in Section 3.3. Despite having centralised heating systems, these systems were activated only briefly during the first two hours of the morning—approximately 8:00 to 10:00—due to economic reasons and climate-related habits. In contrast, in classrooms in northern Italy, natural ventilation, although consistent, did not involve fully opening 100% of operable window surfaces but varied based on needs and external thermal conditions. Italian government guidelines suggested ventilating as much as possible to reduce infection risks after the COVID-19 pandemic but lacked specificity [28]. Additionally, centralised heating systems in these schools are in continuous operation, leading to concerns that excessive window opening could lead to energy waste.
For data collection, the measurement campaigns for both southern Spain and northern Italy used different sensors with similar features, subject to equipment availability. Their main characteristics are detailed in Table 2. Both sensors measured and stored air temperature and CO2 levels every 10 min.

Table 2.
Characteristics and accuracy of the sensors.
2.2. Thermal Comfort Analysis
Based on the temperature data measured in the classrooms, thermal comfort conditions during occupied hours were analysed according to two of the most widely used standards in the scientific community [29]: EN ISO 7730 and ASHRAE Standard 55.
The main international standards are based on Fanger’s comfort studies [30], whose methodology was incorporated into the EN ISO 7730 standard [31]. These standards form the basis for the initial comfort analysis conducted in this study. Based on the conditions specified in Table A.5 of EN ISO 7730 for classrooms under winter conditions, the following conditions were established:
- Thermal environment category: B, indicating a predicted percentage of dissatisfied (PPD) < 10%;
- Metabolic rate: 1.2 MET;
- Clothing level: 1.0 clo.
Under these conditions, an optimal comfort temperature of 22 °C was established, with an acceptability range of ±2 °C. Temperatures above or below these conditions were considered states of indoor overheating or undercooling, respectively.
However, numerous studies establish that when analysing comfort in buildings using natural ventilation through operable windows managed by the occupants, as in the case studies examined here, adaptive standards are more suitable than the steady-state model [32,33]. Therefore, in the second comfort analysis conducted in this study, we employed the adaptive method defined in ASHRAE Standard 55 [34], which considers the user’s ability to adapt in terms of clothing (between 0.5 and 1.0 clo) and the use of ventilation systems. For this method to be applicable, the occupants’ activity should correspond to a metabolic rate of between 1 and 1.5 MET. In this case, an optimal comfort temperature () is established, which depends on the running outdoor temperature (), according to Equations (1) and (2), and an acceptability range of ±2.5 °C (resulting in PPD < 10%). Temperatures above or below these conditions are considered states of indoor overheating or undercooling, respectively.
where is the daily mean external air temperature for the previous days (1–7).
2.3. Indoor Air Quality Analysis
Among indoor air pollutants, the concentration of carbon dioxide (CO2) is widely used to estimate the IAQ levels in buildings where occupants are the main source of contaminants, although this presents some limitations [35]. In this work, the CO2 level measured in the classrooms during occupied hours was used, according to three levels of air quality:
- Optimal air quality: taking as reference the IDA 1 category set out in Spanish regulation [21], with indoor CO2 values below 750 ppm (considering an outdoor value of 400 ppm, according to EN 16798-1 [7]);
- Good air quality: with indoor CO2 values of between 750 and 1200 ppm;
- Poor air quality: according to EN 16798-1 [7], unacceptable air quality is categorised as indoor CO2 values above 1200 ppm (800 ppm above the outdoor value considered as 400 ppm).
2.4. Air Change Rate Estimation
The steady-state or equilibrium method was applied in order to roughly estimate the air exchange rate through window opening in the different case studies. This method is used when the CO2 level has reached a steady-state concentration (the occupancy conditions remain fixed for at least three complete air changes). In this case, two air exchange rates were estimated for each measured day: one during the first half of the school day (before the break, when the classroom is empty) and another during the second half.
This method is documented in various guidelines and standards [36,37], where the calculation of the air change rate () is performed according to Equation (3).
where is the number of occupants; is the average CO2 generation rate per person [l/min]—according to Batterman [38]; is the volume of the classroom [m3]; is the steady-state indoor CO2 concentration [ppm]; and is the outdoor CO2 concentration [ppm].
3. Results and Discussion
3.1. Environmental Conditions
Based on the indoor and outdoor temperature data and indoor CO2 levels recorded in the different case studies, boxplot graphs were used to analyse the values (Figure 3). The central mark of each box indicates the median of the measured values, with the lower and upper ends of the box representing the 25th and 75th percentiles, respectively. The whiskers extend to the most extreme data points, which are not considered outliers (5th and 95th percentiles), and outliers are represented with the “+” symbol.
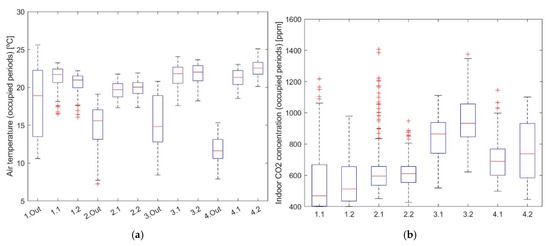
Figure 3.
Measured data of (a) air temperature and (b) CO2 levels.
In terms of air temperature (Figure 3a), similar ranges were observed in both southern Spain (cases 1 and 2) and northern Italy (cases 3 and 4), with median values of indoor classroom temperatures ranging between 20 and 22.5 °C. Outdoor air temperatures are slightly lower in northern Italy, but more intensive use of heating systems and fewer hours of window opening result in slightly higher indoor temperatures than those in southern Spain.
However, significant differences were observed between the indoor CO2 values measured in the cases in southern Spain and northern Italy (Figure 3b). While in cases 1 and 2 CO2 values frequently remained below 700 ppm, in cases 3 and 4, they often reached (classroom 3.2) or approached values of around 1000 ppm. In order to better understand the ventilation strategies employed in each case, the distribution of measured CO2 levels in different classrooms was analysed using histograms (Figure 4). Classrooms 1.1 and 1.2 exhibited a concentrated distribution at very low CO2 levels, between 400 and 500 ppm, similar to case 2.1, but with slightly higher values (500–600 ppm). Classroom 2.2 showed a distribution of measured CO2 values close to normal, with the peak frequency at 600 ppm. Although the highest frequency of values around 900 ppm was found in classrooms 3.1 and 3.2, in the former, most measurements were below this value, unlike in the latter, where most exceeded this value. For classrooms 4.1 and 4.2, the distribution was less clear, and several peaks of similar frequency, around 600 ppm and 800 ppm (case 4.1) and 1000 ppm (case 4.2), were observed.
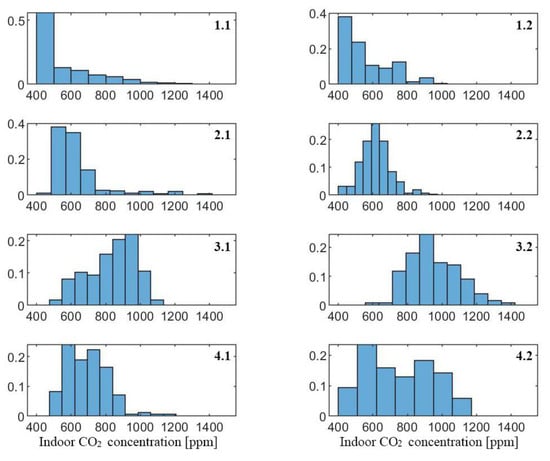
Figure 4.
CO2 level histograms.
Comparing the variables measured in this work with other studies, Miao et al. [17] detected similar average temperatures (around 22 °C) in mild seasons in northern Spain, although with relatively higher maximum values (approximately 29 °C). Something similar occurs with the average CO2 concentration levels (of around 550 ppm) found in northern [17] and central Spain [39], which are close to the median values measured in the Spanish cases of this work (but lower than those of the Italian cases). Nevertheless, the maximum value detected by Miao et al. (2446 ppm) is significantly higher than those measured in all the case studies of this work, probably due to less intensive ventilation. In central Italy, Torriani et al. [19] found the average levels of CO2 to be around 1500 ppm, slightly higher than those obtained in the most unfavourable case of this work (case 3), but with similar average indoor temperatures (around 22 °C). In northern Italy during a mild period, Babich et al. [26] measured CO2 concentration levels generally between 500 and 1500 ppm and indoor temperatures between 20 and 24 °C (very similar to the Italian case studies of this work).
3.2. Thermal Comfort and Indoor Air Quality Analysis
The measured data were analysed in terms of thermal comfort according to two of the main standards used by the scientific community, as set out in Section 2.2: the steady-state standard EN ISO 7730 [31] (Figure 5a) and adaptive ASHRAE Standard 55 [34] (Figure 5b). Both models evaluate whether the temperatures measured inside the classrooms stabilise within the comfort range or can be classed as overheating or undercooling situations.
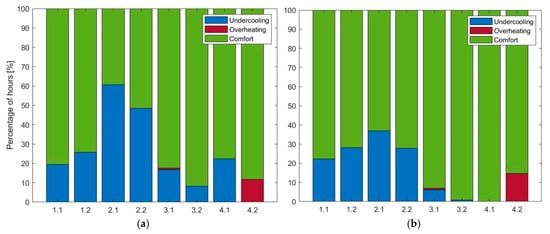
Figure 5.
Thermal comfort analysis according to (a) EN ISO 7730 and (b) ASHRAE Standard 55.
With both standards, the poorest results are observed in case 2 (located in southern Spain), primarily due to a high-intensity use of natural ventilation through windows during hours with low outdoor temperatures, and a low-intensity use of heating. Specifically, according to the steady-state standard, the percentage of undercooling hours in case 2 ranges from 50 to 60%, reflecting an overestimation in relation to the adaptive standard, where it is significantly lower (between 30 and 35%). In southern Spain, comfort issues stem exclusively from temperatures below the comfort band as, thanks to natural ventilation, there are no overheating issues during peak temperature or occupation hours. However, overheating issues do arise in classroom 4.2 in northern Italy (approximately 10% of overheating hours) as a result of more intense heating usage and inadequate dissipation of internal loads due to insufficient ventilation towards late morning.
Secondly, IAQ was analysed using measured CO2 levels in classrooms, as defined in Section 2.3. The results are presented in Figure 6, where blue indicates the percentage of hours with optimal air quality (CO2 < 750 ppm); yellow indicates good air quality (750 ppm < CO2 < 1200 ppm); and red indicates poor air quality (CO2 > 1200 ppm). In southern Spain, air quality was optimal for more than 80% of the hours, while poor air quality occurred in less than 2% of the hours in two classrooms. By contrast, in northern Italy, in case 3, air quality was optimal for only 5–25% of the hours, with classroom 3.2 showing around 5% of hours with poor air quality. In case 4, although air quality was slightly worse than in southern Spain according to the results, optimal air quality values ranged from 50 to 70% of the hours.
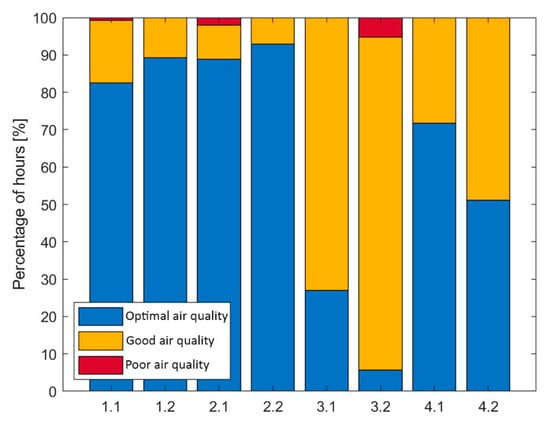
Figure 6.
IAQ analysis based on measured CO2 levels, classified as follows: optimal air quality (CO2 < 750 ppm), good air quality (750 ppm < CO2 < 1200 ppm), and poor air quality (CO2 > 1200 ppm).
According to the analysis of thermal comfort and IAQ, the best balance between both environmental conditions, with very good comfort conditions (combining moderate ventilation with heating usage) and very acceptable IAQ conditions, was found in classroom 4.1. In the case studies in southern Spain, there may be overventilation early in the morning, as maintaining good air quality instead of optimal air quality could potentially improve thermal comfort conditions.
In comparison with other similar studies, the results obtained in this work are slightly better, since both Miao et al. [17] and Llanos et al. [18] found, in northern and southern Spain, respectively, unacceptable IAQ for approximately 30% of the occupied hours. In addition, poor thermal comfort was detected in up to 47% of the hours. However, it should be noted that both studies referenced above cover longer measurement periods, including summer months, with more unfavourable external conditions. In the case of Babich et al. [26], focused on mild periods, poor air quality was found between 3 and 30% of the occupied hours, depending on the school.
3.3. Ventilation Strategies
In order to carry out a detailed analysis of the ventilation strategies implemented in the different case studies, a rough estimation of ventilation rates was conducted using the steady-state method explained in Section 2.4. Additionally, Table 3 compiles some of the morphological characteristics of the classrooms that directly affect their natural ventilation capacity.

Table 3.
Case study characteristics linked to natural ventilation.
As shown in the table, the classrooms with the largest operable window area are those in case 4, located in northern Italy, followed by those in case 2, in southern Spain. However, while in cases 1 and 2, it is customary to open 100% of the operable window area, this does not apply to cases 3 and 4, where typically only 10–40% of the total operable area is used. Another aspect contributing to higher air exchange rates in the case studies in southern Spain is that the classrooms have two access doors from the hallway, which tend to be left open in accordance with post-COVID recommendations. In most schools in southern Spain, the layout of classrooms typically includes a central corridor providing access to classrooms on both sides [27]. Post-pandemic, windows and doors tend to be kept open in classrooms on either side of the corridor, significantly promoting cross-ventilation. This effect is less pronounced in the classrooms monitored in northern Italy, which only have one door, usually kept closed according to the teachers surveyed.
Figure 7 presents the results obtained from the ventilation rate estimation using a boxplot graph. Generally, the highest ventilation rates were estimated in the cases in southern Spain, frequently exceeding 5 air changes per hour (ACH) in all instances. Overventilation was notably evident in classrooms such as 1.2, where values often exceeded 15 ACH. In contrast, ventilation rates were consistent in the cases of northern Italy, ranging from about 2.5 ACH in case 3 to between 3 and 7 ACH in case 4. It should be noted that in Spain, the ventilation rate required in newly built schools is about 9 ACH, while in Italy, about 4 ACH is considered sufficient.
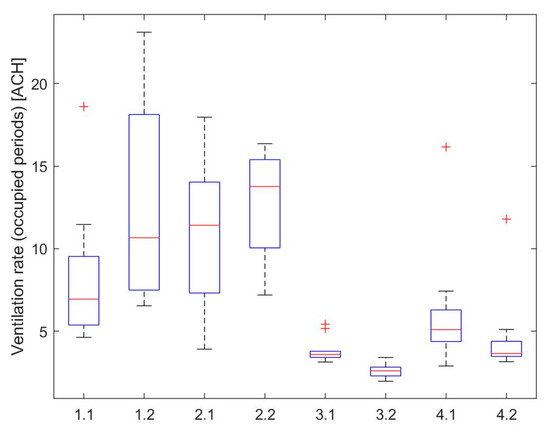
Figure 7.
Estimated natural ventilation rates.
In order to analyse the impact of natural ventilation strategies on thermal comfort, Table 4 summarises the maximum and minimum air temperature results for the measured and estimated ventilation rates based on CO2 values. It is observed that in classrooms with higher ventilation rates, such as 1.2, internal loads are adequately dissipated, and indoor temperatures of around 22 °C are maintained, even with higher outdoor temperatures (exceeding 25 °C). Conversely, classrooms with lower ventilation rates, such as 3.1, 3.2, and 4.2, experience higher maximum indoor temperatures than outdoors due to insufficient dissipation of internal loads. Therefore, with moderate external climates, a high air exchange rate favours suitable indoor thermal conditions.

Table 4.
Summary of the results during occupied periods.
Similar results were found by Romero et al. [39] when comparing factors influencing thermal comfort among students at two universities in Spain and Portugal after COVID-19 mitigation protocols were no longer mandatory. Despite similar climatic conditions in both regions, differences in thermal preferences were noted between Spanish and Portuguese students, potentially influenced by cultural attire norms and gender differences. However, higher CO2 concentrations were observed in Portuguese spaces once measures had been relaxed. Consequently, the authors recommend maintaining the ventilation strategies implemented during pandemics in educational settings during non-heating seasons, as they uphold thermal comfort while also enhancing IAQ in classrooms.
Finally, in Figure 8, the estimated air renovation rates in ACH (Figure 8a) and l/s*person (Figure 8b) were correlated with the CO2 levels measured in the classrooms. Dashed lines represent the minimum and maximum correlation curves within which the case studies fall. As shown in Figure 8a, trends in classrooms from southern Spain and northern Italy are notably influenced by occupancy, which is higher in the former (28–30 students) than in the latter (20–25 students). In Figure 8b, showing a standardised per person measurement unit, the values in both climatic zones are categorised according to student age (from age 9 in case 3.2 to age 17 in case 2), as younger students are associated with lower CO2 production rates. This correlation is the direct result of the application of Equation (3) to calculate the air exchange rates, but the graphs provided can be highly useful in establishing an indicative minimum ventilation rate to ensure adequate CO2 levels in school settings, incorporating factors such as student age, classroom volumes, and window opening area in the range of the study cases.
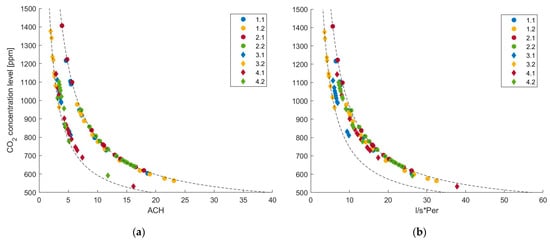
Figure 8.
Correlation of CO2 levels and estimated natural ventilation rates: (a) in ACH and (b) l/s*person.
4. Conclusions
This work presents a comparative analysis of post-pandemic natural ventilation strategies, IAQ, and thermal comfort in two different locations representative of the diversity of heating and ventilation patterns within the Mediterranean climatic context. It emphasises the importance of effective ventilation strategies in enhancing both thermal comfort and indoor air quality in educational buildings, highlighting significant differences between climatic regions and local ventilation practices. The outcomes identified in this study are summarised as follows:
- Indoor temperatures in classrooms in southern Spain and northern Italy remained within similar ranges, generally between 20 and 22.5 °C.
- In the case of Italy, windows were gradually opened based on the needs of the indoor environment, and the classroom door remained closed. Conversely, in case studies in Spain, windows and both classroom doors were fully open throughout the lessons.
- Indoor CO2 levels showed significant differences between the cases studied, with lower values in southern Spain than in northern Italy. The Spanish schools showed optimal air quality for more than 80% of the time, whereas the Italian ones exhibited optimal air quality for just 5–25% of the time (although the quality is adequate most of the occupied hours).
- The high ventilation rates observed in southern Spain, combined with the lack of heating when outdoor temperatures are low, can lead to thermal discomfort (as seen in case 2 during approximately 30% of the occupied hours). Conversely, overheating hours were observed in northern Italian schools (10% of occupied hours in case 4.2).
The comparison of the classrooms analysed in diverse climates in the Mediterranean area revealed different habits related to the use of heating and ventilation systems in buildings, and their pros and cons in terms of IAQ and thermal comfort were evaluated. It can be concluded that, during milder periods, high natural ventilation rates resulting from opening windows improve IAQ without compromising thermal conditions, creating a more comfortable atmosphere and enhancing student performance, provided that the concentrations of outdoor pollutants are not unfavourable. Nevertheless, under more severe climatic conditions, overventilation clearly compromises thermal comfort. It is therefore essential to adjust and optimise natural ventilation protocols and explore efficient active systems combining mechanical ventilation and thermal treatment.
The analysis presented in this study could serve as a starting point for the proposal of retrofitting actions to guarantee the same level of thermal comfort and IAQ. In addition, this paper reveals a correlation between estimated air exchange rates and measured CO2 levels considering occupancy and student age, which is useful for establishing indicative minimum ventilation rates to maintain adequate CO2 levels in school environments.
Despite the above, the small number of case studies selected and the measurement periods are limitations of this research. In future research, a similar methodology should be applied to a wider range of school building typologies and more extreme climatic periods. In addition, other physical parameters and chemical indicators of indoor environmental quality, such as formaldehyde and virus levels, should be measured and evaluated in future research, in order to enhance the comprehensiveness of the assessment.
Author Contributions
Conceptualisation, R.E., S.F., T.B. and R.S.; methodology, R.E., S.F. and R.C.; software, R.E.; formal analysis, R.E., S.F. and R.C.; investigation, R.E., R.C. and T.B.; resources, S.F. and R.S.; data curation, R.E. and R.C.; writing—original draft preparation, R.E. and T.B.; writing—review and editing, R.E., S.F., R.C., T.B. and R.S.; visualisation, R.E. and S.F.; supervision, S.F. and R.S.; project administration, R.S.; funding acquisition, R.S. All authors have read and agreed to the published version of the manuscript.
Funding
This research was funded by MICIU/AEI/10.13039/501100011033, grant number PID2020-117722RB-I00 “Retrofit ventilation strategies for healthy and comfortable schools within a nearly zero-energy building horizon”.
Institutional Review Board Statement
Not applicable.
Informed Consent Statement
Not applicable.
Data Availability Statement
The original contributions presented in this study are included in the article. Further inquiries can be directed to the corresponding author.
Acknowledgments
R. Escandón acknowledges the financing of the VI PPIT-US, through the 2020 Call for Contracts for Access to the Spanish Science, Technology, and Innovation System for the Development of the R&D&I Program of the University of Seville. T. Blázquez also acknowledges the financing of this publication as part of the Beatriz Galindo grant with reference BG22/00092 funded by the Ministry of Universities and the University of Seville.
Conflicts of Interest
The authors declare no conflicts of interest.
References
- Wargocki, P.; Wyon, D.P. Providing better thermal and air quality conditions in school classrooms would be cost-effective. Build. Environ. 2013, 59, 581–589. [Google Scholar] [CrossRef]
- Wargocki, P.; Porras-Salazar, J.A.; Contreras-Espinoza, S.; Bahnfleth, W. The relationships between classroom air quality and children’s performance in school. Build. Environ. 2020, 173, 106749. [Google Scholar] [CrossRef]
- World Health Organisation (WHO); Regional Office for the Western Pacific. Repurposing Facilities for Quarantine or Isolation and Management of Mild COVID-19 Cases. 2020. Available online: https://www.who.int/publications/i/item/WPR-DSE-2020-006 (accessed on 19 May 2025).
- World Health Organisation (WHO); United Nations Educational, Scientific and Cultural Organization; United Nations Children’s Fund. Considerations for School-Related Public Health Measures in the Context of COVID-19. Annex to Considerations in Adjusting Public Health and Social Measures in the Context of COVID-19. 2020. Available online: https://www.who.int/publications/i/item/considerations-for-school-related-public-health-measures-in-the-context-of-covid-19 (accessed on 19 May 2025).
- Federation of European Heating; Ventilation and Air Conditioning Associations (REHVA). REHVA COVID19 GUIDANCE. Version 4.0. How to Operate HVAC and Other Building Service Systems to Prevent the Spread of the Coronavirus (SARS-CoV-2) Disease (COVID-19) in Workplaces. 2020. Available online: https://www.rehva.eu/fileadmin/user_upload/REHVA_COVID-19_guidance_document_V4_23112020.pdf (accessed on 19 May 2025).
- ISO 17772-1:2017; Energy Performance of Buildings. Indoor Environmental Quality. Indoor Environmental Input Parameters for the Design and Assessment of Energy Performance of Buildings. International Organization for Standardization (ISO): Geneva, Switzerland, 2017.
- EN16798-1:2019; Energy Performance of Buildings—Ventilation for Buildings—Part 1: Indoor Environmental Input Parameters for Design and Assessment of Energy Performance of Buildings Addressing Indoor Air Quality, Thermal Environment, Lighting and Acoustics—Module M1-6. European Committee for Standardization (CEN): Brussels, Belgium, 2019.
- Vignolo, A.; Gómez, A.P.; Draper, M.; Mendina, M. Quantitative assessment of natural ventilation in an elementary school classroom in the context of COVID-19 and its impact in airborne transmission. Appl. Sci. 2022, 12, 9261. [Google Scholar] [CrossRef]
- European Commission, Joint Research Centre; Directorate-General for Health and Consumers; Institute for Health and Consumer Protection; Csobod, E.; Annesi-Maesano, I.; Carrer, P.; Kephalopoulos, S.; Madureira, J.; Rudnai, P.; de Oliveira-Fernandez, E. SINPHONIE—Schools Indoor Pollution & Health Observatory Network in Europe—Final Report; Publications Office of the European Union: Luxembourg, 2014. [Google Scholar]
- Miranda, M.T.; Romero, P.; Valero-Amaro, V.; Arranz, J.I.; Montero, I. Ventilation conditions and their influence on thermal comfort in examination classrooms in times of COVID-19. A case study in a Spanish area with Mediterranean climate. Int. J. Hyg. Environ. Health 2022, 240, 113910. [Google Scholar] [CrossRef] [PubMed]
- Aguilar, A.J.; De La Hoz-Torres, M.L.; Martínez-Aires, M.D.; Ruiz, D.P. Monitoring and assessment of indoor environmental conditions after the implementation of COVID-19-based ventilation strategies in an educational building in southern Spain. Sensors 2021, 21, 7223. [Google Scholar] [CrossRef]
- Alonso, A.; Llanos, J.; Escandón, R.; Sendra, J.J. Effects of the COVID-19 pandemic on indoor air quality and thermal comfort of primary schools in winter in a mediterranean climate. Sustainability 2021, 13, 2699. [Google Scholar] [CrossRef]
- Meiss, A.; Jimeno-Merino, H.; Poza-Casado, I.; Llorente-Álvarez, A.; Padilla-Marcos, M.Á. Indoor air quality in naturally ventilated classrooms. Lessons learned from a case study in a COVID-19 scenario. Sustainability 2021, 13, 8446. [Google Scholar] [CrossRef]
- Monge-Barrio, A.; Bes-Rastrollo, M.; Dorregaray-Oyaregui, S.; González-Martínez, P.; Martin-Calvo, N.; López-Hernández, D.; Arriazu-Ramos, A.; Sánchez-Ostiz, A. Encouraging natural ventilation to improve indoor environmental conditions at schools. Case studies in the north of Spain before and during COVID. Energy Build. 2022, 254, 111567. [Google Scholar] [CrossRef]
- Di Perna, C.; Mengaroni, E.; Fuselli, L.; Stazi, A. Ventilation strategies in school buildings for optimization of air quality, energy consumption and environmental comfort in mediterranean climates. Int. J. Vent. 2011, 10, 61–78. [Google Scholar] [CrossRef]
- Stabile, L.; Buonanno, G.; Frattolillo, A.; Dell’Isola, M. The effect of the ventilation retrofit in a school on CO2, airborne particles, and energy consumptions. Build. Environ. 2019, 156, 1–11. [Google Scholar] [CrossRef]
- Miao, S.; Gangolells, M.; Tejedor, B. A Comprehensive Assessment of Indoor Air Quality and Thermal Comfort in Educational Buildings in the Mediterranean Climate. Indoor Air 2023, 2023, 649829. [Google Scholar] [CrossRef]
- Llanos, J.; Suárez, R.; Alonso, A.; Sendra, J.J. Objective and Subjective Indoor Air Quality and Thermal Comfort Indices: Characterization of Mediterranean Climate Archetypal Schools After the COVID-19 Pandemic. Indoor Air 2024, 2024, 2456666. [Google Scholar] [CrossRef]
- Torriani, G.; Lamberti, G.; Fantozzi, F.; Babich, F. Exploring the impact of perceived control on thermal comfort and indoor air quality perception in schools. J. Build. Eng. 2023, 63, 105419. [Google Scholar] [CrossRef]
- Aguilar-Carrasco, M.T.; López-Lovillo, R.M.; Suárez, R.; León-Rodríguez, Á.L. Ventilation Strategies to Ensure Thermal Comfort for Users in School Buildings: A Critical Review. Appl. Sci. 2025, 15, 5449. [Google Scholar] [CrossRef]
- Instituto para la Diversificación y Ahorro de la Energía (IDEA). Royal Decree 178/2021, of March 23, amending Royal Decree 1027/2007, of July 20, approving the Regulations on Thermal Installations in Buildings. 2021. Available online: https://www.boe.es/buscar/doc.php?id=BOE-A-2021-4572 (accessed on 11 May 2025).
- Moreno-Grau, S.; Álvarez-León, E.E.; García dos Santos, S.; Diego-Roza, C.; Ruiz de Adana, M.; Marín-Rodríguez, I.; Tomás-Carmona, M.M.; Cruz-Minguillón, M.; van der Haar, R. Evaluación del Riesgo de la Transmisión de SARS-CoV-2 Mediante Aerosoles. Medidas de Prevención y Recomendaciones. Documento Técnico. Ministerio de Sanidad, 2020. Available online: https://www.sanidad.gob.es/areas/alertasEmergenciasSanitarias/alertasActuales/nCov/documentos/COVID19_Aerosoles.pdf (accessed on 19 May 2025).
- Ministro dei lavori pubblici. Decreto Ministeriale 18 dicembre 1975. Norme tecniche aggiornate relative alla edilizia scolastica, ivi compresi gli indici minimi di funzionalità didattica, edilizia ed urbanistica, da osservarsi nella di opere di edilizia scolastica, December 18, p. 30, 1975. Available online: https://www.minori.gov.it/sites/default/files/dm_18_dicembre_1975.pdf (accessed on 19 May 2025).
- Ministero della transizione ecologica. Decreto 23 giugno 2022. Criteri ambientali minimi per l’affidamento del servizio di progettazione di interventi edilizi, per l’affidamento dei lavori per interventi edilizi e per l’affidamento congiunto di progettazione e lavori per interventi edilizi, June 23, 2022. Italy, Rome. Available online: https://www.gazzettaufficiale.it/eli/id/2022/08/06/22A04307/sg (accessed on 19 May 2025).
- UNI 10339:1995; Impianti aeraulici al fini di benessere. Generalità, classificazione e requisiti. Regole per la richiesta d’offerta, l’offerta, l’ordine e la fornitura. Ente Italiano di Normazione: Milan, Italy, 1995.
- Babich, F.; Torriani, G.; Corona, J.; Lara-Ibeas, I. Comparison of indoor air quality and thermal comfort standards and variations in exceedance for school buildings. J. Build. Eng. 2023, 71, 106405. [Google Scholar] [CrossRef]
- Llanos-Jiménez, J.; Suárez, R.; Alonso, A.; Sendra, J.J. Archetypes of Public Secondary Schools in Mediterranean Climate. Indoor Air Quality and Comfort Field Studies. In Proceedings of the 42nd AIVC—10th TightVent—8th Venticool Conference, Ventilation Challenges in a Changing World, Rotterdam, The Netherlands, 5–6 October 2022; pp. 808–817. [Google Scholar]
- Ferrari, S.; Blázquez, T.; Cardelli, R.; De Angelis, E.; Puglisi, G.; Escandón, R.; Suárez, R. Air change rates and infection risk in school environments: Monitoring naturally ventilated classrooms in a northern Italian urban context. Heliyon 2023, 9, e19120. [Google Scholar] [CrossRef]
- Djongyang, N.; Tchinda, R.; Njomo, D. Thermal comfort: A review paper. Renew. Sustain. Energy Rev. 2010, 14, 2626–2640. [Google Scholar] [CrossRef]
- Fanger, P.P. Thermal Comfort: Analysis and Applications on Environmental Technology; Danish Technical Press: Copenhagen, Denmark, 1970. [Google Scholar]
- ISO 7730:2005; Ergonomics of the Thermal Environment. Analytical Determination and Interpretation of Thermal Comfort Using Calculation of the PMV and PPD Indices and Local Thermal Comfort Criteria. International Organization for Standardization (ISO): Geneva, Switzerland, 2005.
- Nicol, F.; Humphreys, M. Derivation of the adaptive equations for thermal comfort in free-running buildings in European standard EN15251. Build. Environ. 2010, 45, 11–17. [Google Scholar] [CrossRef]
- Carlucci, S.; Bai, L.; de Dear, R.; Yang, L. Review of adaptive thermal comfort models in built environmental regulatory documents. Build. Environ. 2018, 137, 73–89. [Google Scholar] [CrossRef]
- ANSI/ASHRAE Standard 55-2020; Thermal Environmental Conditions for Human Occupancy. American Society of Heating, Refrigerating and Air Conditioning Engineers (ASHRAE): Atlanta, GA, USA, 2020.
- American Society of Heating, Refrigerating and Air Conditioning Engineers (ASHRAE). Position Document on Indoor Carbon Dioxide. 2022. Available online: https://www.ashrae.org/file%20library/about/position%20documents/pd_indoorcarbondioxide_2022.pdf (accessed on 19 May 2025).
- D6245-12; Standard Guide for Using Indoor Carbon Dioxide Concentrations to Evaluate Indoor Air Quality and Ventilation. ASTM: West Conshohocken, PA, USA, 2012.
- World Health Organisation (WHO). Methods for Monitoring Indoor Air Quality in Schools: Report from the Meeting, Bonn, Germany, 4–5 April 2011; World Health Organization: Geneva, Switzerland, 2011; p. 32. [Google Scholar]
- Batterman, S. Review and extension of CO2-based methods to determine ventilation rates with application to school classrooms. Int. J. Environ. Res. Public. Health 2017, 14, 145. [Google Scholar] [CrossRef]
- Romero, P.; Valero-Amaro, V.; Miranda, M.T. Indoor Air Quality and Thermal Comfort in University Classrooms in Southwestern Spain: A Longitudinal Analysis from Pandemic to Post-Pandemic. Buildings 2025, 15, 829. [Google Scholar] [CrossRef]
Disclaimer/Publisher’s Note: The statements, opinions and data contained in all publications are solely those of the individual author(s) and contributor(s) and not of MDPI and/or the editor(s). MDPI and/or the editor(s) disclaim responsibility for any injury to people or property resulting from any ideas, methods, instructions or products referred to in the content. |
© 2025 by the authors. Licensee MDPI, Basel, Switzerland. This article is an open access article distributed under the terms and conditions of the Creative Commons Attribution (CC BY) license (https://creativecommons.org/licenses/by/4.0/).