Abstract
In practice, the bending and fracturing of heavy layers is often considered the primary cause of surface damage, leading to significant environmental impacts, whereas heavy layer-type mining-induced earthquakes are frequently overlooked. This study combines theoretical analysis, UDEC numerical simulations, and industrial experiments to investigate the dynamic behavior of heavy layers and the mechanisms through which mining-induced earthquakes trigger surface damage. It aims to demonstrate that heavy layer movement and mining-induced earthquakes cause surface damage and to develop a replicable engineering solution for seismic prevention and subsidence control in heavy layer mining areas. The results reveal that surface damage stems from the synergistic effects of heavy layer fracturing and associated mining-induced earthquakes, where bending subsidence from heavy layer fracturing is the primary driver, and mining-induced earthquakes act as a secondary factor by compressing fragmented rock pores to amplify overlying layer subsidence. Industrial tests at the 7202 working face using deep-hole roof pre-splitting blasting successfully fractured the heavy conglomerate layer, enhanced goaf bulking, and reduced the intensity of layer movement. This intervention significantly decreased the frequency and energy of mining-induced earthquakes, mitigating surface damage. These findings provide a practical framework for the integrated control of mining-induced earthquakes and subsidence in heavy layer environments.
1. Introduction
In mining engineering, a rock layer with a thickness exceeding 50 m is referred to as “heavy layer”, which is characterized by its large thickness and high strength. As the working face—specifically, the advancing face in coal mining—progresses, the mining influence space expands, leading to an increased hanging roof scope. When a heavy layer breaks, it generates significant mining-induced earthquakes. Mining-induced earthquakes associated with heavy layer movement often cause surface damage, thereby triggering environmental and social issues [1,2]. In 2022, 153 surface settlement incidents occurred in China, resulting in significant economic losses. Currently, the research on surface damage caused by underground mining is relatively comprehensive, and corresponding control and prevention measures are well-established. However, mining-induced earthquakes in heavy layers, as a more hazardous dynamic phenomenon, remains insufficiently studied, particularly regarding the combined effects of heavy layer movement and mining-induced earthquakes on surface damage [3,4].
For a long time, the focus has been on the damage to surface structures caused by mining-induced ground deformation. Only in recent years has the adverse impact of mining-induced earthquakes on surface structures gained attention. Zhang et al. [5] classified earthquakes into natural and induced types, with mining-induced earthquakes falling into the latter category. They noted that mining-induced earthquakes can cause soil liquefaction, similar to natural earthquakes. Zhang et al. [6] investigated a deep coal mining face with a hard heavy layer in the Ordos region. Using key stratum theory, they analyzed the land subsidence patterns and spatiotemporal distribution characteristics of strong mining-induced earthquakes under multi-face mining conditions. Wang et al. [7] studied surface deformation caused by steeply inclined coal seam mining in the Urumqi coalfield. They evaluated the applicability of deformation models using SBAS-InSAR technology, reconstructed 2D deformation fields from Sentinel-1 imagery, and assessed their accuracy. Aditya Kumar Thakur et al. [8] employed Sentinel-1 SAR imagery and multi-image sparse point processing to analyze spatiotemporal ground subsidence in the eastern Jharia coalfield (2021–2023). By classifying risk zones based on subsidence rate, gradient, and curvature parameters, they identified high-risk areas concentrated in active mining zones and urbanized regions, with critical settlements being particularly vulnerable. Meng et al. [9] analyzed multiple high-energy mining-induced earthquakes in the Laohutai coal mine using empirical formulas to estimate the epicentral distances corresponding to different magnitudes and intensities, providing references for the extent of building damage and the impact range of mining-induced earthquakes.
In coal mining and rock mechanics research, scholars have primarily focused on overburden fracturing and structural instability to investigate the mechanisms of mining-induced earthquakes in heavy layers [10]. Based on theories such as the voussoir beam theory, key stratum theory, and masonry beam theory, combined with microseismic monitoring technology, extensive research has been conducted on mining-induced earthquakes under various geological and mining conditions. For instance, Dou et al. [11,12,13] investigated the fracturing behavior of sandstone key strata, which are critical rock layers with exceptional thickness and strength that govern overlying strata movement and surface subsidence. They observed that during the “O-X” fracturing stage, the probability of high-energy mining-induced earthquakes increases. Based on fracture patterns, they categorized overburden spatial structures into three types: the OX type, defined by rectangular-shaped fracture pattern with orthogonal cracks; the F type, marked by F-shaped distribution; and the T type, distinguished by T-shaped arrangement. These structural classifications were validated through seismic analysis. Jiang et al. [14,15] using microseismic monitoring to identified four overburden spatial structures. These included the supported θ type, which forms arc-shaped hinges; the unsupported O type, consisting of closed-loop fractures; the S type, exhibiting sinusoidal bending; and the C type, displaying circular arch-like deformation. Their research emphasized that dynamic structural changes significantly influence seismic and rockburst occurrences. Du et al. [16] monitored surface subsidence at Yingpanhao Coal Mine and found that under insufficient mining conditions, ultra-thick weakly cemented overburden exhibits small-magnitude but widespread subsidence with an asymmetric profile along the main cross-section. Wei et al. [17] studied the mechanisms of mining-induced earthquakes under multiple goaf conditions, including instability and shear sliding of the lower and upper sub-key layers, respectively, and ultimate fracturing of the main key stratum. Bai et al. [18] investigated mine-induced earthquakes under ultra-thick weakly cemented Jurassic coal seams in the Ordos mining area. Using multiple technical approaches, they revealed overburden fracturing mechanisms and seismic source characteristics, identifying tensile and shear rupture as the primary causes of seismicity at Shilawusu Coal Mine. Lv et al. [19] analyzed the mechanism of a static stress concentration-induced rockburst in a western coal mine roadway cluster. They proposed an ultra-long horizontal staged hydraulic fracturing technique, which weakens stress transfer by inducing plastic failure in thick-hard roofs, significantly reducing microseismic events. Zhang et al. [20] observed that during the “O-X” fracturing of hard heavy layer, both the frequency of high-energy mining-induced earthquakes and the rate of land Subsidence significantly increase. Zhai et al. [21] investigated the heavy conglomerate layer, which consists of densely packed conglomerate rock, focusing on its delamination and fracturing behavior. Their study revealed that both initial and periodic collapses of the upper and lower layers can induce high-energy mining-induced earthquakes. Yang et al. [22] proposed that the elastic energy released during the fracturing of heavy layer is the primary factor triggering high-energy mining-induced earthquakes. Zhang et al. [23] suggested that the cooperative fracturing movement of multiple key stratums in the roof leads to frequent strong mining-induced earthquakes during deep coal mining. Bai et al. [1] found that both the initial fracturing and periodic structural adjustments of heavy layer induce high-energy mining-induced earthquakes. Gao et al. [24] noted that mining-induced earthquakes is primarily driven by the bending deformation energy and rotational kinetic energy of hard heavy layer. Zhu et al. [25] discovered that the fracturing, rotation, and sliding instability of hard heavy key stratum induce mining-induced earthquakes, with those caused by overburden movement being the primary type in deep coal mining in China.
In China, many mines are affected by heavy layers. Notable examples include the Dongtan Coal Mine in Shandong Province, where a 180 m thick heavy layer overlies a working face; the Tengdong Coal Mine, also in Shandong, where a 90 m thick heavy layer is located 70 m above the coal seam; and the Qianqiu Coal Mine in Henan, where a 410 m thick heavy layer sits approximately 210 m above the coal roof. These mines commonly experience surface damage due to such geological conditions [5,6]. Heavy layers are characterized by resistance to fracturing and tendency to induce high-energy mining-induced earthquakes, resulting in differences in fracturing intervals compared to other hard rock layers. During their fracturing process, strong mining-induced earthquakes are frequently induced. In this paper, mining-induced earthquakes caused by the fracturing or movement of heavy layers is referred to as heavy layer-type mining-induced earthquakes. While the mechanisms of mining-induced earthquakes in the heavy layer are well understood, research on the surface damage induced by heavy layer-type mining-induced earthquakes remains incomplete. This study analyzes working faces overlain by heavy layers, taking the 7202 working face in the Zaozhuang mining area as a case study. In this case, an 80 m thick heavy layer exists at a vertical distance of 72 m above the coal seam. The research aims to develop a feasible engineering approach for mitigating surface damage in mining faces with similar geological conditions.
Building on previous research, this study focuses on surface damage induced by the movement of heavy layers and the associated heavy layer-type mining-induced earthquakes. Through field investigations of the geological information and microseismic data from the 7202 working face, a fracture mechanism analysis of the movement of heavy layer was conducted based on the medium thick plate theory, and the results were compared with on-site conditions. Numerical simulations using UDEC were performed with data monitoring to compare scenarios with and without mining-induced earthquakes, analyzing surface subsidence caused by the movement of heavy layer and mining-induced earthquakes, and revealing the mechanisms of surface damage caused by the movement of heavy layer and mining-induced earthquakes. Industrial tests were carried out to provide a replicable engineering solution for the prevention and control of mine-induced earthquakes and surface subsidence control in mining areas with thick overburden layers. Finally, the research conclusions provide important theoretical references and practical value for surface protection, and rock strata movement research and coal mine safety.
2. Methodology
This study, using theoretical analysis, UDEC numerical simulation, and industrial experiments, investigates the dynamic behavior of heavy layers and the mechanisms of surface damage induced by mining-induced earthquakes. The research route flowchart is schematized in Figure 1.
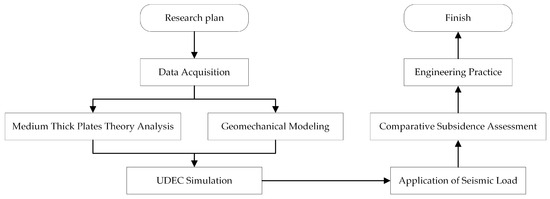
Figure 1.
Research route flowchart.
2.1. Geological Overview and Monitoring Data of Mining-Induced Earthquakes
2.1.1. Geological Overview
The 7202 working face in the Zaozhuang mining area is located in the No.7 mine district, which represents the seventh artificially delineated mining zone. Its northern boundary borders the 72 track dip roadway, a sloped passage designed for material transportation and ventilation. To the south, it is adjacent to the open-off cut, which is the initial coal seam boundary excavation, adjacent to the boundary of the coal seam. The eastern limit coincides with the coal field boundary, serving as the demarcation of mining rights, while the western side borders solid coal. The working face has an underground elevation in the range of approximately −751~−793 m. No mining activities are conducted in the surrounding areas. The working face takes a single longwall retreat mining method with full caving for goaf management. The mining process utilizes fully mechanized caving processes. The schematic diagram of the working face is shown in Figure 2.

Figure 2.
Schematic diagram of the 7202 working face.
The surface of the mining area is located approximately 1000 m east of the local village, with farmland covering the area. The ground elevation is +55.79 m. The cover depth of the 7202 working face is in the range of approximately 806.79–848.79 m.
The 7202 working face is situated in the No.3 lower coal seam, with a maximum thickness of 7.90 m. The coal seam has a dip angle ranging from 5~11°, with an average of 8°. The main roof of the working face consists of fine sandstone, with an average thickness of 11.68 m. The immediate floor is composed of mudstone, with an average thickness of 10.35 m. Above the coal seam lies a Jurassic heavy conglomerate layer, the length of which is approximately 80 m, characterized by its hard texture and high strength. This heavy conglomerate layer is located about 72 m above the coal seam. The lithology column of the working face is shown in Figure 3.
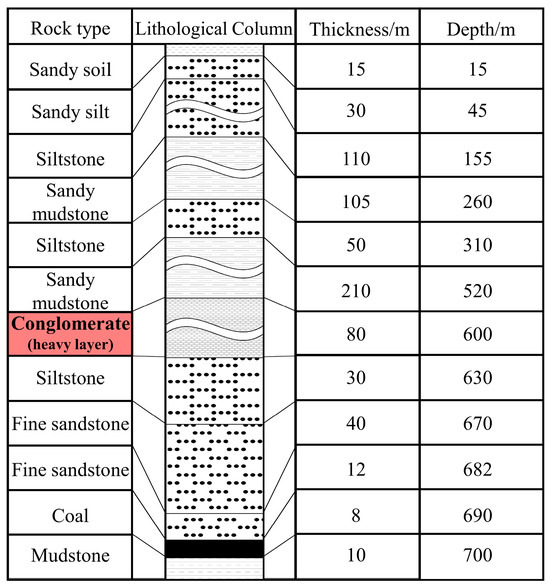
Figure 3.
Lithology column of the layers.
When the Jurassic conglomerate heavy layer undergoes fracturing movements, inducing high-energy mining-induced earthquakes, the thin surface layers above the mining area of the 7202 working face results in the slow attenuation of seismic waves, often leading to noticeable ground vibrations at the surface.
2.1.2. Monitoring Data of Mining-Induced Earthquakes
The mining operations of the 7202 working face began in June 2021 and concluded in August 2022. During this period, microseismic monitoring and statistical analysis recorded a total of 3193 mining-induced earthquakes. As shown in Table 1, mining-induced earthquakes in the 0~102 J energy range were rare and contributed minimal total energy. Mining-induced earthquakes in the 102~103 J range were the most frequent but still accounted for relatively low total energy. In the 103~105 J range, the frequency of mining-induced earthquakes decreased slightly, but this interval contributed the highest total energy. On 24 May 2022, at 21:46:08, the 7202 working face experienced its largest-energy recorded mining-induced earthquake, with an energy of 2.1 × 10⁵ J.

Table 1.
Statistics on mining-induced earthquakes in the 7202 working face.
In terms of energy distribution, low-energy mining-induced earthquakes (0–103 J) account for over 80% of occurrences, primarily corresponding to conventional strata movements such as immediate roof collapse and periodic fracturing of the main roof. Their spatial distribution exhibits a dense, scattered pattern, reflecting the progressive failure of shallow rock layers under mining-induced stress. In contrast, medium- and high-energy mining-induced earthquakes (103–105 J) constitute less than 20% of occurrences but contribute over 90% of the total energy. Their spatial distribution follows a distinct pattern: events of 103–105 J align in a banded formation along the strike of the working face. The highest energy seismic event had an epicenter approximately 227 m behind the working face, 180 m within the adjacent goaf roadway, and about 70 m above the working face, as illustrated in Figure 4.
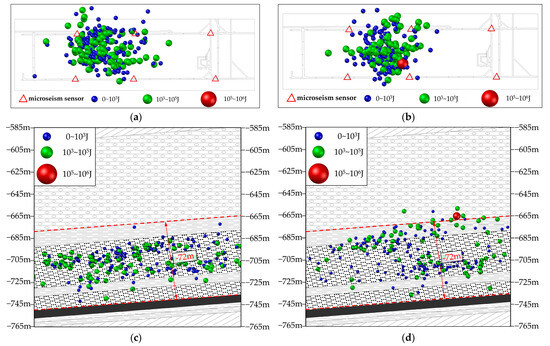
Figure 4.
Microseismic events distribution map: (a) planar distribution map for April 2022; (b) planar distribution map for May 2022; (c) cross-sectional distribution map for April 2022; (d) cross-sectional distribution map for May 2022.
2.2. Characteristics of Fracture and Movement in Heavy Layer
2.2.1. Mechanical Model of Heavy Layer Under Mining Influence
The 7202 working face is the first coal working face. Before mining-induced fractures extended into the heavy overlying layer, these layers were in a state of fixed support on all four sides. As mining progressed at the 7202 working face, the movement of the heavy layer led to fracturing, altering their boundary conditions to a state of fixed support on three sides and simple support on one side. For a detailed illustration, refer to Figure 5.
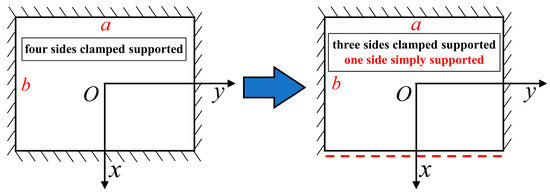
Figure 5.
Schematic of boundary condition changes in a heavy layer.
Currently, the “beam” theory and “plate” theory are primarily used to study the stability of overlying rock layer [20,21,22]. However, for the Zaozhuang deep Jurassic heavy conglomerate layer, the “beam” theory is no longer applicable. Instead, the “plate” theory is more suitable for analyzing the fracture behavior of heavy conglomerate layer, making it a more meaningful approach for this study.
This study focuses on the 80 m thick deep heavy conglomerate layer in Zaozhuang, considering the working face dip length of 200 m under mining conditions, resulting in a thickness-to-span ratio of 80/200 = 0.4. According to the medium thick plate theory, this ratio exceeds the 0.125–0.2 range, which defines the upper limit of thin plate theory applicability. Therefore, to ensure the accuracy and reliability of the results, the medium-thick layer theory is applied to analyze the fracture behavior of the Jurassic heavy conglomerate layer above the 7202 working face, taking into account practical conditions.
2.2.2. Fracture Patterns of Heavy Layer Induced by Mining
The Jurassic heavy conglomerate layer of the 7202 working face is simplified as a rectangular thick plate with orthotropic characteristics, the plate length of which is denoted by , the plate by b, and the plate thickness by h. A coordinate system is established based on the principal elastic directions, as shown in Figure 6. q represents the overburden load carried by the Jurassic heavy conglomerate layer. In this coordinate system, the open-off cut position of the 7202 working face is set at , and the advancing direction of the working face is aligned with the positive X-axis.
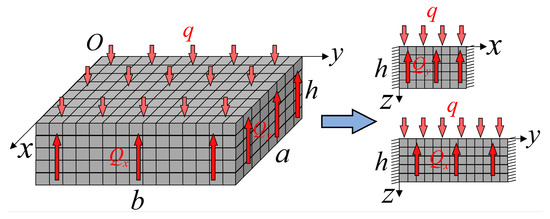
Figure 6.
Medium thick plate theory model for a heavy layer.
The geometric similarity hypothesis based on cross-sectional deformation includes the following four assumptions [26]:
- (1)
- The heavy layer is continuous, with negligible influence from faults or joint surfaces, exhibiting characteristics of an integral rock mass. The layer can be treated as a uniformly distributed, isotropic, perfectly elastic body.
- (2)
- The neutral plane of the heavy layer experiences no extension or contraction during bending deformation.
- (3)
- Planes perpendicular to the neutral plane before bending remain perpendicular throughout the deformation process and maintain their original shape, meaning the strain on the neutral plane remains zero after bending.
- (4)
- The heavy layer plays a dominant role above the coal seam, controlling other weak discrete layers. Therefore, the load acting on these strata can be analyzed and calculated using the key stratum theory.
The fundamental equation of the mechanical model for the Jurassic heavy layer is derived as shown in Equation (1).
Here, D represents the bending stiffness, calculated as ; q is the overburden load; w is the vertical deflection; μ is poison’s ratio; h is the thickness of the heavy layer; and Qx and Qy are the shear forces.
By solving the above equation, the general solution for the bending moment of the thick plate is obtained as shown in Equation (2).
Here, represents the parameter shown in Equation (3).
Here, represents the working face advance, and b represents the working face length. The coefficients and are defined. The functions , L1, K1, E1, F1, G1, H1, R1, S1, M1, and N1 are determined by the deep beam function. Under consistent boundary support conditions for the thick plate in the XY plane, the following relationships hold: , , , [27].
Based on the boundary conditions , the deep mode shape function is determined, as shown in Equation (4):
The functions A, B, C, and D are undetermined coefficients of the deep mode shape function. Due to the symmetry of the heavy layer in both x and y directions, the form of Y1 is identical to X1, with only the variable substituted from x to y. The deep beam mode shape functions X1 and Y1 are as shown in Equation (5):
Substituting Equation (5) into Equation (3) yields the following results: , , , , , . The expression for the bending moment of the thick plate can then be further expressed as shown in Equation (6):
Based on the boundary characteristics of the Jurassic heavy conglomerate layer [28], the maximum bending moment of the heavy conglomerate layer occurs at and , as shown in Equation (7).
The maximum tensile stress that the lower surface of the heavy conglomerate layer can withstand, as shown in Equation (8) [29]:
When the maximum tensile stress in the Jurassic heavy conglomerate layer equals the ultimate tensile strength, expressed as , the heavy layer fails. Combining this relationship with the above equation yields Equation (9):
The initial fracture of the Jurassic heavy conglomerate layer above the 7202 working face is influenced by several factors, including the overlying load (q), the tensile strength of the rock layer (), the fracture thickness of the overlying rock (h), and the length of the working face (b).
Based on the actual mining conditions and ground separation detection results in the area, the heavy conglomerate layer did not fracture entirely. Calculations show that the fracture thickness (h) is approximately 35 m, the working face length (b) is 200 m, the tensile strength is 4.62 MPa, and the overlying load (q) is 1.2949 MPa. Substituting these parameters into Formula (9), the initial fracture step distance of the Jurassic heavy conglomerate layer is calculated to be approximately 466.5 m. At this point, the working face had advanced 445.4 m from the starting point. The theoretical results align well with the actual mining environment and detection data. This indicates that the largest recorded strong mining-induced earthquake at the 7202 working face on 24 May 2022 was caused by the initial fracture of the Jurassic heavy conglomerate layer.
The fracture process of heavy layer involves phenomena such as initial rock fracture, continuous crack propagation, internal structural rotation, and structural sliding, all of which can potentially trigger heavy layer-type mining-induced earthquakes [30]. As shown in Figure 7a, during the initial fracture of the heavy layer, the internal units of the rock layer are subjected to triaxial stress, accumulating significant elastic energy, which results in a high-energy mining-induced earthquake. In Figure 7b, as cracks continue to develop, new fracture surfaces gradually form in the middle and upper sections of the heavy layer, also inducing mining-induced earthquakes. The fractures propagate upward until they reach the top of the rock stratum. Under mining-induced stress, when the articulated structures within the heavy layer undergo rotational or sliding instability (as shown in Figure 7c and Figure 7d, respectively), energy is released and transferred, triggering mining-induced earthquakes [22,23]. At this stage, the presence of fracture surfaces allows the rock units to be approximated as being in a biaxial stress state. Compared to triaxial stress, biaxial stress results in less accumulated elastic energy within the rock layer, leading to lower seismic energy release than during the initial rupture [24].
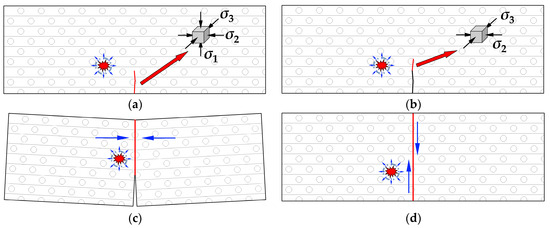
Figure 7.
Schematic of induced heavy layer-type mining-induced earthquakes: (a) initial fracture; (b) fracture propagation; (c) rotation; (d) sliding.
2.3. Model Construction and Simulation Scheme for Numerical Simulation
Using the discrete element numerical simulation software UDEC7.0, a specific case study was conducted to analyze the impact of heavy layer-type mining-induced earthquakes on surface damage.
2.3.1. Model Construction and Parameter Selection for Numerical Simulation
Using the 7202 working face as the research context, a corresponding model was constructed along the strike direction based on its geological data and coal seam columnar information. To simplify the modeling process and reduce computational complexity, the influence of working face support was not considered. Rock layer with similar mechanical properties or relatively small thicknesses were grouped together, resulting in 12 distinct groups. In the simulation, rock blocks were modeled using the Mohr–Coulomb model, while joints were simulated using the Coulomb slip model with surface contact. Detailed parameter settings can be found in Table 2.

Table 2.
Mechanical characteristic parameters of coal and rock mass.
2.3.2. Boundary Condition
By reserving a sufficient 450 m buffer zone on both sides of the mining area in the length direction, the model ensures adequate attenuation of stress waves and prevents boundary reflection interference. The model height covers the entire real stratigraphic overburden, including key top stratum and the heavy layer. The bottom boundary is fixed to simulate deep stratum constraints, while the top boundary is free to allow natural development of surface subsidence [31]. The following model boundary settings are thus adopted: the model constructed measures 1200 m in length and 700 m in height, comprising 12 layers of coal and rock; the gravitational acceleration (g) was set to 10 m/s2; and the model was iteratively calculated to achieve geostatic stress equilibrium, eliminating initial displacements caused by self-weight. Displacement constraints were applied to the left and right boundaries (x = 0 and x = 1200 m), where horizontal displacement was set to zero, ensuring that subsequent monitored displacement data only reflect deformations caused by mining. The bottom boundary (y = 0) was fixed in the vertical direction, while the top boundary was left free. The simulation model is illustrated in Figure 8.
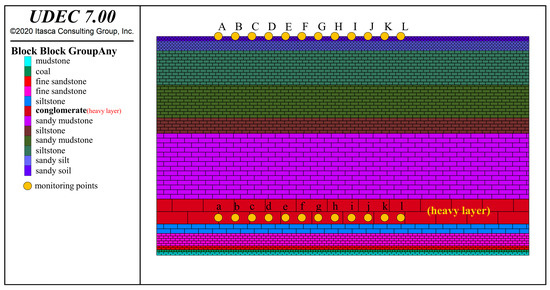
Figure 8.
UDEC numerical model.
2.3.3. Simulated Excavation Plan
The excavation procedure was carried out as follows:
The coal seam, with a mining height of 8 m, was excavated in 50 m increments from a starting point 450 m from the left boundary. After each excavation step, the model was allowed to reach equilibrium before proceeding to the next step. This cycle continued until the total excavation length reached 250 m. Throughout this process, joint and mesh parameters were optimized to minimize the deviation between simulated displacements and the model’s predefined displacements.
During the coal seam excavation, the dynamic movements of the sandy soil layer at the top of the model and the heavy conglomerate layer within the model were monitored, with a focus on the settlement of the sandy soil layer. A total of 12 displacement monitoring points were placed at 55 m intervals in both the sandy soil layer and the heavy conglomerate layer. Monitoring data were recorded using the history command, and the locations of the monitoring points are shown in Figure 8.
2.3.4. Application Plan for Seismic Stress Waves
After completing the numerical excavation simulation, a separation space was observed beneath the heavy conglomerate layer in the model, accompanied by bending deformation of the layer. A mining tremor stress wave was then applied to the midpoint of the bottom edge of the deformed section of the heavy layer.
He J measured and analyzed the various parameters of mining tremors with different energy levels [32], ultimately deriving the intrinsic relationship between the source frequency and energy of coal mining-induced earthquakes, as shown in Table 3.

Table 3.
Frequency range and energy data statistics of mining-induced earthquakes stress wave.
Using formula 10 for calculating longitudinal wave-induced stress from mining-induced earthquakes, the stress load corresponding to the actual seismic energy level was computed, as shown in Equation (10).
Here, represents the P-wave stress, is the peak vibration velocity of particles under P-wave disturbance, is the P-wave velocity, and ρ is the medium density. Based on field monitoring data from the coal mine, the measured P-wave velocity during seismic propagation is . Using the relationship between P-wave and S-wave velocities, , the S-wave velocity is calculated as .
During underground coal mining, the in situ stress increases with mining depth. When mining-induced seismic waves propagate through the coal and rock mass, the dynamic stress generated by the seismic waves overlaps and accumulates with the in situ stress, jointly triggering dynamic disasters in the mining area. In this simulation study, the seismic waveform was set as a half-sine wave, with a simulated seismic energy level ranging from 104~105 J. The seismic dynamic load was applied in velocity input mode, with a wave velocity of 2.76 m/s. The seismic duration was set to 1 s (equivalent to 5 cycles), and the applied load was 60 MPa.
3. Results
3.1. Subsidence Characteristics of Model Without Mining-Induced Earthquakes
The settlement cloud diagrams of the model without applied seismic stress waves are shown in Figure 9. Specifically, Figure 9a depicts the settlement during excavation from 450–600 m without seismic stress waves, Figure 9b shows the settlement during excavation from 600–650 m, Figure 9c illustrates the settlement during excavation from 650–700 m, and Figure 9d displays the settlement during excavation from 700–750 m, all without the application of seismic stress waves.
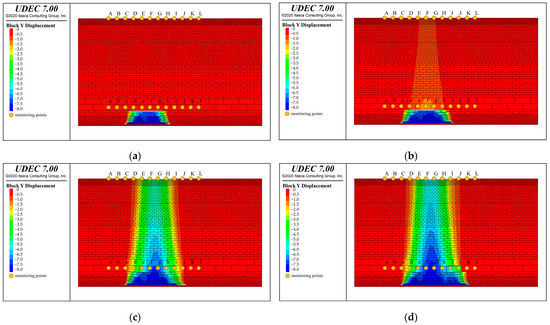
Figure 9.
Cloud diagrams of the model displacement induced without mining-induced earthquakes: (a) excavation of 450–600 m; (b) excavation of 600–650 m; (c) excavation of 650–700 m; (d) excavation of 700–750 m.
As shown in Table 4 and Figure 10, during excavation from 450–600 m, the mining impact was relatively minor, primarily affecting the rock layer beneath the heavy layer. The separation space below the heavy layer was small, and the heavy layer did not exhibit significant bending deformation, the impact on the top stratum was minimal.

Table 4.
Subsidence displacement of different strata at varying excavation distances.
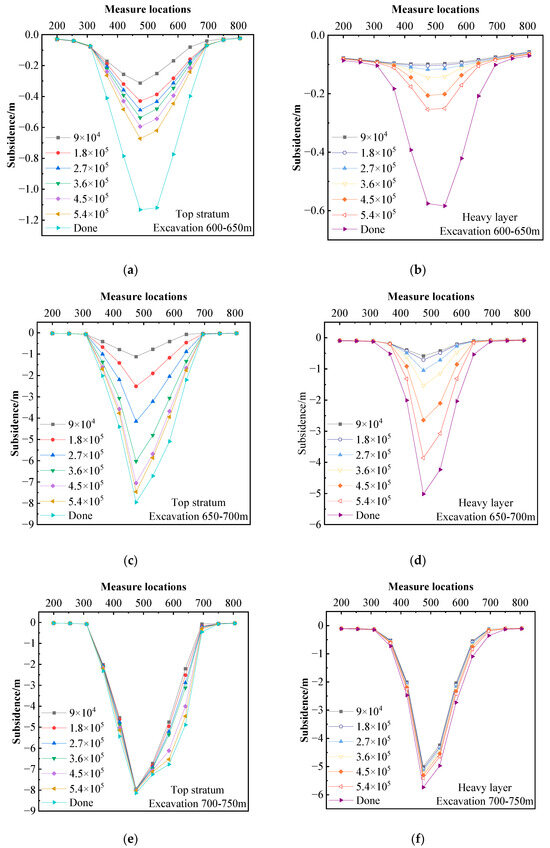
Figure 10.
Monitoring data of subsidence induced without mining-induced earthquakes: (a) subsidence of top stratum during 600–650 m excavation; (b) subsidence of heavy layer during 600–650 m excavation; (c) subsidence of top stratum during 650–700 m excavation; (d) subsidence of heavy layer during 650–700 m excavation; (e) subsidence of top stratum during 700–750 m excavation; (f) subsidence of heavy layer during 700–750 m excavation.
During excavation from 600–650 m, the separation space beneath the heavy layer began to expand, gradually approaching its fracture step distance. The heavy layer underwent bending deformation, causing slight settlement in the top stratum.
During excavation from 650–700 m, as the heavy layer was further excavated, reaching its fracture step distance, the heavy layer exhibited intense bending deformation. The top stratum experienced increased settlement, reaching the maximum settlement rate during this phase.
During excavation from 700–750 m, the heavy layer had already undergone significant settlement before this phase, coming into contact with the underlying rock layer. Continued excavation increased the settlement of the heavy layer, leading to further settlement of the top stratum, but at a reduced settlement rate.
3.2. Comparative Analysis of Subsidence Patterns with and Without Mining-Induced Earthquakes
The settlement cloud diagrams of the model with applied seismic stress waves are shown in Figure 11. Specifically, Figure 11a depicts the settlement during excavation from 600–650 m with seismic stress waves, Figure 11b shows the settlement during excavation from 650–700 m with seismic stress waves, and Figure 11c shows the settlement during excavation from 700–750 m with seismic stress waves.
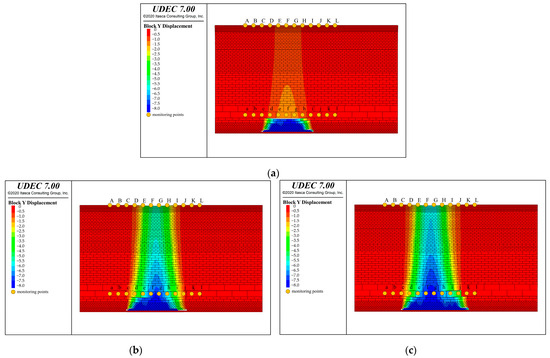
Figure 11.
Cloud diagrams of the model displacement induced without mining-induced earthquakes: (a) excavation of 600–650 m; (b) excavation of 650–700 m; (c) excavation of 650–700 m.
As shown in Table 5 compared to the simulation without applied seismic stress waves, the settlement of the heavy conglomerate layer and the top stratum in the model increased further. In order to quantitatively assess the impact of mining-induced earthquakes on subsidence displacement, a paired t-test was conducted on the displacement data of six simulation scenarios. The “subsidence with mining-induced earthquakes” and “subsidence without mining-induced earthquakes” were designated as Variable 1 and Variable 2, respectively. The results showed a t-statistic of 22.21 (df = 5) and a two-tailed p-value of 3.44 × 10⁻⁶. Clearly, since the p-value is much smaller than the conventional significance level of 0.05, this statistical evidence confirms that mining-induced earthquakes significantly increase subsidence displacement of top stratum and heavy layer. To some extent, the heavy layer-type mining-induced earthquakes exacerbated surface damage.

Table 5.
Subsidence displacement comparison with and without mining-induced earthquakes.
The displacement data from the monitoring points were processed, and the results are shown in Figure 12. The subsidence of the heavy layer caused by coal seam excavation exhibits a characteristic where the slope along the excavation direction initially increases and then decreases. The slope increases until the maximum subsidence is reached, leading to a similar settlement process in the top stratum, and the surface settlement is less than that of the heavy layer.
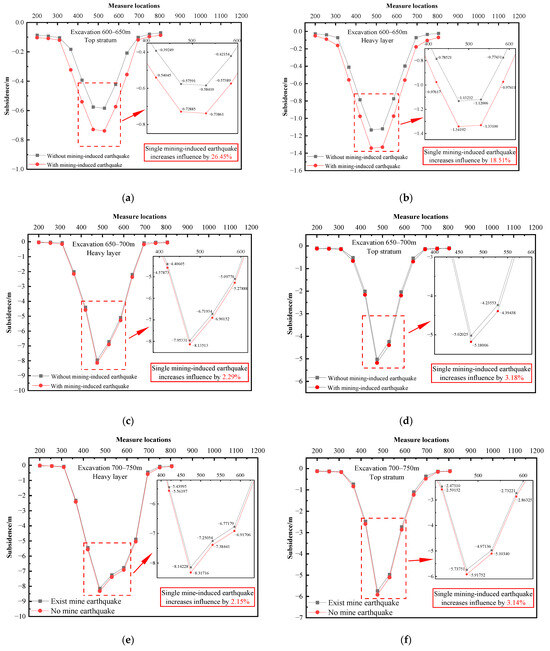
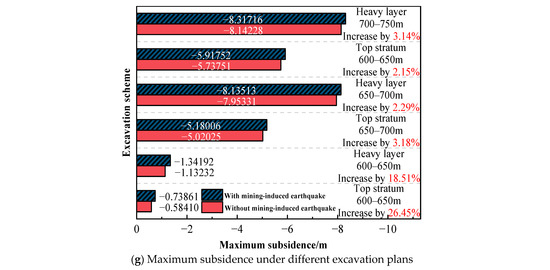
Figure 12.
Comparison of subsidence whether induced with mining-induced earthquakes: (a) comparison of top stratum during 600–650 m excavation; (b) comparison of heavy layer during 600–650 m excavation; (c) comparison of top stratum during 650–700 m excavation; (d) comparison of heavy layer during 650–700 m excavation; (e) comparison of top stratum during 700–750 m excavation; (f) comparison of heavy layer during 700–750 m excavation; (g) comparison of maximum subsidence under different excavation plans.
As shown in Figure 12a,b, during the 600–650m excavation stage, the heavy conglomerate layer remained intact, exhibiting only elastic bending deformation without fracture. Under non-mining-induced earthquakes conditions, both the top stratum and heavy layer showed minor subsidence, with maximum displacements of 0.5841 m and 1.13232 m, respectively. This subsidence resulted primarily from gradual bending of the heavy layer, with no visible fracturing. When subjected to mining-induced earthquake, localized settlement troughs developed, increasing maximum displacements to 0.73861 m and 1.34192 m, respectively, indicating seismic waves amplified bending deformation while maintaining structural integrity.
Figure 12c,d demonstrate that during 650–700 m excavation, the conglomerate strata fractured completely, causing catastrophic collapse of both the heavy layer and overlying weak strata. Maximum displacements surged to 5.02025 m (top stratum) and 7.95331 m (heavy layer). Mining-induced earthquakes further increased these values to 5.18006 m and 8.13513 m, respectively, confirming that seismic waves exacerbated fracture propagation while reducing overburden porosity.
As shown in Figure 12e,f, during 700–750 m excavation, the fractured heavy layer formed articulated rock blocks, stabilizing subsidence trends. Maximum displacements reached 5.73751 m (top stratum) and 8.14228 m (heavy layer), increasing marginally to 5.91752 m and 8.31716 m under mining-induced earthquake influence, showing continued porosity reduction in fractured zones.
Figure 12g systematically compares subsidence magnitudes across all stages, demonstrating consistent seismic amplification effects. The 600–650 m stage showed greater relative increases (26.45% top stratum; 18.51% heavy layer) before fracturing, while post-fracture stages exhibited smaller but persistent increases, revealing seismicity’s dual-phase impact: amplifying bending deformation in intact strata, and accelerating compaction in fractured zones.
From Figure 12, the following patterns can be observed:
- (1)
- In the process of surface damage induced by the movement of the heavy layer, the primary factor is the bending and fracturing of the heavy layer itself, while the heavy layer-type mining-induced earthquakes triggered by its movement play a secondary role.
- (2)
- Before the heavy layer undergoes fracturing, applying a single seismic event (defined as a simulated test event within our experimental setup) significantly increases the subsidence of both the heavy layer and the top stratum, with increases of 18.51% and 26.45% during excavation from 600 m to 650 m. After fracturing, applying a single seismic event causes a smaller increase in subsidence, with increases of 2.29% and 3.18% during excavation from 650 m to 700 m. This is because mining-induced earthquakes intensify movement of the heavy rock layer. During the heavy layer’s subsidence, rocks break and expand, increasing porosity. Mining-induced earthquakes compress these pores, increasing the density of broken rocks and leading to greater subsidence.
- (3)
- The subsidence of different positions in the heavy layer and the top stratum is affected differently by mining-induced earthquakes. After a seismic event, subsidence decreases progressively from directly above the epicenter to both sides, indicating that closer proximity to the epicenter results in higher compaction of loose rocks and more significant changes in subsidence.
4. Discussion
4.1. Engineering Practice
During the advancing of the initial working face in the No.7 mining district, a full-basin strike monitoring line was established on the ground directly above the starting cut of the 7202 working face, as shown in Figure 13. From 5 July 2021 to 15 February 2023, the working face underwent 11 elevation observations and 1 plane observation over a 21-month period. The monitoring results are presented in Figure 14.
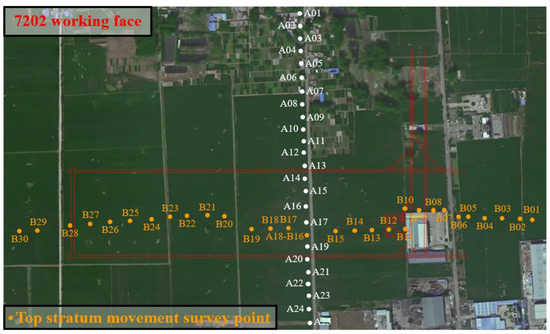
Figure 13.
Land subsidence strike monitoring line.
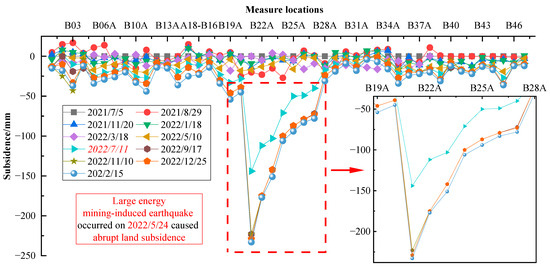
Figure 14.
Accumulative subsidence curve of land subsidence monitoring strike.
As shown in Figure 14, monitoring data from 10 May 2020 indicated only slight land subsidence. However, data from 11 July 2020, revealed significant land subsidence, with a substantial increase in the subsidence magnitude. This aligns with the timing of the high-energy mining-induced earthquakes on 24 May 2022, confirming the bending subsidence of the heavy layer and necessitating mitigation measures for the working face.
Monitoring results show that during the actual mining process, the frequency of high-energy microseismic events increased significantly when the working face advanced to approximately 450 m from the open cut. To address this, deep-hole roof pre-splitting blasting techniques was applied to the overlying rock layer. Drilling and blasting operations were conducted on the lower layer of the heavy layer to create the space required for its fracture and subsidence. The design and implementation of the blasting holes are illustrated in Figure 15. By blasting the multi-layered sandstone and mudstone between the heavy conglomerate layer and the working face, their bulking coefficient was significantly increased, ensuring sufficient subsidence to fill the goaf, as shown in Figure 16. This approach aims to reduce the length of the separation space and control its height, minimize the accumulated bending elastic energy within the heavy conglomerate layer, and ultimately decrease the frequency and intensity of mining-induced earthquakes caused by the fracture and bending subsidence of the heavy layer. This mitigates the negative impact of the heavy layer and mining-induced earthquakes on surface damage.
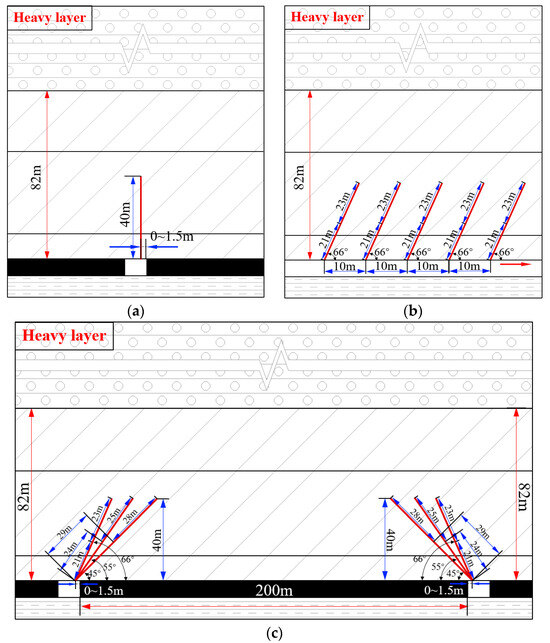
Figure 15.
Schematic diagram of blasting broken roof drilling section: (a) strike direction locations diagram; (b) cross-section along strike diagram; (c) boreholes cross-section along dip diagram.
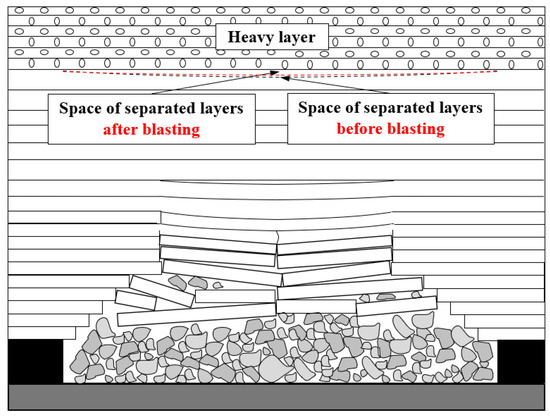
Figure 16.
Comparison of separation space before and after blasting.
As shown in Figure 17, the maximum cumulative subsidence point is B21A, with a total subsidence of 233 mm, and regional subsidence is observed at surface monitoring points B20~B28. This indicates that the Jurassic heavy conglomerate layer directly above the goaf has fractured. After implementing deep-hole roof pre-blasting, the lower rock layer deformed and fractured. Due to the bulking effect of the broken rocks, their expanded volume filled the separation space, reducing its size and mitigating the fracture and movement of the heavy layer. Microseismic monitoring results show that after blasting, mining tremor energy was mostly concentrated in the range of 102~103 J, with no further occurrence of high-energy mining-induced earthquakes. The land subsidence rate slowed significantly, effectively reducing the frequency and intensity of heavy layer-type mining-induced earthquakes. This achieved the goal of mitigating surface damage induced by mining-induced earthquakes.
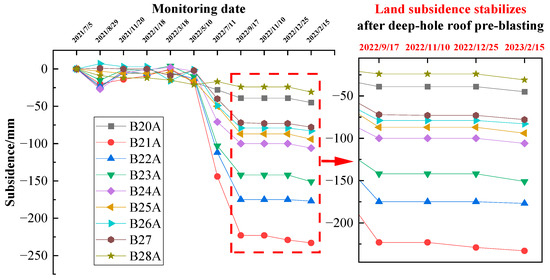
Figure 17.
Land subsidence strike monitoring line after blasting.
4.2. Mechanism of Amplification Effect of Mining-Induced Earthquakes on Surface Damage
4.2.1. Validation of Heavy Layer Fracture Mechanism and Seismic Energy Characteristics
The observed abrupt subsidence and heavy layer fracturing (Figure 9) align well with the key stratum theory proposed by Dou et al. [11,12,13], who identified elastic strain energy release during the “O-X” fracturing stage as the primary source of high-energy mining-induced earthquakes. This study further confirms, through microseismic monitoring, that the largest seismic energy reached 2.1 × 10⁵ J during the fracturing of the 7202 working face’s heavy layer (Table 1). This value is consistent with the energy magnitude (105–107 J) reported by Dou et al. [13]. However, beyond their static analysis of fracture patterns, this research reveals the dynamic accelerating effect of seismic waves on heavy layer movement via UDEC simulations. The simulations show that applying seismic waves increases heavy layer movement (Table 5), which correlates well with the observed post-seismic subsidence spikes (Figure 14), confirming the mechanism by which seismic activity promotes strata movement.
4.2.2. Quantification of Seismic Amplification Effects
While consistent with Zhang et al. [20] in finding a high spatial correlation between high-energy mining-induced earthquakes and maximum subsidence areas in deep coal mines, this study innovatively quantifies the amplification coefficients of seismic-induced subsidence. Through UDEC simulations, we propose a critical microscopic mechanism: seismic waves accelerate rock mass compaction by promoting movement and compressing pores in fractured rocks. This microscopic insight complements Zhang et al.’s [20] macroscale observations.
4.2.3. Innovation and Application of Engineering Control Technologies
Compared with Bai et al. [18], who focused on the seismic effects of weakly cemented heavy layer in the Ordos mining area, this study implemented deep-hole roof pre-blasting technology to reduce seismic frequency (Table 3) and mitigate surface damage. The innovation lies in simultaneously weakening strata stiffness and enhancing fractured rock integrity, which synergistically suppresses seismic energy release and dissipation. This provides a replicable engineering solution for mining-induced earthquakes control and subsidence mitigation in mines with heavy layer, extending Bai et al.’s [18] geologically focused analysis.
5. Conclusions
- (1)
- By applying the medium-thick layer theory to analyze the fracture movement of the heavy conglomerate layer overlying the 7202 working face, it was determined that the fracture movement of this heavy conglomerate layer is the driving force behind strong mining tremors. The analysis results align well with actual mining and detection data, confirming that the historically largest mining tremor event at the 7202 working face on 24 May 2022 was triggered by the initial fracture of the heavy conglomerate layer above the working face.
- (2)
- Numerical simulation studies reveal that during the surface damage induced by the movement of the heavy layer, the primary factor is the bending subsidence of the heavy layer itself, while the secondary factor is the heavy layer-type mining-induced earthquakes, which exacerbate surface damage by intensifying the movement of rock layer. As the heavy layer subsides, the rocks fracture and expand due to their bulking effect, increasing porosity. Mining-induced earthquakes compress these pores, enhancing the compactness of the broken rocks and increasing subsidence. After a mining-induced earthquake, the vertical displacement is most significant directly above the epicenter and decreases progressively toward the sides, indicating that the closer to the epicenter, the greater the impact.
- (3)
- Through field industrial trials, deep-hole roof pre-splitting blasting techniques was implemented at the 7202 working face of a mine in the Zaozhuang mining area, causing deformation and fracturing of the lower rock layer. Microseismic monitoring results show that after blasting, mining-induced earthquakes energy were mostly concentrated in the range of 101~103 J, with no further occurrence of high-energy mining-induced earthquakes. The land subsidence rate slowed significantly, effectively reducing the frequency and intensity of heavy layer-type mining-induced earthquakes. This achieved the goal of mitigating surface damage induced by mining mining-induced earthquakes, providing strong support for the smooth progression of mining operations.
- (4)
- Beyond the specific conditions of the 7202 working face, the coupling mechanism of heavy layer fracturing and mining-induced earthquakes identified in this study may exhibit scale-dependent variations in other mining scenarios. For instance, in mines with greater heavy layer thickness or deeper burial depths, the accumulated elastic energy during heavy layer fracturing could trigger higher-magnitude mining-induced earthquakes, potentially extending the surface damage range beyond the model-predicted values. Conversely, in shallow mining areas with thinner heavy layers, seismic energy may dissipate more rapidly, leading to reduced surface subsidence but increased risks of localized ground fissuring due to abrupt stress release.
Author Contributions
Conceptualization, Z.M. and J.J.; methodology, Z.M.; software, J.J. and J.C.; validation, M.S., J.Z. and C.J.; formal analysis, J.L.; investigation, J.J.; resources, Z.M.; data curation, J.C.; writing—original draft preparation, J.J.; writing—review and editing, Z.M.; visualization, Z.M.; supervision, Z.M.; project administration, Z.M.; funding acquisition, Z.M. All authors have read and agreed to the published version of the manuscript.
Funding
The authors gratefully acknowledge financial support for this work provided by the National Natural Science Foundation of China (52274147, 52227901, 52474270). We also extend our thanks to the financial support for this work provided by the National Key R&D Program of China (2024YFC3013802).
Institutional Review Board Statement
Not applicable.
Informed Consent Statement
Not applicable.
Data Availability Statement
The data used to support the findings of this study are available from the corresponding author upon request.
Acknowledgments
The authors would like to thank the peer reviewers and editors for their valuable comments and suggestions, which have greatly improved this manuscript presentation.
Conflicts of Interest
The authors declare no conflict of interest.
References
- Bai, X.; Cao, A.; Yang, Y.; Wang, C.; Liu, Y.; Zhao, Y.; Guo, W.; Gu, Y.; Wu, Z. Study on movement law of extremely thick strata and triggering mechanism of mine earthquakes. Coal Sci. Technol. 2023, 51, 10–20. [Google Scholar]
- Mu, Z.; Zhang, Z.; Zhang, X.; Gai, Y.; Zhuang, J.; Shi, M.; Dong, X. Stress evolution law of single and double roadway roof blasting in working face. Coal Eng. 2024, 56, 114–121. [Google Scholar]
- Dou, L.; Cao, J.; Cao, A.; Chai, Y.; Bai, J.; Kan, J. Research on types of coal mine tremor and propagation law of shock waves. Coal Sci. Technol. 2021, 49, 23–31. [Google Scholar]
- Zhuang, J.; Mu, Z.; Cai, W.; He, H.; Hosking, L.J.; Xi, G.; Jiao, B. Multistage hydraulic fracturing of a horizontal well for hard roof related coal burst control: Insights from numerical modelling to field application. Int. J. Min. Sci. Technol. 2024, 34, 1095–1114. [Google Scholar] [CrossRef]
- Zhang, S.; Zhang, C.; Xiu, J.; Guan, J.; Liu, Y.; Zhang, Z.; Dong, J.; Xiao, L.; Chen, C.; Li, W. Review of mine earthquake research. Prog. Geophys. 1993, 8, 69–85. [Google Scholar]
- Zhang, G.; Zhang, G.; Zhou, G.; Zhang, Z. Joint response of surface subsidence and strong mine earthquake under high-positioned and thick-hard strata in deep coal mine. Sci. Rep. 2025, 15, 1538. [Google Scholar] [CrossRef]
- Wang, L.; Zhang, Y.; Yang, L.; Wang, W. Land subsidence investigation of the steeply dipping coal seams in the Urumqi coalfield, China, using MT-InSAR technology based on the deformation model analysis. Geomat. Nat. Hazards Risk 2025, 16, 2479612. [Google Scholar] [CrossRef]
- Thakur, A.K.; Garg, R.D.; Jain, K. Land subsidence dynamics and its structural impact assessment over East Jharia, Jharkhand, India. J. Earth Syst. Sci. 2025, 134, 114. [Google Scholar] [CrossRef]
- Meng, Q. Study on ground effect of mine earthquake in Laohutai coal mine. Coal Mine Mod. 2021, 1, 129–132+136. [Google Scholar] [CrossRef]
- Cao, A.; Yang, Y.; He, H.; Yang, Y.; Bai, X.; Gu, Q.; Li, S.; Fu, X.; Gu, Y.; Wu, Z.; et al. Study on the rupture characteristics and stress-triggering mechanism of strong mine earthquake in huge thick strata. Coal Geol. Explor. 2024, 52, 1–13. [Google Scholar]
- Dou, L.; He, X.; He, H.; He, J.; Fan, J. Spatial structure evolution of overlying strata and inducing mechanism of rockburst in coal mine. Trans. Nonferrous Met. Soc. China 2014, 24, 1255–1261. [Google Scholar] [CrossRef]
- Dou, L.; He, H. Study of OX-F-T Spatial Structure Evolution of Overlying strata in Coal Mines. Chin. J. Rock Mech. Eng. 2012, 31, 453–460. [Google Scholar]
- He, H.; Dou, L.; Gong, S.; Zhou, P.; Xue, Z. Rock burst rules induced by cracking of overlying key stratum. Chin. J. Geotech. Eng. 2010, 32, 1260–1265. [Google Scholar]
- Jiang, F.; Zhang, X.; Yang, S.; Xun, L.; Ma, Q.; Wang, H. Discussion on Overlying Strata Spatial Structures of Longwall in Coal Mine. Chin. J. Rock Mech. Eng. 2006, 25, 979–984. [Google Scholar]
- Jiang, F. View point of Spatial Structures of Overlying Strata and Its Application in Coal Mine. J. Min. Saf. Eng. 2006, 23, 30–33. [Google Scholar]
- Du, Q.; Guo, G.; Zhang, L.; Li, H.; Zheng, H.; Meng, F.; Wei, T. Analyzing the surface subsidence pattern of deep mining in ecologically fragile areas of western China. KSCE J. Civ. Eng. 2025, 29, 100136. [Google Scholar] [CrossRef]
- Wei, D.; He, H.; Qin, Y.; Fan, J.; Zhou, P. Study on mechanism of mining tremor induced by key strata instability in the gob beside the working face. J. China Coal Soc. 2010, 35, 1957–1962. [Google Scholar]
- Bai, X.; Cao, A.; Wang, C.; Liu, Y.; Xue, C.; Yang, X.; Yang, Y.; Wang, S. The focal mechanism and field investigations of mining-induced earthquake by super-thick and weak cementation overburden strata fracturing. Geomech. Geophys. Geo-Energy Geo-Resour. 2025, 11, 7. [Google Scholar] [CrossRef]
- Lv, H.; Cheng, Z.; Xie, F.; Pan, J. Study on hydraulic fracturing prevention and control of rock burst in roof of deep extra-thick coal seam roadway group. Sci. Rep. 2024, 14, 29537. [Google Scholar] [CrossRef] [PubMed]
- Zhang, G.; Qu, Z.; Meng, X.; Ma, J.; Wang, C.; Wang, L.; Li, Z.; Wang, D.; Zhou, G. Study on mechanism and response of fracture and movement of the far-field high-position hard-and-hick stratum. Coal Sci. Technol. 2023, 51, 12–22. [Google Scholar]
- Zhai, X.; Zhao, X.; Zhai, Y.; Qian, H.; Liu, Q.; Ren, Z.; Guo, Z. Separation and fracturing mechanical models of overlying hugely-thick conglomerate stratum in fully mechanized caving mining and their application. J. China Univ. Min. Technol. 2023, 52, 241–254. [Google Scholar]
- Yang, Y.; Cao, A.; Bai, X.; Liu, Y.; Yan, Z.; Wang, C.; Wang, S.; Zhao, Y.; Gu, Y. Occurrence mechanism of strong mining tremors under mining near goaf in deep mine with extremely thick strata. Coal Sci. Technol. 2023, 51, 220–231. [Google Scholar]
- Zhang, Q.; Zou, J.; Wu, K.; Jiao, Y.; Wang, C.; Yan, X. On the characteristics of mine earthquakes induced by key strata breaking during deep mining. Chin. J. Rock Mech. Eng. 2023, 42, 1150–1161. [Google Scholar]
- Gao, M.; Xu, D.; He, Y.; Zhang, Z.; Yu, X. Investigation on the near-far field effect of rock burst subject to the breakage of thick and hard overburden. J. Min. Saf. Eng. 2022, 39, 215–226. [Google Scholar]
- Zhu, S.; Liu, J.; Jiang, F.; Shang, X.; Sun, X.; Zhang, X.; Song, D.; Zhang, M.; Wang, A.; Xie, H.; et al. Classification, prediction, prevention and control of roof movement-type mine earthquakes and induced disasters in China’s coal mines. J. China Coal Soc. 2022, 47, 807–816. [Google Scholar]
- Meng, X.; Li, Y.; Zhang, G.; Guo, L.; Li, W.; Shen, S.; Chen, M.; Zhou, G.; Lyu, K. Evolutionary laws of overburden structural movement under ultra-thick loose layers and uneven-thickness bedrock during mining. J. Min. Strat. Control Eng. 2024, 6, 115–129. [Google Scholar]
- Cao, D.; Liu, G.; Liang, W.; Hao, X.; Tian, L.; Xue, J. Control mechanism of surface settlement in mining face by high and thick conglomerate. Saf. Coal Mines 2024, 55, 141–150. [Google Scholar]
- Yang, S.; Wang, J.; Li, L. Deformation and fracture characteristics of key strata based on the medium thick plate theory. J. China Coal Soc. 2020, 45, 2718–2727. [Google Scholar]
- Wang, S.; Zhang, K.; Jiang, J.; Ji, S.; Pan, R. The fracture and rockburst laws of high-position hard and extremely thick red beds. J. Min. Saf. Eng. 2016, 33, 1116–1122. [Google Scholar]
- Dou, L.; Cao, J.; Cao, A.; Cai, W.; Gong, S.; Ju, M.; Zhou, K.; Kan, J. Key strata of mining-induced seismicity in overburden rocks in coal mines and the energy-releasing mechanism of its fracture. J. China Coal Soc. 2025, 50, 180–192. [Google Scholar]
- Zucca, M.; Crespi, P.; Tropeano, G.; Simoncelli, M. On the Influence of Shallow Underground Structures in the Evaluation of the Seismic Signals. Ing. Sismica 2021, 38, 23–35. [Google Scholar]
- He, J.; Dou, L.; Mu, Z.; Cao, A.; Gong, S. Numerical simulation study on hard-thick roof inducing rock burst in coal mine. J. Cent. South Univ. 2016, 23, 2314–2320. [Google Scholar] [CrossRef]
Disclaimer/Publisher’s Note: The statements, opinions and data contained in all publications are solely those of the individual author(s) and contributor(s) and not of MDPI and/or the editor(s). MDPI and/or the editor(s) disclaim responsibility for any injury to people or property resulting from any ideas, methods, instructions or products referred to in the content. |
© 2025 by the authors. Licensee MDPI, Basel, Switzerland. This article is an open access article distributed under the terms and conditions of the Creative Commons Attribution (CC BY) license (https://creativecommons.org/licenses/by/4.0/).