Abstract
This study aims to assess the spatial distribution and health risk potential of nitrate (NO3−) contamination in groundwater resources of the Harran Plain, a semi-arid agricultural region in Southeastern Türkiye. Groundwater samples were collected from 20 locations during pre- and post-irrigation periods and analyzed for a range of hydrochemical parameters. A probabilistic risk assessment framework, based on the U.S. Environmental Protection Agency (USEPA) guidelines, was employed to evaluate non-carcinogenic health risks across different demographic groups. The integration of Geographic Information Systems (GIS), multivariate statistical analyses, and Monte Carlo simulation enabled a comprehensive evaluation of exposure scenarios and contributing factors. This research contributes to the scientific understanding of groundwater vulnerability in intensively farmed areas, provides a decision-support framework for water quality management, and emphasizes the importance of protecting sensitive populations in nitrate-affected regions.
1. Introduction
The sustenance and advancement of the human population profoundly depend on the existence of fresh water, a vital resource. Groundwater functions as a widespread reservoir of potable water for a substantial segment of the population in multiple arid and semi-arid areas within developing countries. Thus, it becomes imperative to consistently guarantee its superior quality to safeguard the well-being of consumers. Groundwater, a valuable and renewable resource, possesses numerous inherent benefits when compared to surface water. Due to its minimal purification requirements, groundwater usage carries a notable risk of exposure to contaminants.
Nitrate (NO3−), a widespread pollutant in the subsurface environment, has been extensively studied by Bhatnagar and Sillanpää [1], Abascal et al. [2], and Gutiérrez et al. [3]. The contamination of NO3− in groundwater is primarily influenced by the presence of pollutant sources and regional environmental conditions. It enters the groundwater through various natural processes such as symbiotic relationships between plants and microbes, atmospheric depositions, and the presence of igneous rocks. activities, the expansion of nitrogen fertilizer utilization, inappropriate disposal of animal waste, and infiltration of wastewater from sewage and septic systems, all ascribed to human activities, have resulted in a noteworthy rise in the pollution of NO3− in groundwater in recent periods. This rise in NO3− pollution is a matter of growing global concern for both human health as highlighted by Ward et al. [4] and ecological well-being as emphasized by Romanelli et al. [5]. The World Health Organization [6] stipulates that the maximum permissible concentration of NO3− in water is 50 mg/L. Water beyond this threshold is advised against usage owing to health hazards. In applicable situations, a suitable treatment procedure must be employed. Nonetheless, the majority of individuals in the study region utilize untreated groundwater for drinking. Consequently, it is essential to assess the appropriateness of groundwater for potable use.
Nitrate risk in groundwater transpires in two ways. The initial step is the conversion of NO3− and nitrite (NO2−) salts to NO2−, which can change hemoglobin into red blood cells and then into methemoglobin. Consequently, drinking polluted water, consuming fruits, vegetables, or canned food at risk of contamination, and taking sodium nitrite directly by mouth can cause methemoglobinemia. In addition, infants exhibit less B5 reductase activity in their erythrocytes compared to adults; hence, the risk to newborns is significantly elevated. Secondly, NO2−, produced by the decrease in NO3− in the human body, can combine with secondary amines to generate nitrosamines, which may be carcinogenic. NO3− is water-soluble and tends to accumulate progressively, particularly in agricultural areas [7]. Consequently, high NO3− levels pose a significant threat to regional groundwater quality in countries such as Türkiye [8,9,10,11], Italy [12], Indonesia [13], Pakistan [14], Denmark [15], Iran [16], Korea [17], India [18], and China [19]. Panneerselvam et al. [20] assessed nitrate pollution and its effects on human health in the semi-arid southern region of India, identifying organic matter and leachate as the principal sources of groundwater contaminants. Chen et al. [21] delineated the hydrochemical characteristics of groundwater in urban Chongqing and assessed its water quality. Ramalingam et al. [22] assessed the effects of elevated nitrate levels in groundwater and elucidated that the primary source of these high nitrate concentrations is the application of synthetic fertilizers.
Southeast Türkiye’s semi-arid and dry regions mostly rely on groundwater for the production of drinking water. In areas with semi-arid and arid climates, like southeast Türkiye, groundwater serves as the primary source of drinking water production. Since irrigation was introduced in 1995, agriculture in the area has increased, greatly benefiting the region. But groundwater quality has also unexpectedly suffered as a result of agriculture’s improved production [8]. In agricultural areas, nitrate pollution in groundwater is becoming a bigger concern due to the quick spread of irrigation and rising usage of fertilizers [23].
The rural population living in the Harran Plain region obtains drinking water from shallow groundwater through wells using hand pumps. Despite groundwater being the principal source of drinking water in the research area, no risk assessment of groundwater quality has been conducted. This is regarded as a significant shortcoming. This study will illuminate the issue. In the light of all these data, the aims of the current study were (1) to determine the hydrochemical characterization of shallow groundwater in selected rural settlements, (2) to characterize NO3− concentration and spatial distribution, (3) to assess the non-carcinogenic human health risk of NO3− for different groups including children and adult females and adult males, with the risk assessment approach developed by the USEPA, and (4) to conduct statistical analyses and (5) prediction by optimization and simulation. The contribution of the findings of this study for future studies is expected to be to establish practical plans to improve the availability of drinking water in rural areas, promote resource and environmental sustainability, and provide realistic data for groundwater management.
2. Materials and Methods
2.1. Study Area
The Harran Plain represents the most extensive irrigation region in southeastern Türkiye, a nation possessing the biggest groundwater reserves in the Middle East. Figure 1 illustrates the location map of the study region. It is located between 36°42′–37°10′ N latitude and 38°50′–39°10′ E longitude. The watershed in the area is 3.700 km2, of which 1.500 km2 is the main plain. The research area obtains 463.6 mm of annual long-term mean precipitation, which is indicative of a semi-arid climate. The average annual temperature over the long period is 18.4 °C, and the evaporation is 1848 mm. The largest investment in the Turkish Republic’s history, two 26.4 km subterranean tunnels connected to the Atatürk Dam, were completed before agricultural regions were irrigated.
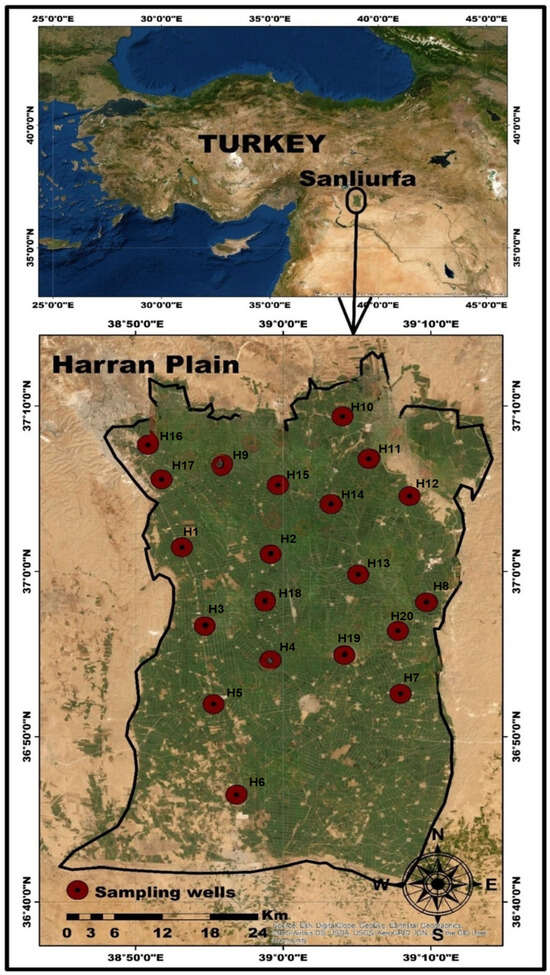
Figure 1.
Location and distribution of groundwater sampling points in the study area.
2.2. Geology and Hydrogeology
The Harran Plain is defined by an alluvial aquifer system comprising mostly Quaternary-age unconsolidated sediments including gravel, sand, silt, and clay. Depending on seasonal and topographic conditions, this unconfined aquifer is quite permeable with varied depths to groundwater ranging from 2 to 30 m. In the wells having homogeneous dimensioning and high gravel ratio, the particular flow rate is 1.3 L/s/m. The specific flow rate in wells having a high clay–silt ratio is 0.15 L/s/m. Particularly from agricultural return flows and insufficient wastewater disposal, the shallow water table and lack of a protective layer increase the vulnerability of the aquifer to surface-derived pollution [8]. Moreover, seriously compromising groundwater quality are the flat topography and heavy irrigation techniques that enable agrochemicals to be absorbed. These hydrogeological elements underline the necessity of continuous land-use control and observation in the region to minimize possible pollution.
2.3. Methods
2.3.1. Observation and Determination of Water Quality Parameters
Groundwater samples were taken from observation wells selected from 20 different locations to determine NO3− concentration in Harran Plain. These observation wells were chosen primarily because they are situated in the shallow aquifer and as a result are susceptible. They are also near to fields of crops. In the current study, nitrate analyses were carried out in March and October of 2023. Because of the irrigation system in the Harran Plain, the months of October (post-irrigation) and mid-March (pre-irrigation) were chosen for the sample periods. Agriculture is the main industry in this area from mid-March until October. Mid-March is when the sowing procedures for corn and cotton are applied. One-liter samples were gathered in high-density polyethylene bottles. Before use, the sample container was distilled using water and washed two to three times using HNO3 acid. The standard protocol was followed during sample collection, including pumping the boreholes for five to ten minutes to prevent the effect of accumulated water in the pipeline. The samples gathered were moved to the lab and kept at 4 °C until examined [24]. A total of 40 samples were collected in the pre- and post-irrigation period. The same sample was analyzed three times. The samples were homogenous and filtered (0.45 µm) before analysis. All analyses were performed on the same instrument and under the same conditions. Apart from NO3− analyses, other water quality indicators such as electrical conductivity, TDS, pH, temperature, Na+, K+, Mg2+, Ca2+, F−, Cl−, and SO42− were also investigated. The mean depth of the wells is roughly 10 m. The pH, conductivity, and temperature values of the observation wells were measured using a HACH LANGE HQ40D (HACH COMPANY, Düsseldorf, Germany) portable instrument, while other data were analyzed in the laboratory. The anion, cation, and NO3− analyses were performed by ion chromatography in accordance with the requirements outlined in the Standard Methods for the Examination of Water and Wastewater [25]. All the analyses were carried out as a service procurement at Harran University Research Center for Science and Technology (HUBTAM).
2.3.2. Multivariate Statistical Analysis
Pearson correlation analysis was performed to analyze the linear relationships between different groundwater quality parameters. The results were interpreted using Origin Pro (2019b) and IBM SPSS Statistics (Version 21), with the aim of identifying potential sources of contamination. Furthermore, hierarchical cluster analysis (HCA) was conducted using Ward’s linkage and the average distance method to classify samples with similar hydrochemical characteristics. Principal component analysis (PCA) was subsequently performed to determine the major underlying factors contributing to the overall chemical variability of groundwater.
2.3.3. Health Risk Assessment Procedure
Evaluations of groundwater quality and environmental management need the help of health risk assessments. In this study, a four-stage risk assessment process comprising hazard identification, dose–response assessment, exposure assessment, and risk characterization was implemented for the health risk evaluation of groundwater nitrate contamination (Figure 2).
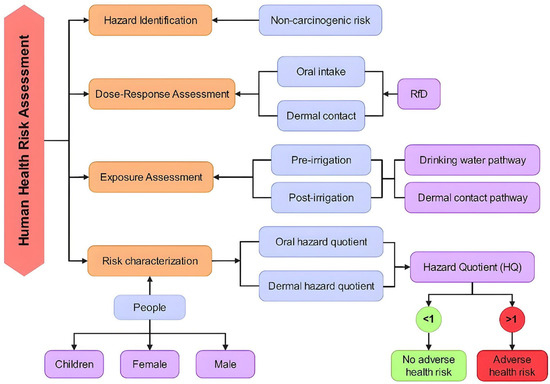
Figure 2.
Framework of the four-stage HHRA process.
Human health risk assessment due to NO3− contamination in groundwater is based on standards recommended by USEPA [26]. Drinking water contaminated with NO3− can have an impact on human health through ingestion and dermal exposure. The health risk assessment was performed on three exposed groups, namely children, adult females, and adult males. The non-carcinogenic health risk model from ingestion (oral intake/drinking water consumption) and dermal contact routes is computed utilizing the subsequent formulas [24].
The calculated chronic daily intake (CDI), expressed in mg/kg day, is the amount of nitrate that is ingested and dermally absorbed; CPW denotes the nitrate content in drinking water (mg/L); IR represents the water ingestion rate in L/day; ED and EF indicate the exposure length (years) and exposure frequency, respectively, with ED values of 64, 67, and 12 for adult males, adult females, and children, respectively. EF is designated for 365 days annually. ABW and AET denote, respectively, the average body weight (kg) and average exposure time (days), with ABW values of 65 kg for adult males, 55 kg for adult females, and 15 kg for children. The contact duration (TC) is quantified in hours per day, with a value of 0.4 h per day for both children and adults (females and males). The characteristics of dermal adsorption are represented by EV (times/day: 1 bathing session per day), Ki (cm/h: 0.001 cm/h), and SSA (skin surface area). The SSA values in this study are 12,000 cm2 for children and 16,600 cm2 for adults. In the research area, the conversion factor (CF) for adults and children is set at 0.001. RfD stands for reference dosage, and based on the USEPA, the RfD value for NO3− is 1.6 mg/kg/day. However, because of ingested nitrate pollution, groundwater samples exhibiting total hazard quotient (THQ) values more than 1 (THQ > 1) may be seriously dangerous to human health [24,27]. The formulas for calculating the CDI, DAD, and THQ were developed separately for the threats to human health that are evaluated during the wet and dry seasons.
2.3.4. Monte Carlo Simulation (MCS) and Sensitivity Analysis (SA)
The Monte Carlo simulation (MCS) and sensitivity analysis (SA) was utilized to examine the uncertainty in the data. The Oracle Crystal Ball (version 11.1.2.4.850) is an intuitive software application utilized for conducting MCS and SA. The impact of each parameter on the projected risk varies in this method based on how each parameter is distributed. The Crystal Ball is an Excel ribbon that evaluates the influence of parameter distribution on risk calculation and the estimation of health-related risks. The Crystal Ball software was employed in this investigation with 20,000 independent iterations and a 95% confidence interval.
2.3.5. Mapping
All maps are produced using Arc GIS. V 10.3. The inverse distance weightage (IDW) approach, which is utilized for spatial modeling and determining the geographical distribution of groundwater-quality characteristics, was used to interpolations [28].
3. Results and Discussion
3.1. Groundwater Hydrochemistry Assessment
Thirteen water quality measures were statistically examined in order to have a better knowledge of the fundamental chemical properties of groundwater for both pre-irrigation and post-irrigation periods. The results are displayed in Table 1. The drinking water quality limitations for these water quality measures are also listed in Table 1 [6].

Table 1.
Statistical overview of the chemical compositions of groundwater in the research area.
One of the most crucial factors determining the quality of drinking water is pH. Water corrosion is caused by low pH levels, while high pH levels negatively impact human skin and eye health as well as water taste [29,30]. The research region’s values of pH ranged from 7.00 to 7.70 and 6.71 to 7.79, with averages of 7.40 and 7.34 during the pre-irrigation and post-irrigation periods, respectively. These results suggest that the water quality in the area is alkaline. It was observed that the pH values measured in both periods were close to each other. The pH range that the WHO recommends (6.5–8.5) is still met by all of the samples. The amount of dissolved particles in the water directly affects the electrical conductivity (EC) of the water [31]. The EC concentrations of the samples varied between 484 and 3090 μS/cm during the pre-irrigation period, possessing an average of 977.40 μS/cm, and between 483 and 3833.63 μS/cm during the post-irrigation period, with a mean of 1105.13 μS/cm (Table 1). Total dissolved solids (TDS) are a unit of measurement used to describe the total quantity of salt solubilized in water. While very high TDS can also be caused by chemical fertilizers, residential wastewater, and irrigation return flows, it generally denotes the extent of rock–water interactions [32,33]. In both irrigation periods, TDS values vary from 314.60 to 2008.50 and 313.95 to 2491.86 mg/L, with means of 635.31 and 718.3 mg/L, respectively. The current study presents the regional distributions of analytical cations and anions during both periods, as illustrated in Figure 3 and Figure 4.
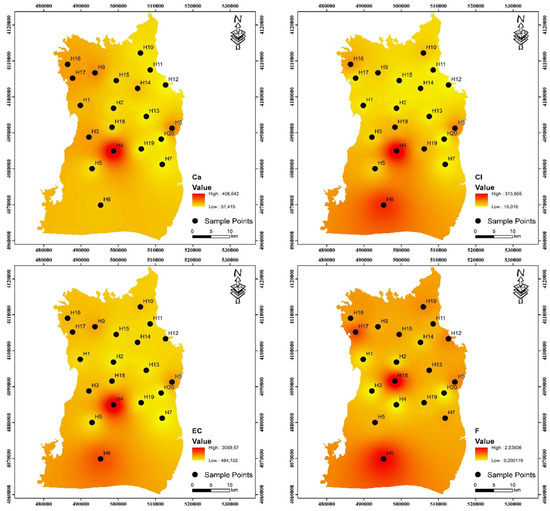
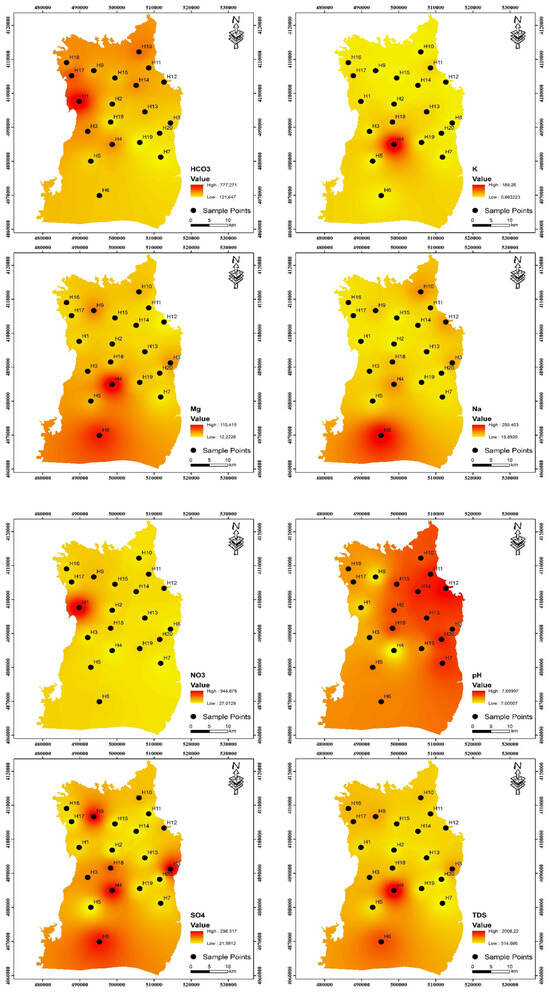
Figure 3.
Spatial distributions of analytical cations and anions for pre-irrigation period in the study area.

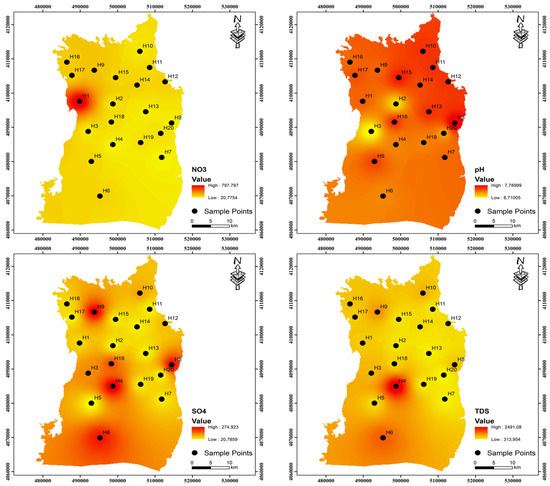
Figure 4.
Spatial distributions of analytical cations and anions for post‒irrigation period in the study area.
The hierarchy of cation prevalence in groundwater on Harran Plain is Ca2+ > Na+ > Mg2+ > K+, based on their average concentrations for both periods. One of the most prevalent cation ions in the groundwater of the area under study is sodium. In general, fertilizer use and the weathering of minerals like feldspar are the most frequent sources of Na+ in the research area [34,35]. Within the study area, the Na+ content varied between 15.89 and 295.41 mg/L, with a mean of 65.60 mg/L during the pre-irrigation period and 12.58 to 230.89 mg/L with a mean of 54.71 mg/L during the post-irrigation period (Table 2). In the groundwater of the research region, Ca2+ is the most prevalent cation ion next to Na+. Within the research region, the average calcium concentration was 123.59 mg/L during the pre-irrigation period, ranging from 57.40 to 408.60 mg/L, and 124.14 mg/L during the post-irrigation period, ranging from 52.56 to 502.31 mg/L. The permissible level of 100 mg/L for drinking water is exceeded at two sample stations during the pre- and post-irrigation periods [6]. One element that is frequently present in the environment is magnesium. Mg2+ concentrations were found to range between 12.22 and 115.43 mg/L during the pre-irrigation period, with a mean of 35.76 mg/L, and 13.20 and 105.09 mg/L during the post-irrigation period, with a mean of 31.67 mg/L. In this investigation, K+ is far less concentrated than Na+. This may result from K+’s propensity to be reabsorbed throughout groundwater circulation [36]. In the pre- and post-irrigations, it ranges from 0.66 to 189.35 and 0.53 to 161.21 mg/L, respectively.
Table 2.
The non-carcinogenic risk of HHRA outcomes from drinking water consumption and dermal exposure.
In this region, anions predominate in the groundwater as HCO3− > SO42− > Cl− > F− throughout both the pre- and post-irrigation periods. HCO3− levels in pre- and post-irrigation periods ranged from 121.64 to 777.44 and 131.33 to 406.58 mg/L, respectively, with mean values of 308.74 and 281.82 mg/L in the groundwater samples. The dissolution of carbonate minerals from lithological units is the main source of HCO3− in groundwater. The main sources of sulphate are human activity, fertilizers containing sulphate, and atmospheric deposition [37,38]. The concentrations of SO42− were from 21.59 to 298.38 mg/L during the pre-irrigation period and 20.76 to 275.00 mg/L in the post-irrigation period, with mean values of 103.05 and 97.42 mg/L, respectively. Sulphate has a maximum allowable level of 250 mg/L. Four sampling points during the pre-irrigation phase and two sampling points during the post-irrigation period, respectively, do not reach the necessary limit. Sewage waste pollution could be the cause of the elevated Cl− values observed in groundwater [39]. Cl− concentrations were measured in the pre- and post-irrigation periods, ranging from 15.00 to 314.00 and 16.00 to 342.00 mg/L, with mean values of 75.83 and 71.94 mg/L, respectively. According to WHO guidelines, the content of fluoride in groundwater should not be more than 1.5 mg/L. Fluoride is a necessary trace element for human health. If it goes over this threshold, people may develop thyroid illness or dental and skeletal fluorosis [35]. In the Harran Plain, the fluoride concentrations varied from 0.20 to 2.84 mg/L, with a mean of 0.99 mg/L during the pre-irrigation period, and from 0.15 to 2.05 mg/L, with a mean of 0.79 mg/L in the post-irrigation period. Both pre- and post-irrigation periods exhibit two observation points exceeding 1.5 mg/L.
Table 1 indicates that there is no substantial variation in the ion sequences estimated from the mean concentrations of ions in the two periods. The cations are Ca2+ > Na+ > Mg2+ > K+, while the anions are HCO3− > SO42− > Cl− > F− in both periods. It suggests that the hydrochemical processes and the hydrogeological environment in the research region are mostly unchanged between the two periods [40]. Pre-irrigation mean values for Na+, Mg2+, K+, HCO3−, Cl−, SO42+, and F− are marginally higher than post-irrigation means values. The predominant anions and cations were HCO3− and Ca2+, respectively. The groundwater sample in the Harran Plain was represented by the Piper tringle diagram in this instance, and it was identified as the hydrochemical classification of Ca-HCO3 (Figure 5). Elevated levels of Cl−, Na+, and SO42− were also observed in wells H4, H6, and H8, suggesting anthropogenic or geogenic contamination. Conversely, NH4+ concentrations remained low across all samples, indicating minimal recent organic pollution.
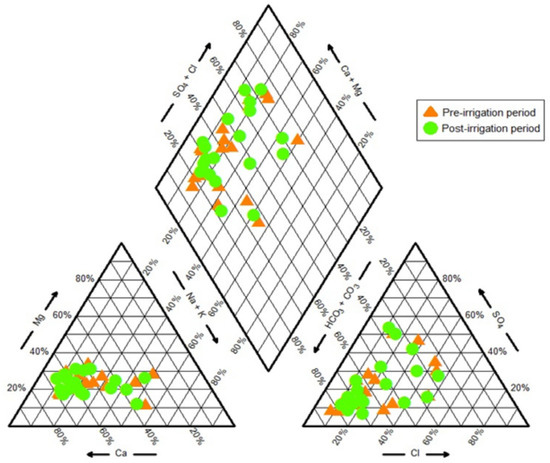
Figure 5.
Piper trilinear diagram for groundwater samples for both periods.
3.2. Statistical Analysis
The objective was to identify contamination signatures, assess geochemical influences, and explore relationships among parameters using statistical and machine learning methods. Such temporal evaluations are vital for understanding anthropogenic influences, particularly those stemming from agricultural practices. The analysis draws upon multivariate statistical techniques, including correlation matrices, principal component analysis (PCA), hierarchical clustering (HCA), and visual exploration through PCA projections and dendrograms (Figure 6).
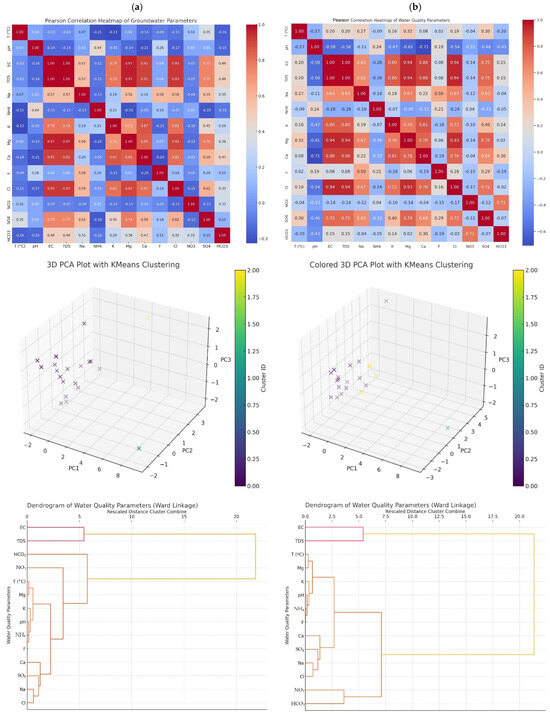
Figure 6.
Multivariate statistical comparison of groundwater quality parameters pre- (a) and post- (b) irrigation periods.
In Figure 6a, the left panel displays the Pearson correlation heatmap showing strong linear relationships, particularly between EC–TDS and Na+–Cl−. The center panel illustrates a 3D PCA plot revealing the clustering of wells based on similar hydrochemical signatures. The right panel shows a dendrogram based on hierarchical clustering (Ward linkage) of water quality parameters, highlighting close associations such as EC–TDS and Ca2+–HCO3−. As seen in Figure 6b, the correlation heatmap on the left shows noticeable shifts in inter-parameter relationships, especially increased correlation between NO3− and Cl−, likely due to agricultural return flows. The 3D PCA scatter plot in the middle captures altered well groupings, suggesting seasonal shifts in groundwater chemistry. The rightmost dendrogram reflects changes in parameter clustering patterns, with anthropogenic indicators such as NO3− and K+ becoming more dominant in cluster formation.
Correlation heatmaps provide an effective exploratory tool for visualizing interdependencies among hydrochemical parameters. In this study, both pre- and post-irrigation datasets revealed strong linear associations, most notably between EC and TDS (r ≈ 1.0), which is expected due to their mutual reliance on dissolved ion concentrations. This relationship is well-documented in groundwater studies by Qiu et al. [41] and Badeenezhad et al. [42], where EC served as a composite indicator of ionic pollution and mineral dissolution. Moreover, the correlation between Na+ and Cl− consistently remained high across both sampling periods, suggesting common salinization sources, including the infiltration of irrigation return flows and possible seawater intrusion in coastal aquifers [43]. Similarly, the Ca2+–HCO3− pair exhibited strong correlation, indicating carbonate weathering, a natural geogenic process that remained stable across both periods, as also observed by Jalali et al. [44] Of particular interest was the evolving correlation pattern between NO3− and Cl−. Pre-irrigation data showed only moderate correlation, whereas post-irrigation patterns revealed a stronger association. This shift may suggest increased agricultural influence during the irrigation season, with nitrate and chloride acting as co-indicators of fertilizer application and septic leaching, as reported in studies by Ibrahim et al. [45] and Feng et al. [46].
Principal component analysis, widely regarded as a dimensionality reduction technique, allowed for effective extraction of dominant geochemical signatures from multivariate data. In both datasets, the first principal component (PC1) accounted for the largest proportion of total variance and was primarily governed by salinity-related parameters—EC, TDS, and Na+. This finding echo results by Gad et al. [47] and Wang et al. [19], where PC1 reflected overall ionic strength and anthropogenic impact. A key strength of PCA is its ability to expose latent structures. In the post-irrigation dataset, PC2 and PC3 began to emphasize nutrient-related variables such as NO3− and K+, indicating intensified agrochemical inputs. This aligns with conclusions by Ravikumar and Somashekar [48], who observed a shift in principal component structure due to seasonal variations in fertilizer use and groundwater recharge patterns. The loading scores from PCA in this study also support a clear interpretation: parameters like Cl−, SO42−, and Na+ co-loaded on PC1, reflecting salinity and potential anthropogenic sources, while parameters like NH4+, F−, and K+ became more influential in subsequent components, particularly during the post-irrigation period. This evolution demonstrates PCA’s power in distinguishing between geogenic and seasonal human impacts.
The combined application of heatmap analysis and PCA has proven to be a robust approach for understanding the complexity of groundwater systems. These techniques not only reduce multicollinearity but also enable clearer identification of underlying processes, making them essential tools in water resource monitoring and management frameworks.
3.3. Nitrate Concentration Assessment
Groundwater nitrate contamination has emerged as a critical concern impacting both human health and groundwater quality in recent years [11,49]. One of the main contaminants is NO3−, which is mostly found in industrial and agricultural wastewater that has high nitrogen concentrations.
In the pre-irrigation period, the lowest and highest values of NO3− concentrations in groundwater were 27‒945 mg/L and the average value was 138.80 mg/L, respectively. In the post-irrigation period, the lowest and highest values of NO3− concentrations in groundwater were 20.77 and 797.94 mg/L, respectively, with an average value of 113.56 m/L. As can be seen from the data obtained, a decrease in nitrate concentrations was observed in the post-irrigation period. This situation is directly related to the irrigation carried out in certain periods in the region. With the effect of irrigation, there has been a dilution in pollutant concentrations in groundwater. In this study area, 17 and 15 out of 20 groundwater samples in both irrigation periods, respectively, exceeded the maximum acceptable limit of 50 mg/L and are not suitable for drinking purposes. In the pre-irrigation and post-irrigation periods, 85% and 75% of the average nitrate concentration values of the water samples taken surpassed the required value for drinking water (NO3−, 50 mg/L), respectively. Considering the areal distribution results, it was observed that especially the western and northwestern parts of Harran Plain had the highest concentrations in terms of NO3− distribution. It has been speculated that high NO3− concentrations may be due to human activities, particularly excessive use of chemical fertilizers in agriculture. It indicates that children face greater health hazards from nitrate exposure than adults.
Furthermore, it is recommended that nitrogen fertilizer application be judiciously regulated, whilst also limiting overuse, in view of the fact that agricultural practices such as this significantly contribute to elevated nitrate levels in the groundwater of cultivated land. Moreover, given that animal manure leaching is a significant contributor to nitrate pollution in groundwater, it is recommended to implement regulations on local husbandry practices, adopt rational approaches to managing the disposal of animal waste and faces, and eliminate unreasonable discharge patterns.
3.4. Health Risk Assessment
Humans who drink water containing high levels of NO3− for extended periods of time without taking any protective measures may be exposed to grave health risks. On the other hand, children and newborns are more vulnerable to NO3− poisoning by drinking water. Humans are more at risk from direct intake of NO3− through food or drinking water than from other exposure pathways.
In the non-carcinogenic health risk assessment, the effect of oral intake is much exceeding that of dermal contact. The total hazard coefficient values varied from 0.65 to 22.72 for adult males, 0.77 to 26.85 for adult females, and 0.88 to 30.71 for children during the pre-irrigation period. Post-irrigation, total hazard coefficient values varied from 0.50 to 19.18 for adult males, 0.59 to 22.67 for adult females, and 0.68 to 25.93 for adult children (Table 2). The elevated health risks for both adults and children during the pre-irrigation era, compared to the post-irrigation period, suggest that irrigation water significantly contributes to groundwater recharge in the research area. The results of the HRA indicate that children in the study area are more exposed to non-carcinogenic health risks of nitrate than adult males and females. Moreover, adult males have greater susceptibility than adult females in polluted drinking environments. In short, the non-carcinogenic HHRA among various population groups is ranked as follows: children > adult males > adult females. The fact that children have a lower body weight than adults may be considered as a reason for the increased risk for this group.
The health hazards related to NO3− exposure to groundwater, particularly for children, are a growing concern in public health research. Children are particularly vulnerable to the adverse effects of nitrate due to their physiological characteristics and developmental stages.
Regional maps created with GIS software showed the spatial distributions of non-carcinogenic human health risks. The consequences of non-carcinogenic health risks are illustrated in Figure 7 and Figure 8. The findings indicate that the total non-carcinogenic risks for both children and adults predominantly arise in the western region of the research area. The areas exhibiting the greatest hazards throughout both periods were located adjacent to the fertilizer manufacturing facility, signifying that the fertilizer manufacturing facility poses the most significant harm to human health in the study region. The north of the research region has a lower population and greater agricultural land, whereas the southern section has a higher population and increased population density. The elevated risk in the south is also associated with human activity. Residents utilizing water at these locations must seek an alternative water source to meet their domestic requirements and mitigate health hazards associated with NO3− contamination. This study attributes NO3− pollution to agricultural activity. In the future, specific interventions for the human health concerns associated with NO3− will concentrate on enhancing agricultural practices, such as minimizing nitrogenous fertilizer usage and altering irrigation methods.
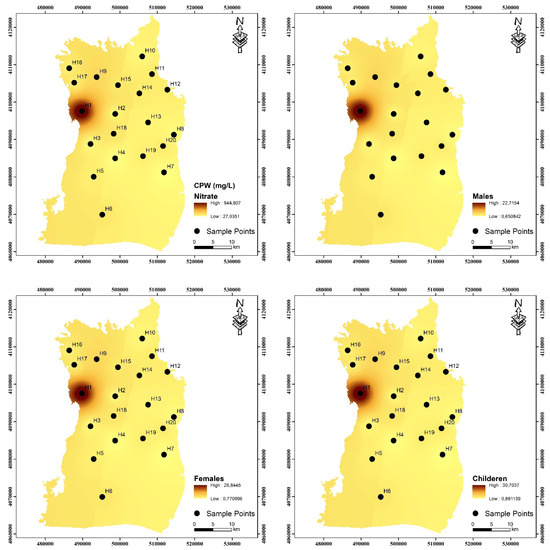
Figure 7.
Values of total hazard quotient (HQ) for pre-irrigation period for adult males, adult females, and children.
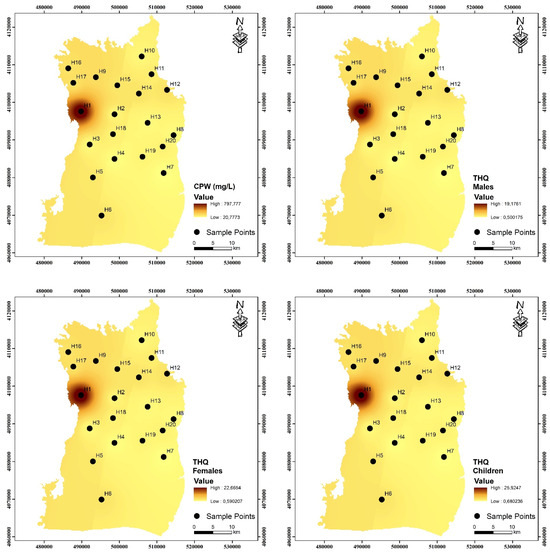
Figure 8.
Values of total hazard quotient (HQ) for post-irrigation period for adult males, adult females, and children.
Numerous studies have demonstrated the health hazards associated with NO3− exposure in drinking water are significantly higher for children compared to adults. For instance, one study indicated that the health risks for children through drinking water intake are approximately 1.54 times greater than those for adults, primarily due to their smaller body size and higher water consumption relative to their weight [46]. This heightened sensitivity is attributed to their developing gastrointestinal systems, which may absorb pollutants more readily [50]. Moreover, health risk assessments have demonstrated that children are at a higher risk of non-carcinogenic health hazards related to NO3− contamination. In a study conducted in northeastern Iran, it was found that the health risks for children exceeded the acceptable limits set by health authorities, indicating a pressing need for intervention in areas with high nitrate levels [51]. Similarly, another study highlighted that approximately 14.28% of the groundwater samples were above the hazard quotient threshold for children, highlighting their heightened susceptibility [52].
3.5. A Probabilistic Approach for Nitrate Risk Assessment
Monte Carlo simulation (MCS) can evaluate the health risk associated with nitrate on human health by analyzing the variability and uncertainty of many factors. Oracle Crystal Ball (version 11.1.2.4.850) was utilized for the simulation, conducting 20,000 iterations. The exposure risk and point value were computed by selecting parameter values from their respective distributions using this method. The upper confidence level (p95) of nitrate was ascertained for adult males, adult females, and children using this probabilistic methodology.
In all three demographic groups, the HQ values exhibited positively skewed distributions, indicating that while the majority of estimated exposures fall within safe limits (HQ < 1), a considerable portion—particularly those in the 95th percentile—exceeds the threshold of concern. This finding aligns with previous studies emphasizing the importance of probabilistic approaches in capturing upper-bound exposure scenarios [25,46]. Among the groups, children exhibited the highest HQ values, with a 95th percentile approaching 3.45 (Figure 9). This suggests that children are at a substantially elevated risk, primarily due to their higher water intake per body weight and lower detoxification capacity. These observations are consistent with the findings of Moeini and Azhdarpoor [53], who highlighted that children are more vulnerable to environmental contaminants, particularly in regions with compromised groundwater quality.
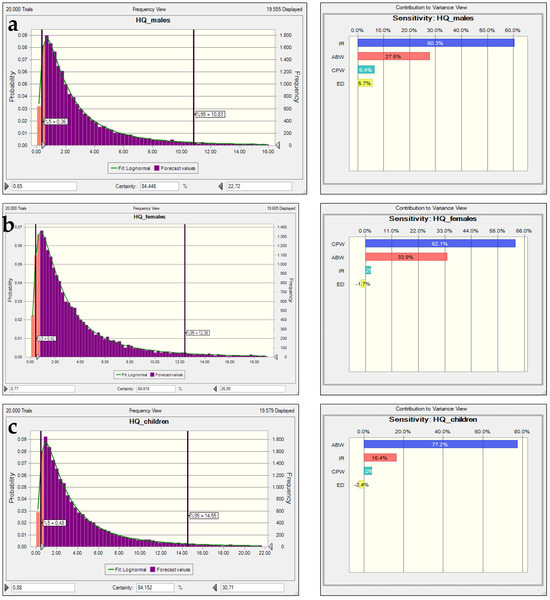
Figure 9.
The nitrate HQ uncertainty and sensitivity analysis histograms for (a) adult males, (b) adult females, and (c) children in the pre-irrigation period.
Sensitivity analysis results underscore the critical role of contaminant concentration in water (CPW), which accounts for 62–77% of the variance in HQ across all groups. This dominant influence supports the conclusion that water quality control—particularly reducing contaminant levels—is the most effective risk mitigation strategy. Water ingestion rate (AFW) also contributes significantly to the overall risk, particularly in adult females (≈31%) and adult males (≈27%), while exposure duration (ED) has minimal impact. These patterns corroborate earlier work by Jafarzadeh et al. [54], who demonstrated that exposure variables have differing weights depending on population characteristics, but contaminant concentration consistently remains the most influential factor.
As in previous simulations, the HQ values across all groups exhibit right-skewed distributions, indicating that although most simulations fall within acceptable safety limits (HQ < 1), a portion of the population may still be exposed to hazardous concentrations. Notably, the 95th percentile values exceed 3.0 for all groups, with children again showing the highest upper bound HQ (≈3.53), reinforcing their vulnerability [25,55]. A critical observation from the sensitivity analysis is the shift in dominance of the input variables contributing to overall risk. While contaminant concentration in water (CPW) was the primary driver in previous analyses, in this dataset average daily water intake (AFW) becomes the most influential variable across all subgroups: ≈63% in children, 60% in adult females, and 57% in adult males (Figure 10). This suggests that the toxicological risk in this scenario is driven more by exposure behavior (volume of water consumed) than by chemical concentration. These results align with findings by WHO [6,56] and Morovati et al. [56] who emphasized that ingestion rate can disproportionately affect HQ in populations with high water demand relative to body weight, such as children. Additionally, IR and ED have minimal contributions in this scenario, each accounting for less than 2% of total variance. This pattern indicates that once the contaminant is present and daily intake volume is high, the duration or frequency of exposure becomes a secondary concern in determining acute non-carcinogenic effects. Similar prioritization of intake over duration has been observed in arsenic and nitrate risk assessments in endemic regions [57,58]. The increased prominence of AFW in sensitivity rankings may be attributed to specific behavioral or environmental factors such as climate-driven water consumption or occupation-based exposure (e.g., agricultural labor). Thus, mitigation strategies should prioritize awareness and control over daily intake volumes, especially in high-risk groups like children. The results further confirm the utility of Monte Carlo simulation in prioritizing risk variables and informing population-specific intervention policies.

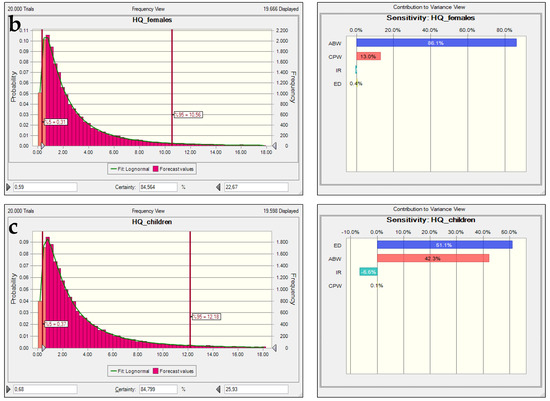
Figure 10.
The nitrate HQ uncertainty and sensitivity analysis histograms for (a) adult males, (b) adult females, and (c) children in the post-irrigation period.
The values exceeded 1 substantially, and these figures were determined to be greater in youngsters compared to other groups. This indicates that this age group faces non-carcinogenic risks associated with nitrate, perhaps because of their lower average body weight. Comparing the pre-irrigation and post-irrigation periods, the health risk values during the pre-irrigation era were comparatively elevated relative to those in the post-irrigation period. The results demonstrate that the non-carcinogenic risk is greatest among the children’s group. This observation was similarly noted in the research conducted by Zazouli et al. [59].
4. Conclusions
This study presents a comprehensive methodological framework that integrates hydrogeochemical analysis, spatial modeling, multivariate statistical techniques, and Monte Carlo-based health risk simulations to assess nitrate contamination in groundwater within semi-arid agricultural regions. The approach enables detailed evaluation of non-carcinogenic health risks across demographic groups and enhances the reliability of risk estimation through probabilistic uncertainty analysis. From a scientific standpoint, the integrated methodology advances conventional groundwater monitoring by incorporating exposure prioritization, scenario-based risk modeling, and sensitivity analysis. The findings facilitate spatial identification of pollution sources and support the development of targeted interventions for protecting vulnerable populations. Overall, this study offers a transferable, reproducible, and policy-relevant model for nitrate-impacted basins, contributing to sustainable agriculture and water resource management while enriching the scientific basis for groundwater quality assessment.
Funding
This research received no external funding.
Institutional Review Board Statement
Not applicable.
Informed Consent Statement
Not applicable.
Data Availability Statement
The original contributions presented in this study are included in this article; further inquiries can be directed to the corresponding author.
Conflicts of Interest
The author declares no conflicts of interest.
References
- Bhatnagar, A.; Sillanpää, M. A Review of Emerging Adsorbents for Nitrate Removal from Water. Chem. Eng. J. 2011, 168, 493. [Google Scholar] [CrossRef]
- Abascal, E.; Gómez-Coma, L.; Ortiz, I.; Ortiz, A. Global Diagnosis of Nitrate Pollution in Groundwater and Review of Removal Technologies. Sci. Total Environ. 2022, 810, 152233. [Google Scholar] [CrossRef] [PubMed]
- Gutiérrez, M.; Biagioni, R.N.; Alarcón-Herrera, M.T.; Rivas-Lucero, B.A. An Overview of Nitrate Sources and Operating Processes in Arid and Semiarid Aquifer Systems. Sci. Total Environ. 2018, 624, 1513. [Google Scholar] [CrossRef] [PubMed]
- Ward, M.H.; Jones, R.R.; Brender, J.D.; De Kok, T.M.; Weyer, P.J.; Nolan, B.T.; Van Breda, S.G. Drinking Water Nitrate and Human Health: An Updated Review. Int. J. Environ. Res. Public Health 2018, 15, 1557. [Google Scholar] [CrossRef]
- Romanelli, A.; Soto, D.X.; Matiatos, I.; Martínez, D.E.; Esquius, S. A Biological and Nitrate Isotopic Assessment Framework to Understand Eutrophication in Aquatic Ecosystems. Sci. Total Environ. 2020, 715, 136909. [Google Scholar] [CrossRef] [PubMed]
- WHO. Guidelines for Drinking-Water Quality, 4th ed.; WHO Press: Geneva, Switzerland, 2017. [Google Scholar]
- Gardner, S.G.; Levison, J.; Parker, B.L.; Martin, R.C. Groundwater Nitrate in Three Distinct Hydrogeologic and Land-Use Settings in Southwestern Ontario, Canada. Hydrogeol. J. 2020, 28, 1891. [Google Scholar] [CrossRef]
- Kahraman, N.; Yazici Karabulut, B.; Atasoy, A.D.; Yesilnacar, M.I. Investigation of Nitrate Pollution in Unconfined Aquifer of Harran Plain in Summer and Winter Periods (2014–2015). Harran Univ. Eng. J. 2016, 1, 1. [Google Scholar]
- Yazici Karabulut, B.; Atasoy, A.D.; Yesilnacar, M.I. Removal of Nitrate from Aqueous Solutions by Batch Electrocoagulation Process Using al and Fe Plate Electrodes. Harran Univ. J. Eng. 2019, 4, 79. [Google Scholar]
- Yazici Karabulut, B.; Atasoy, A.D.; Yesilnacar, M.I. Investigation of the Effect of Montmorillonite Clay on Aluminum Amount and Fock Form in Nitrate Removal by Electrocoagulation Process. Int. J. Math. Eng. Nat. Sci. 2019, 8, 135. [Google Scholar]
- Yazici Karabulut, B.; Atasoy, A.D.; Can, O.T.; Yesilnacar, M.I. Electrocoagulation for Nitrate Removal in Groundwater of Intensive Agricultural Region: A Case Study of Harran Plain, Turkey. Environ. Earth Sci. 2021, 80, 190. [Google Scholar] [CrossRef]
- Serio, F.; Miglietta, P.P.; Lamastra, L.; Ficocelli, S.; Intini, F.; De Leo, F.; De Donno, A. Groundwater Nitrate Contamination and Agricultural Land Use: A Grey Water Footprint Perspective in Southern Apulia Region (Italy). Sci. Total Environ. 2018, 645, 1425. [Google Scholar] [CrossRef]
- Taufiq, A.; Effendi, A.J.; Iskandar, I.; Hosono, T.; Hutasoit, L.M. Controlling Factors and Driving Mechanisms of Nitrate Contamination in Groundwater System of Bandung Basin, Indonesia, Deduced by Combined Use of Stable Isotope Ratios, CFC Age Dating, and Socioeconomic Parameters. Water Res. 2019, 148, 292. [Google Scholar] [CrossRef] [PubMed]
- Iqbal, J.; Su, C.; Wang, M.; Abbas, H.; Baloch, M.Y.J.; Ghani, J.; Huq, M.E. Groundwater Fluoride and Nitrate Contamination and Associated Human Health Risk Assessment in South Punjab, Pakistan. Environ. Sci. Pollut. Res. 2023, 30, 61606. [Google Scholar] [CrossRef] [PubMed]
- Hansen, B.; Thorling, L.; Kim, H.; Blicher-Mathiesen, G. Long-Term Nitrate Response in Shallow Groundwater to Agricultural N Regulations in Denmark. J. Environ. Manag. 2019, 240, 66. [Google Scholar] [CrossRef] [PubMed]
- Qasemi, M.; Farhang, M.; Biglari, H.; Afsharnia, M.; Ojrati, A.; Khani, F.; Zarei, A. Health Risk Assessments Due to Nitrate Levels in Drinking Water in Villages of Azadshahr, Northeastern Iran. Environ. Earth Sci. 2018, 77, 782. [Google Scholar] [CrossRef]
- Koh, E.H.; Lee, E.; Lee, K.K. Application of Geographically Weighted Regression Models to Predict Spatial Characteristics of Nitrate Contamination: Implications for an Effective Groundwater Management Strategy. J. Environ. Manag. 2020, 268, 110646. [Google Scholar] [CrossRef]
- Saraswat, A.; Ram, S.; Kouadri, S.; Raza, M.B.; Hombegowda, H.C.; Kumar, R.; Jena, R.K. Groundwater Quality, Fluoride Health Risk and Geochemical Modelling for Drinking and Irrigation Water Suitability Assessment in Tundla Block, Uttar Pradesh, India. Groundw. Sustain. Dev. 2023, 23, 100991. [Google Scholar] [CrossRef]
- Wang, D.; Li, P.; Yang, N.; Yang, C.; Zhou, Y.; Li, J. Distribution, Sources and Main Controlling Factors of Nitrate in a Typical Intensive Agricultural Region, Northwestern China: Vertical Profile Perspectives. Environ. Res. 2023, 237, 116911. [Google Scholar] [CrossRef]
- Panneerselvam, B.; Muniraj, K.; Pande, C.; Ravichandran, N. Prediction and Evaluation of Groundwater Characteristics Using the Radial Basic Model in Semi-Arid Region, India. Int. J. Environ. Anal. Chem. 2023, 103, 1377–1393. [Google Scholar] [CrossRef]
- Chen, S.; Tang, Z.; Wang, J.; Wu, J.; Yang, C.; Kang, W.; Huang, X. Multivariate Analysis and Geochemical Signatures of Shallow Groundwater in the Main Urban Area of Chongqing, Southwestern China. Water 2020, 12, 2833. [Google Scholar] [CrossRef]
- Ramalingam, S.; Panneerselvam, B.; Kaliappan, S.P. Effect of High Nitrate Contamination of Groundwater on Human Health and Water Quality Index in Semi-Arid Region, South India. Arab. J. Geosci. 2022, 15, 242. [Google Scholar] [CrossRef]
- Zhang, X.; Zhang, Y.; Shi, P.; Bi, Z.; Shan, Z.; Ren, L. The Deep Challenge of Nitrate Pollution in River Water of China. Sci. Total Environ. 2021, 770, 144674. [Google Scholar] [CrossRef]
- Adimalla, N.; Qian, H. Groundwater Chemistry, Distribution and Potential Health Risk Appraisal of Nitrate Enriched Groundwater: A Case Study from the Semi-Urban Region of South India. Ecotoxicol. Environ. Saf. 2021, 207, 111277. [Google Scholar] [CrossRef]
- American Public Health Association. Standard Methods for the Examination of Water and Wastewater; American Public Health Association: Washington, DC, USA, 2005. [Google Scholar]
- USEPA. Risk Assessment Guidance for Superfund (RAGS). Human Health Evaluation Manual (Part F); US Environmental Protection Agency: Washington, DC, USA, 2014; Volume I.
- Wang, Y.; Li, P. Appraisal of Shallow Groundwater Quality with Human Health Risk Assessment in Different Seasons in Rural Areas of the Guanzhong Plain (China). Environ. Res. 2022, 207, 112210. [Google Scholar] [CrossRef] [PubMed]
- Mohammadi, A.A.; Morovati, M.; Najafi Saleh, H.; Ghale Askari, S.; Ghaderpoori, M.; Shams, M.; Sadeghi, S. Groundwater Quality Evaluation for Drinking and Industrial Purposes. A Case Study in Northeastern Iran. J. Environ. Anal. Chem. 2022, 102, 6094. [Google Scholar] [CrossRef]
- Yazici-Karabulut, B.; Kocer, Y.; Yesilnacar, M.I. Bottled Water Quality Assessment through Entropy-Weighted Water Quality Index (EWQI) and Pollution Index of Groundwater (PIG): A Case Study in a Fast-Growing Metropolitan Area in Türkiye. Int. J. Environ. Health Res. 2024, 34, 61. [Google Scholar] [CrossRef]
- Ahmed, M.A.; Ghazala, H.; Mahmoudi, A.E.; Sherbini, R.E.; Genedi, M.A. Hydrogeological Attributes and Groundwater Potential of the Saq Aquifer System: Insights from Petrophysical Properties and Hydrochemical Characteristics in Al Qassim Province, KSA. Environ. Earth Sci. 2024, 83, 597. [Google Scholar] [CrossRef]
- Adimalla, N.; Wu, J. Groundwater Quality and Associated Health Risks in a Semi-Arid Region of South India: Implication to Sustainable Groundwater Management. Hum. Ecol. Risk Assess. Int. J. 2019, 25, 191. [Google Scholar] [CrossRef]
- Duraisamy, S.; Govindhaswamy, V.; Duraisamy, K.; Krishinaraj, S.; Balasubramanian, A.; Thirumalaisamy, S. Hydrogeochemical Characterization and Evaluation of Groundwater Quality in Kangayam Taluk, Tirupur District, Tamil Nadu, India, Using GIS Techniques. Environ. Geochem. Health 2019, 41, 851. [Google Scholar] [CrossRef]
- Subba Rao, N.; Sunitha, B.; Adimalla, N.; Chaudhary, M. Quality Criteria for Groundwater Use from a Rural Part of Wanaparthy District, Telangana State, India, Through Ionic Spatial Distribution (ISD), Entropy Water Quality Index (EWQI) and Principal Component Analysis (PCA). Environ. Geochem. Health 2020, 42, 579. [Google Scholar] [CrossRef]
- Mengistu, H.A.; Demlie, M.B.; Abiye, T.A.; Xu, Y.; Kanyerere, T. Conceptual Hydrogeological and Numerical Groundwater Flow Modelling around the Moab Khutsong Deep Gold Mine, South Africa. Groundw. Sustain. Dev. 2019, 9, 100266. [Google Scholar]
- Yazici Karabulut, B.; Derin, P.; Demir Yetiþ, A.; Yeþilnacar, M.Ý. Health Risk Assessment in an Area of Dental Fluorosis Disease from High Fluoride Drinking Water: A Case Study from Southeastern Türkiye. Int. J. Environ. Health Res. 2024, 34, 2299. [Google Scholar] [CrossRef] [PubMed]
- Karunanidhi, D.; Aravinthasamy, P.; Deepali, M.; Subramani, T.; Roy, P.D. The Effects of Geochemical Processes on Groundwater Chemistry and the Health Risks Associated with Fluoride Intake in a Semi-Arid Region of South India. RSC Adv. 2020, 10, 4840. [Google Scholar] [CrossRef] [PubMed]
- Wu, J.; Zhou, H.; He, S.; Zhang, Y. Comprehensive Understanding of Groundwater Quality for Domestic and Agricultural Purposes in Terms of Health Risks in a Coal Mine Area of the Ordos Basin, North of the Chinese Loess Plateau. Environ. Earth Sci. 2019, 78, 446. [Google Scholar] [CrossRef]
- Li, P.; He, X.; Li, Y.; Xiang, G. Occurrence and Health Implication of Fluoride in Groundwater of Loess Aquifer in the Chinese Loess Plateau: A Case Study of Tongchuan, Northwest China. Expo. Health 2019, 11, 95. [Google Scholar] [CrossRef]
- Chitsazan, M.; Aghazadeh, N.; Mirzaee, Y.; Golestan, Y. Hydrochemical Characteristics and the Impact of Anthropogenic Activity on Groundwater Quality in Suburban Area of Urmia City, Iran. Environ. Dev. Sustain. 2019, 21, 331. [Google Scholar] [CrossRef]
- Wei, M.; Wu, J.; Li, W.; Zhang, Q.; Su, F.; Wang, Y. Groundwater Geochemistry and Its Impacts on Groundwater Arsenic Enrichment, Variation, and Health Risks in Yongning County, Yinchuan Plain of Northwest China. Expo. Health 2021, 14, 219–238. [Google Scholar] [CrossRef]
- Qiu, H.; Gui, H.; Xu, H.; Cui, L.; Li, Z.; Yu, H. Quantifying Nitrate Pollution Sources of Shallow Groundwater and Related Health Risks Based on Deterministic and Monte Carlo Models: A Study in Huaibei Mining Area, Huaibei Coalfield, China. Ecotoxicol. Environ. Saf. 2023, 249, 114434. [Google Scholar] [CrossRef]
- Badeenezhad, A.; Radfard, M.; Passalari, H.; Parseh, I.; Abbasi, F.; Rostami, S. Factors Affecting the Nitrate Concentration and Its Health Risk Assessment in Drinking Groundwater by Application of Monte Carlo Simulation and Geographic Information System. Hum. Ecol. Risk Assess. 2021, 27, 1458–1471. [Google Scholar] [CrossRef]
- Mukherjee, I.; Singh, U.K. Characterization of Groundwater Nitrate Exposure Using Monte Carlo and Sobol Sensitivity Approaches in the Diverse Aquifer Systems of an Agricultural Semiarid Region of Lower Ganga Basin, India. Sci. Total Environ. 2021, 787, 147657. [Google Scholar] [CrossRef]
- Jalali, M.; Karami, S.; Fatehi Marj, A. On the Problem of the Spatial Distribution Delineation of the Groundwater Quality Indicators via Multivariate Statistical and Geostatistical Approaches. Environ. Monit. Assess. 2019, 191, 323. [Google Scholar] [CrossRef] [PubMed]
- Ibrahim, H.; Yaseen, Z.M.; Scholz, M.; Ali, M.; Gad, M.; Elsayed, S.; Khadr, M.; Hussein, H.; Ibrahim, H.H.; Eid, M.H.; et al. Evaluation and Prediction of Groundwater Quality for Irrigation Using an Integrated Water Quality Indices, Machine Learning Models and GIS Approaches: A Representative Case Study. Water 2023, 15, 694. [Google Scholar] [CrossRef]
- Feng, W.; Wang, C.; Lei, X.; Wang, H.; Xueliang, Z. Distribution of Nitrate Content in Groundwater and Evaluation of Potential Health Risks: A Case Study of Rural Areas in Northern China. Int. J. Environ. Res. Public Health 2020, 17, 9390. [Google Scholar] [CrossRef] [PubMed]
- Gad, M.; Gaagai, A.; Agrama, A.A.; El-Fiqy, W.F.; Eid, M.H.; Szűcs, P.; Elsayedg, S.; Elsherbinyh, O.; Khadri, M.; Abukhadra, M.R.; et al. Comprehensive Evaluation and Prediction of Groundwater Quality and Risk Indices Using Quantitative Approaches, Multivariate Analysis, and Machine Learning Models: An Exploratory Study. Heliyon 2024, 10, e36606. [Google Scholar] [CrossRef]
- Ravikumar, P.; Somashekar, R.K. Principal Component Analysis and Hydrochemical Facies Characterization to Evaluate Groundwater Quality in Varahi River Basin, Karnataka State, India. Appl. Water Sci. 2017, 7, 745–755. [Google Scholar] [CrossRef]
- Hou, Q.; Pan, Y.; Zeng, M.; Wang, S.; Shi, H.; Huang, C.; Peng, H. Assessment of Groundwater Hydrochemistry, Water Quality, and Health Risk in Hainan Island, China. Sci. Rep. 2023, 13, 12104. [Google Scholar] [CrossRef]
- Yu, G.; Wang, J.; Liu, L.; Li, Y.; Zhang, Y.; Wang, S. The Analysis of Groundwater Nitrate Pollution and Health Risk Assessment in Rural Areas of Yantai, China. BMC Public Health 2020, 20, 437. [Google Scholar] [CrossRef]
- Zendehbad, M.; Mostaghelchi, M.; Mojganfar, M.; Cepuder, P.; Loiskandl, W. Nitrate in Groundwater and Agricultural Products: Intake and Risk Assessment in Northeastern Iran. Environ. Sci. Pollut. Res. 2022, 29, 78603. [Google Scholar] [CrossRef]
- Brella, D. Identification of the Groundwater Quality and Potential Noncarcinogenic Health Risk Assessment of Nitrate in the Groundwater of El Milia Plain, Kebir Rhumel Basin, Algeria. Hydrology 2023, 10, 171. [Google Scholar] [CrossRef]
- Moeini, Z.; Azhdarpoor, A. Health Risk Assessment of Nitrate in Drinking Water in Shiraz Using Probabilistic and Deterministic Approaches and Impact of Water Supply. Environ. Chall. 2021, 5, 100326. [Google Scholar] [CrossRef]
- Jafarzadeh, N.; Heidari, K.; Meshkinian, A.; Kamani, H.; Mohammadi, A.A.; Conti, G.O. Non-Carcinogenic Risk Assessment of Exposure to Heavy Metals in Underground Water Resources in Saraven, Iran: Spatial Distribution, Monte-Carlo Simulation, Sensitive Analysis. Environ. Res. 2022, 204, 112002. [Google Scholar] [CrossRef] [PubMed]
- Chen, K.; Liu, Q.; Yang, T.; Ju, Q.; Hou, X.; Gao, W.; Jiang, S. Groundwater Pollution Source Identification and Health Risk Assessment in the North Anhui Plain, Eastern China: Insights from Positive Matrix Factorization and Monte Carlo Simulation. Sci. Total Environ. 2023, 895, 165186. [Google Scholar] [CrossRef] [PubMed]
- Morovati, R.; Badeenezhad, A.; Najafi, M.; Azhdarpoor, A. Investigating the Correlation between Chemical Parameters, Risk Assessment, and Sensitivity Analysis of Fluoride and Nitrate in Regional Groundwater Sources Using Monte Carlo. Environ. Geochem. Health 2024, 46, 5. [Google Scholar] [CrossRef] [PubMed]
- Ali, N.; Neagu, D.; Trundle, P.R. Evaluation of K-Nearest Neighbour Classifier Performance for Heterogeneous Data Sets. SN Appl. Sci. 2019, 1, 1559. [Google Scholar] [CrossRef]
- Raheja, H.; Goel, A.; Pal, M. Assessment of Groundwater Quality and Human Health Risk from Nitrate Contamination Using a Multivariate Statistical Analysis. J. Water Health 2024, 22, 350–366. [Google Scholar] [CrossRef]
- Zazouli, M.A.; Dashtban, N.; Jalalvand, M.A.; Kheilgavan, S.J.; Kholerdi, F.M.; Mohammadpour, A.; Dehbandi, R. Unveiling Nitrate Contamination and Health Risks: Insights from Groundwater Quality Assessment and Monte Carlo Simulation along the Southern Caspian Sea Coasts. Groundw. Sustain. Dev. 2024, 27, 101340. [Google Scholar] [CrossRef]
Disclaimer/Publisher’s Note: The statements, opinions and data contained in all publications are solely those of the individual author(s) and contributor(s) and not of MDPI and/or the editor(s). MDPI and/or the editor(s) disclaim responsibility for any injury to people or property resulting from any ideas, methods, instructions or products referred to in the content. |
© 2025 by the author. Licensee MDPI, Basel, Switzerland. This article is an open access article distributed under the terms and conditions of the Creative Commons Attribution (CC BY) license (https://creativecommons.org/licenses/by/4.0/).