Next Article in Journal
A Graph Isomorphic Network with Attention Mechanism for Intelligent Fault Diagnosis of Axial Piston Pump
Previous Article in Journal
Research on a Fusion Technique of YOLOv8-URE-Based 2D Vision and Point Cloud for Robotic Grasping in Stacked Scenarios
 
 
Due to scheduled maintenance work on our database systems, there may be short service disruptions on this website between 10:00 and 11:00 CEST on June 14th.
Article

Analytical Solution for Thermal Runaway of Li-Ion Battery with Simplified Thermal Decomposition Equation

Kobelco Research Institute, Inc., 1-1-5, Takatsukadai, Nishi-ku, Kobe 651-2271, Japan
*
Author to whom correspondence should be addressed.
Appl. Sci. 2025, 15(12), 6574; https://doi.org/10.3390/app15126574
Submission received: 9 April 2025 / Revised: 28 May 2025 / Accepted: 8 June 2025 / Published: 11 June 2025

Abstract

:
Analytical solutions for the temperature change of a lithium-ion battery during thermal runaway were derived by the equation of linearizing thermal decomposition reaction. This study focuses on the representative temperature of the battery cell (zero-dimensional) during the heating test. First, the thermal decomposition reaction was modeled from DSC tests data of the electrode assuming Arrhenius-type temperature dependency. Subsequently, the reaction was simplified by a linear function of temperature and the analytical solution was derived as the exponential function with respect to time. The validity and applicability of the analytical solution are discussed by comparing it with a one-dimensional thermal runaway simulation. Further study was carried out for multiple batteries in consideration of cell-to-cell propagation of the thermal runaway and the applicability was discussed. As results, the single-cell predictions agreed generally with numerical results, especially with higher heating and lower latent heat. A delay in thermal runaway onset in multiple cells, linearly dependent on inter-cell conductivity, was quantified analytically. Parameter adjustments improved the alignment of analytical and numerical results for multiple cells, enabling quick thermal assessments. While numerical simulation is needed for high accuracy, this analytical framework offers new insights and facilitates initial analyses.

1. Introduction

With the extensive adoption of Li-ion batteries in both commercial aviation and Battery Electric Vehicles, the safety of them has garnered significant attention [1]. Although considerable advancements have been made in Li-ion battery technology, the design of cells and modules to enhance safety remains essential [2,3]. Therefore, it is important to develop the model that can swiftly and accurately predict the temperature change of battery cells including thermal runaway, in order to accelerate the development cycle [1,3].
In addition to numerous experimental approaches [1,2,3,4,5,6,7,8,9,10,11,12], a wide range of simulations have been conducted in order to evaluate battery cell safety under various conditions, including external heating [13,14], overcharging [15,16], internal short-circuiting [17,18], and mechanical deformation [19,20]. Typically, the modeling process begins with obtaining the thermal decomposition reaction profile of the electrode via differential scanning calorimetry (DSC) or similar methods, which is then used to develop a heat generation reaction model based on the relationship between temperature and heat generation. The reaction rate of heat generation is often modeled using either the Arrhenius [21] or modified Arrhenius equation [22]. Subsequently, the time-dependent temperature of the battery cell is predicted based on the energy equation incorporating Joule heating from short circuits and the thermal decomposition reactions of the electrodes as source terms. So far, various models have been proposed, ranging from simplified zero-dimensional geometries [21,22] to detailed three-dimensional representations [14,15,16,17,18,19,20]. Recently, there has been growing interest in modeling the coupling of gas generation and fluid dynamics resulting from electrolyte vaporization [23,24,25], as well as in applying them for battery modules and packs [26,27,28,29]. One of the primary challenges with these simulations is reducing computational demands, with studies reporting on simplification or replacement with machine learning models [30,31,32,33,34]. Nonetheless, due to the fundamentally nonlinear nature of the differential equations over time, obtaining an analytical solution is generally difficult, necessitating numerical solutions through methods such as the finite element method (FEM) [35] or finite difference method (FDM) [36]. More recently, the quality and accuracy of commercial software, as well as the elucidation of detailed mechanisms through experimental research, have been rapidly advancing, leading to improved accuracy of simulation models. In thermal decomposition reactions, studies detailing models for both the positive and negative electrodes [37,38], peak separation techniques combined with machine learning algorithms [39], and ARC-based thermal decomposition reaction models considering the “crosstalk” between electrodes [40] have been conducted. Furthermore, calculations considering the detailed three-dimensional shape of cells for gas venting [41,42], numerical simulation models assuming the ejection of solid particles in addition to gas [43], and models including the influence of ambient pressure [44] have been proposed. Notably, the application of these models to battery modules [45] and packs [30] is also progressing.
Theoretical studies on battery thermal runaway have also been reported [23,46,47,48,49,50,51,52,53,54]. One of the simplest approaches is stability analysis focused on the balance of heat generation and dissipation, as represented by methods developed by Semenov [46], Thomas [47], and Frank-Kamenetskii [48]. B. Mao et al. [23] measured the critical temperature of 18650-type LCM/graphite systems under various conditions and analyzed their relationship with thermal conductivity. Additionally, U. P. Padhi et al. [49] introduced a novel temperature parameter based on Semenov’s theory to analyze thermal stability in high-capacity cells. However, these approaches target only the “current cell temperature”, making it difficult to predict temperature variations over time.
Efforts have also been made to predict time-dependent cell temperature changes based on self-heating theory. Z. An et al. [50] assumed a high-rate discharge scenario, positing that total heat generation could be represented as a linear sum of the heat from each component, and derived an analytical solution by separating the spatial distribution and temporal change of temperature in one dimension. P. Zhao et al. [51] derived an analytical solution for the one-dimensional reaction progress rate within the cell based on the conservation of energy and mass of chemical species and compared it with numerical solutions for verification. Nevertheless, even with these theories, it remains challenging to express the temporal change in cell temperature purely through analytical solutions, and numerical solutions are still required in part.
In this study, the complete analytical solutions for the temperature change of the battery cells under external heating conditions have been derived. The cell temperature is represented at a single point, and the energy balance considers heating from an external heater, heat generation from thermal decomposition reactions, and heat dissipation to the environment. First, the activation energy and the pre-exponential factors for the decomposition reaction rate are identified from heat generation profiles obtained through DSC (differential scanning calorimetry) measurements. Subsequently, the Arrhenius-type reaction rate for thermal decomposition of electrode materials is approximated by a linear function of temperature. Furthermore, we model the propagation of thermal runaway to adjacent cells and assess the applicability of this approach. The derivation of such an analytical solution is expected to provide a simple and generally predictable temperature profile that does not require specialized software or programs. Furthermore, it could be used as a validation of numerical simulations as a baseline condition.

2. Method

2.1. Model Assumptions

The thermal decomposition reactions of lithium-ion batteries consist of various processes, including the vaporization of the electrolyte, decomposition of the SEI (solid electrolyte interface), and the decomposition of both the anode and cathode. In many cases of thermal runaway, these reactions occur consecutively within a short period of time. For simplicity, these processes are modeled as a single overall reaction in this study. Moreover, this research focuses on obtaining an analytical solution, treating the battery temperature as a representative point. However, it should be noted that the battery’s thermal capacity is relatively large, and there is anisotropy in thermal conductivity, which leads to the development of a temperature distribution within the battery. In addition, although gas generation and combustion could play an important role in temperature distribution in abuse testing of battery cells, this study ignores these effects for simplicity.
An example of the temperature changes in a single cell and multiple cells is shown in Figure 1. In the case of a single cell, the temperature at a representative point is evaluated, while for multiple cells, the temperatures at the center cell and an adjacent cell are evaluated as two representative points.

2.2. Linearizing Heat Generation of Battery Cell

This study focuses on the external heating tests of the battery. When the representative temperature of the cell is T, the energy balance can be written as follows.
ρ C p T t = q h e a t i n g + q r e a c a h T T e n v
where ρ is density, C p is specific heat, qheating is the amount of heating by the heater, h is the heat transfer coefficient assuming heat dissipation to the environment, and Tenv is the environmental temperature. qreac is the amount of heat generated by the thermal decomposition reaction, expressed as a linear sum of the heating values of the positive electrode, negative electrode, and electrolyte. Namely,
q r e a c = j q r e a c , j
Each heat quantity has the cell temperature and the degree of nonreaction dependence and is usually assumed to be the Arrhenius or modified-Arrhenius quantity with the degree-of-nonreaction term introduced in the pre-factor.
q r e a c , j = Q t o t , j k j e x p E j R T α j
α j t = k j e x p E j R T α j
where Qtot_j is the latent heat of reaction, Ej is the activation energy, and R is the gas constant. kj is the reaction rate for the modified-Arrhenius-type equation.
k j = k 0 , j α j m j C j α j n j
where m, n, and C1 are constants, and k0,j is the frequency factor. However, it is generally difficult to obtain an analytical solution for Equation (1) because the heat generation term (Equation (3)) is nonlinear.
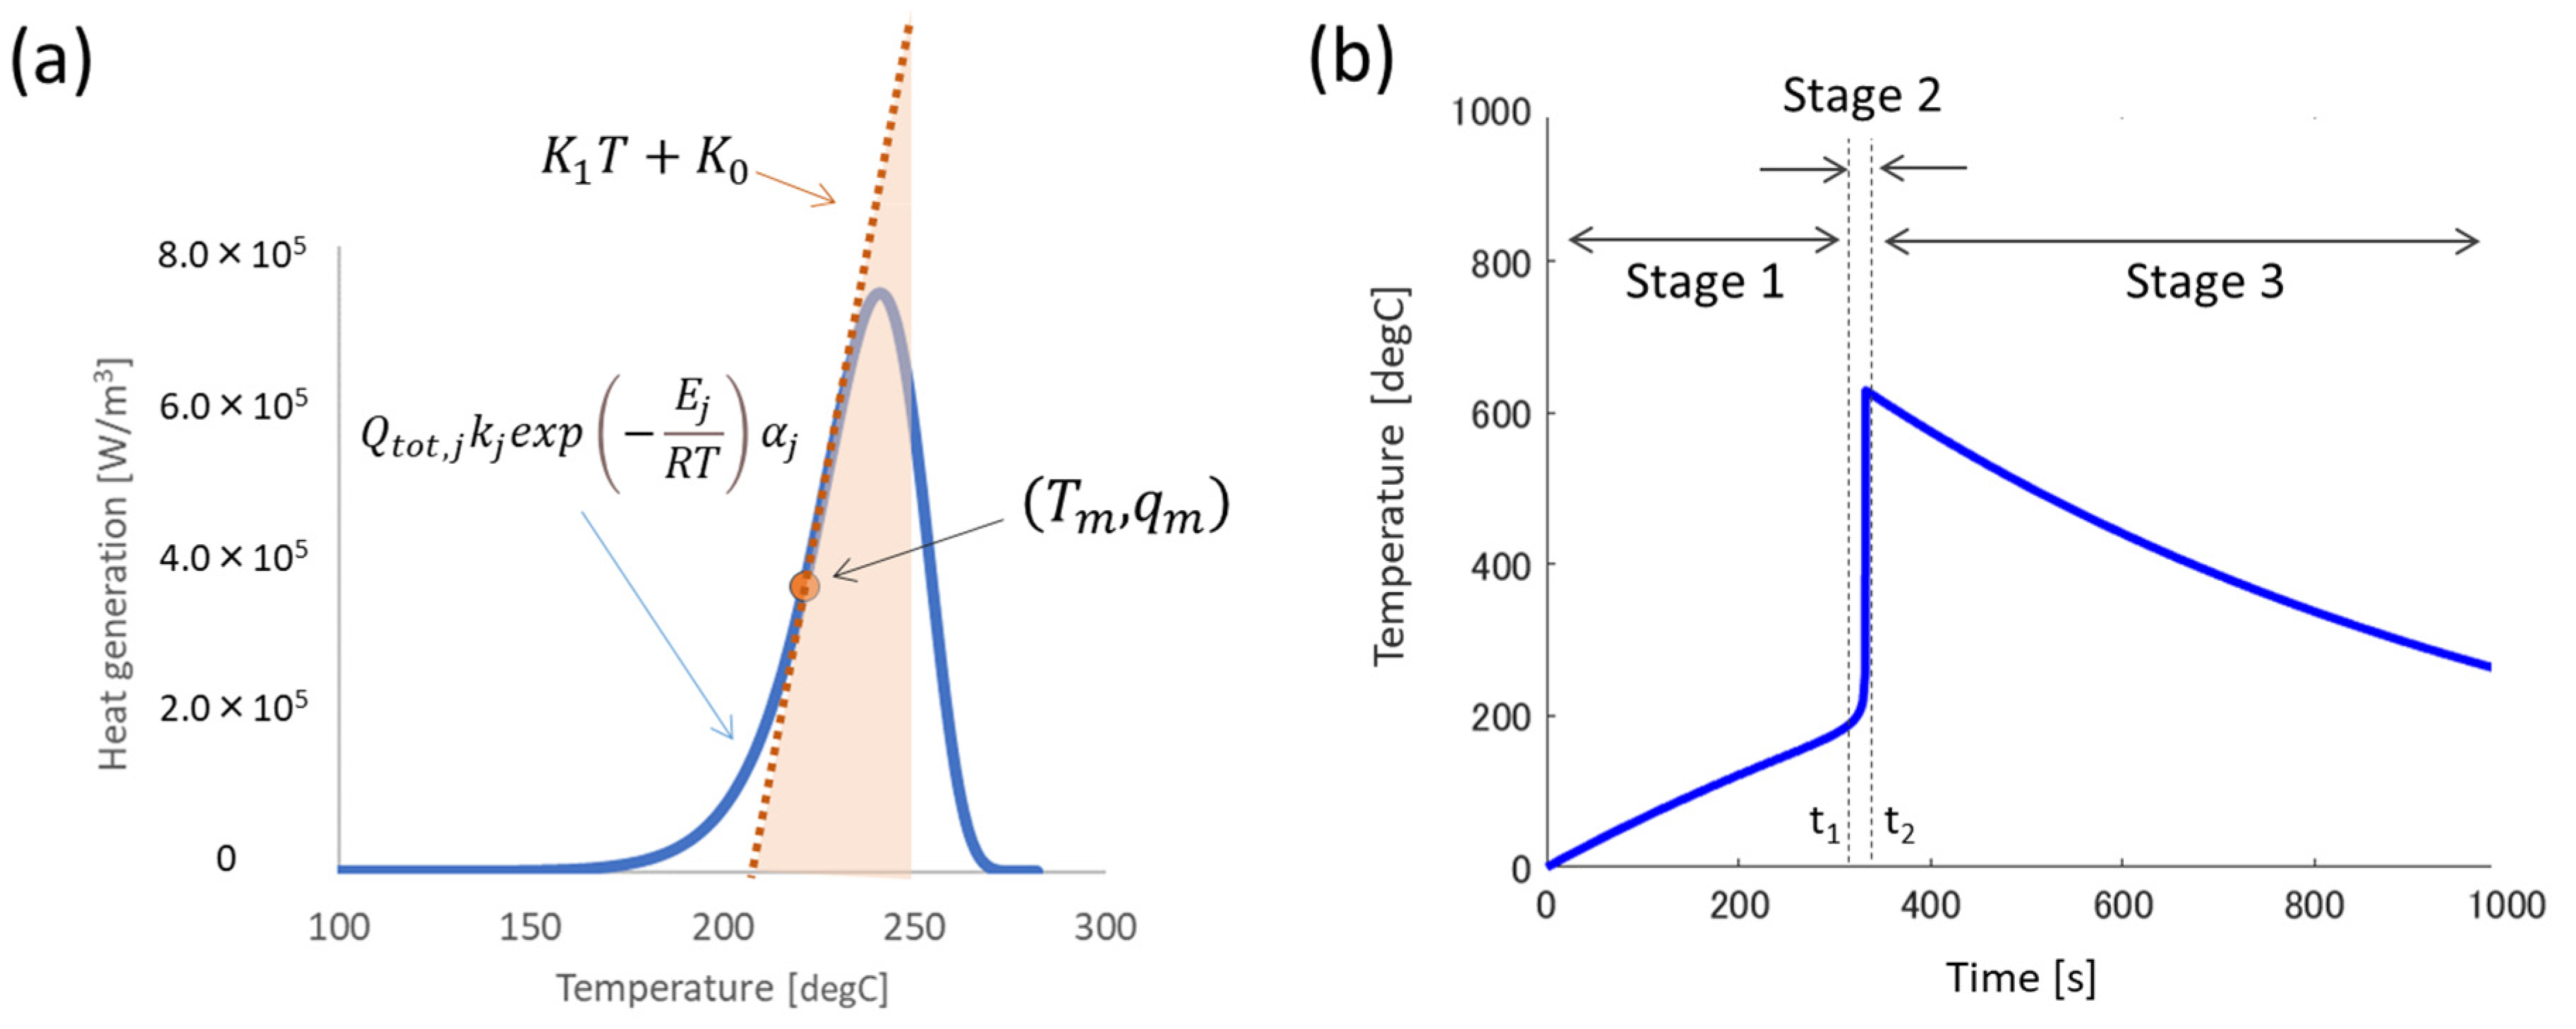
In the present study, an attempt is made to linearize the reaction term with respect to temperature. According to Equation (4), the degree of nonreaction αj changes with time t and temperature T. In order to simplify the equations, αj is assumed to be a representative constant value (herein αj is assumed to be 1). Note that this assumption makes kj a constant value (Equation (5)), and thus the thermal behavior at the maximum value of kj (at α = 0.5 if m = n) and the minimum values (near α = 0 and α = C1) is not considered. In particular, the maximum value of kj can cause a rapid increase in cell temperature, which a constant kj may not be able to accurately capture. Furthermore, the influence of the representative value of αj adopted should also be considered. These points will be explored in future work. Figure 2a shows the schematic image of the relationship between the heat generation and the battery temperature based on Equation (3). Since the maximum slope of qreac can be derived from the condition that the second derivative of Equation (3) is zero,
2 q r e a c , j T 2 = E j R Q t o t , j k j α j 1 T 3 e x p E j R T 2 + E j R T = 0
By solving this equation, the solution Tm other than T = ±∞ and the maximum slope of qm is described as
T m = E j 2 R ,     q m = Q t o t , j k j α j e x p E j R T m
Therefore, the maximum value of the slope of qreac, K1, is
K 1 = q r e a c , j T T = T m = 4 R E j Q t o t , j k j α j e x p 2
Let the intercept K0 be
K 0 = Q t o t , j k j α j e x p 2 K 1 E j 2 R
Then, the linearized heat generation equation can be described as
q m = K 1 T + K 0 T K 0 K 1
Note that this linear function of qm is defined in T > Tm (=−K0/K1).

2.3. Approximation to Overall Reaction

Although several thermal decomposition reactions are observed, including the positive electrode, the negative electrode, and the electrolyte in the actual case [23,24,28,37,38,39,40], one overall reaction is assumed in this study. It should be noted that this approximation does not generally hold. However, it may be applicable under conditions such as when the activation energy values of each peak are close, or when the heating rate is fast. The conditions of the overall reaction approximation are derived and discussed in Appendix A.

2.4. Analytical Temperature Profile of Battery Cell

In battery cell heating tests, the temperature profile can be divided into three main stages: the time period during which the battery temperature increases due to the external heating before the thermal decomposition reaction begins (stage 1), the time during which the thermal decomposition reaction occurs (stage 2), and the time after the reaction is completed (stage 3).
The energy balance at stage 1 is
ρ C p T t = q   h e a t i n g a h T T e n v
Therefore, the battery cell temperature at this stage can be written as
T = T 0 M e x p a h ρ C p t + M
M = q h e a t i n g + a h T e n v h
Since the temperature at which the thermal decomposition reaction begins is T1 = −k0/k1, the time t1 to reach this value is
t 1 = ρ C p a h l n q h e a t i n g a h T 1 T e n v q h e a t i n g a h T 0 T e n v
In stage 2, using Equation (10) for the temperature dependence of the linearized heating value, the following is obtained:
ρ C p T t = q h e a t i n g +   K 1 T + K 0 a h T T e n v
Therefore, the battery cell temperature T is
T = T 0 M e x p K 1 a h ρ C p t M
M = q h e a t i n g + a h T e n v + K 0 K 1 a h
Here, the end time of stage 2 is denoted as t2. Since the integrated heat generation and the total reaction latent heat Qtot in t1 to t2 coincide,
t 1 t 2 q m d t = t 1 t 2   K 1 T + K 0 d t = Q t o t
Substituting Equation (16) into Equation (18) and performing the integral, we obtain
K 0 t 2 t 1 + ρ C p K 1 a h T 1 + M e x p K 1 a h ρ C p t 2 t 1 1 = Q t o t
Equation (19) is a nonlinear equation for t2 and it is difficult to find an analytical solution. In the case that the heat generation duration t2–t1 is sufficiently small, the first term on the left-hand side, K0(t2t1), can be neglected and the following equation is obtained.
ρ C p K 1 a h T 0 + M e x p   K 1 a h ρ C p t 2 t 1 1 = Q t o t
However, it should be noted that this assumption is not valid when the heating rate is low or the thermal decomposition reaction rate kj is small. Solving this for t2 gives
t 2 = t 1 + ρ C p K 1 a h l n Q t o t   K 1 a h   K 1 ρ C p T 0 + M + 1
Assuming that in stage 3 the heater is damaged and only heat dissipation occurs,
ρ C p T t = a h T T e n v
Therefore, the battery cell temperature at this stage can be written as
T = T 2 T e n v e x p a h ρ C p t t 2 + T e n v
where T2 is the final temperature of stage 2.
Figure 2b describes an example of the temperature profile of the battery cell in the external heating test using Equations (12), (16), and (23). In stage 1, the battery temperature increases gradually due to the heating, rises rapidly by the thermal decomposition in stage 2, and decreases gradually in stage 3. This temperature profile is typically seen in the external heating tests [19,28].

2.5. Temperature Profiles of Multiple Battery Cells

In the case of multiple battery cells, the governing equation in this system can be described as the one-dimensional energy conservation law:
ρ C p T t = x K c e l l T x + q h e a t i n g + q r e a c
where Kcell means the thermal conductivity between the cells. Herein, the temperatures of two representative points are evaluated: one for the center cell and one for the adjacent cell (see Figure 1).
The temperature profile of the center cell follows Equations (14), (16), and (23) derived in Section 2.4. The temperature of the adjacent cell is evaluated by referencing the temperature profile of the center cell and using the attenuation factor R and the time delay Δt [30]. Here, assuming that the temperature of the center cell Tcnt follows a sine wave as
T c n t = A 0 s i n 2 π f t
the temperature of the adjacent cell Tsrf can be expressed as
T s r f = R A 0 s i n 2 π f t Δ t
where α is the thermal diffusivity (α = Kcell/ρCp), A0 is the temperature amplitude, and f is the temperature frequency. The attenuation factor R and the time delay Δt are given by
R = e x p d π f / α
Δ t = d / 2 α π f
where d is the inter-cell distance. From the analogy of these sine waves, the temperature profile of the adjacent cell can be described as follows using the attenuation factor R and the time delay Δt: in stage 1,
T = R T 0 M e x p a h ρ C p t Δ t + M
in stage 2,
T = T 0 M e x p K 1 a h ρ C p t Δ t M
and in stage 3,
T = T 0 M e x p K 1 a h ρ C p t Δ t M
In this case, f is representative of the duration of the temperature rise. Note that these parameters, f, R, and Δt, are not material properties but values that can vary depending on boundary conditions, etc.

2.6. Simulation Method

To validate the accuracy of the analytical solutions presented in the previous sections, a comparison and verification with numerical simulations will be conducted. For the single-cell case, the energy conservation equations (Equations (1)–(5)), thermal decomposition reaction equations, and the heating/cooling equations are directly solved numerically using an explicit method. For the multiple-cell case, the one-dimensional energy conservation equation (Equation (24)), along with the thermal decomposition reactions and heating/cooling equations for each cell, are evaluated. In both cases, the stage-based division introduced in the analytical solutions is not applied. The parameters used in the calculations are based on typical cathode materials (NCM) and anode materials (graphite), with values referenced from previous studies (summarized in Table 1, Table 2 and Table 3). The numerical simulations have been performed using in-house MATLAB code (MATLAB 2022a).

3. Results

The temperature profiles for both the single cell and multiple cells, as shown in Section 2.3 and Section 2.4, are plotted and compared with those from numerical simulations. First, the prediction accuracy of the temperature under the baseline conditions for the single cell is evaluated, and the effects of differences in the heating rate as well as the peak (height and width) of the thermal decomposition reaction are discussed. Next, the same evaluations are conducted for the multiple cells, and the differences between the single-cell and multiple-cell cases are summarized. Finally, the limitations of both single-cell and multiple-cell models and future work are described.

3.1. Single Cell

3.1.1. Baseline Condition

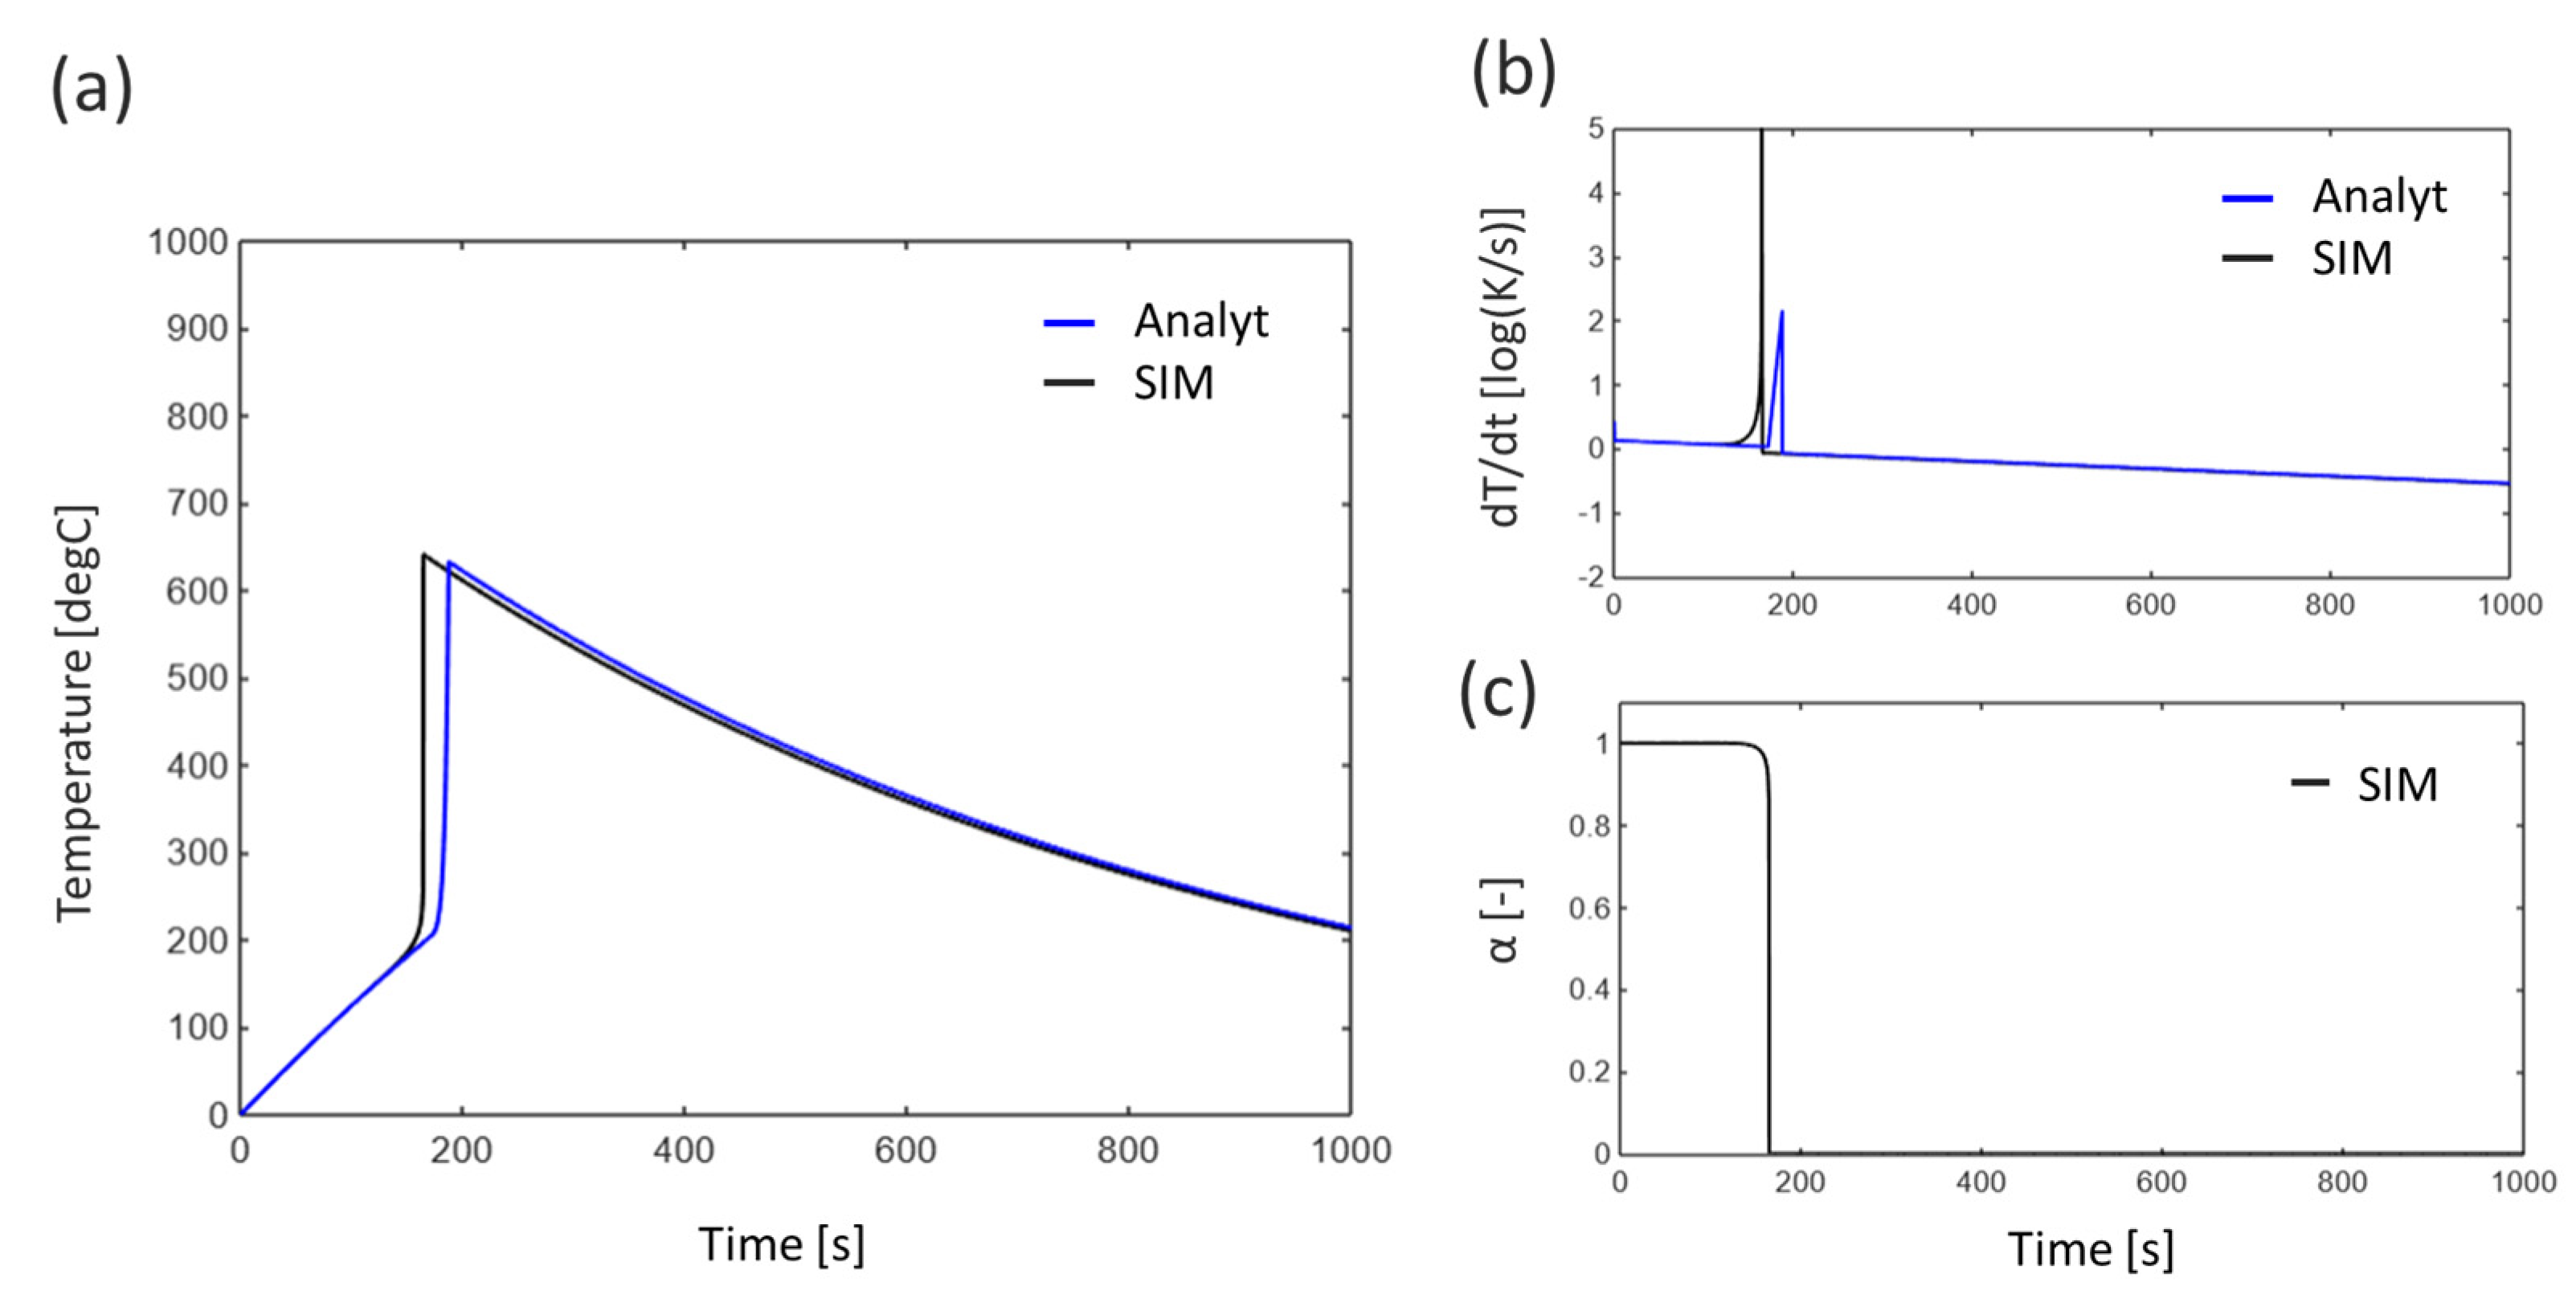
Figure 3a shows the time evolution of the battery cell temperature under baseline conditions with qheating = 4.0 × 10⁵ (W/m3), as evaluated from both the theoretical solution and numerical simulation. In both cases, the temperature gradually increases after the heating starts, then rapidly rises around 200 s due to the thermal decomposition reaction, and subsequently decreases gradually. While the timing of the rapid temperature rise is slightly delayed in the theoretical solution, the profiles match well overall.
The time evolution of the temperature rate of change (dT/dt) is shown in Figure 3b, and the time evolution of the unreacted fraction α from the numerical simulation is shown in Figure 3c. In the numerical simulation, the heat generation rate begins to increase around 160 s, with a spike in heat generation observed around 170 s. This timing coincides with a rapid decrease in the unreacted fraction α. In contrast, the theoretical solution shows a linear increase in the heat generation rate starting around 190 s, reflecting the linear approximation of the heat generation rate.

3.1.2. Effect of External Heating

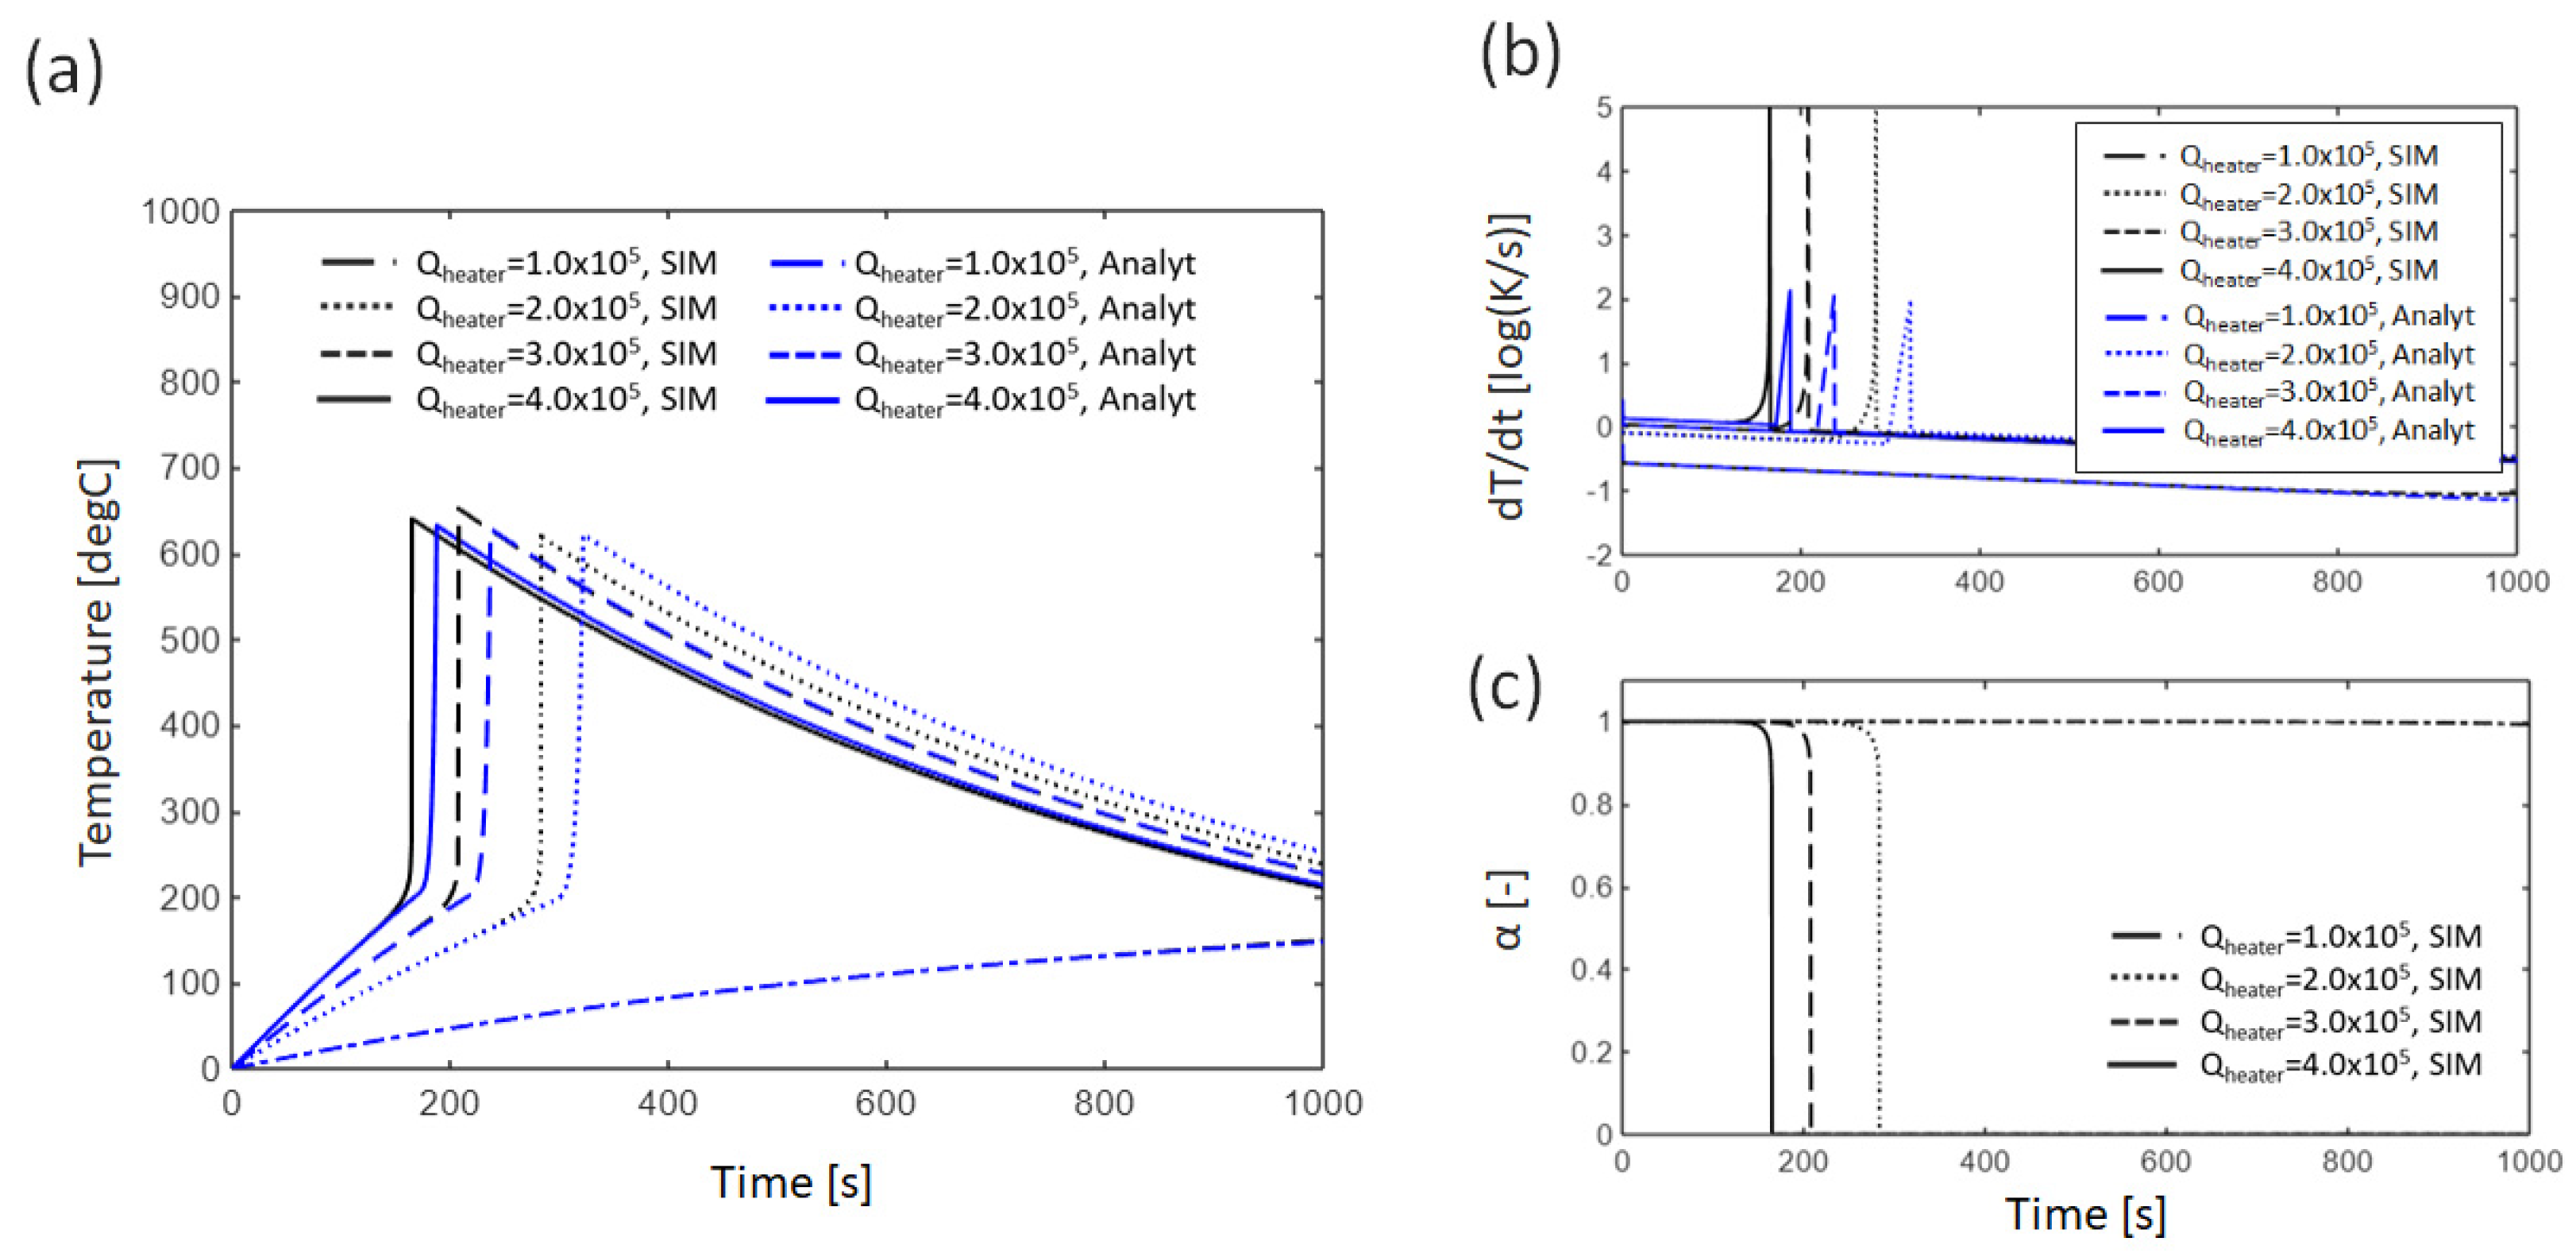
Figure 4a shows the battery temperature profiles from both the theoretical solution and numerical simulation under external heating conditions qheating = 1.0 × 10⁵, 2.0 × 10⁵, 3.0 × 10⁵, and 4.0 × 10⁵ (W/m3). As the heating power increases, the timing of the rapid temperature rise occurs earlier in both cases. Similar to the baseline case described in Section 3.1.1, a slight delay is observed in the theoretical solutions, with the delay being more pronounced for lower heating powers. However, under conditions where thermal runaway does not occur (i.e., qheating = 1.0 × 10⁵ (W/m3)), the two solutions agree exactly. Figure 4b shows the time evolution of the temperature rate of change, dT/dt. In the theoretical solution, the timing of the rapid heat generation is delayed compared to the numerical simulation, with this delay becoming more noticeable for lower heating powers. Figure 4c presents the time evolution of the unreacted fraction α from the numerical simulation. The timing of the sharp decrease in α (i.e., the rapid progression of the reaction) coincides with the spike in heat generation observed in Figure 4b.

3.1.3. Effect of Latent Heat of Thermal Decomposition Reaction

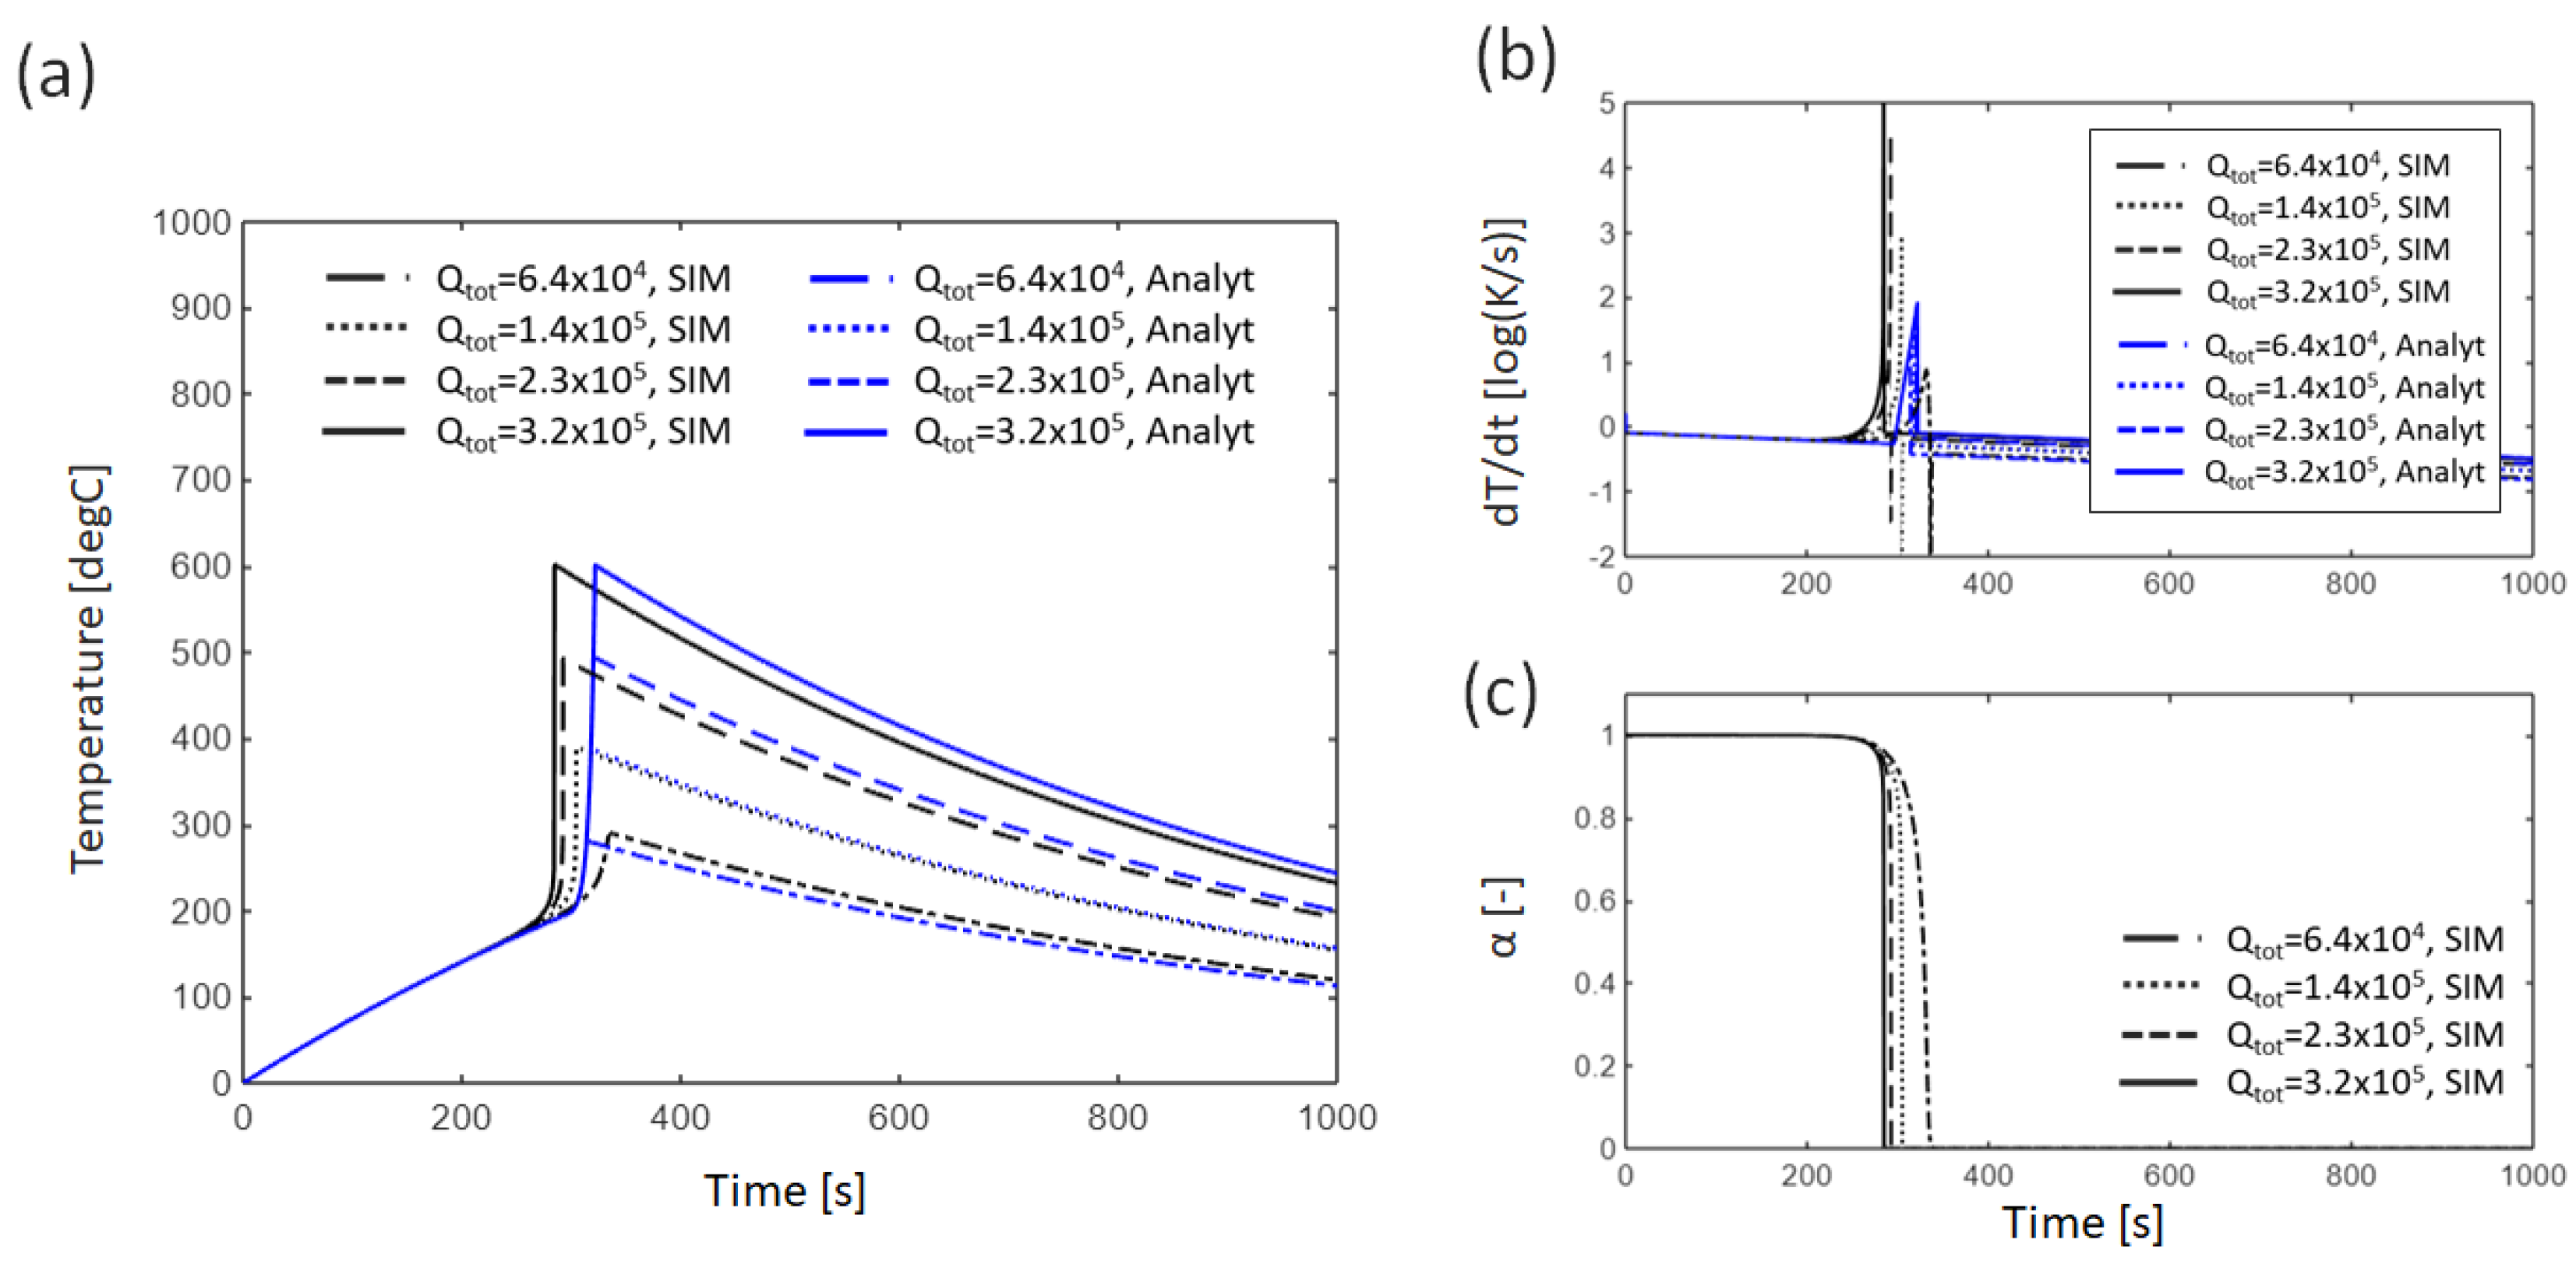
The battery temperature profiles, based on both the theoretical and numerical solutions, were calculated for thermal decomposition reaction latent heats of qtot = 6.4 × 10⁴, 1.4 × 10⁵, 2.3 × 10⁵, and 3.2 × 10⁵ (W/m3) with qheating = 3.0 × 10⁵ (W/m3) (see Figure 5a). In the numerical simulation, the higher the latent heat of the reaction, the higher the maximum temperature, and the earlier the timing of the rapid temperature rise. This is because, for the same unreacted fraction α, a larger latent heat leads to a greater temperature increase. In the theoretical solution, similarly to the numerical simulation, the higher the latent heat, the higher the maximum temperature. However, the timing of the rapid temperature rise is independent of the latent heat and remains constant. This is because, as shown in Equation (10), in the theoretical solution, the starting temperature of the thermal decomposition reaction does not depend on the latent heat. Therefore, when the latent heat is qtot = 6.4 × 10⁴ (W/m3), the timing of the rapid temperature rise in the theoretical solution occurs earlier than in the numerical simulation, which differs from the other latent heat values.
These trends can also be seen in the time evolution of dT/dt shown in Figure 5b and the unreacted fraction α shown in Figure 5c. In the numerical simulation, the thermal decomposition reaction starts earlier as the latent heat increases, whereas in the theoretical solution, the reaction begins at a constant time, independent of the latent heat.

3.2. Multiple Cells

3.2.1. Baseline Condition

The time variation of the temperatures in multiple cells (the central cell and the adjacent cells) under baseline conditions have been evaluated through both theoretical analysis and numerical simulations with qheating = 3.0 × 10⁵ (W/m3). Herein, the thermal conductivity between cells Kcell is assumed to be 0.2 (W/m·K), and the temperature frequency f is assumed to be 1/400 (1/s), corresponding to the rough time until thermal decomposition starts, respectively.
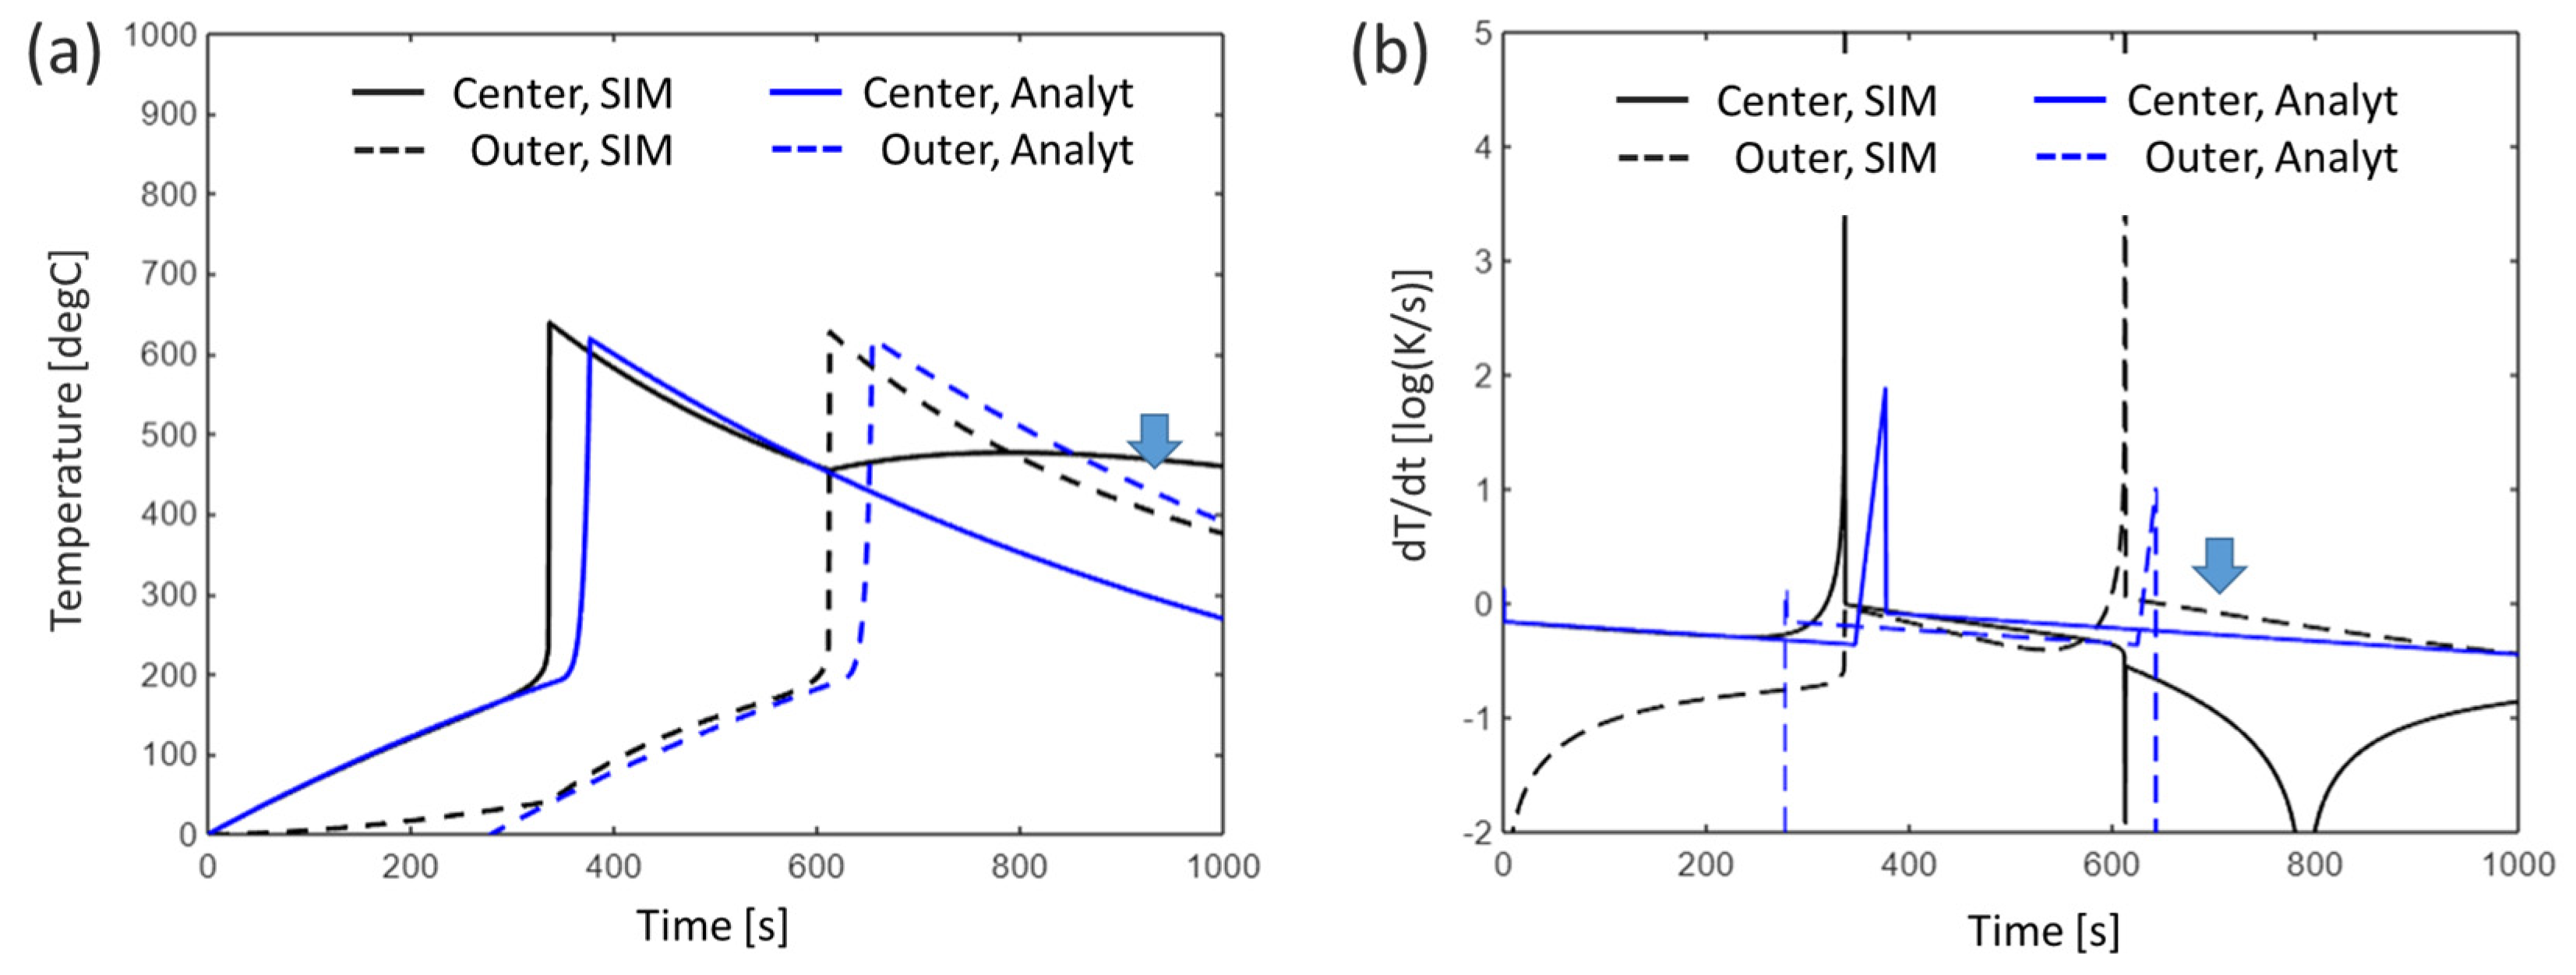
Figure 6a shows the temperature profiles, while Figure 6b presents the temperature change dT/dt. As seen in Figure 5a, in the numerical simulations, the central cell experiences a significant temperature rise around 350 s, and the adjacent cells show a marked temperature increase around 600 s, indicating a thermal runaway spread. The theoretical solution for the temperatures of the central and adjacent cells generally reproduces this trend. Note that, similar to the results for the single cell (refer to Section 3.1.1), the theoretical temperature of both cells’ rise occurs slightly later than the numerical ones. Moreover, in the numerical simulation, the central cell shows a slight temperature increase after 600 s, following an initial rise due to thermal decomposition reactions around 350 s (indicated by the arrows in Figure 6a,b). This indicates the result of thermal influence from the thermal decomposition reactions in the adjacent cells, which is not accounted for in the theoretical solution.

3.2.2. Effect of Thermal Conductivity Between Cells

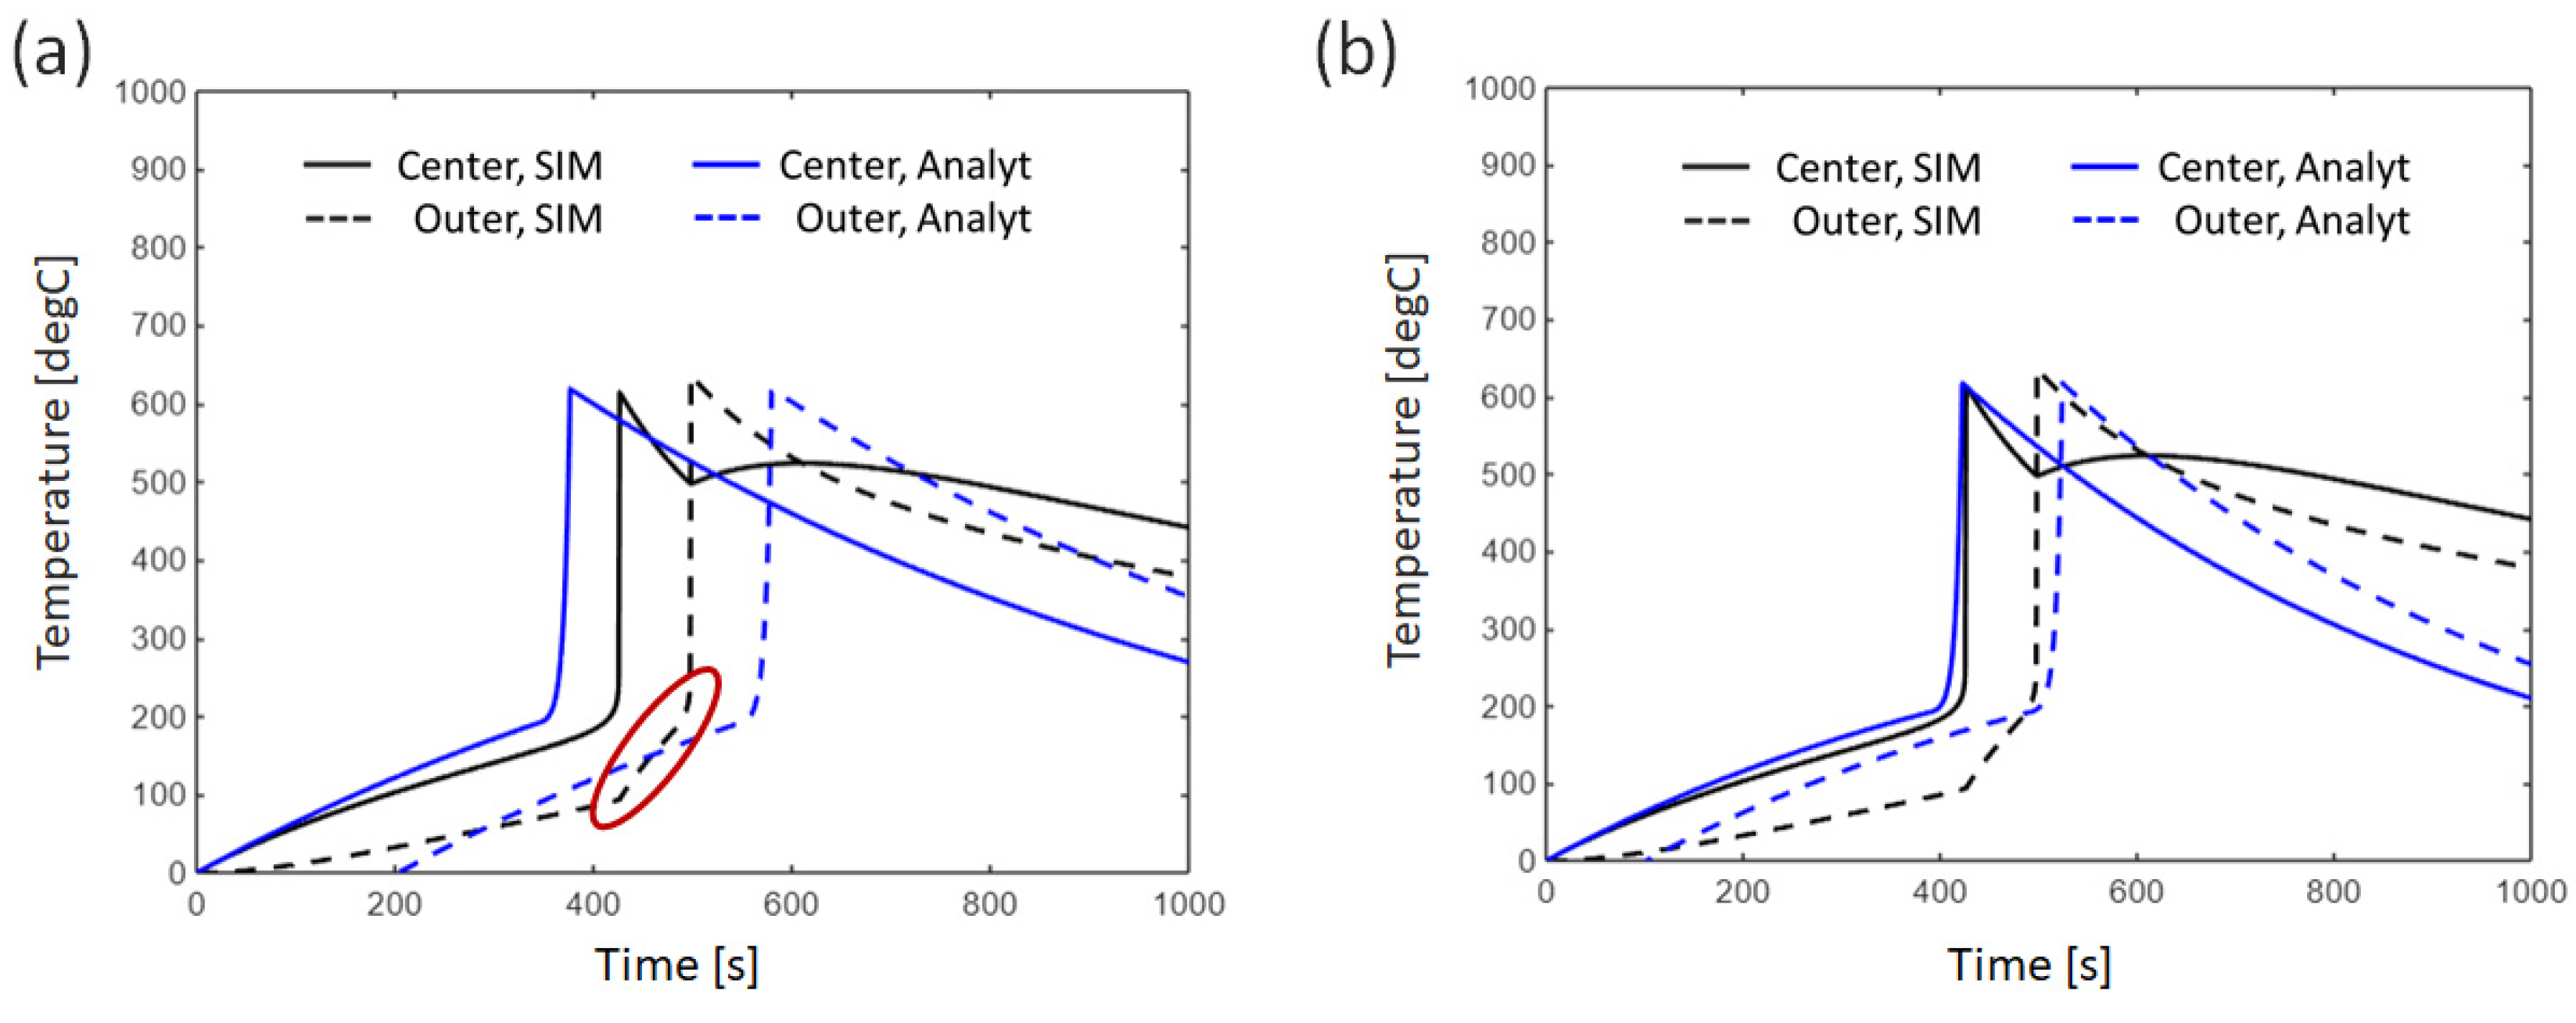
In order to suppress the thermal runaway propagation from cell to cell in battery modules or packs, controlling the thermal conductivity Kcell between cells could be crucial. In this study, while assuming baseline conditions with qheating = 3.0 × 10⁵ (W/m3), the theoretical solution was validated for thermal conductivity between cells. The temperature profiles of multiple battery cells for both the theoretical solution and numerical simulation at Kcell = 0.5 (W/m·K) are shown in Figure 7a. In contrast to the baseline conditions described in Section 3.2.1, the theoretical solution deviates significantly from the numerical simulation.
In the numerical simulation, the central cell experiences a sharp temperature rise around 410 s, while in the theoretical solution, the temperature begins to increase earlier, around 390 s. On the other hand, in the adjacent cells, the temperature rise in the numerical simulation starts at 500 s, while the theoretical solution shows a considerable delay, starting at 600 s. These discrepancies in the temperature profiles can be explained as follows.
In the numerical simulation, as the thermal conductivity Kcell between cells increases, the heat dissipation from the central cell increases, resulting in a delayed temperature rise in the central cell. In the theoretical solution, the heat dissipation of the central cell is influenced only by the heat transfer coefficient h. In order to reproduce the observed trend in the numerical simulation, h needs to be appropriately tuned from the value used in the single-cell analysis. Furthermore, when Kcell increases, the adjacent cells receive more heat from the central cell, causing the onset of thermal decomposition reactions to occur earlier. Particularly, when observing the temperature profile of the adjacent cells between 400 s and 500 s (highlighted in red circles in Figure 7a), the slope of the temperature rise increases compared to earlier periods. This indicates the effect of heat received from the thermal decomposition reaction of the central cell. The parameters affecting the timing of the temperature rise in the adjacent cells (time delay Δt) in the theoretical solution are Kcell and the temperature frequency f. Since the heat received from the central cell lasts about 100 s, the temperature frequency needs to be adjusted to approximately 1/100 (1/s). Therefore, the temperature profiles were re-compared for the theoretical solution (see Figure 7b) with a heat transfer coefficient of h = 70 Wm−2 K−1 and a temperature frequency of f = 0.01 s−1.
It can be seen that the theoretical solution now closely reproduces the temperature profiles from the numerical simulation for both the central and adjacent cells.
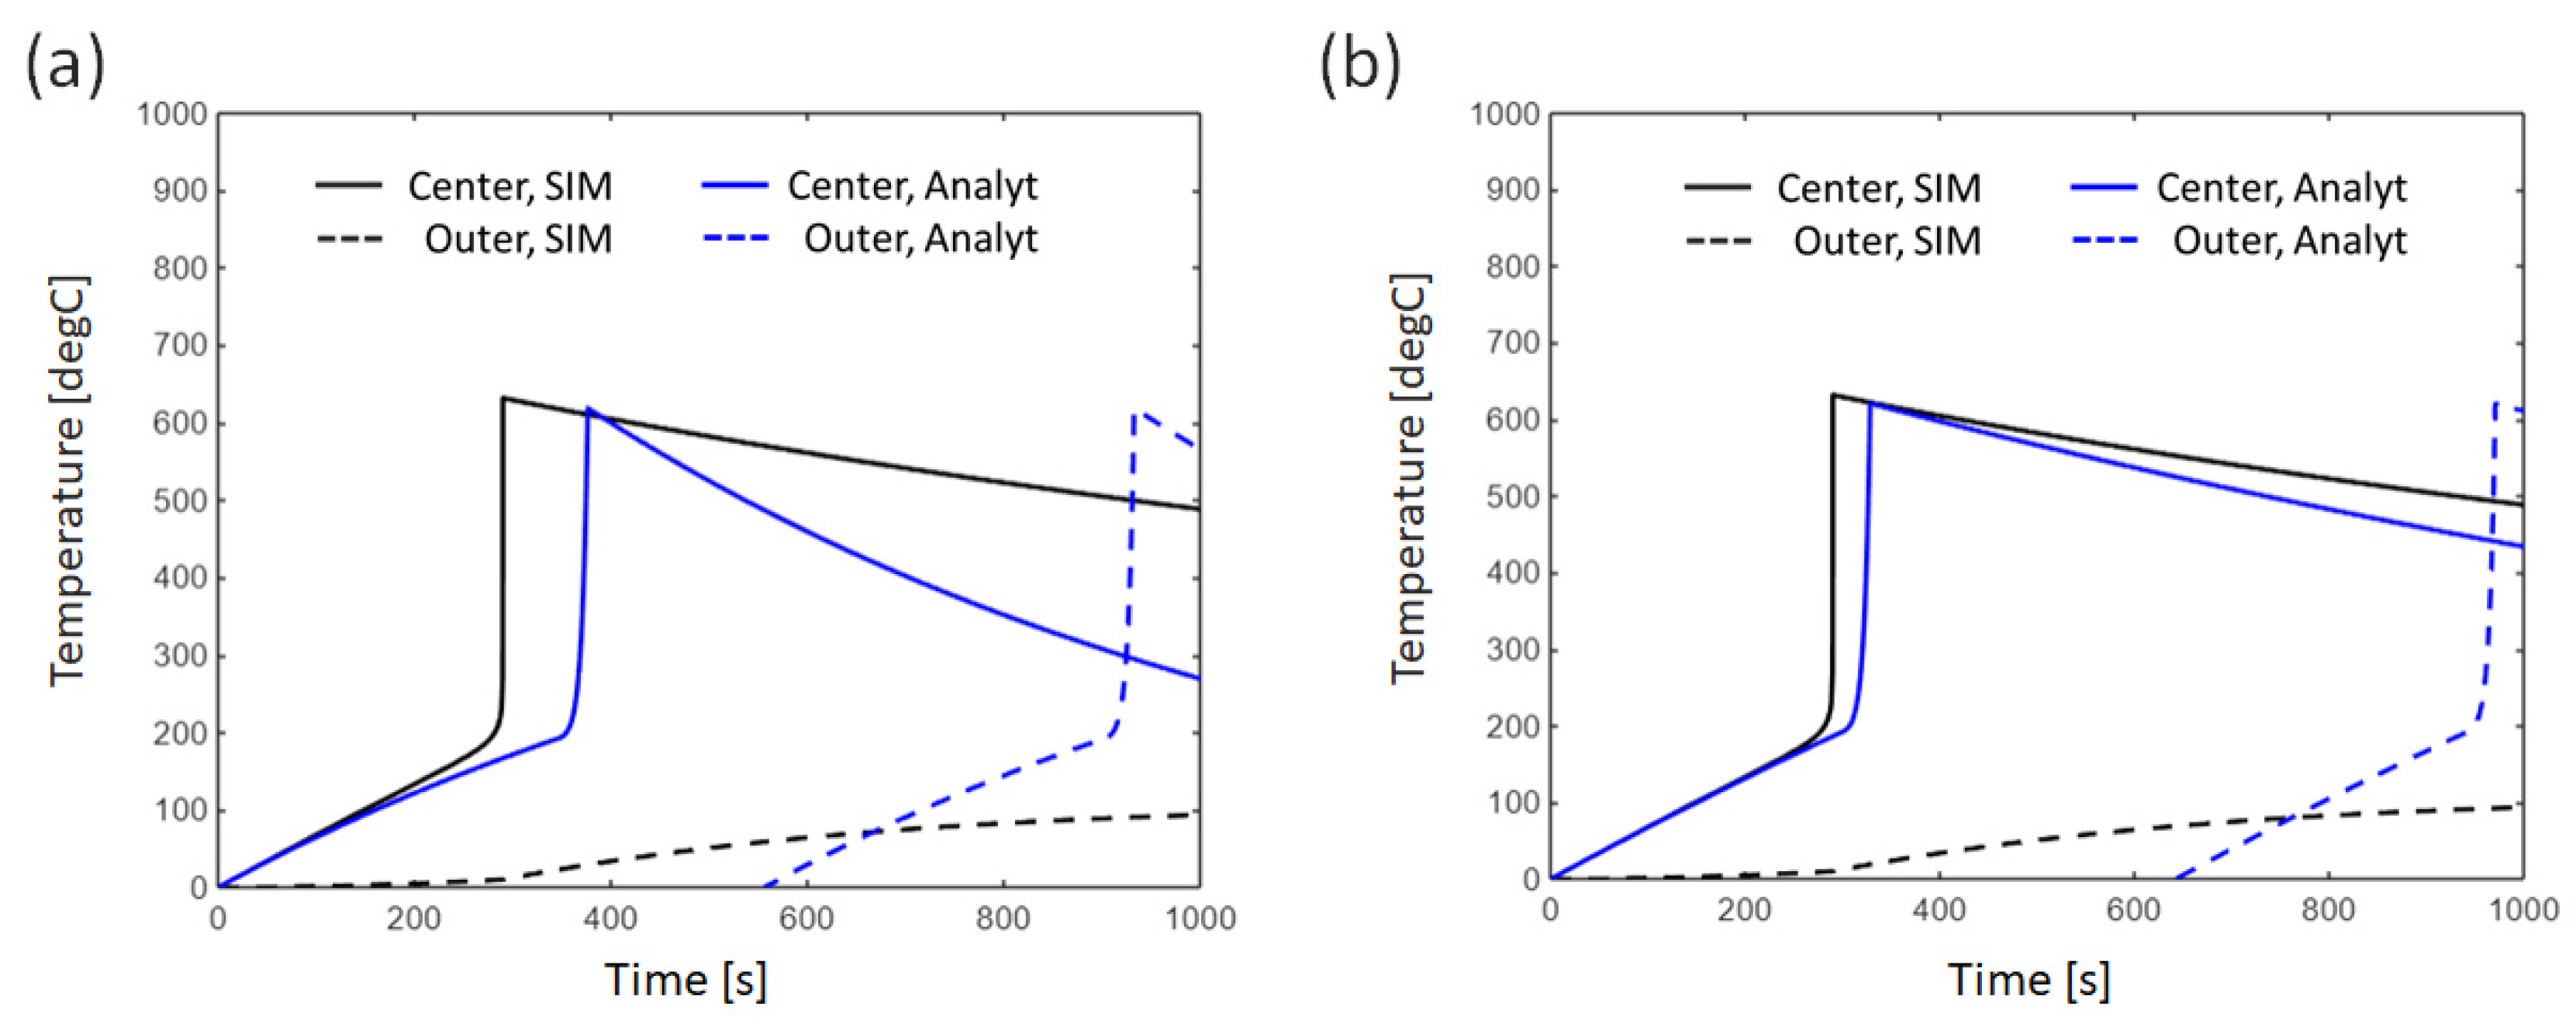
The temperature profiles of multiple battery cells for both the theoretical solution and numerical simulation at Kcell = 0.05 (W/m·K) are shown in Figure 8a. Similar to the case of Kcell = 0.5 (W/m·K), the theoretical solution deviates significantly from the numerical simulation. In the numerical simulation, the central cell experiences a sharp temperature rise around 300 s, while in the theoretical solution, the temperature begins to rise later, around 390 s. On the other hand, in the adjacent cells, there is no temperature increase due to the thermal decomposition reaction in the numerical simulation, while the theoretical solution shows a significant temperature rise around 900 s.
In the numerical simulation, as the thermal conductivity Kcell between cells decreases, the insulation of the central cell improves, which accelerates the timing of the temperature rise in the central cell. In addition, the heat received by the adjacent cells from the central cell decreases, causing the onset of the thermal decomposition reactions to be delayed.
A comparison of the temperature profiles was conducted using a heat transfer coefficient of h = 20 W/(m2·K) and a temperature frequency of f = 1/400 (1/s) in the theoretical solution. The temperature changes of each cell under these conditions are shown in Figure 8b. One can see that the discrepancies in the temperature profiles for both the central and adjacent cells are improved in the theoretical solution.

4. Discussion

4.1. Error Analysis Between Analytical Solutions and Numerical Simulations

First, the differences between the theoretical solution and numerical simulation in the temperature profiles for a single cell are discussed. As evaluation metrics, the difference in maximum temperature ΔTmax and the difference in the time to reach the maximum temperature ΔtTmax are introduced.
Δ T m a x = T m a x , S I M T m a x , A n a l y t
Δ t T m a x = t T m a x , S I M t T m a x , A n a l y t
where Tmax,SIM, Tmax,Analyt means the maximum temperature of the numerical simulation and analytical solution, respectively. tTmax,SIM, tTmax,Analyt means the time to reach the maximum temperature of the numerical simulation and analytical solution, respectively.
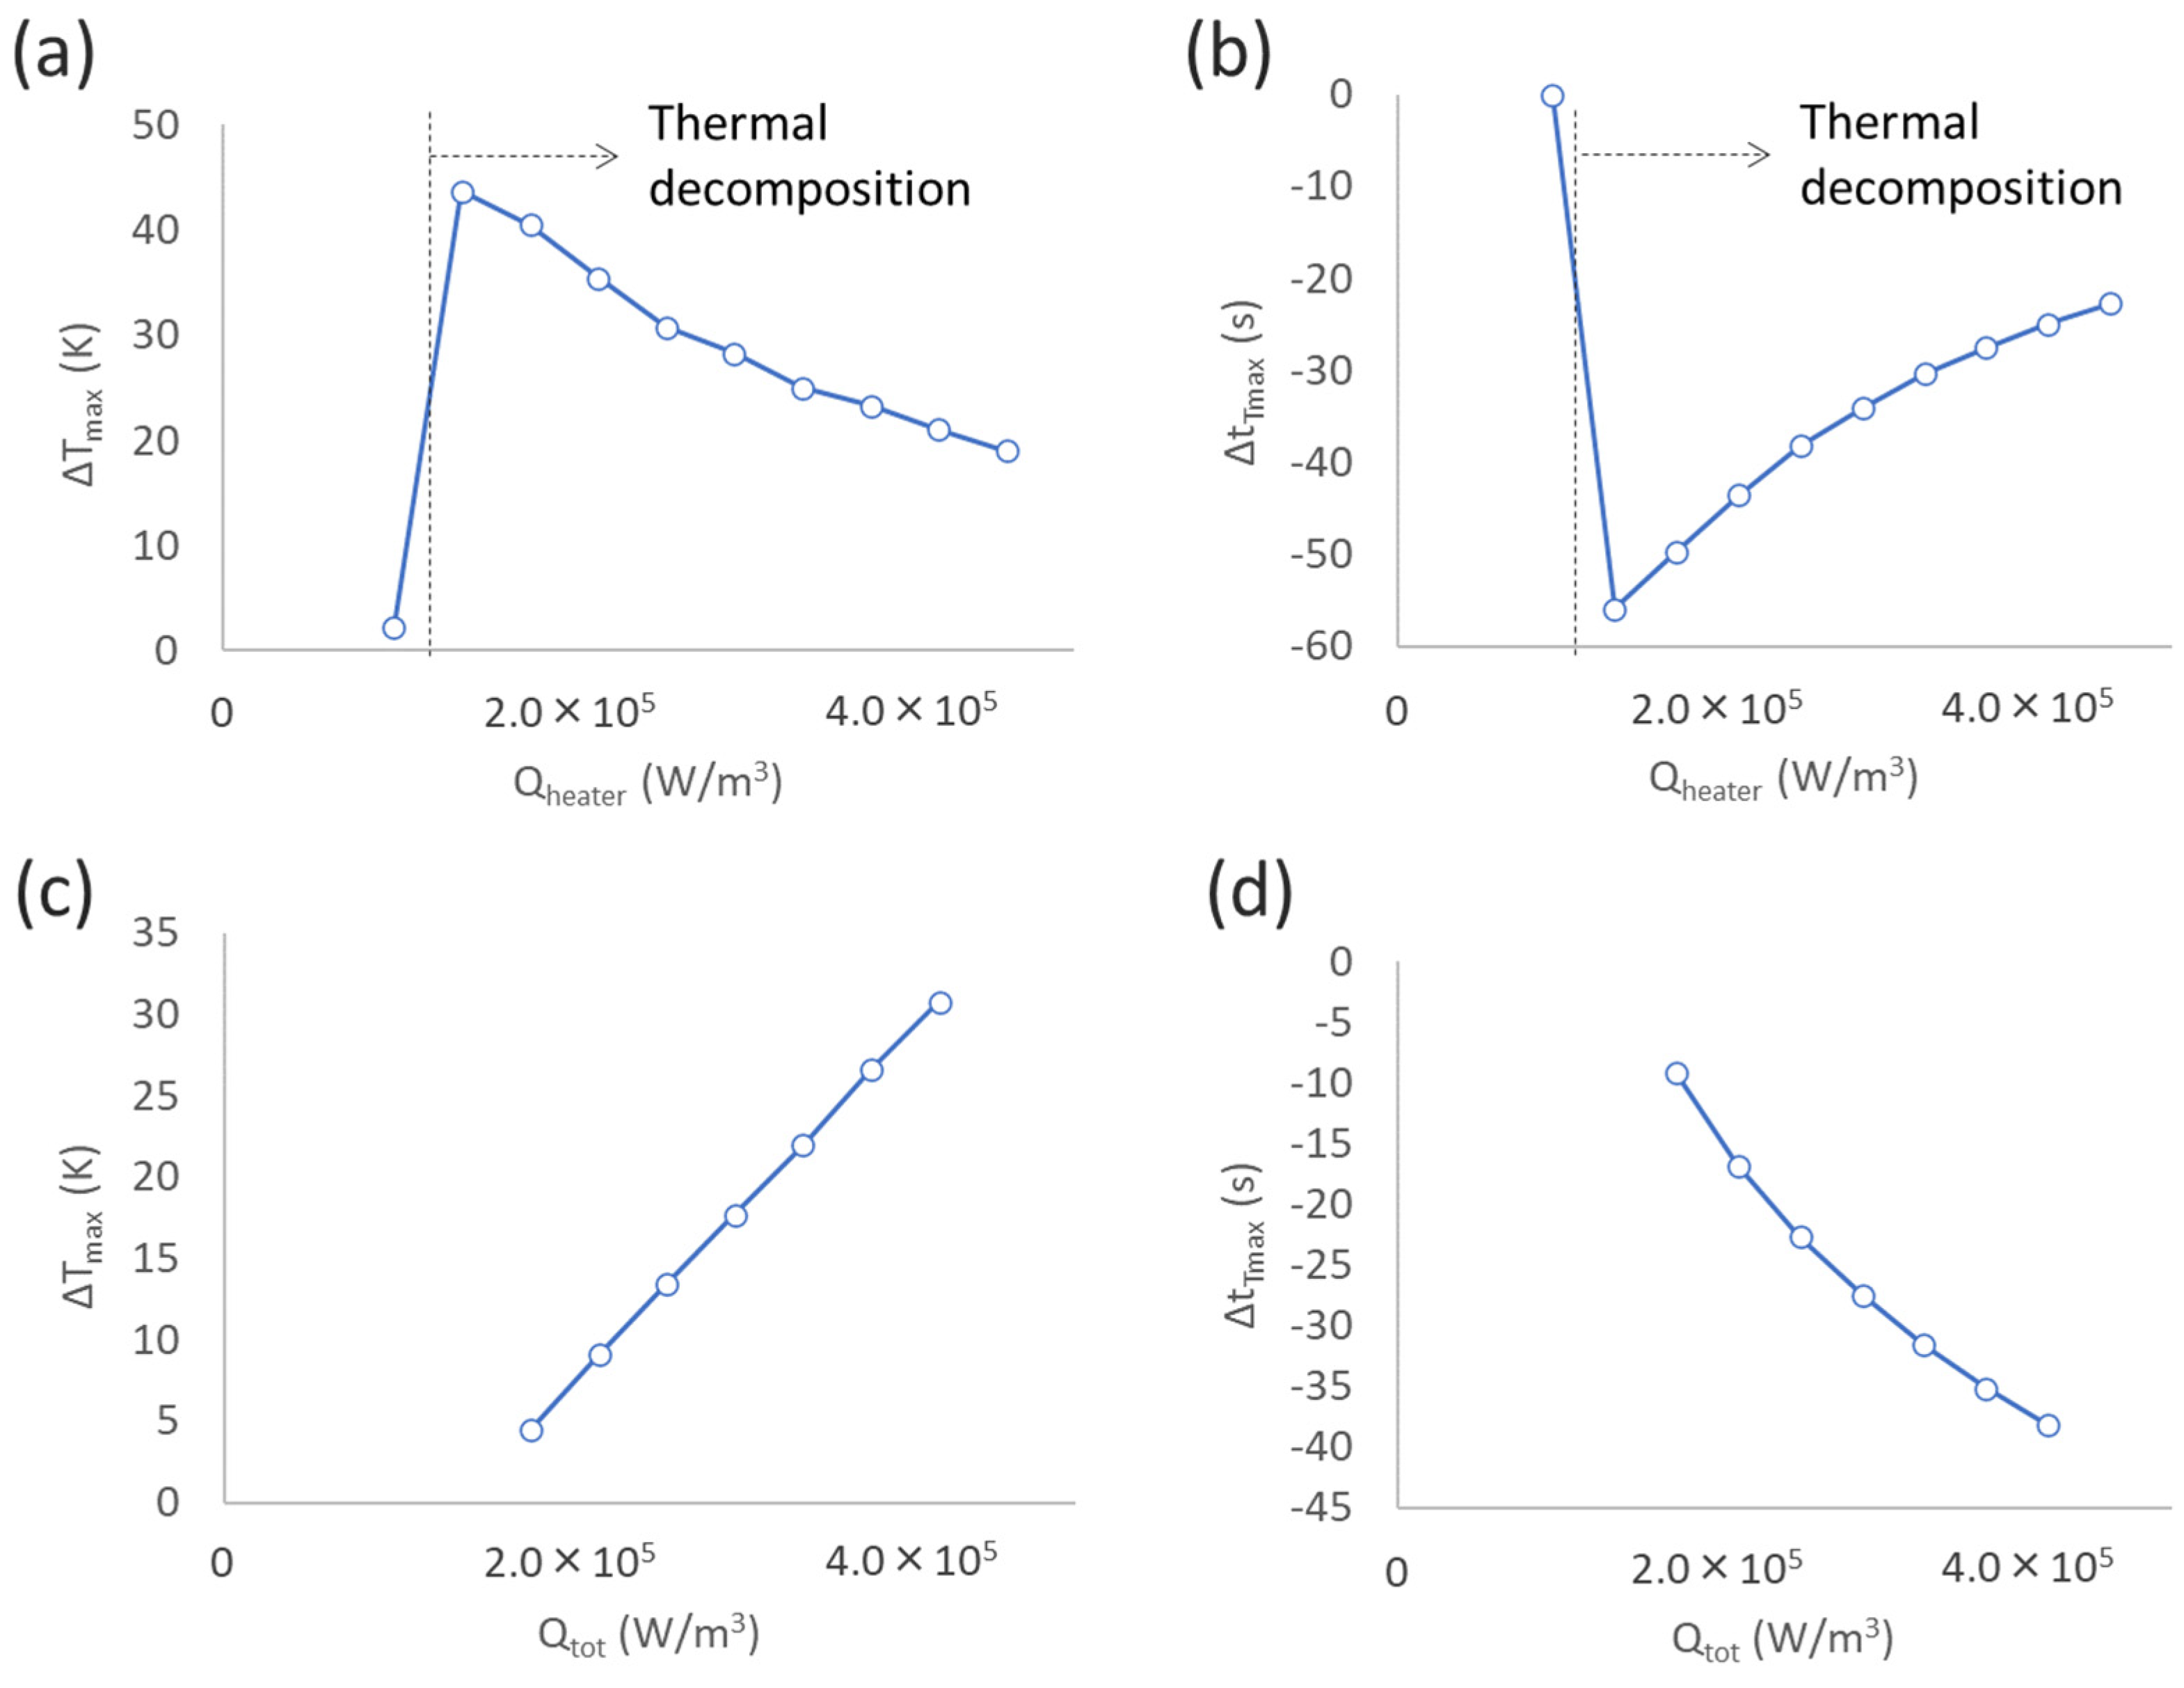
Figure 9a,b show the relationship between various external heating powers qheating and ΔTmax, and qheating and ΔtTmax, respectively. For qheating below 1.5 × 10⁵ (W/m3), no thermal decomposition reaction occurs, and both ΔTmax and ΔtTmax are close to zero. However, for qheating values greater than this threshold, both ΔTmax and ΔtTmax increase sharply. As qheating increases further, both values tend to decrease. This can be explained by the fact that for relatively large qheating values, the cell heating rate increases, making the linear approximation of the thermal decomposition reaction more valid. Figure 9c,d plot ΔTmax and ΔtTmax for various latent heats of the thermal decomposition reaction (Qtot). As Qtot increases, ΔTmax increases almost linearly, while ΔtTmax decreases monotonically. This suggests that as Qtot increases, the nonlinearity of the thermal decomposition reaction becomes more pronounced, leading to a greater divergence from the linear approximation used in the theoretical solution. Based on the above, it can be concluded that in a single cell, the theoretical solution exhibits better accuracy to the numerical simulation as the external heating power is larger and the latent heat of the thermal decomposition reaction is smaller.
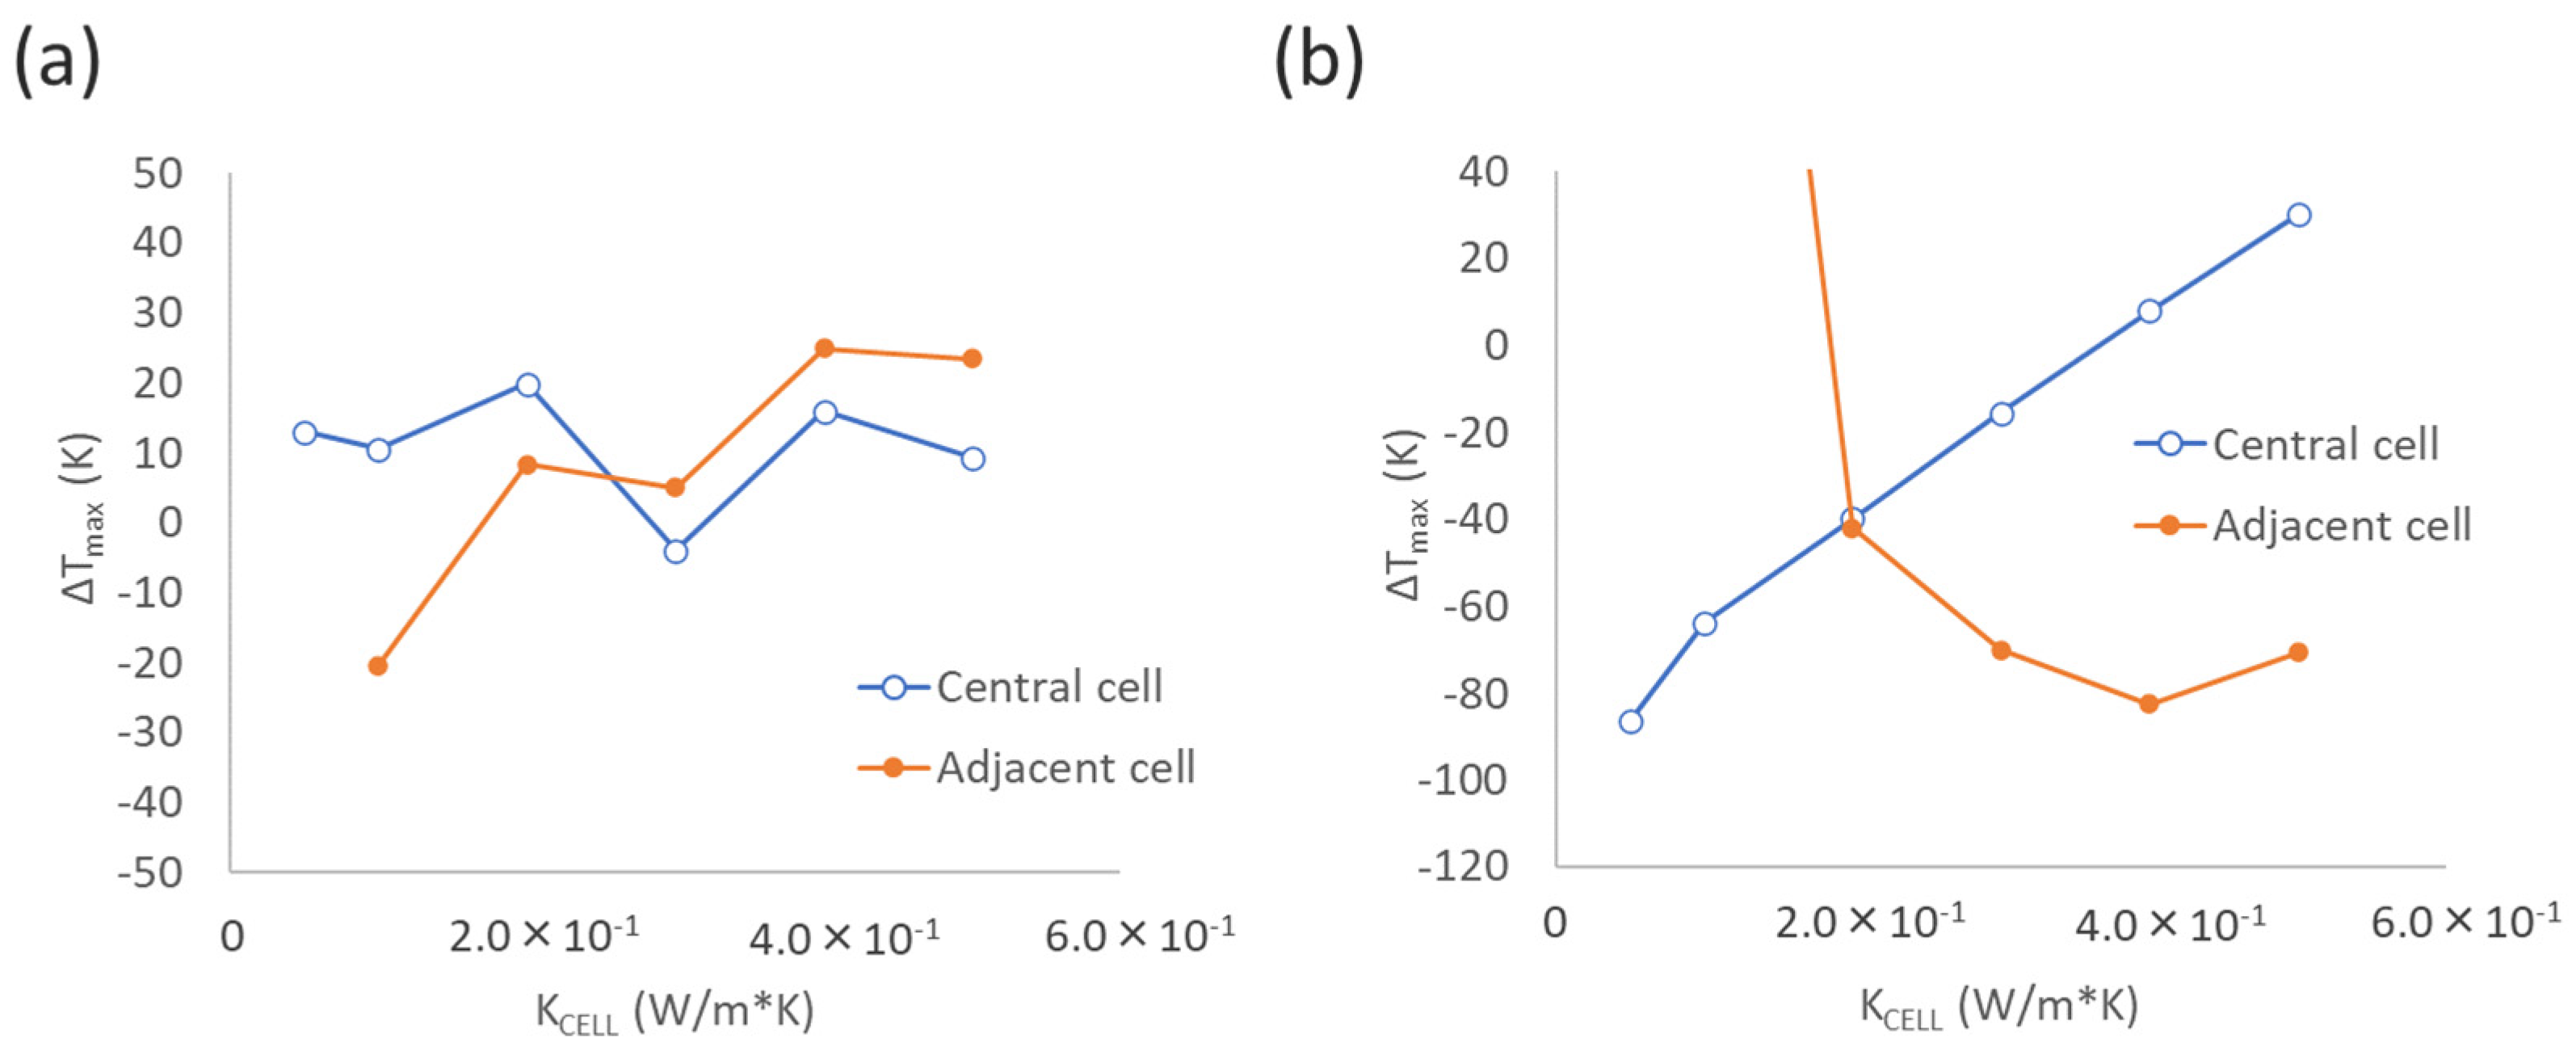
Next, the differences between the theoretical solution and numerical simulation temperature profiles for multiple cells are discussed using the metrics introduced for the single-cell case. Figure 10a,b show plots of ΔTmax and ΔtTmax for various inter-cell thermal conductivities Kcell. The values of ΔTmax fluctuate for both the central and adjacent cells. On the other hand, ΔtTmax increases almost linearly with Kcell for the central cell, changing from negative to positive values around Kcell = 0.4 (i.e., the theoretical solution has an earlier onset of the thermal decomposition reaction than the numerical simulation). In the adjacent cells, ΔtTmax decreases monotonically with Kcell, indicating an increasing delay in the theoretical solution relative to the numerical simulation.
As described in Section 3.2.2, by adjusting the heat transfer coefficient h of the central cell and the temperature frequency f, the temperature profile of the theoretical solution was made to closely align with the numerical simulation. Here, the effective heat transfer coefficient heff of the central cell, corresponding to changes in the thermal conductivity Kcell between cells, is discussed qualitatively.
Since the central cell only exchanges heat with adjacent cells, h can be considered proportional to Kcell. In other words, h = h0 × Kcell/Kcell0, where h0 and Kcell0 represent the heat transfer coefficient and the thermal conductivity between cells under the baseline conditions, respectively. As Kcell increases, the heat coupling between the central cell and adjacent cells becomes stronger. That is, for sufficiently large Kcell, the two cells are effectively integrated, and the effective thermal capacity doubles. In order to represent this “strength of coupling between cells” in terms of heat diffusion length L, it can be expressed as follows:
L L 0 K c e l l / ρ C p t K c e l l 0 / ρ C p t = K c e l l / K c e l l 0
Therefore, the effective thermal capacity ρCp can be written as follows:
ρ C p K c e l l / K c e l l 0
Since the temperature rise term in Equation (12) is exp(−ah/ρCp), considering the changes in Kcell and thermal capacity ρCp, the effective heat transfer coefficient is as follows:
h = K c e l l K c e l l 0 h 0 K c e l l / K c e l l 0 = h 0 K c e l l / K c e l l 0
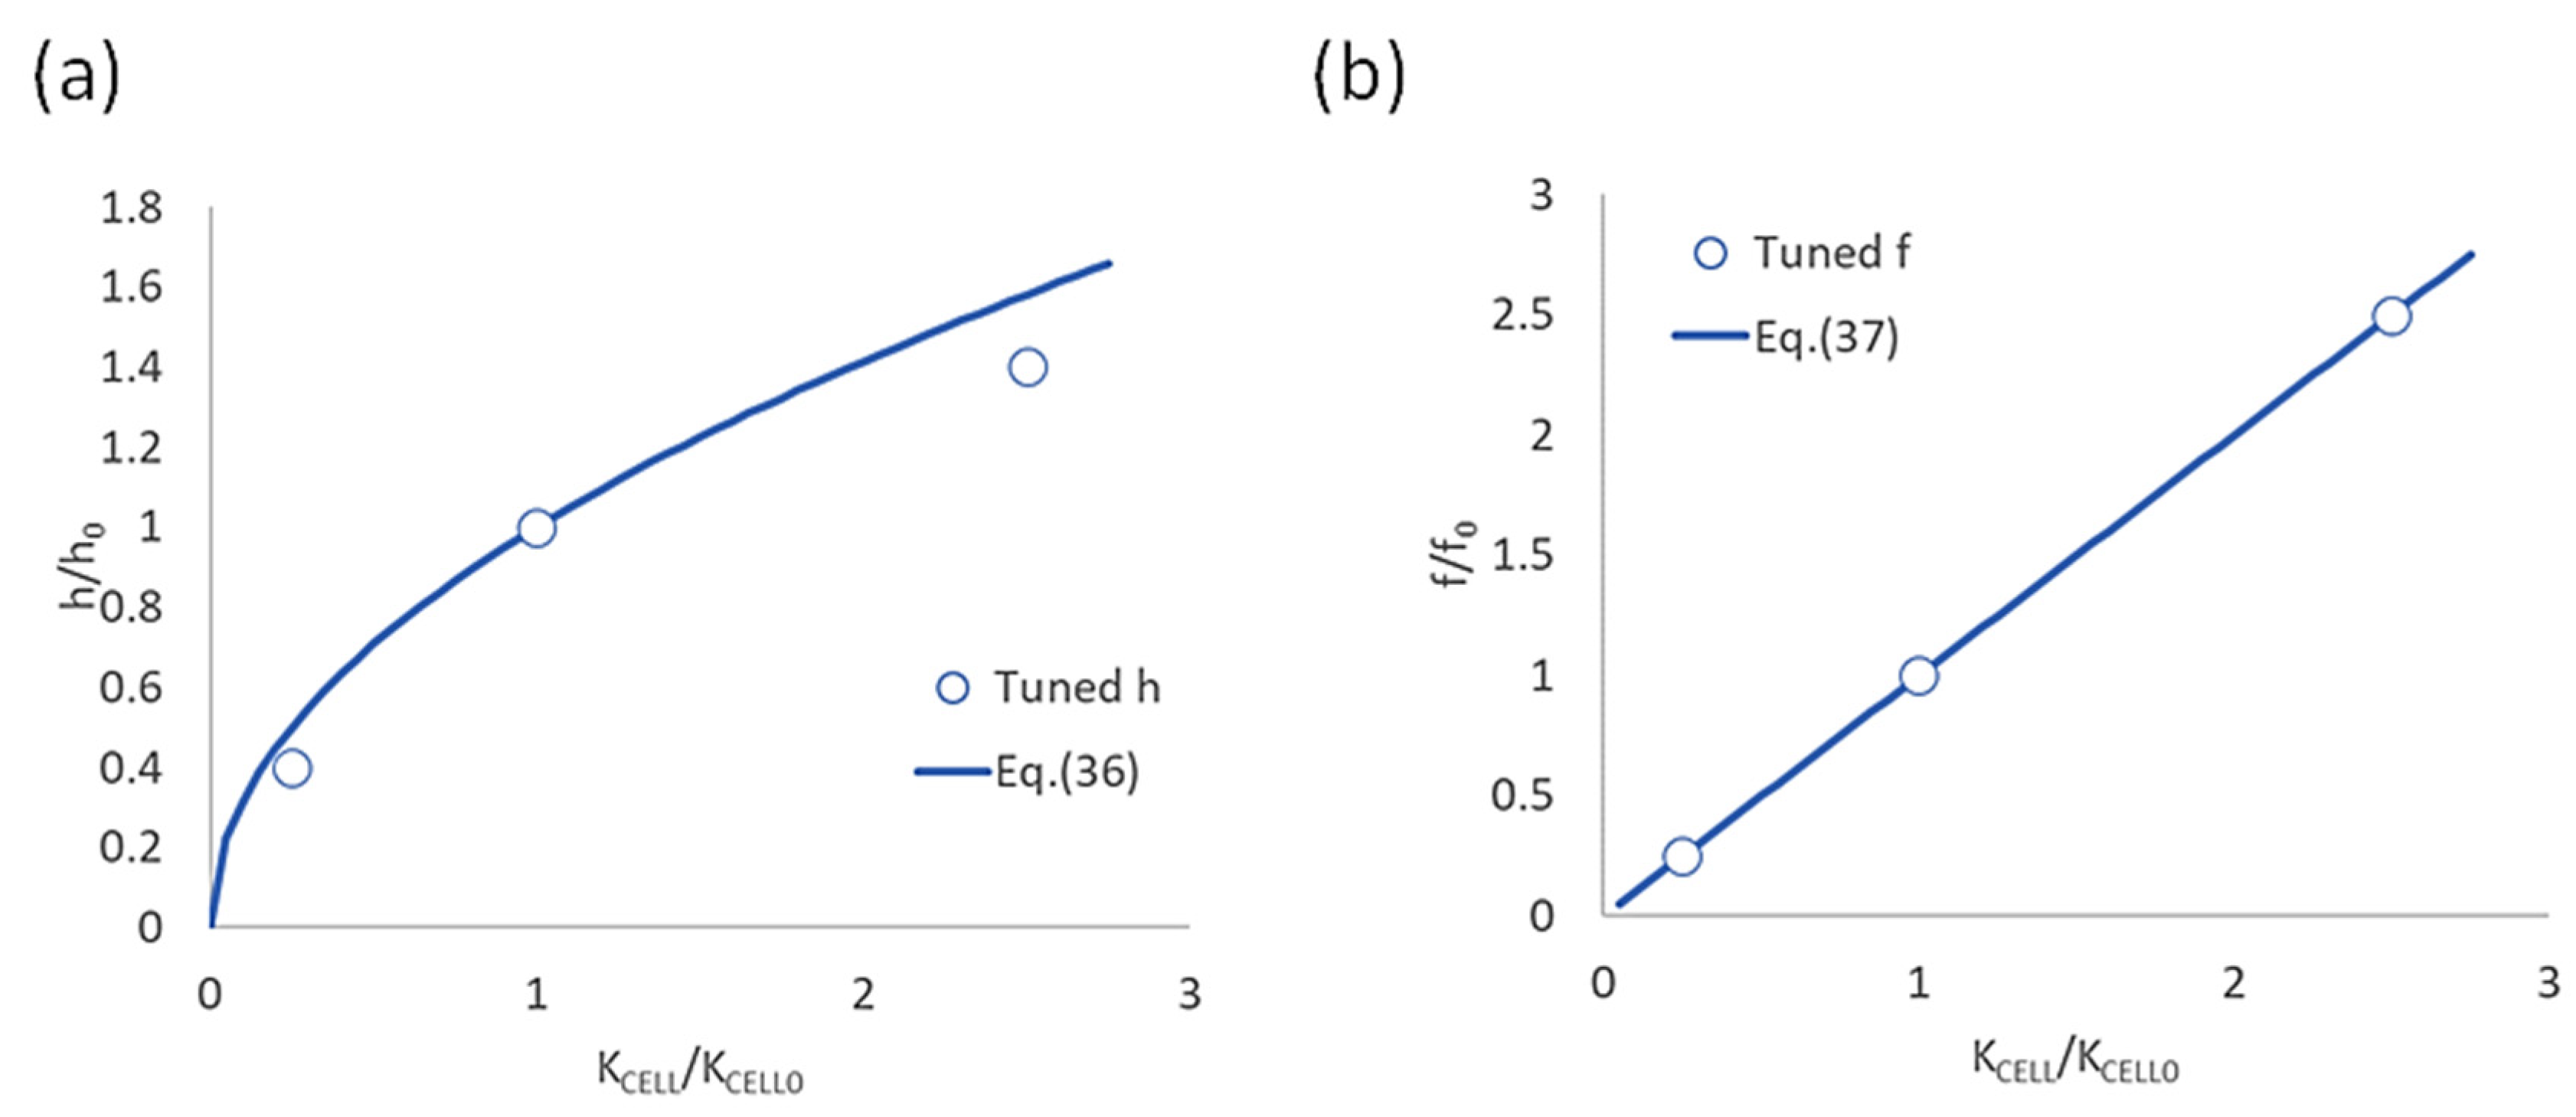
Figure 11a shows the relationship between Kcell/Kcell0 and the adjusted h/h0, as well as the equation above. It is confirmed that the expression in Equation (36) generally reproduces the adjusted values of h.
As well as the heat transfer coefficient h, the Kcell-dependence of the temperature frequency f is considered. Using the heat diffusion length L, the relaxation time τ is given by τ = ρCpKcellL2Kcell, which implies that the frequency f is inversely proportional to Kcell.
f f 0 = K c e l l K c e l l 0
where f0 represents the f value in the baseline condition. Figure 11b shows the relationship between Kcell/Kcell0 and the adjusted f/f0, as well as the plot from Equation (37). One can see that the expression in Equation (37) agrees well with the adjusted values, indicating that the above qualitative modeling demonstrates that there are no contradictions.

4.2. Applicability and Limitations of the Model

As demonstrated above, the proposed model, despite not requiring numerical computation, generally reproduces the temperature profiles of the trigger cell and adjacent cells in the simulation. While there is a tendency to predict a later onset of thermal runaway across all conditions, the prediction accuracy of the maximum cell temperature is high. This allows for a straightforward and numerically stable prediction of the approximate temperature rise and heat propagation behavior during cell heating. Furthermore, the linearization of the thermal decomposition reaction offers the advantage of easily evaluating the sensitivity of parameters such as latent heat and reaction rate. For further improvement of the model accuracy, the following approaches can be considered:
  • Examination of representative α value selection: Clarifying the relationship between thermal decomposition reaction parameters (k0, C1, m, n, E) and the representative α;
  • Improvement of the thermal decomposition reaction linearization method:
    -
    Representation using two linear functions, including the rising region in addition to the maximum slope;
    -
    Representation using a quadratic function. The energy equation will become Riccati-type equations.
  • Creation of an effective parameter database through parametric studies;
  • Consideration of the physical meaning and improvement of the estimation accuracy of parameters R, f, and Δt in multiple-cell systems.
Moreover, this study treated multiple thermal decomposition reactions originating from the positive and negative electrodes as a single overall reaction. This assumption could be a factor causing discrepancies with the actual temperature rise behavior. These aspects will also be addressed in future work. Another crucial point is that approaches using analytical solutions for temperature prediction in multiple cells have limitations, and numerical simulation remains an effective means for accurate prediction that mimics a real-world battery module/pack.

5. Conclusions

This study derived analytical solutions for single- and multiple-cell temperatures during heating and thermal runaway, offering a computationally efficient approximation. Single-cell predictions generally agreed with the numerical results, with better accuracy at higher heating and lower latent heat due to the linear approximation. Analytically, a delay in thermal runaway onset in multiple cells, linearly dependent on inter-cell conductivity, was quantified. Parameter adjustments improved the alignment of analytical and numerical results for multiple cells, enabling rapid thermal assessments. While numerical simulation is needed for high accuracy, this analytical framework provides new insights and facilitates initial analyses.

Author Contributions

Conceptualization, Y.T. and T.Y.; methodology, Y.T.; software, Y.T. and H.K.; validation, Y.T. and T.Y.; formal analysis, Y.T.; resources, Y.T.; writing—original draft preparation, Y.T.; writing—review and editing, T.Y.; supervision, Y.T.; project administration, T.Y. All authors have read and agreed to the published version of the manuscript.

Funding

This research received no external funding.

Institutional Review Board Statement

Not applicable.

Informed Consent Statement

Not applicable.

Data Availability Statement

The original contributions presented in this study are included in the article. Further inquiries can be directed to the corresponding authors.

Conflicts of Interest

All authors were employed by the company Kobelco Research Institute Inc. The authors declare that the research was conducted in the absence of any commercial or financial relationships that could be construed as a potential conflict of interest.

Appendix A

Herein, the conditions of the overall reaction approximation are derived and discussed briefly. According to Equation (3), the total heat generation rate can be expressed as follows.
q t o t = j n p e a k Q t o t , j k j e x p E j R T α j
where npeak indicates the number of the reactions. Here, the representative values are introduced for the activation energy Erep, the latent heat Qtot,rep, the degree of nonreaction αrep, and the reaction rate krep, which can be the average values or the values of the dominant reaction. Equation (11) can be written as follows.
q t o t = Q t o t , r e p k r e p α r e p e x p E r e p R T Θ
Θ = j n p e a k Q t o t , j k j α j Q t o t , r e p k r e p α r e p e x p E j E r e p R T
If the conditions Q t o t , j k j α j ~ Q t o t , r e p k r e p α r e p , indicating similar heat generation rates, and E j E r e p R T , indicating close activation energies, are satisfied, the pre-exponential factor and the exponential function are close to unity, and Θ becomes approximately npeak. In addition, if the condition Q t o t , j k j α j Q t o t , r e p k r e p α r e p is satisfied, the reaction can be neglected. Therefore, under these conditions, the sum of multiple thermal decomposition reactions can be represented as an overall reaction.
Although this study assumes that the conditions of the overall reaction approximation are satisfied, verifying the validity of the approximation for thermal decomposition reactions in various electrodes remains a subject for future work.

References

  1. Xu, C.; Dai, Q.; Gaines, L.; Hu, M.; Tukker, A.; Steubing, B. Future Material Demand for Automotive Lithium-Based Batteries. Commun. Mater. 2020, 1, 99. [Google Scholar] [CrossRef]
  2. Feng, X.; Ouyang, M.; Liu, X.; Lu, L.; Xia, Y.; He, X. Thermal Runaway Mechanism of Lithium Ion Battery for Electric Vehicles: A Review. Energy Storage Mater. 2018, 10, 246–267. [Google Scholar] [CrossRef]
  3. Duan, J.; Tang, X.; Dai, H.; Yang, Y.; Wu, W.; Wei, X.; Huang, Y. Building Safe Lithium-Ion Batteries for Electric Vehicles: A Review. Electrochem. Energ. Rev. 2020, 3, 1–42. [Google Scholar] [CrossRef]
  4. Sun, P.; Bisschop, R.; Niu, H.; Huang, X. A Review of Battery Fires in Electric Vehicles. Fire Technol. 2020, 56, 1361–1410. [Google Scholar] [CrossRef]
  5. Jaguemont, J.; Bardé, F. A Critical Review of Lithium-Ion Battery Safety Testing and Standards. Appl. Therm. Eng. 2023, 231, 121014. [Google Scholar] [CrossRef]
  6. Lai, X.; Yao, J.; Jin, C.; Feng, X.; Wang, H.; Xu, C.; Zheng, Y. A Review of Lithium-Ion Battery Failure Hazards: Test Standards, Accident Analysis, and Safety Suggestions. Batteries 2022, 8, 248. [Google Scholar] [CrossRef]
  7. Svetlík, J.; Tancos, Z.; Tancos, P.; Markova, I.; Slastan, K. Large-Scale Fire Tests of Battery Electric Vehicle (BEV): Slovak Case Study. Appl. Sci. 2024, 14, 4013. [Google Scholar] [CrossRef]
  8. Chai, Z.; Li, J.; Liu, Z.; Liu, Z.; Jin, X. Experimental Analysis and Safety Assessment of Thermal Runaway Behavior in Lithium Iron Phosphate Batteries under Mechanical Abuse. Sci. Rep. 2024, 14, 8673. [Google Scholar] [CrossRef]
  9. Chen, Y.; Kang, Y.; Zhao, Y.; Wang, L.; Liu, J.; Li, Y.; Liang, Z.; He, X.; Li, X.; Tavajohi, N.; et al. A Review of Lithium-Ion Battery Safety Concerns: The Issues, Strategies, and Testing Standards. J. Energy Chem. 2021, 59, 83–99. [Google Scholar] [CrossRef]
  10. Mallarapu, A.; Sunderlin, N.; Boovaragavan, V.; Tamashiro, M.; Peabody, C.; Pelloux-gervais, T.; Li, X.X.; Sizikov, G. Effects of Trigger Method on Fire Propagation during the Thermal Runaway Process in Li-Ion Batteries. J. Electrochem. Soc. 2024, 171, 040514. [Google Scholar] [CrossRef]
  11. Doughty, D.; Roth, E.P. A General Discussion of Li Ion Battery Safety. Electrochem. Soc. Interface 2012, 21, 37. [Google Scholar]
  12. Comanescu, C. Ensuring Safety and Reliability: An Overview of Lithium-Ion Battery Service Assessment. Batteries 2025, 11, 6. [Google Scholar] [CrossRef]
  13. Long, T.; Wang, L.; Kan, C.-D. Experimental and Modeling Approaches for Electric Vehicle Battery Safety: A Technical Review. Eng. Res. Express 2024, 6, 032503. [Google Scholar] [CrossRef]
  14. Abada, S.; Marlair, G.; Lecocq, A.; Petit, M.; Sauvant-Moynot, V.; Huet, F. Safety Focused Modeling of Lithium-Ion Batteries: A Review. J. Power Sources 2016, 306, 178–192. [Google Scholar] [CrossRef]
  15. Sorensen, A.; Utgikar, V.; Belt, J. A Study of Thermal Runaway Mechanisms in Lithium-Ion Batteries and Predictive Numerical Modeling Techniques. Batteries 2024, 10, 116. [Google Scholar] [CrossRef]
  16. Hamisi, C.M.; Chombo, P.V.; Laoonual, Y.; Wongwises, S. An Electrothermal Model to Predict Thermal Characteristics of Lithium-Ion Battery under Overcharge Condition. Energies 2022, 15, 2284. [Google Scholar] [CrossRef]
  17. Li, J.; Sun, D.; Jin, X.; Shi, W.; Sun, C. Lithium-Ion Battery Overcharging Thermal Characteristics Analysis and an Impedance-Based Electro-Thermal Coupled Model Simulation. Appl. Energy 2019, 254, 113574. [Google Scholar] [CrossRef]
  18. Zavalis, T.G.; Behm, M.; Lindbergh, G. Investigation of Short-Circuit Scenarios in a Lithium-Ion Battery Cell. J. Electrochem. Soc. 2012, 159, A848–A859. [Google Scholar] [CrossRef]
  19. Yamanaka, T.; Takagishi, Y.; Tozuka, Y.; Yamaue, T. Modeling Lithium Ion Battery Nail Penetration Tests and Quantitative Evaluation of the Degree of Combustion Risk. J. Power Sources 2019, 416, 132. [Google Scholar] [CrossRef]
  20. Zhang, C.; Santhanagopalan, S.; Sprague, M.A.; Pesaran, A.A. Coupled Mechanical-Electrical-Thermal Modeling for Short-Circuit Prediction in a Lithium-Ion Cell under Mechanical Abuse. J. Power Sources 2015, 290, 102–113. [Google Scholar] [CrossRef]
  21. Zhu, J.; Zhang, X.; Sahraei, E.; Wierzbicki, T. Deformation and Failure Mechanisms of 18650 Battery Cells under Axial Compression. J. Power Sources 2016, 336, 332–340. [Google Scholar] [CrossRef]
  22. Spotnitz, R.; Franklin, J. Abuse Behavior of High-Power, Lithium-Ion Cells. J. Power Sources 2003, 113, 81–100. [Google Scholar] [CrossRef]
  23. Mao, B.; Huang, P.; Chen, H.; Wang, Q.; Sun, J. Self-Heating Reaction and Thermal Runaway Criticality of the Lithium Ion Battery. Int. J. Heat. Mass. Transf. 2020, 149, 119178. [Google Scholar] [CrossRef]
  24. MacNeil, D.D.; Hatchard, T.D.; Dahn, J.R. A Comparison Between the High Temperature Electrode Electrolyte Reactions of LixCoO2 and LixMn2O4. J. Electrochem. Soc. 2001, 148, A663. [Google Scholar] [CrossRef]
  25. Li, W.; León Quiroga, V.; Crompton, K.R.; Ostanek, J.K. High Resolution 3-D Simulations of Venting in 18650 Lithium-Ion Cells. Front. Energy Res. 2021, 9, 788239. [Google Scholar] [CrossRef]
  26. Ostanek, J.K.; Parhizi, M.; Li, W.; Kilaz, G.; Crompton, K.R. CFD-Based Thermal Abuse Simulations Including Gas Generation and Venting of an 18650 Li-Ion Battery Cell. J. Electrochem. Soc. 2023, 170, 090512. [Google Scholar] [CrossRef]
  27. Kim, J.; Mallarapu, A.; Finegan, D.P.; Santhanagopalan, S. Modeling Cell Venting and Gas-Phase Reactions in 18650 Lithium Ion Batteries during Thermal Runaway. J. Power Sources 2021, 489, 229496. [Google Scholar] [CrossRef]
  28. Takagishi, Y.; Tozuka, Y.; Yamanaka, T.; Yamaue, T. Heating Simulation of a Li-Ion Battery Cylindrical Cell and Module with Consideration of Gas Ejection. Energy Rep. 2022, 8, 3176–3188. [Google Scholar] [CrossRef]
  29. Zhang, S.; Zhu, X.; Qiu, J.; Xu, C.; Wang, Y.; Feng, X. Modeling and Simulation of a Gas-Exhaust Design for Battery Thermal Runaway Propagation in a LiFePO4 Module. Batteries 2024, 10, 176. [Google Scholar] [CrossRef]
  30. Ye, Z.; Fu, X. Experimental and Simulation Investigation on Suppressing Thermal Runaway in Battery Pack. Sci. Rep. 2024, 14, 12723. [Google Scholar] [CrossRef]
  31. Choi, Y.; Park, P. Thermal Runaway Diagnosis of Lithium-Ion Cells Using Data-Driven Method. Appl. Sci. 2024, 14, 9107. [Google Scholar] [CrossRef]
  32. Zhang, J.; Wang, Y.; Jiang, B.; He, H.; Huang, S.; Wang, C.; Zhang, Y.; Han, X.; Guo, D.; He, G.; et al. Realistic Fault Detection of Li-Ion Battery via Dynamical Deep Learning. Nat. Commun. 2023, 14, 5940. [Google Scholar] [CrossRef] [PubMed]
  33. Naha, A.; Khandelwal, A.; Agarwal, S.; Tagade, P.; Hariharan, K.S.; Kaushik, A.; Yadu, A.; Kolake, S.M.; Han, S.; Oh, B. Internal Short Circuit Detection in Li-Ion Batteries Using Supervised Machine Learning. Sci. Rep. 2020, 10, 1301. [Google Scholar] [CrossRef] [PubMed]
  34. Domalanta, M.R.B.; Paraggua, J.A.D.R. A Multiphysics Model Simulating the Electrochemical, Thermal, and Thermal Runaway Behaviors of Lithium Polymer Battery. Energies 2023, 16, 2642. [Google Scholar] [CrossRef]
  35. Zhang, E.; Dao, M.; Karniadakis, G.E.; Suresh, S. Analyses of Internal Structures and Defects in Materials Using Physics-Informed Neural Networks. Sci. Adv. 2022, 8, eabk0644. [Google Scholar] [CrossRef]
  36. Zhao, R.; Lai, Z.; Li, W.; Ye, M.; Yu, S. Development of a Coupled Model of Heat Generation and Jet Flow of Lithium-Ion Batteries during Thermal Runaway. J. Energy Storage 2023, 63, 107048. [Google Scholar] [CrossRef]
  37. Feng, X.; Zhang, F.; Feng, J.; Jin, C.; Wang, H.; Xu, C.; Ouyang, M. Propagation Dynamics of the Thermal Runaway Front in Large-Scale Lithium-Ion Batteries: Theoretical and Experiment Validation. Int. J. Heat. Mass. Transf. 2024, 225, 125393. [Google Scholar] [CrossRef]
  38. He, T.; Zhang, T.; Gadkari, S.; Wang, Z.; Mao, N.; Cai, Q. An Investigation on Thermal Runaway Behaviour of a Cylindrical Lithium-Ion Battery under Different States of Charge Based on Thermal Tests and a Three-Dimensional Thermal Runaway Model. J. Clean. Prod. 2023, 388, 135980. [Google Scholar] [CrossRef]
  39. Feng, Y.-F.; Wang, C.; Shen, J.-N.; He, Y.-J. Kinetic Resolution of Thermal Runaway for Lithium-Ion Batteries: A Gaussian Surrogate-Assisted Separate Optimization Approach. Chem. Eng. Sci. 2023, 277, 118875. [Google Scholar] [CrossRef]
  40. Zhou, H.; Parmananda, M.; Crompton, K.R.; Hladky, M.P.; Dann, M.A.; Ostanek, J.K.; Mukherjee, P.P. Effect of Electrode Crosstalk on Heat Release in Lithium-Ion Batteries under Thermal Abuse Scenarios. Energy Storage Mater. 2022, 44, 326–341. [Google Scholar] [CrossRef]
  41. Zhang, P.; Chen, H.; Yang, K.; Lu, Y.; Huang, Y. Accelerated Computational Strategies for Multi-Scale Thermal Runaway Prediction Models in Li-Ion Battery. Energy 2024, 305, 132371. [Google Scholar] [CrossRef]
  42. Peng, R.; Kong, D.; Ping, P.; Wang, G.; Gao, X.; Lv, H.; Zhao, H.; He, X.; Zhang, Y.; Dai, X. Thermal Runaway Modeling of Lithium-Ion Batteries at Different Scales: Recent Advances and Perspectives. Energy Storage Mater. 2024, 69, 103417. [Google Scholar] [CrossRef]
  43. Zhang, P.; Lu, J.; Yang, K.; Chen, H.; Huang, Y. A 3D Simulation Model of Thermal Runaway in Li-Ion Batteries Coupled Particles Ejection and Jet Flow. J. Power Sources 2023, 580, 233357. [Google Scholar] [CrossRef]
  44. Liu, Y.; He, C.; Offer, G.; Wang, H.; Huang, X.; Zhao, T. Modelling Thermal Runaway of Cylindrical Battery under Sub-Atmospheric Pressure. J. Power Sources 2025, 633, 236363. [Google Scholar] [CrossRef]
  45. Wu, X.; Hu, Y.; Wu, T.; Zhuo, Z.; Qiu, H.; Zhu, Y.; Li, X.; Tang, R. Numerical Simulation Study of Thermal Runaway Jet Fire Characteristics of Forced Air-Cooled Cylindrical Battery Module. Case Stud. Therm. Eng. 2025, 66, 105750. [Google Scholar] [CrossRef]
  46. Semenoff, N. Zur Theorie des Verbrennungsprozesses. Z. Phys. 1928, 48, 571. [Google Scholar] [CrossRef]
  47. Thomas, P.H. Effect of Reactant Consumption on the Induction Period and Critical Condition for a Thermal Explosion. Proc. R. Soc. Lond. A 1961, 262, 192–206. [Google Scholar] [CrossRef]
  48. Frank-Kamenetskii, D.A. Diffusion and Heat Exchange in Chemical Kinetics; Princeton University Press: Princeton, NJ, USA, 1955. [Google Scholar]
  49. Padhi, U.P.; Oh, J.; Mehrotra, A.; Lee, Y.; Yoh, J.J. A Predictive Theory on Thermal Runaway of Ultrahigh Capacity Lithium-Ion Batteries. Combust. Flame 2023, 258, 113116. [Google Scholar] [CrossRef]
  50. An, Z.; Shah, K.; Jia, L.; Ma, Y. Modeling and Analysis of Thermal Runaway in Li-Ion Cell. Appl. Therm. Eng. 2019, 160, 113960. [Google Scholar] [CrossRef]
  51. Zhao, P.; Liu, L.; Chen, Y.; Ge, H. Theoretical and Numerical Analysis for Thermal Runaway Propagation within a Single Cell. Int. J. Heat Mass Transf. 2021, 181, 121901. [Google Scholar] [CrossRef]
  52. Huang, P.; Chen, H.; Verma, A.; Wang, Q.; Mukherjee, P.; Sun, J. Non-Dimensional Analysis of the Criticality of Li-Ion Battery Thermal Runaway Behavior. J. Hazard. Mater. 2019, 369, 268–278. [Google Scholar] [CrossRef] [PubMed]
  53. Larsson, F.; Anderson, J.; Andersson, P.; Mellander, B.-E. Thermal Modelling of Cell-to-Cell Fire Propagation and Cascading Thermal Runaway Failure Effects for Lithium-Ion Battery Cells and Modules Using Fire Walls. J. Electrochem. Soc. 2016, 163, A2854–A2865. [Google Scholar] [CrossRef]
  54. Ioka, S.; Kubo, S.; Ochi, M.; Hojo, K. Development of inverse analysis method using a plate model for estimation of temperature distribution history of an elbow with thermal stratification. Trans. JSME 2014, 80, 818. [Google Scholar] [CrossRef]
  55. Laloui, L.; Rotta Loria, A.F. Analysis and Design of Energy Geostructures; Elsevier: Amsterdam, The Netherlands, 2019. [Google Scholar]
Figure 1. Examples of the temperature changes in a single cell (left) and multiple cells (right).
Applsci 15 06574 g001
Figure 2. (a) Arrhenius-type heat generation functions (blue line) and linearized function (dotted red line). Total latent heat of the former (area surrounded by blue line and x-axis) coincide with those of the latter (orange colored area). (b) Typical temperature profile of battery cell in external heating test using Equations (12), (16), and (23).
Applsci 15 06574 g002
Figure 3. (a) Battery cell temperature profiles under baseline conditions in both analytical and numerical approaches. (b) Comparison of time derivative of cell temperatures. (c) Time evolution of unreacted fraction α.
Applsci 15 06574 g003
Figure 4. (a) Battery cell temperature profiles under various external heating conditions in both analytical and numerical approaches. (b) Time derivative of cell temperature. (c) Time evolution of unreacted fraction α.
Applsci 15 06574 g004
Figure 5. (a) Battery cell temperature profiles under various conditions of latent heat of thermal decomposition reaction in both analytical and numerical approaches. (b) Time derivative of cell temperature. (c) Time evolution of unreacted fraction α.
Applsci 15 06574 g005
Figure 6. (a) Cell temperature profiles under various conditions of latent heat of thermal decomposition reaction in both analytical and numerical approaches. (b) Time derivative of cell temperature. Each arrow indicates slight temperature increase in the central cell.
Applsci 15 06574 g006
Figure 7. (a) Temperature profiles of multiple battery cells for both the theoretical solution and numerical simulation at Kcell = 0.5 (W/m·K). (b) Temperature profiles of multiple cells with tuned parameters in the theoretical solution.
Applsci 15 06574 g007
Figure 8. (a) Temperature profiles of multiple battery cells for both the theoretical solution and numerical simulation at Kcell = 0.05 (W/m·K). (b) Temperature profiles of multiple cells with tuned parameters in the theoretical solution.
Applsci 15 06574 g008
Figure 9. Relationship between various external heating powers Qheating and (a) ΔTmax and (b) ΔtTmax. Plot of (c) ΔTmax and (d) ΔtTmax for various latent heats of the thermal decomposition reaction.
Applsci 15 06574 g009
Figure 10. Plots between thermal conductivity between cells’ Kcell and (a) ΔTmax and (b) ΔtTmax.
Applsci 15 06574 g010
Figure 11. (a) Relationship between Kcell/Kcell0 and the adjusted h/h0 and (b) relationship between Kcell/Kcell0 and the adjusted f/f0.
Applsci 15 06574 g011
Table 1. Parameters for theoretical analysis and simulation for battery thermal runaway.
ParameterValueReference
Density500 (kg/m3)Assumed *1
Specific heat750 (J/kg)[28]
Specific surface area10 (1/m)Assumed *2
Environment temperature, Tenv298 (K)Assumed
Heat transfer coefficient, ht 50 (W/m2·K)Assumed *3
External heating, qheating
(Baseline)
Single cell 4.00 × 10⁵ (W/m3)
Multiple cells 3.0 × 10⁵ (W/m3)
Assumed *4
*1 While the typical density of electrodes ranges from 1000 to 2000 (kg/m3) [19,28,51], the effective density including pack aging materials is generally lower. Herein, a provisional value is adopted. *2 The specific surface area of a cylindrical 18,650 battery cell (18 mm in diameter, 65 mm in height) with insulated sides and bottom exhibits a value of this order by simple calculation. *3 This value corresponds to cooling by forced convection at a few meters per second [55]. *4 For instance, this value is obtained when heating with a 10 W, 50 mm × 50 mm polyimide heater.
Table 2. Parameters of thermal decomposition reaction.
Latent heat, Qtot,i (baseline)3.22 × 10⁵ (J/m3)[19]
Frequency factor, 5.00 × 10¹³ (1/s)[19]
Activation energy, EiR × 1.85 × 10⁴ (J/mol)[19]
Constant, m1[19]
Constant, n1[19]
Constant, C1.01[19]
Table 3. Parameters for multiple-cell modeling.
Thermal conductivity between cells, Kcell (baseline)0.2 (W/m·K)Assumed *5
Temperature frequency, f (baseline)1/400 (1/s)Assumed *5
Space between cells, Dcell1.8 × 10−3 (m)Assumed *5
*5 It varies depending on cell placement, conditions, etc. Herein, a provisional value is adopted.
Disclaimer/Publisher’s Note: The statements, opinions and data contained in all publications are solely those of the individual author(s) and contributor(s) and not of MDPI and/or the editor(s). MDPI and/or the editor(s) disclaim responsibility for any injury to people or property resulting from any ideas, methods, instructions or products referred to in the content.