Article

BioSuiteT: A Unified Tool for Biological Sequence Analysis

by
Victor Terron-Macias
1,
Jezreel Mejia
2,*,
Mirna Muñoz
2,
Miguel Terron-Hernandez
3,*,
Miguel Canseco-Perez
4,*,
Roberto Berrones-Hernández
4 and
Yadira Quiñonez
5
1
Academic Unit of Computer Science, Tecnologico de Monterrey, Monterrey 64700, Mexico
2
Software Engineering Unit, Research Centre in Mathematics, Zacatecas 98160, Mexico
3
Industrial Maintenance Engineering Department, Technological University of Tlaxcala, Tlaxcala 90500, Mexico
4
Agroindustrial Engineering Department, Polytechnic University of Chiapas, Suchiapa 29150, Mexico
5
Informatics Department, Autonomous University of Sinaloa, Culiacán 80050, Mexico
*
Authors to whom correspondence should be addressed.
Appl. Sci. 2025, 15(12), 6565; https://doi.org/10.3390/app15126565
Submission received: 16 April 2025 / Revised: 1 June 2025 / Accepted: 4 June 2025 / Published: 11 June 2025
(This article belongs to the Section Applied Biosciences and Bioengineering)

Simple Summary

People working with biological information in a field such as bioinformatics often struggle to analyze their data because they need to use multiple complex computer programs that require specialized technical knowledge. We created a user-friendly application called BioSuiteT that combines many essential tools for analyzing biological information into a unified platform. Our goal was to help users spend more time on their research and less time dealing with technical difficulties. We tested our platform with 73 users and found that they spent significantly less time setting up and switching between different tools compared to existing software. BioSuiteT allows users to study DNA sequences, protein structures, compare genetic information between species, and perform other important analyses through a simple web browser without needing advanced computer skills, but also by providing a local installer if required. By removing technical barriers, BioSuiteT enables scientists to focus on solving important biological questions that can benefit human health and our understanding of life.

Abstract

The increasing complexity and fragmentation of bioinformatics tools presents significant challenges for researchers, particularly those without extensive programming expertise. This research presents BioSuiteT v1.0, a unified web-based platform that integrates multiple bioinformatics tools into a single, user-friendly environment. BioSuiteT incorporates twelve core functionalities, including DNA and protein sequence analysis, transcription processes, sequence alignment, BLAST integration, PDB visualization and analysis, phylogenetic tree construction, MOTIFS analysis, and regular expression searching. The platform was developed using the Django framework and MongoDB, following ISO/IEC 29110 standards. Performance testing demonstrated the platform’s capability to handle concurrent users while maintaining stable performance with reduced memory usage. Validation testing involving eight researchers, five bioinformatics experts, and sixty practitioners showed a 95% reduction in technical support requirements compared to traditional installable tools and a 90% reduction in tool switching time. BioSuiteT effectively addresses key challenges identified in bioinformatics software usage, including installation barriers, programming expertise requirements, and tool fragmentation, while maintaining the necessary functionality for biological sequence analysis.

1. Background

Biological sequence analysis represents one of the most important activities in the bioinformatics field [1], significantly enhanced by advances in the computational field due the voluminous and incremental datasets and analysis methods [2]; it spans a wide range of disciplines, each focusing on the comprehensive study of a specific type of biological sequence, including genomics, transcriptomics, and proteomics [3,4], which are some of the most prominent omics fields, each contributing to insights into the complex interactions of biological systems [5,6,7]. Integrating multiple types of biological sequence data is often referred to as multi-omics, which is used to analyze different biological processes [8].
Moreover, researchers face significant challenges in data analysis due to the large amount of biological data and the integration of multiple tools that can efficiently complete the analysis [9]. Some bioinformatics tools focus on specific data types and lack interoperability between them; to analyze these data, it is required to integrate these tools properly [10].
Nevertheless, recent advances in bioinformatics have led to the development of integrated platforms that aim to overcome these limitations by providing a unified environment for data analysis [11]. Notable examples include ExPASy [12], a global web server for the biology field supplied by the Swiss Bioinformatics Institute, which focuses on offering access to a wide range of databases and analytical tools [13]. Another notable example is NCBI Tools [14], which provides various tools for analyzing, downloading, and visualizing biological data [15].
Additionally, there is a diverse range of bioinformatics tools such as BioPython v1.81, a Python library that comprises a set of modules for performing different types of biological tasks [16]; Cogent3, a Python library that analyzes biological sequence data [17]; Cactus, an open-source software program used for performing genome alignments [18]; PyCogent, a software library for genomic biology that provides a framework for analyzing biological sequences, plot generation, and other tasks [19]; PyEvolve, an open-source Python framework for implementing genetic algorithms to model and simulate evolutionary processes within biological sequences [20]; and FungiRegEx v1.0, a web application with a GUI used for regular expression detection in fungal genomes [21], among other tools that mostly are focused on performing a specific task.
However, many existing bioinformatics software programs require computational expertise due to their complexity, limiting their accessibility to a broader scientific audience that may not be directly involved in the computational field. This includes platforms that integrate multiple tools into a unified environment but remain challenging when used [9].
Moreover, many surveys and studies confirm that the challenges associated with using bioinformatics software are mostly related to the following issues:
  • Poor design and documentation: The lack of documentation and a proper design make it difficult to install and use any tool effectively [22,23,24].
  • Lack of maintenance and support: Once a tool is released, it may not be maintained or updated, leading to unresolved bugs and issues [22,23,24].
  • Compatibility and standardization: This can lead to compatibility issues [24], especially when integrating multiple tools into a workflow.
  • Overabundance and redundancy: The number of available tools can be overwhelming, with many tools performing similar functions [22,23].
  • Learning curves: Some tools have varying interfaces and functionalities, and this can create a steep learning curve for users, particularly those new to bioinformatics [22], especially if coding skills are required.
  • Lack of community feedback and reviews: This helps users make informed decisions about which tools to use [22].
  • Interpretability of results: Questioning whether the software is accurately processing data [22,24].
  • Resource allocation: Some tools often take precedence over improving or supporting existing ones, leading to a fragmented ecosystem where resources are spread thin [22,23].
  • Platform-specific tools: Tools are designed to work optimally with specific data types or experimental setups, which can limit their general applicability and require users to adapt their workflows accordingly [22].
  • User-friendliness and accessibility: Many bioinformatics tools are not user-friendly, hindering their effective use [24], and most software tools lack a Graphical User Interface (GUI), making them difficult to use.
According to the survey by J. Cazier [22], around 52% of responses explicitly or implicitly mentioned that there are too many tools and emphasized the challenges this creates, especially for users without programming knowledge (this perception is shown in Figure 1).
Moreover, the survey revealed the following key findings, which can be seen in Figure 2:
1.
Challenges in selecting tools:
a.
Over 30 responses (62.5%) highlighted difficulties in choosing the right tool due to redundancy, poor documentation, or lack of clarity about functionalities.
2.
Installation and usability issues:
a.
Around 12 responses (25%) directly pointed out problems with installing or using tools, citing a lack of standardization and technical complexity.
3.
Barriers for non-programmers:
a.
At least 10 responses (20.8%) explicitly noted that users with limited programming expertise face significant barriers when using bioinformatics tools.
4.
Recommendations for improvement:
a.
Unified platform: Around 10 responses (20.8%) advocate integrating tools into a common platform to simplify access and usability.
b.
User reviews: Five responses (10.4%) emphasized the need for platforms allowing users to review and rate tools, helping non-experts choose tools that align with their goals.
c.
Open-source frameworks: Seven responses (14.6%) suggested using open-source frameworks as the foundation for building elements for tool integration.
5.
Time investment:
a.
Around 15 responses (31.25%) indicated that more time is spent installing and troubleshooting tools than on data analysis.
Moreover, the aforementioned survey identifies that bioinformatics tool perception is characterized by a wide variety of tools and a high level of complexity in performing biological analysis, as well as its usage [25].
In this context, this research presents BioSuiteT v1.0, a web application developed with the objective of addressing the identified challenges of existing bioinformatics tools by unifying various bioinformatics data analysis tools with an integrated GUI; BioSuiteT includes visualization, sequence analysis, and regular expression searching, among other functionalities, within a single application, without the need for coding proficiency, specialized software knowledge, or using a wide variety of tools.
BioSuiteT leverages trusted data sources and tools to ensure the reliability of the information it processes by using Django. By providing a user-friendly Graphical User Interface (GUI), BioSuiteT eliminates the need for users to install additional components, download extra files, or possess advanced programming skills to utilize the tool effectively.
BioSuiteT can be deployed on a server or a personal computer, offering flexibility in its usage according to user preferences. Notably, BioSuiteT provides an intuitive GUI that simplifies complex bioinformatics tasks and enhances accessibility for researchers who may not have a computational background.

2. Materials and Methods

This section presents the materials and methods used to develop BioSuiteT. It is structured as follows: it presents the data and tools selection based on an analysis of the most used platforms for bioinformatic analysis, followed by a comparison of each platform regarding its functionalities.

2.1. Data and Tools Source Selection

For the selection of tools and data to use in BioSuiteT, we conducted research on the bioinformatics tools used in well-established platforms, such as ExPASy [12] and NCBI Tools [14,15], and some of the most used software tools and libraries, such as Chimera [26], BLAST [27], and BioPython [16], which are described in the next subsections. These platforms utilize tools that have been rigorously tested and are recognized for providing accurate and reliable results. By integrating these proven tools into BioSuiteT, we ensure that our application offers trusted functionalities to users. This approach not only reinforces the reliability of BioSuiteT but also enhances its utility by incorporating widely accepted and effective bioinformatics tools within a user-friendly interface and in a single environment.

2.1.1. ExPASy

ExPASy stands for Expert Protein Analysis System and is a web server provided by the Swiss Institute of Bioinformatics [28] with many tools to analyze sequences, structures, and other biological information. Some of the platform functionalities are related to the following functions:
  • Sequence analysis: Ability to analyze different types of biological sequences.
  • Structure prediction: Prediction of the three-dimensional structure of proteins and nucleic acids.
  • Homology search: Identification of similar sequences in databases.
  • Primer design: Tools for efficiently designing primers for PCR.
  • Gene expression Analysis: Evaluation of gene expression at the transcriptomic level.
  • Functional Annotation: Assignment of biological functions to sequences.
  • Databases: Access to a variety of biological databases.
ExPASy provides researchers with a complete platform for performing many bioinformatics analyses; as mentioned previously, the platform encompasses tools for sequence analysis, structure prediction, homology search, primer design, gene expression analysis, functional annotation, and access to biological databases.

2.1.2. NCBI Tools

The National Center for Biotechnology Information (NCBI) offers a suite of bioinformatics tools and databases essential for biomedical research and analysis. NCBI focuses primarily on developing new information technologies to help and enhance the understanding of fundamental molecular and genetic processes that control health and disease [15]. Some of the platform functionalities are related to the following functions:
  • Sequence analysis: Ability to analyze different types of biological sequences.
  • Biomedical databases: Repositories of biomedical data for research and analysis.
  • Homology search: Identification of similar sequences in databases.
  • Primer design: Tools for efficiently designing primers for PCR.
  • Gene expression analysis: Evaluation of gene expression at the transcriptomic level.
  • Functional annotation: Assignment of biological functions to sequences.
  • Databases: NCBI focuses on biomedical information.
NCBI provides researchers with a complete suite of bioinformatics tools and databases essential for biological research. The platform includes tools for sequence analysis, homology search, primer design, gene expression analysis, functional annotation, and access to a wide range of biological databases, among other tools.
NCBI’s tools facilitate diverse bioinformatics analyses, enabling researchers to interpret complex biological data and advance studies in genomics, molecular biology, and related fields; nevertheless, they can be very complex to use. In addition to NCBI and ExPASy, other tools, such as Chimera, offer specialized functionalities for molecular modeling and visualization; this is discussed in the following subsection.

2.1.3. Galaxy

Galaxy is an open-source, web-based platform for accessible and collaborative biomedical data analysis; this means that the tool is primarily focused on biomedical applications rather than general bioinformatics. It enables the performance, sharing, and visualization of computational analyses with minimal technical barriers through its interface [29]. Key functionalities include the following:
  • Sequence analysis: Supports diverse sequence analyses.
  • Homology search and sequence alignment: Integrates the BLAST tool for database comparisons.
  • Gene expression analysis: This includes single-cell RNA-Seq workflows and corresponding visualizations.
Galaxy is a platform that enables users to perform complex analysis, but it is centered on biomedical applications instead of general bioinformatics analysis.

2.1.4. Geneious

Geneious is a bioinformatics software web platform that integrates molecular biology and sequence analysis tools within a unified graphical interface [30]. This commercial solution supports desktop installation with limited web-based functionality through Geneious Prime Web. Key functionalities include the following:
  • Sequence analysis: Support for manipulation, annotation, and characterization of nucleotide/protein sequences.
  • Transcription and reverse transcription: Integrates tools for DNA→RNA transcription and RNA→cDNA conversion.
  • Sequence translation: Automatic translation of nucleotide sequences to amino acid sequences.
  • Pairwise sequence alignment: Local/global alignment with configurable parameters.
Geneious integrates diverse molecular biology tools within a single paid platform, though its structural bioinformatics capabilities (e.g., PDB structure viewer/analysis) are absent. While the web version offers partial accessibility, full functionality requires desktop installation. The unified environment simplifies complex analyses but lacks modularity for integrating custom tools.

2.1.5. Benchling

Benchling is a cloud-based bioinformatics platform for biotechnology that is focused on molecular biology, electronic lab notebooks, and workflow automation within a unified environment [31]. Designed for collaborative science, it supports DNA/protein sequencing, data management, and AI-driven analysis. Key functionalities include the following:
  • Sequence analysis: Design, visualize, and analyze DNA/RNA/amino acid sequences with bulk cloning, alignment, and auto-annotation tools.
  • Transcription and reverse transcription: Includes tools for DNA→RNA transcription and RNA→cDNA conversion, integrated into sequence workflows.
  • Sequence translation: Automatic translation of nucleotide sequences to amino acid sequences.
  • Pairwise sequence alignment: Local/global alignment with configurable parameters.
Benchling is a tool centered on sequence-centric workflows, collaborative wet-lab/data integration, and automation. As it is cloud-based, it eliminates installation barriers, limitations include no structural bioinformatics or phylogenetics, and it is paid.

2.1.6. UGENE

UGENE is an open-source bioinformatics toolkit compatible with Windows, macOS, and Linux, and it supports DNA/protein sequencing, structural biology, and NGS data processing within a unified desktop interface [32]. Key functionalities include the following:
  • Sequence analysis: Create, edit, and annotate sequences; identify ORFs, repeats, and motifs; and perform restriction analysis with REBASE integration.
  • BLAST integration: Local/remote BLAST+ searches against NCBI, UniProt, PDB, and other databases.
  • Pairwise sequence alignment: Smith–Waterman algorithm for local alignment.
  • PDB structure viewer and analysis: Visualize 3D molecular structures (PDB/MMDB formats) and predict protein secondary structures using GOR IV and PSIPRED.
UGENE offers a comprehensive toolkit for structural visualization and sequence-centric molecular biology. Its integrated tools enable analysis without programming expertise. Limitations include the absence of a web version and no explicit reverse transcription tools, although RNA analysis is supported. The GUI, while comprehensive, has a steep learning curve.

2.1.7. Chimera

Chimera is a software tool for molecular visualization and analysis. This tool explores and analyzes molecular structures in 3D interactively [26]. Some of the functionalities offered by this tool are related to the following:
  • Sequence analysis: Ability to analyze different types of biological sequences.
  • PDB file analysis and viewer: To read PDB files, analyze the structure, obtain some data, and generate a 3D structure.
  • Sequence analysis: Ability to analyze different types of biological sequences not directly by the sequence but with the structure.
  • Interaction analysis: To see the interaction between structures.
Chimera is a complete tool covering many aspects of structural modeling and analysis. Nevertheless, its focus is directly on structure modeling, and when analyzing a sequence is required, it has partial capabilities rather than a comprehensive analysis.

2.1.8. BLAST

BLAST stands for Basic Local Alignment Search Tool; it is a sequence alignment algorithm for comparing biological sequences [27]. This tool has the capacity to compare many types of sequences against databases of known sequences to identify regions of similarity [27]. Some of the functionalities offered by this tool are related to the following:
  • Sequence analysis: Ability to analyze different types of biological sequences.
  • Homology search: Identification of similar sequences in databases.
  • Sequence alignment and translation: Aligns sequences and can translate nucleotide sequences during searches.
The BLAST algorithm is widely used, demonstrates efficiency, and provides a statistical framework useful for identifying homologous sequences and inferring functional relationships between molecules.

2.1.9. BioPython

BioPython is a Python library that includes a set of freely available tools for bioinformatics. This library provides modules to manipulate and analyze biological data [16]. Some of the functionalities offered by this library are related to the following:
  • Sequence analysis: Ability to analyze different types of biological sequences.
  • Homology search: Identification of similar sequences in databases.
  • Sequence alignment and translation: Aligns sequences and can translate nucleotide sequences during searches.
  • Database access: Accesses various biological databases using APIs like Entrez.
  • Calculation and generation of phylogenetic trees: Includes modules for constructing and manipulating phylogenetic trees.
  • Primer design: Partial support through libraries for designing primers.
  • Functional annotation: Interfaces with annotation databases; can parse and analyze annotation data.
The BioPython library provides very important capabilities by providing modules to create a comprehensive toolkit, making it an essential resource for biological data analysis. To use this library, experience in programming using Python is required, and no GUI is provided.

2.2. Most Used Tools and Functionalities in Bioinformatics

According to Bayat [33], bioinformatics encompasses a wide range of essential functionalities that serve different purposes in biological research. Sequence analysis allows researchers to process and analyze DNA, RNA, and protein sequences [34]. Structure prediction tools allow the understanding of molecule functions [35].
Homology search in sequence alignment is fundamental for comparing biological sequences and identifying evolutionary relationships between organisms; this is useful for identifying relationships between organisms’ evolutionary processes [36]. Primer design functionality assists in the preparation of PCR experiments by creating specific primers [37].
Functional annotation tools are for assigning biological functions to newly discovered sequences to understand the roles of genes and proteins [38]. Databases and data retrieval functionalities provide access to biological data [39]. Phylogenetic analysis tools enable the study of evolutionary relationships between species [40].
Structural visualization and analysis tools provide interfaces for examining molecular structures in detail, while translation and transcription functionalities allow conversion between different types of biological sequences [41]. Exploration tools are used to facilitate the discovery of new patterns and relationships [42]. Interaction analyses are crucial for studying how molecules interact with each other [43]. Finally, tools for analyzing variants and mutations help researchers to understand genetic diversity and its implications [40].
In summary, the most used functionalities are related to sequence analysis, structure prediction, homology search and sequence alignment, primer design, gene expression analysis, functional annotation, databases and data retrieval, phylogenetic analysis, structural visualization and analysis, translation and transcription, exploration, interaction analysis, and variants and [34] mutations; this can be seen in Figure 3.
The following section presents a comparison between bioinformatics platforms and software tools and libraries.

2.3. Comparison Between Bioinformatics Platforms and Software Tools and Libraries

Table 1 compares the functionalities offered by each platform, software tool, and library for summarizing information; this table highlights the specific capabilities that each one provides.
ExPASy provides a comprehensive suite of bioinformatics tools, offering full support for sequence analysis, structure prediction, homology search, alignments, primer design, gene expression analysis, functional annotation, data retrieval, and processes such as translation and transcription. It includes basic tools for phylogenetic analysis, but these are less advanced than those of other platforms. For genome and species exploration, ExPASy provides access to related databases but lacks the in-depth tools available in platforms like NCBI. Its support for interaction analysis is partial, offering some protein–protein interaction predictions but with limited depth. Similarly, support for variants and mutations is limited, relying primarily on external databases without dedicated tools for detailed analysis.
NCBI Tools provides a comprehensive suite of bioinformatics functionalities, encompassing full support for sequence analysis, homology search and alignment, primer design, gene expression analysis, functional annotation, data retrieval, phylogenetic analysis, translation and transcription, genome and species exploration, and analysis of variants and mutations. Structure prediction is partially supported through access to structural data and basic modeling tools, although these are less advanced than those offered by dedicated platforms, such as ExPASy. Structural visualization is also partial, with tools such as Cn3D [44] available for viewing molecular structures but lacking the advanced features found in software like Chimera. Interaction analysis is limited, providing some resources for studying biological interactions, but not as comprehensive as specialized tools. Additionally, NCBI Tools does not support reverse transcription, which restricts its ability to simulate RNA-to-DNA conversion.
Chimera is a specialized tool focused on structural visualization and analysis, with full support in this area. It excels at displaying 3D molecular structures of proteins and nucleic acids, enabling the detailed exploration of molecular interactions. It also fully supports interaction analysis within structures, allowing the in-depth study of protein–protein and other biomolecular interactions. However, Chimera does not support other core bioinformatics functionalities, such as sequence analysis, structure prediction, homology search, alignments, primer design, gene expression analysis, functional annotation, data retrieval, phylogenetic analysis, translation, transcription, genome and species exploration, or reverse transcription. Support for variants and mutations is partial, as Chimera allows the visualization of these features but lacks dedicated tools for detailed analysis. Overall, Chimera is a powerful platform for structural and interaction analysis, but its capabilities are limited to these specific domains.
BLAST provides strong support for sequence analysis, homology search, and sequence alignment, enabling the comparison of biological sequences, identification of homologs, and assessment of sequence similarity across large databases—key functions for functional annotation and evolutionary studies. However, BLAST does not support other bioinformatics tasks, such as structure prediction, primer design, gene expression analysis, functional annotation beyond similarity searches, general data retrieval, phylogenetic analysis, structural visualization, translation and transcription, genome and species exploration, reverse transcription, interaction analysis, or analysis of variants and mutations. BLAST is primarily designed for sequence alignment and similarity searching, and additional tools are needed for broader bioinformatics analyses.
BioPython supports key bioinformatics tasks, such as sequence analysis, homology search, sequence alignment, data retrieval, translation and transcription (including reverse transcription), and phylogenetic analysis. It enables the manipulation of biological sequences, integrates with databases like NCBI’s Entrez, performs alignments, and builds phylogenetic trees programmatically. However, it offers only limited support for structure prediction, structural visualization, primer design, gene expression analysis, functional annotation, genome and species exploration, interaction analysis, and variant/mutation analysis. It lacks advanced tools for structural visualization, specialized primer design, and in-depth gene expression analysis. While BioPython is a flexible and extensible tool for many analyses, it often requires complementary tools to cover more specialized functionalities.

2.4. Components for BioSuiteT

BioSuiteT was developed by analyzing the most frequently used functionalities in bioinformatics and identifying common needs across existing platforms. Its goal is to unify various resources within a single environment to simplify bioinformatics analysis. To achieve this, BioSuiteT integrates a selection of well-documented and thoroughly tested libraries and tools, including BioPython [16], BioPandas [45], FungiRegEx [21], and 3Dmol.js [46]. A detailed description of the components integrated into BioSuiteT is presented in Table 2.
A key feature of BioSuiteT is its Graphical User Interface (GUI), which enables users with no programming background to perform complex analyses easily. The tool ensures seamless compatibility between its integrated components, minimizing technical barriers for users and reducing the risk of incompatibilities during workflows.
The development process adhered to the ISO/IEC 29110 standard for software engineering, implemented using the VSEST 29110 tool [47]. This ensured the application of industry best practices throughout the development lifecycle. By relying on validated libraries and components, BioSuiteT offers users a robust and reliable platform for conducting bioinformatics tasks, supported by a framework that facilitates modular integration and future extensibility.

2.5. Development Framework for BioSuiteT and Modules

BioSuiteT is built on the Django framework [48], selected for its efficiency in rapid web application development and its support for modular, scalable architectures [49]. Additionally, to store biological data, BioSuiteT uses MongoDB for its high performance in handling a vast amount of information [50]. The main components can be seen in Figure 4, followed by a description of BioSuiteT functionalities and its interfaces. There are several parts of the GUI that, considering its size, cannot be placed completely; for this reason, we have included a Supplementary Material folder that contains a full-size version of each interface that BioSuiteT includes.
Below, the key components and functionalities of BioSuiteT are described.
1.
DNA Sequence Analysis:
a.
Properties analysis: BioSuiteT receives as input a sequence of DNA and, as output, delivers the complementary sequence, reverse complementary sequence, and the distribution of the amino acids with its plot (see Figure 5).
2.
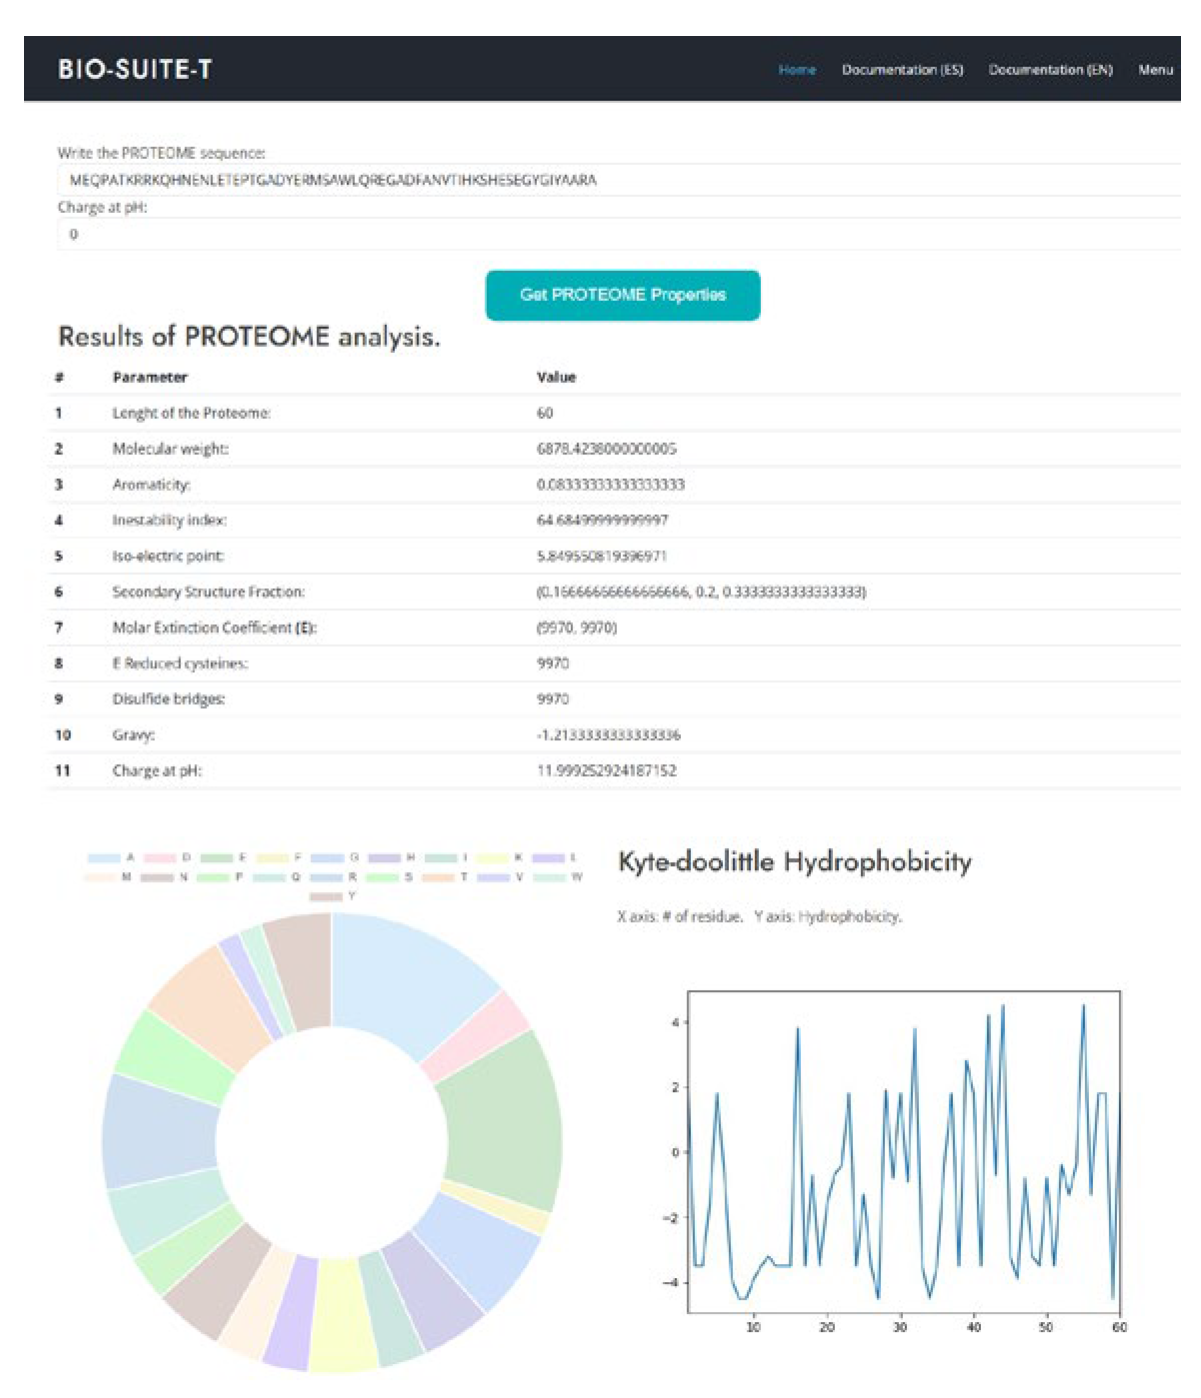
Protein Sequence Analysis:
a.
Properties analysis: BioSuiteT receives as input a sequence of proteins and a pH level for calculating Charge; as output, it delivers the sequence length, molecular weight, aromaticity, instability index, isoelectric point, secondary structure, extinction coefficient, disulfide bridges, hydrophobicity, charge, and plots of amino acid distribution and Kyte Doolittle hydrophobicity (see Figure 6).
3.
Transcription and Reverse Transcription:
a.
Transcription: Converts nucleotide sequences to mRNA and provides template strands (see Figure 7, left side).
b.
Reverse transcription: Converts mRNA back to nucleotide sequences (see Figure 7, right side).
4.
Sequence Translation
a.
Sequence translation: BioSuiteT receives as input a sequence of mRNA and, as output, delivers the translated amino acid sequence using the respective codon table (BioSuiteT includes all the codon tables; see Figure 8).
5.
Pairwise Sequence Aligner
a.
Pairwise sequence aligner: BioSuiteT receives as input two sequences for alignment and, as outputs, delivers aligned sequences with alignment statistics, such as match score, mismatch score, gap score, and information on the type of alignment (local and global). Also, BioSuiteT has all the penalization matrixes (Jones, Levin, McLachlan, MDM78, MegaBlast, NUC 4.4, and 23 more; this can be seen in Figure 9).
6.
BLAST Tool
a.
Sequence search: BioSuiteT receives as input a sequence of proteins, nucleotides, or genes; as output, it delivers a list of organisms with similar sequences using BLAST (BioSuiteT includes BLAST-N, BLAST-P, T-BLAST-N, and BLAST-X; see Figure 10).
7.
PDB Viewer
a.
Visualization: BioSuiteT receives as input a PDB file, and as output, a 3D protein structure visualization with multiple modes (sticks, cartoons, spheres, lines, cross, label alpha C’s, and variations in surfaces; this can be seen in Figure 11).
8.
PDB Analysis
a.
Properties analysis: BioSuiteT receives as input a PDB file; as output, it delivers the properties of the structure such as structure name, deposition date, release date, structure resolution, structure keywords, structure method, structure reference, journal reference, author, compound, source, missing residues information, glycosylation information, model list, chain list, residues list, atom name and coordinates, β factor, element and atom distribution plots, and hetero atom information (see Figure 12).
9.
Phylogenetic Trees
a.
Construction of phylogenetic trees: BioSuiteT receives as input a sequence of DNA and, as output, delivers the complementary sequence, reverse complementary sequence, and the distribution of the amino acids with its plot, as can be seen in Figure 13. This phylogenetic tree was constructed by using a CLUSTAL file, which contains an alignment of sequences. Based on this alignment, BioSuiteT, through its algorithms, generates the calculations and plots the phylogenetic tree.
10.
MOTIFS Tool
a.
MOTIF analysis: BioSuiteT receives as input a list of MOTIFS and, as output, delivers the consensus sequences, degenerated sequences, reverse complementary sequences, and count matrixes as can be seen in Figure 14.
11.
FungiRegEx (Regular Expression Identification)
a.
FungiRegEx module: BioSuiteT receives as input the regular expression to find and a selection of the database to look at the regular expression, as output, sequences that match, and the number of matches that the regular expression has found. The interface of this can be seen in Figure 15.
12.
Stored Biological Data Retrieval
a.
Proteome and genome retrieval: BioSuiteT displays the data stored in the MongoDB database; see Figure 16.
Figure 5. DNA sequence analysis interface.
Applsci 15 06565 g005
Figure 6. Protein sequence analysis interface (part of the image has been cut due to size).
Applsci 15 06565 g006
Figure 7. Transcription and back transcription tool interface.
Applsci 15 06565 g007
Figure 8. Translation tool interface.
Applsci 15 06565 g008
Figure 9. Sequence aligner tool interface. This interface enables users to align two sequences and select the type of alignment they want to perform, along with the desired penalization matrix.
Applsci 15 06565 g009
Figure 10. BLAST tool interface.
Applsci 15 06565 g010
Figure 11. PDB viewer interface.
Applsci 15 06565 g011
Figure 12. PDB analysis interface.
Applsci 15 06565 g012
Figure 13. Phylogenetic trees interface.
Applsci 15 06565 g013
Figure 14. MOTIFS tool interface.
Applsci 15 06565 g014
Figure 15. FungiRegEx module.
Applsci 15 06565 g015
Figure 16. Biological data retrieval interface.
Applsci 15 06565 g016

2.6. Validation of BioSuiteT

BioSuite employs several mathematical and statistical algorithms to ensure the precision and reliability of its analysis. Below are the key mathematical foundations implemented into the BioSuiteT functionalities:

2.6.1. Pairwise Sequence Aligner

The sequence alignment of BioSuiteT is based on the algorithms Needleman–Wunsch for global alignment and Smith–Waterman for local alignment [51]; those algorithms maximize a punctuation that is defined by
S i , j = m a x S i 1 , j 1 + δ ( a i , b j ) C o i n c i d e n c e / M i s m a t c h S i 1 , j + γ G a p   i n s e r t i o n S i , j 1 + γ G a p   e r a s i n g
where
  • δ ( a i , b j ) is the punctuation of coincidence/mismatch (e.g., +1 for match, −1 for mismatch).
  • γ is the penalization for the gap (e.g., −2).
  • BLOSUM and PAM substitution matrixes are integrated for protein analysis.
In contrast to commonly utilized tools such as NCBI BLAST, the pairwise sequence aligner in BioSuiteT integrates both global and local alignment capabilities within a single interface. It employs well-established algorithms—Needleman–Wunsch for global alignment and Smith–Waterman for local alignment—ensuring precise and exhaustive comparisons. While heuristic methods like BLAST are optimized for speed at the expense of alignment completeness, BioSuiteT emphasizes accuracy by performing full matrix computations. Furthermore, the aligner supports customizable scoring schemes, including BLOSUM and PAM substitution matrices, as well as user-defined gap penalties, facilitating detailed and reliable analyses that are particularly suited to scenarios where alignment fidelity is critical, such as in small- or medium-scale comparative studies.

2.6.2. PDB Structure Analysis (3Dmol.js)

Three-dimensional structure visualization uses geometric transformations to represent atoms and bonds. Below is a description of this process:
  • Cartesian coordinates: Each atom in a PDB file is represented as ( x , y , z ) .
  • Surface rendering: Perspective projection equations are applied for interactive visualization:
    x i y i = f · x z f · y z ,
    where f is the focal length.

2.6.3. BLAST (Sequence Homology)

The statistical significance of BLAST results is calculated using the E (Expect) value, which estimates the number of alignments expected by chance:
E = K · m · n · e λ S
where
  • m , n are the sequence lengths.
  • λ ,   K are parameters of the extreme distribution.
  • S is the alignment score.

2.6.4. MOTIFS Analysis

Motif identification uses weight matrices (PWM) to calculate the probability of a motif M in a sequence S :
P S | M = i = 1 L P S i | M i ,
where L is the MOTIF length, and P ( S i | M i ) is the nucleotide/amino acid frequency in the i position.

2.6.5. Statistical Results Validation

BioSuiteT relies on established statistical methods for validating results, which are inherently integrated into the analysis functions via trusted libraries. These methods are not custom-developed or theoretical; instead, they are implemented through standard packages.
  • Hypothesis testing: In differential analysis (e.g., gene expression), BioSuiteT applies statistical tests (t-test, ANOVA) with False Discovery Rate correction using the Benjamini–Hochberg procedure. The adjusted p-values are computed as
    p a d j u s t e d = p · m r a n g e p ,
    where m is the number of tests. These calculations are performed internally by the statistical libraries used and are not re-implemented within BioSuiteT.
  • PCA (Principal Component Analysis): BioSuiteT includes PCA for dimensionality reduction, based on spectral decomposition of the covariance matrix: = X T X
This method is executed using existing numerical libraries that handle the decomposition and transformation steps.
PCA was selected for dimensionality reduction in BioSuiteT due to its versatility, efficiency, and minimized reliance on data assumptions. This makes it particularly useful for exploratory analyses, as it can be applied to unlabeled datasets. Methods such as Linear Discriminant Analysis require predefined class labels. All validation techniques mentioned are thus implemented through well-established external libraries and are integrated into the functional workflows of BioSuiteT.

2.7. Implementation

BioSuiteT was implemented using a modular architecture approach to ensure scalability [52] within Django. The implementation process followed a systematic methodology consisting of several key steps, which are described below:
  • Development Environment Setup
    • Django Framework 4.1 as the web application framework.
    • Python 3 is a programming language.
    • MongoDB 6 for data storage.
    • Front-end technologies: HTML5, CSS3, JS, and Bootstrap 5.
  • Core Component Implementation
    • Integration of BioPython library for the functionalities.
    • Integration of 3Dmol.js for molecular visualization.
    • Integration of BioPandas for structural data handling.
    • FungiRegEx module for regular expression analysis.
  • User Interface Development
    • Responsive design implementation using Bootstrap.
    • Interactive visualization components.
    • Form validation and error handling.
  • Testing and Quality Assurance
    • Unit testing of individual components using the unittest library [53].
    • User acceptance testing.
The implementation process strictly adhered to the ISO/IEC 29110 standard using the VSEST 29110 tool [47], ensuring proper documentation, version control, and quality management throughout the development lifecycle. This approach facilitated the creation of a robust, maintainable, and scalable bioinformatics tool.
The system architecture follows the pattern of Model–View–Template (MVT) [54], which is characteristic of Django applications. This pattern ensures clear separation and maintainable code structure.
BioSuiteT is distributed as a 7Z file, which contains an automated script for component installation and other automated scripting for running; the source code is available for download at https://sourceforge.net/p/biosuitet accessed on 1 June 2025 and https://github.com/maigolinox/biosuitet accessed on 1 June 2025. If the user does not want to download BioSuiteT, the user can access it at the https://biosuitet.vterron.pro website. Once BioSuiteT has been downloaded and unzipped, the user must read the documentation, which contains detailed instructions on installing it locally or on a server if required, as well as its usage.

2.8. Concrete Usage Scenario

A user can use BioSuiteT in scenarios that require performing multiple integrated bioinformatics analyses without requiring programming expertise or tool switching. In this context, a concrete scenario could be as follows: A mycologist studying a specific fungal species needs to identify regulatory DNA motifs controlling antifungal resistance genes, characterize their protein products, and trace evolutionary relationships. Using BioSuiteT, they input the fungal DNA sequence once to simultaneously discover candidate motifs via the integrated FungiRegEx module, then seamlessly run BLAST-P on the resulting sequences to find homologous proteins across species. And once they have downloaded the PDB file from an external database, users can visualize it by using the 3Dmol.js-powered PDB viewer. Additionally, suppose the user wants to align more than two sequences. In that case, they can use CLUSTAL to obtain the results file and generate phylogenetic trees from the aligned sequences—all within a single browser session. This integrated workflow eliminates the need to juggle separate tools while also avoiding the requirement for programming knowledge.

3. Results

The implementation of BioSuiteT resulted in a web-based platform with a unified environment that integrates multiple frequently used tools and addresses many of the challenges identified in existing bioinformatic software. This section is organized as follows: first, the implementation results of BioSuiteT are presented, followed by the presentation of performance results and, finally, the validation results.

3.1. BioSuiteT Implementation Results

The implementation of BioSuiteT results in the successful integration of twelve primary functionalities that are the most common, including DNA sequence analysis, protein sequence analysis, transcription and reverse transcription, sequence translation, pairwise sequence aligner, BLAST tool, PDB viewer, PDB analysis, phylogenetic trees, MOTIFS tool, FungiRegEx tool, and the storage of biological data by using MongoDB. The technical implementation was achieved by using Django-based architecture, featuring a responsive web interface and flexible deployment options.
A significant achievement of BioSuiteT is its effective resolution of previously identified challenges in bioinformatics software usage. BioSuiteT addresses the installation issues that, according to the survey of Cazier [22], affect 25% of users through its web-based deployment option, eliminating installation barriers. For users preferring local deployment, automated installation scripts reduced the setup time to under 15 min, thanks to the automated scripts.
BioSuiteT addresses the programming expertise barrier that affected 20.8% of users through its GUI implementation. The web-based version requires no programming knowledge, while local deployment is simplified through automated scripts, effectively reducing the technical expertise requirement.
The integration of multiple tools into BioSuiteT addresses the 20.8% demand for unified platforms; BioSuiteT consolidates many tools into a single environment. The implementation of Django as the integration framework for unifying bioinformatics tools addresses 14.6% of the expressed demand for unified frameworks to facilitate the integration of bioinformatics software.
BioSuiteT eliminates the significant time investment in troubleshooting that affected 31.25% of users. The web version provides immediate access without setup requirements, while the automated local deployment reduces configuration time by approximately 85%; this reduction allows any user to focus more on analytical work rather than troubleshooting.
In summary, the key implementation of BioSuiteT results is presented below:
  • Core functionality integration
    • Successfully integrated 12 functionalities (DNA analysis, proteome analysis, transcription, back transcription, translation, pairwise alignment, BLAST, PDB viewer, PDB analysis, phylogenetic trees, MOTIFS, and FungiRegEx) required for performing bioinformatic analysis, and one more to retrieve stored data.
  • Technical Implementation
    • Django-based architecture with MongoDB integration for efficient data handling.
    • Responsive web interface for supporting multiple devices and screen sizes.
    • Flexible deployment options allowing both local and server installation.
    • Integration of well-proven and well-tested libraries, including BioPython, BioPandas, FungiRegEx, and 3Dmol.js.
    • Implementation following the ISO/IEC 29110 standard using the VSEST 29110 tool.
    • These results are summarized below in Table 3.

3.2. Performance Results

BioSuiteT was evaluated on a Virtual Private Server running Ubuntu 22.04, equipped with a four-core processor, 8 GB of RAM, and 240 GB of SSD storage, under simple usage with a load of 80 concurrent users. The platform maintained stable performance under varying loads and demonstrated efficient memory usage, requiring less than 2 GB of RAM during typical operation. Usability metrics demonstrated notable improvements, including zero configuration time for the web-based version and an 85% reduction in setup time, thanks to its unified environment. These performance results are presented in Figure 17.
In summary, the key performance results include the following:
System Stability
  • Successfully demonstrated handling of up to 80 concurrent users.
  • Maintained stable performance under varying load conditions.
  • Efficient memory management of less than 2 GB.
  • Reliable database operations through MongoDB.
  • Consistent performance across different deployment scenarios.

3.3. Validation Results

The functional validation process was conducted through structured user testing involving a diverse group of participants: eight academic researchers, five experts in bioinformatics, sixty practitioners from various institutions, and eight software developers who tested all implemented functionalities and interface elements.
The users were assigned specific tasks to assess platform usability, feature completeness, and integration efficiency. The types of assigned tasks are described below:
  • Tasks that included advanced workflows, such as sequence analysis, structure visualization, parameter identification, and execution of multi-step pipelines requiring the use of several integrated tools.
  • Tasks focused on routine bioinformatics operations (e.g., BLAST searches, phylogenetic tree generation, data retrieval) to assess usability and accessibility for non-programmers.
  • Tasks that involved reviewing system stability under load and validating backend integrations and automated installation processes.
  • The quantification of key performance metrics is described below:
  • A 95% reduction in technical support requirements was achieved by comparing the number of support requests submitted by non-programming users using BioSuiteT with those using standalone bioinformatics libraries. This was monitored over the testing period and confirmed through post-test surveys and usage logs.
  • A 90% reduction in tool switching time, which is derived from time-tracking logs during user workflows and application log tracking. Participants performed identical multi-tool tasks using both BioSuiteT and traditional setups involving multiple separate tools. The time taken to switch between tools, reconfigure settings, and re-import/export data was measured and compared. The unified interface of BioSuiteT resulted in an average of 90% time savings during these transitions, equivalent to a reduction of approximately 465 s, on average, for completing a proposed task.
In summary, the validation results are presented below:
  • User Testing
    • 8 researchers, 5 experts directly involved in bioinformatics, 60 practitioners, and 8 developers participated in the testing process.
    • Complete coverage and validation of all implemented functionalities.
    • Thorough validation of user interface elements and interactions.
  • Platform Performance
    • No installation issues reported for the web-based version.
    • 95% success rate for automated local installations across different environments.
    • Less than 2 GB of memory usage during peak operation.
    • Stable performance under a full load of 80 concurrent users.
  • Usability and Efficiency Gains
    • Non-programmers successfully completed the tasks without additional support.
    • 95% reduction in technical support demand compared to installable tools.
    • 90% reduction in tool-switching time due to the unified set of tools in a single interface.
These results demonstrate that BioSuiteT was successfully implemented as a platform that integrates multiple tools into a single environment. It meets its design objectives while addressing many of the identified challenges in bioinformatics software usage and maintaining stable performance and user validation. Despite these advances, BioSuiteT continues to face a range of challenges that require further work to resolve. These challenges are discussed in detail in the following section.

4. Discussion

The development and implementation of BioSuiteT demonstrate progress in addressing several challenges identified in bioinformatics usage. This section discusses the implications of the results, analyzing both BioSuiteT’s achievements and limitations.

4.1. Addressing User Challenges

The implementation results demonstrate that BioSuiteT addresses the installation barriers previously identified by Cazier [22]. The web-based deployment option eliminates installation requirements, while the automated installation scripts for local deployment reduce setup complexity. This dual approach to deployment provides flexibility while maintaining accessibility, directly addressing the perception of users (25%) who report installation difficulties.
The implementation of the GUI addresses the programming expertise barrier that affected 20.8% of users. This achievement allows a broader audience of users who may lack programming expertise.

4.2. Integration and Unified Platform Benefits

The integration of bioinformatics tools allows the inclusion of twelve core functionalities in a single platform, representing an advance in addressing the fragmentation of bioinformatics tools. Using Django as the integration framework to develop BioSuiteT responds to the 14.6% of users who expressed the need for unified frameworks. BioSuiteT provides a comprehensive suite of tools for diverse bioinformatics analyses, which can be applied to fields such as nanomedicine and biomaterials, depending on the user’s specific objectives. However, this paper focuses solely on presenting the platform’s functionalities, without addressing its application to any particular field.

4.3. Performance and Technical Considerations

The performance results for handling concurrent users demonstrate efficient memory management (under 2 GB) and quick response times, demonstrating that BioSuiteT provides reliable service while maintaining system stability. MongoDB integration proves effective for biological data handling, with a reduced time for data retrieval.

4.4. Validation and User Expertise

The validation results involving researchers, experts, and practitioners help gather feedback on the platform’s functionality. The reduction in effort to install BioSuiteT, thanks to the automated scripts, as well as the significant reduction in support for this, suggests that BioSuiteT successfully achieves its goal of improving accessibility while maintaining functionality.

4.5. Limitations and Future Work

Despite the achievements of BioSuiteT, there are still several areas that require further development, which are described below:
  • Scalability
    • BioSuiteT was tested with limited concurrent users (80). While this capacity meets current research group requirements, expanding the platform’s reach would necessitate improvements in server infrastructure and load balancing.
    • As biological datasets continue to grow and become complex, there is a need to improve and optimize databases to handle larger datasets more efficiently.
  • Functionality
    • BioSuiteT covers some of the current needs but presents expansion opportunities. There is a potential to integrate additional specialized bioinformatics tools, particularly in emerging areas of bioinformatics research.
    • Current visualization capabilities are functional but could be enhanced to provide more sophisticated data representation options.
  • Technical perspective
    • Adding offline functionality to the web version would improve accessibility for users with unreliable or limited internet access. This feature would allow researchers to continue their work during network disruptions.
    • The automated setup scripts, while effective, could be enhanced to handle a broader range of system configurations and dependencies.
    • Memory usage optimization remains an ongoing challenge, with opportunities to improve efficiency when handling large amounts of information.
These limitations and areas for future work provide a roadmap for improving BioSuiteT, ensuring its ongoing relevance and utility in the bioinformatics field. Table 4 presents a comparison of functionalities between BioSuiteT, ExPASy, and NCBI Tools.
The following section presents the conclusions of this research work.

5. Conclusions

This research presents BioSuiteT, a unified web-based platform that integrates multiple bioinformatics tools while addressing many challenges identified in the usage of existing bioinformatics tools. The implementation of BioSuiteT demonstrates that it is possible to create an integrated platform that eliminates installation barriers that affected users through its web-based deployment option and automated scripts for local deployment. Furthermore, it addresses the programming expertise barrier that affected 20.8% of users through its GUI implementation, making bioinformatics tools accessible for users without programming expertise.
The integration of BioSuiteT successfully consolidates twelve essential bioinformatics functionalities into a single environment, addressing the 20.8% demand for unified platforms. The use of Django as the integration framework effectively responds to the 14.6% of users who expressed the need for unified frameworks, demonstrating that modern web technologies can successfully serve as a foundation for integrated bioinformatics tools.
The performance results validate the platform’s capability to handle concurrent users while maintaining efficient memory management. The validation process, involving researchers, experts, and practitioners, confirms that BioSuiteT achieves its goal of improving accessibility while maintaining functionality for biological sequence analysis. BioSuiteT reduces the time spent on tool installation and configuration, allowing researchers to focus more on their analytical work rather than technical setup and troubleshooting. This addresses the concern of 31.25% of users who reported spending more time on technical issues.
While BioSuiteT represents a significant advancement in making bioinformatics tools more accessible and integrated, it also reveals areas for future development, particularly in terms of scalability, additional specialized functionalities, and offline capabilities. BioSuiteT demonstrates that it is possible to create a unified, user-friendly platform that maintains the necessary functionality for biological sequence analysis while reducing technical barriers.

Supplementary Materials

Screenshots of the GUI of BioSuiteT: https://drive.google.com/drive/folders/18W1EzPDhe6w7854rQkcucMUQFYJua9uT?usp=sharing (accessed on 3 June 2025).

Author Contributions

Conceptualization, V.T.-M. and J.M.; methodology, V.T.-M.; software, V.T.-M., J.M., and M.M.; validation, M.C.-P., M.T.-H., J.M., and M.T.-H.; formal analysis, V.T.-M.; investigation, M.T.-H.; resources, V.T.-M.; data curation, V.T.-M., J.M., M.M., M.T.-H., R.B.-H., Y.Q., and M.C.-P.; writing—original draft preparation, V.T.-M., J.M., M.M., M.T.-H., and M.C.-P.; writing—review and editing, V.T.-M., J.M., M.M., M.T.-H., and M.C.-P.; project administration, V.T.-M., J.M., and M.M. All authors have read and agreed to the published version of the manuscript.

Funding

This research received no external funding.

Institutional Review Board Statement

Not applicable.

Informed Consent Statement

Not applicable.

Data Availability Statement

GitHub link for downloading the tool is available at https://github.com/Maigolinox/biosuitet accessed on 1 June 2025. Alternatively, the tool can be downloaded from Source Forge at https://sourceforge.net/projects/biosuitet/ accessed on 1 June 2025.

Acknowledgments

The Research Centre in Mathematics (CIMAT A.C.) and the National Polytechnic Institute (IPN) support the development of this tool.

Conflicts of Interest

The authors declare no conflicts of interest.

Abbreviations

The following abbreviations are used in this manuscript:
GUIGraphical User Interface
PDBProtein Data Bank
DNADeoxyribonucleic Acid
NCBINational Center for Biotechnology Information
PCRPolymerase Chain Reaction
ExPASyExpert Protein Analysis System
BLASTBasic Local Alignment Search Tool
MOTIFSSpecific sequences or structural elements in biological data
APIApplication Programming Interface
ISO/IECInternational Organization for Standardization/International Electrotechnical Commission
MVTModel–View–Template
7ZA file compression format

References

  1. Vasileiou, D.; Karapiperis, C.; Baltsavia, I.; Chasapi, A.; Ahrén, D.; Janssen, P.; Iliopoulos, I.; Promponas, V.; Enright, A.; Ouzounis, C. CGG toolkit: Software components for a computational genomics. PLoS Comput. Biol. 2023, 19, e1011498. [Google Scholar] [CrossRef] [PubMed]
  2. Kashyap, H.; Ahmed, H.; Hoque, N.; Roy, S.; Bhattacharyya, D. Big data analytics in bioinformatics: Architectures, techniques, tools and issues. Netw. Model. Anal. Health Inform. Bioinform. 2016, 5, 28. [Google Scholar] [CrossRef]
  3. Long, J.A. The ‘omics’ revolution: Use of genomic, transcriptomic, proteomic and metabolomic tools to predict male reproductive traits that impact fertility in livestock and poultry. Anim. Reprod. Sci. 2020, 220, 106354. [Google Scholar] [CrossRef] [PubMed]
  4. McArdle, A.; Menikou, S. What is proteomics? Arch. Dis. Child.—Educ. Pract. 2020, 106, 178–181. [Google Scholar] [CrossRef]
  5. Price, E.; Feyertag, F.; Evans, T.; Miskin, J.; Mitrophanous, K.; Dikicioglu, D. What is the real value of omics data? Enhancing research outcomes and securing long-term data excellence. Nucleic Acids Res. 2024, 52, 12130–12140. [Google Scholar] [CrossRef]
  6. Hasin, Y.; Seldin, M.; Lusis, A. Multi-omics approaches to disease. Genome Biol. 2017, 18, 83. [Google Scholar] [CrossRef]
  7. Biswapriya, M.; Langefeld, C.; Olivier, M.; Cox, L. Integrated omics: Tools, advances and future approaches. J. Mol. Endocrinol. 2019, 62, 21–45. [Google Scholar]
  8. Subramanian, I.; Verma, S.; Kumar, S.; Jere, A.; Anamika, K.; Integration, M.-O.D. Multi-omics Data Integration, Interpretation, and Its Application. Bioinform. Biol. Insights 2020, 14, 1177932219899051. [Google Scholar] [CrossRef]
  9. Ahmed, A.; Allen, J.; Bhat, T.; Burra, P.; Fliege, C.; Hart, S.; Heldenbrand, J.; Hudson, M.; Deandre, D.; Kalmbach, M.; et al. Design considerations for workflow management systems use in production genomics research and the clinic. Sci. Rep. 2021, 11, 16–27. [Google Scholar] [CrossRef]
  10. Agamah, F.; Bayjanov, J.; Niehues, A.; Njoku, K.; Skelton, M.; Mazandu, G.; Ederveen, T.; Mulder, N.; Chimusa, E.; Hoen, P. Computational approaches for network-based integrative multi-omics analysis. Front. Mol. Biosci. 2022, 9, 967205. [Google Scholar] [CrossRef]
  11. Gerner, C.; Hill, M. Integrative Multi-Omics in Biomedical Research. Biomolecules 2021, 11, 1527. [Google Scholar] [CrossRef]
  12. Gasteiger, E. ExPASy: The proteomics server for in-depth protein knowledge and analysis. Nucleic Acids Res. 2003, 31, 3784–3788. [Google Scholar] [CrossRef] [PubMed]
  13. Yaseen, M.; Shafi, A.; Masoodi, K. ExPASy portal. In Bioinformatics for EveryOne; Academic Press: Cambridge, MA, USA, 2022; pp. 119–125. [Google Scholar]
  14. Bethesda (MD): National Library of Medicine (US), National Center for Biotechnology Information. Available online: https://www.ncbi.nlm.nih.gov/ (accessed on 1 April 2025).
  15. National Institute of Health—National Library of Medicine. NCBI—About Us and Research. National Library of Medicine. 2024. Available online: https://www.nih.gov/about-nih/ (accessed on 18 December 2024).
  16. Cock, P.; Antao, T.; Chang, J.; Chapman, B.; Cox, C.; Dalke, A.; Friedberg, I.; Hamelryck, T.; Kauff, F.; Wilczynski, B.; et al. Biopython: Freely available Python tools for computational molecular biology and bioinformatics. Bioinformatics 2009, 25, 1422–1423. [Google Scholar] [CrossRef] [PubMed]
  17. Cogent3 Team. Cogent3. Available online: https://cogent3.org/ (accessed on 1 May 2025).
  18. Armstrong, J.; Hickey, G.; Diekhans, M.; Fiddes, I.; Novak, A.; Alden, D.; Fang, Q.; Xie, D.; Feng, S.; Stiller, J.; et al. Progressive Cactus is a multiple-genome aligner for the thousand-genome era. Nature 2020, 587, 246–251. [Google Scholar] [CrossRef] [PubMed]
  19. Knight, R.; Maxwell, P.; Birmingham, A.; Carnes, J.; Caporaso, G.; Easton, B.; Eaton, M.; Hamady, M.; Lindsay, H.; Liu, Z.; et al. PyCogent: A toolkit for making sense from sequence. Genome Biol. 2007, 8, R171. [Google Scholar] [CrossRef]
  20. Butterfield, A.; Vedagiri, V.; Lang, E.; Lawrence, C.; Wakefield, M.; Isaev, A.; Huttley, G. PyEvolve: A toolkit for statistical modelling of molecular evolution. BMC Bioinform. 2004, 5, 1. [Google Scholar] [CrossRef]
  21. Terrón-Macias, V.; Mejia, J.; Canseco-Pérez, M.; Muñoz, M.; Terrón-Hernández, M. FungiRegEx: A tool for patterns identification in Fungal Proteomic sequences using regular expressions. Appl. Sci. 2024, 14, 4429. [Google Scholar] [CrossRef]
  22. Cazier, J. Is There Too Many Bioinformatics Tools? Birmingham University: Birmingham, UK, 2013. Available online: https://www.researchgate.net/post/Is_there_too_many_bioinformatics_tools2 (accessed on 1 January 2025).
  23. Duck, G.; Nenadic, G.; Filannino, M.; Brass, A.; Robertson, D.; Stevens, R. A Survey of Bioinformatics Database and Software Usage through Mining the Literature. PLoS ONE 2016, 11, e0157989. [Google Scholar] [CrossRef]
  24. Ahmad, T.; Senaidy, A. Software Tools in Bioinformatics: A Survey on the Importance and Issues Faced in Implementation. Glob. Eng. Technol. Rev. 2013, 3, 6–10. [Google Scholar]
  25. Terrón-Macias, V.; Mejía, J. Propuesta de unificación de herramientas bioinformáticas para el análisis de secuencias proteómicas y genómicas de algas y hongos. Rev. Lbérica De Sist. Y Tecnol. De Inf. 2024, 53, 132–147. [Google Scholar] [CrossRef]
  26. Pettersen, E.; Goddard, T.; Huang, C.; Couch, G.; Greenblatt, D.; Meng, E.; Ferrin, T. UCSF Chimera—A visualization system for exploratory research and analysis. J. Comput. Chem. 2004, 25, 1605–1612. [Google Scholar] [CrossRef] [PubMed]
  27. Altschul, S.; Gish, W.; Miller, W.; Myers, E.; Lipman, D. Basic local alignment search tool. J. Mol. Biol. 1990, 215, 403–410. [Google Scholar] [CrossRef] [PubMed]
  28. ExPASy. About Expasy. 1 January 2024. Available online: https://www.expasy.org/about#some-history (accessed on 31 December 2024).
  29. The Galaxy Community. The Galaxy platform for accessible, reproducible and collaborative biomedical analyses: 2022 Update. Nucleic Acids Res. 2022, 50, 345–351. [Google Scholar] [CrossRef] [PubMed]
  30. Kearse, M.; Moir, R.; Wilson, A.; Stones-Havas, S.; Cheung, M.; Sturrock, S.; Buxton, S.; Cooper, A.; Markowitz, S.; Duran, C.; et al. Geneious Basic: An integrated and extendable desktop software platform for the organization and analysis of sequence data. Bioinformatics 2012, 28, 1647–1649. [Google Scholar] [CrossRef]
  31. Davies, K. From the Bench to Benchling. Genet. Eng. Biotechnol. News Edge 2020, 2, 303–309. [Google Scholar] [CrossRef]
  32. Okonechnikov, K.; Golosova, O.; Fursov, M. Unipro UGENE: A unified bioinformatics toolkit. Bioinformatics 2012, 28, 1166–1167. [Google Scholar] [CrossRef]
  33. Bayat, A. Science, medicine, and the future Bioinformatics. Clin. Rev. 2002, 324, 1018–1022. [Google Scholar] [CrossRef]
  34. Ramsden, J. Bioinformatics: An Introduction, 4th ed.; Springer Nature: Buckingham, UK, 2023; pp. XXII, 404. [Google Scholar]
  35. Agnihotry, S.; Pathak, R.; Singh, D.; Tiwari, A.; Hussain, I. Protein structure prediction. In Bioinformatics: Methods and Applications; Academic Press: Cambridge, MA, USA, 2022; pp. 177–188. [Google Scholar]
  36. Zhang, C.; Freddolino, L. A large-scale assessment of sequence database search tools for homology-based protein function prediction. Brief. Bioinform. 2024, 25, 1–12. [Google Scholar] [CrossRef]
  37. Narayanan, P. Bioinformatics: A primer, United States of America; New Age International Publishers: New York, NY, USA, 2005; p. 248. [Google Scholar]
  38. Sherman, B.; Hao, M.; Qiu, J.; Jiao, X.; Baseler, M.; Lane, C.; Imamichi, T.; Chang, W. DAVID: A web server for functional enrichment analysis and functional annotation of gene lists (2021 update). Nucleic Acids Res. 2022, 50, 216–221. [Google Scholar] [CrossRef]
  39. Abed, R.; Al-Najjar, Y. Bioinformatics Storing Databases. Tech. Biochem. 2021, 2, 96–105. [Google Scholar] [CrossRef]
  40. Huddleston, J.; Hadfield, J.; Sibley, T.; Lee, J.; Fay, K.; Ilcisin, M.; Harkins, E.; Bedford, T.; Neher, R.; Hodcroft, E. Augur: A bioinformatics toolkit for phylogenetic analyses of human pathogens. J. Open Source Softw. 2021, 6, 2906. [Google Scholar] [CrossRef] [PubMed]
  41. Grant, B.; Skjærven, L.; Yao, X.-Q. The Bio3D packages for structural bioinformatics. Protein Sci. 2020, 30, 20–30. [Google Scholar] [CrossRef] [PubMed]
  42. Mathon, L.; Valentini, A.; Guérin, P.E.; Normandeau, E.; Noel, C.; Lionnet, C.; Boulanger, E.; Thuiller, W.; Bernatchez, L.; Mouillot, D.; et al. Benchmarking bioinformatic tools for fast and accurate eDNA metabarcoding species identification. Mol. Ecol. Resour. 2021, 21, 2565–2579. [Google Scholar] [CrossRef] [PubMed]
  43. Shen, W.; Song, Z.; Zhong, X.; Huang, M.; Shen, D.; Gao, P.; Qian, X.; Wang, M.; He, X.; Wang, T.; et al. Sangerbox: A comprehensive, interaction-friendly clinical bioinformatics analysis platform. iMeta 2022, 1, e36. [Google Scholar] [CrossRef]
  44. Wang, Y.; Geer, L.; Chappey, C.; Kans, J.; Bryant, S. Cn3D: Sequence and structure views for Entrez. Trends Biochem. Sci. 2000, 25, 300–302. [Google Scholar] [CrossRef]
  45. Raschka, S. BioPandas: Working with molecular structures in pandas DataFrames. J. Open Source Softw. 2017, 2, 279. [Google Scholar] [CrossRef]
  46. Rego, N.; Koes, D. 3Dmol.js: Molecular visualization with WebGL. Bioinformatics 2014, 31, 1322–1324. [Google Scholar] [CrossRef]
  47. Mejía, J.; Terrón-Macias, V.; Muñoz, M.; Terrón-Hernández, M.; Canseco-Perez, M. VSEST 29110 Tool: Using ChatGPT to evaluate the implementation of the ISO/IEC 29110 work products. IEEE Access 2024, 12, 120935–120948. [Google Scholar] [CrossRef]
  48. Chen, S.; Ahmmed, S.; Lal, K.; Dem, C. DJANGO Web Development Framework: Powering the modern web. Am. J. Trade Policy 2020, 1, 99–106. [Google Scholar] [CrossRef]
  49. Kumar, M.; Nandal, R. Role of Python in Rapid Web Application Development Using Django. In Proceedings of the International Conference on Innovative Computing and Communication, New Delhi, India, 8 March 2024; pp. 1–13. [Google Scholar]
  50. Chauhan, A. A Review on Various Aspects of MongoDb Databases. Int. J. Eng. Res. Technol. 2019, 8, 90–92. [Google Scholar]
  51. Manohar, P.; Singh, S. Protein Sequence Alignment: A Review. World Appl. Program. 2012, 2, 141–145. [Google Scholar]
  52. Pandy, G.; Pugazhenthi, V.; Murugan, A. Advances in Software Testing in 2024: Experimental Insights, Frameworks, and Future Directions. Int. J. Adv. Res. Comput. Commun. Eng. 2024, 13, 40–45. [Google Scholar]
  53. Lukasczyk, S.; Kroiß, F.; Fraser, G. Automated Unit Test Generation for Python. Search-Based Softw. Eng. 2020, 12420, 9–24. [Google Scholar]
  54. Gentile, A. Basics of DJango_Model-View-Template (MVT) Architecture. 30 November 2023. Available online: https://angelogentileiii.medium.com/basics-of-django-model-view-template-mvt-architecture-8585aecffbf6 (accessed on 18 December 2024).
Figure 1. Bioinformatics tools perception.
Applsci 15 06565 g001
Figure 2. Survey findings on bioinformatics tools perception.
Applsci 15 06565 g002
Figure 3. Most used functionalities and their purpose.
Applsci 15 06565 g003
Figure 4. Components of BioSuiteT.
Applsci 15 06565 g004
Figure 17. Performance metrics.
Applsci 15 06565 g017
Table 1. Comparative table of functionalities among bioinformatics platforms, software tools, and libraries. ✔ means a functionality that is covered, ✖ meands a function that is not covered. “Partial” indicates that the functionality is only partially supported—either limited in scope, applicability, or implementation. “Limited” refers to functionalities that are constrained in performance or usability, or depend heavily on specific conditions, configurations, or external dependencies.
FunctionalitiesPlatformsSoftware Tools and Libraries
ExPASyNCBI ToolsGalaxyGeneiousBenchlingUGENEChimeraBLASTBioPython
Sequence analysisPartial
Structure predictionPartial
Homology search and sequence alignment
Primer designPartial
Gene expression analysisPartial
Functional annotationPartialPartial
Databases and data retrieval
Phylogenetic analysis
Structural visualization and analysisPartialPartialLimitedLimited
Translation and transcription
Genome and species explorationPartialPartialPartial
Reverse transcription
Interaction analysisPartialPartialPartial
Variants and mutationsLimitedPartialPartial
Table 2. Tools and software components for BioSuiteT development.
ComponentRole
BioPython v.1.81Core sequence analysis
BioPandas v0.4.1Structural data handling
FungiRegEx v1.0Regular expression finding
3Dmol.jsPDB structural visualization
Python v3.10Programming language
Django v4.1.3Framework for web application development
Table 3. BioSuiteT’s impact on user challenges from Cazier’s survey. This table summarizes BioSuiteT’s impact on the user challenges when users use other bioinformatics tools; these challenges were identified in Cazier’s survey.
User Challenge% Affected UsersBioSuiteT SolutionImpact
Tool installation complexity25%Web-based access; automated local scripts for execution.Web: 0 min setup; local: 85% faster installation.
Programming expertise barrier20.8%Unified GUI; no-code interface.Non-programmers completed tasks without support.
Tool fragmentation20.8%Tools are integrated into a single environment.Reduction in tool switching.
Time spent troubleshooting31.25%Single environment; detailed documentation about how to execute the web application locally.Reduction in support requests.
Demand for unified frameworks14.6%Django-based integration.Full-tool interoperability.
Table 4. Comparison of functionalities between ExPASy, NCBI Tools, and BioSuiteT. “Partial” indicates that the functionality is only partially supported—either limited in scope, applicability, or implementation. ✔ means a functionality that is covered, ✖ meands a function that is not covered. “Limited” refers to functionalities that are constrained in performance, usability, or depend heavily on specific conditions, configurations, or external dependencies. Modularity refers to a software design principle that enables the independent implementation of new features.
FunctionalitiesPlatforms
ExPASyNCBI ToolsBioSuiteTGalaxyGeneiousBenchlingUGENE
DNA sequence analysis
Protein sequence analysis
Transcription
Reverse transcription
Sequence translation
Pairwise sequence alignment
BLAST integration
PDB structure viewerLimited
PDB analysisPartial
Phylogenetic trees
MOTIFS analysisPartial
Regular expression search
Biological data storage
GUI
No installation required (web version)
Unified environment PartialPartial
Type of GUIWebWebWeb/LocalWebDesktopWebDesktop
InstallationNo requiredNo requiredOptionalRequiredRequiredNo requiredRequired
ModularityNoNoYesYesNoNoNo
paid?FreeFreeFreeFreePaidPaidFree
Disclaimer/Publisher’s Note: The statements, opinions and data contained in all publications are solely those of the individual author(s) and contributor(s) and not of MDPI and/or the editor(s). MDPI and/or the editor(s) disclaim responsibility for any injury to people or property resulting from any ideas, methods, instructions or products referred to in the content.

