Article

Fault Diagnosis Systems for Robots: Acoustic Sensing-Based Identification of Detached Components for Fault Localization

Graduate School of Informatics and Engineering, University of Electro-Communications, 1-5-1, Chofugaoka, Chofu-shi, Tokyo 182-8585, Japan
*
Author to whom correspondence should be addressed.
Appl. Sci. 2025, 15(12), 6564; https://doi.org/10.3390/app15126564
Submission received: 25 April 2025 / Revised: 31 May 2025 / Accepted: 9 June 2025 / Published: 11 June 2025
(This article belongs to the Special Issue New Technology Trends in Smart Sensing)

Abstract

As robotic systems become more prevalent in daily life and industrial environments, ensuring their reliability through autonomous self-diagnosis is becoming increasingly important. This study investigates whether acoustic sensing can serve as a viable foundation for such self-diagnostic systems by examining its effectiveness in localizing structural faults. This study focuses on developing a fault diagnosis framework for robots using acoustic sensing technology. The objective is to design a simple yet accurate system capable of identifying fault locations and types of robots based solely on sound data, without relying on traditional sensors or cameras. To achieve this, sweep signals were applied to a modular robot, and acoustic responses were collected under various structural configurations over five days. Frequency-domain features were extracted using the Fast Fourier Transform (FFT), and classification was performed using five machine learning models: Support Vector Machine (SVM), Random Forest (RF), K-Nearest Neighbors (KNN), XGBoost, and Multi-Layer Perceptron (MLP). Among these, MLP achieved the highest accuracy (71.4%), followed by SVM (65.7%), LightGBM (62.9%), KNN (60%), XGBoost (57.1%), and RF (51.4%). These results demonstrate the feasibility of diagnosing structural changes in robots using acoustic sensing alone, even with a compact hardware setup and limited training data. These findings suggest that acoustic sensing can provide a practical and efficient approach for robot fault diagnosis, offering potential applications in environments where conventional diagnostic tools are impractical. The study highlights the advantages of incorporating acoustic sensing into fault diagnosis systems and underscores its potential for developing accessible and effective diagnostic solutions for robotics.

1. Introduction

Acoustic sensing has long been employed in the field of mechanical fault detection, particularly through Acoustic Emission (AE) techniques. AE refers to the passive detection of transient elastic waves generated by materials under stress, such as crack propagation, friction, or impact. It has proven to be an effective and sensitive method for identifying faults in components like bearings, gears, and induction motors, where mechanical defects naturally emit detectable high-frequency sound signals. Due to its non-invasive nature and high responsiveness, AE has been widely adopted in industrial condition monitoring systems [1,2,3,4,5,6,7,8]. Furthermore, several comparative studies have suggested that AE offers superior coverage of higher-frequency bands and greater sensitivity to early-stage damage than traditional vibration-based sensors. These characteristics make it suitable for detecting minute structural changes that might otherwise go unnoticed using conventional accelerometer-based diagnostics [9,10].
However, the effectiveness of AE-based fault diagnosis is inherently tied to the occurrence of spontaneous sound-generating events. In other words, the machine must emit a sound due to internal stress or damage for the system to detect it. This reliance on passive signal acquisition poses a limitation, especially in systems that do not continuously produce mechanical noise or operate under conditions that do not easily generate Acoustic Emissions.
Robotic systems exemplify such a challenge. Unlike rotating machinery where faults naturally generate acoustic signals, robots typically produce minimal or inconsistent mechanical noise during normal operation, especially in static or idle states. This limits the applicability of conventional AE techniques for robotic fault detection. For instance, Roennau et al. [11] proposed a fault diagnosis system for a six-legged walking robot that utilizes onboard cameras and visual markers placed on the robot’s limbs to detect structural deviations. While this method can effectively assess limb positioning and configuration under optimal conditions, it is inherently limited by occlusion—when markers are blocked or move out of the camera’s field of view—and by environmental factors such as lighting and visual clutter. These constraints highlight the need for sensing methods that are robust to visual obstruction and environmental variability. To overcome these limitations, we turn to active acoustic sensing technology. Active acoustic sensing (AAS) involves intentionally sending acoustic signals (e.g., swept tones) into a system and estimating the transmission characteristics of the target object by analyzing the responses, such as reflection, resonance, and absorption patterns. Compared to vibration-based sensors, which often require direct contact with the structure and are limited to narrow frequency bands, active acoustic sensing provides the flexibility to excite and measure responses across a broader frequency range. This allows for more detailed structural characterization and increases the likelihood of detecting subtle anomalies in robot assemblies, including loosely connected parts or early-stage damage. Hand posture estimation is a typical application of AAS in the field of human–machine interaction [12,13,14,15]. In many cases, the aim is to recognize gestures by wearing a ring or bracelet-like device on a finger or hand and estimating the hand posture. In recent years, AAS has been applied not only to hand posture estimation but also to estimating sitting posture [16]. It is also applied to object localization [17,18], user authentication [19,20] and action recognition [21]. While these applications have demonstrated the versatility of AAS in human–computer interaction, its potential for robotic structural diagnosis remains largely underexplored. This study uniquely explores the use of AAS to detect and localize structural anomalies in robots, thereby extending its application domain to autonomous mechanical systems.
Our goal is to apply the properties of AAS to robot fault diagnosis and infer structural or functional abnormalities in robots. This method is similar to sonar or ultrasound imaging and is particularly suitable for systems where passive emission is insufficient or unreliable. In robotic applications, AAS enables fault diagnosis even when the robot is not in motion or when the faults do not result in prominent audible cues. The long-term vision of this research is to develop an autonomous self-diagnostic system for robots based on acoustic sensing. As an initial step toward this goal, the present study investigates whether component detachments—one type of externally observable structural fault—can be localized using only acoustic responses.
This study builds upon the concept of active acoustic sensing to propose a novel fault diagnosis framework for robots. Rather than directly identifying specific fault types or internal functional failures, this study aims to evaluate whether structural anomalies such as component detachment can be acoustically localized. This represents a foundational step toward building a comprehensive self-diagnostic system based on acoustic sensing. To this end, sweep signals are applied to specific parts of a modular robot, and the resulting acoustic responses are analyzed to determine whether the location of the structural change can be correctly classified. Five classification algorithms—Support Vector Machine (SVM) [22,23,24,25], Random Forest (RF) [26,27,28,29,30,31], K-Nearest Neighbors (KNN) [32,33,34,35,36], XGBoost [37,38,39,40], LightGBM [41,42,43], and Multi-Layer Perceptron (MLP) [44,45,46,47]—are evaluated based on experimental data. The findings demonstrate that acoustic-based active sensing can be a reliable and accessible solution for robotic fault diagnosis, especially in scenarios where conventional diagnostic tools are impractical. Beyond its technical contributions, this research also addresses the broader need for scalable and cost-effective fault detection in the growing field of autonomous and modular robotics. As robotic platforms continue to proliferate across domains such as logistics, education, and home assistance, maintaining their mechanical integrity becomes increasingly critical. Traditional sensor-based approaches often require expensive instrumentation, specialized installation, or high-volume training data. In contrast, the proposed acoustic sensing approach is low-cost, non-invasive, and compatible with minimal hardware, making it a practical candidate for widespread deployment, particularly in environments with constrained resources.
This paper is organized as follows: Section 2 describes the experimental platform, data collection procedures, and machine learning classifiers used in this study. Section 3 presents the classification results and analysis. Section 4 discusses the implications and limitations of the findings, while Section 5 concludes the paper and outlines future directions toward realizing self-diagnostic acoustic systems for robotic platforms.

2. Materials and Methods

The experimental setup consisted of an Apitor Robot X (Apitor, Shenzhen, China), which served as the robotic platform, and a Humbird Speaker (Duramobi, Shenzhen, China) (120 Hz–16 kHz, ~110 dB), a bone conduction speaker, for acoustic signal transmission. This platform was chosen because it is a modular, assembly-type robot, which made it easy to simulate artificial fault conditions such as partial detachment or loose joints in a controlled and repeatable manner. An external microphone (Sony ECM-LV1 (Sony, Tokyo, Japan)) was used to capture the reflected signals. The experiments were conducted in a controlled indoor environment to minimize ambient noise and ensure consistent acoustic reflections. For signal processing and classification, a MacBook Pro 16 (Apple M3 Pro, 18 GB RAM) (Apple, Cupertino, CA, USA) was used, running Python(3.12.4) with relevant signal processing and machine learning libraries. The overall mechanism of the proposed fault diagnosis system is illustrated in Figure 1.

2.1. Concept of Transfer Function and Frequency Response

In physical systems, the relationship between an input signal and the system’s response can be modeled using a transfer function. Particularly for linear time-invariant systems, the transfer function provides a concise representation of the system’s behavior in the frequency domain, allowing for efficient analysis and comparison. The transfer function is defined as the ratio of the Laplace transforms of the output signal Y(s) to the input signal X(s):
H s = Y s X s
where s is the complex frequency variable, defined as s = σ + jω, with σ representing the real part and ω the angular frequency. In this study, the target system is a modular robot composed of interlocking blocks. A sweep signal is used as an input to induce mechanical vibrations throughout the structure, and the resulting acoustic response is captured by a microphone. In this context, the robot and its structure can be viewed as a dynamic system with a transfer function H(s) that characterizes how it responds to external acoustic stimulation. The relationship between input and output in the Laplace domain is then expressed as Equation (2):
Y s = H s · X s .
While the general transfer function H(s) describes the system’s behavior in the complex frequency domain, substituting s = jω allows the analysis to be restricted to the real frequency axis. This yields the frequency response of the system:
H j ω = Y j ω X j ω .
The function H(jω) describes how the system reacts to acoustic inputs of different frequencies and is a practical expression of the transfer function in real-world measurements. By applying a broadband sweep signal as the input, the full frequency response of the system can be observed.
In this experiment, the sweep signal X(f) is applied to the robot, and the response signal y(t) is recorded. t represents the time. f represents the frequency. The output signal is then transformed to the frequency domain using the Fast Fourier Transform (FFT), yielding Y(f). Given that the input is known and consistent, the observed output Y(f) reflects the system’s transfer function in the frequency domain:
Y f = H f · X f .
Any structural changes—such as detachment or failure of a specific component—alter the physical configuration of the system, which in turn changes the transfer function H(f). Therefore, the frequency-domain characteristics of the output signal also change depending on the condition of the robot. This change in the frequency response serves as the basis for classification. In this study, the frequency-domain features obtained from FFT are used to train machine learning models, which can then distinguish between different fault conditions based on patterns in the transfer function.

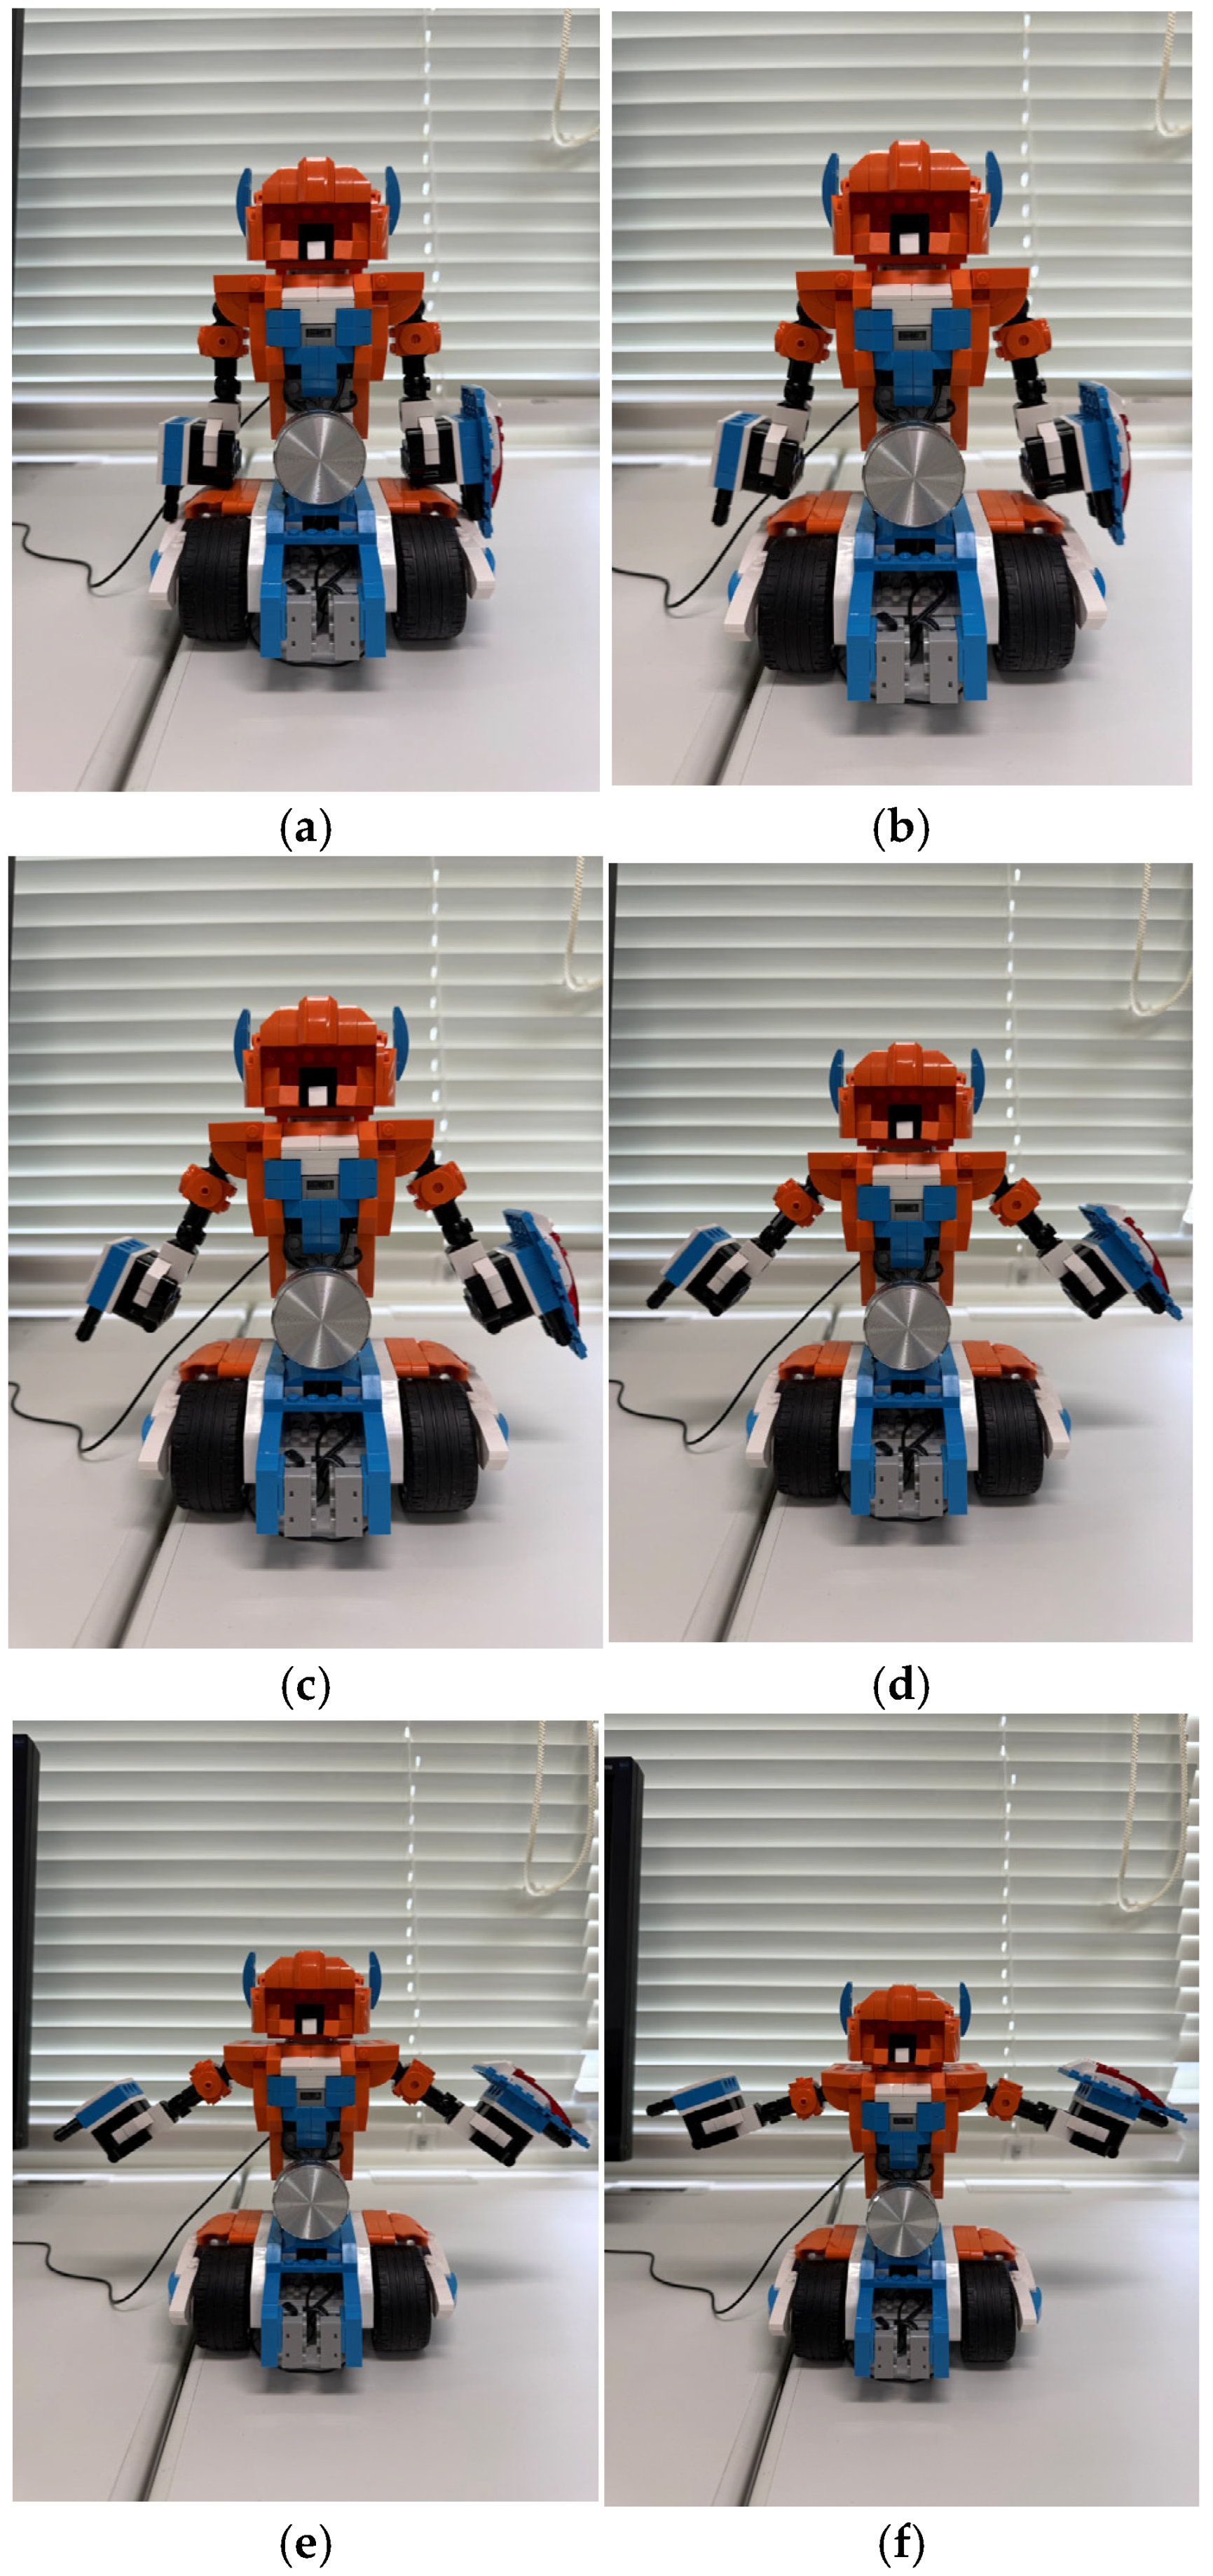
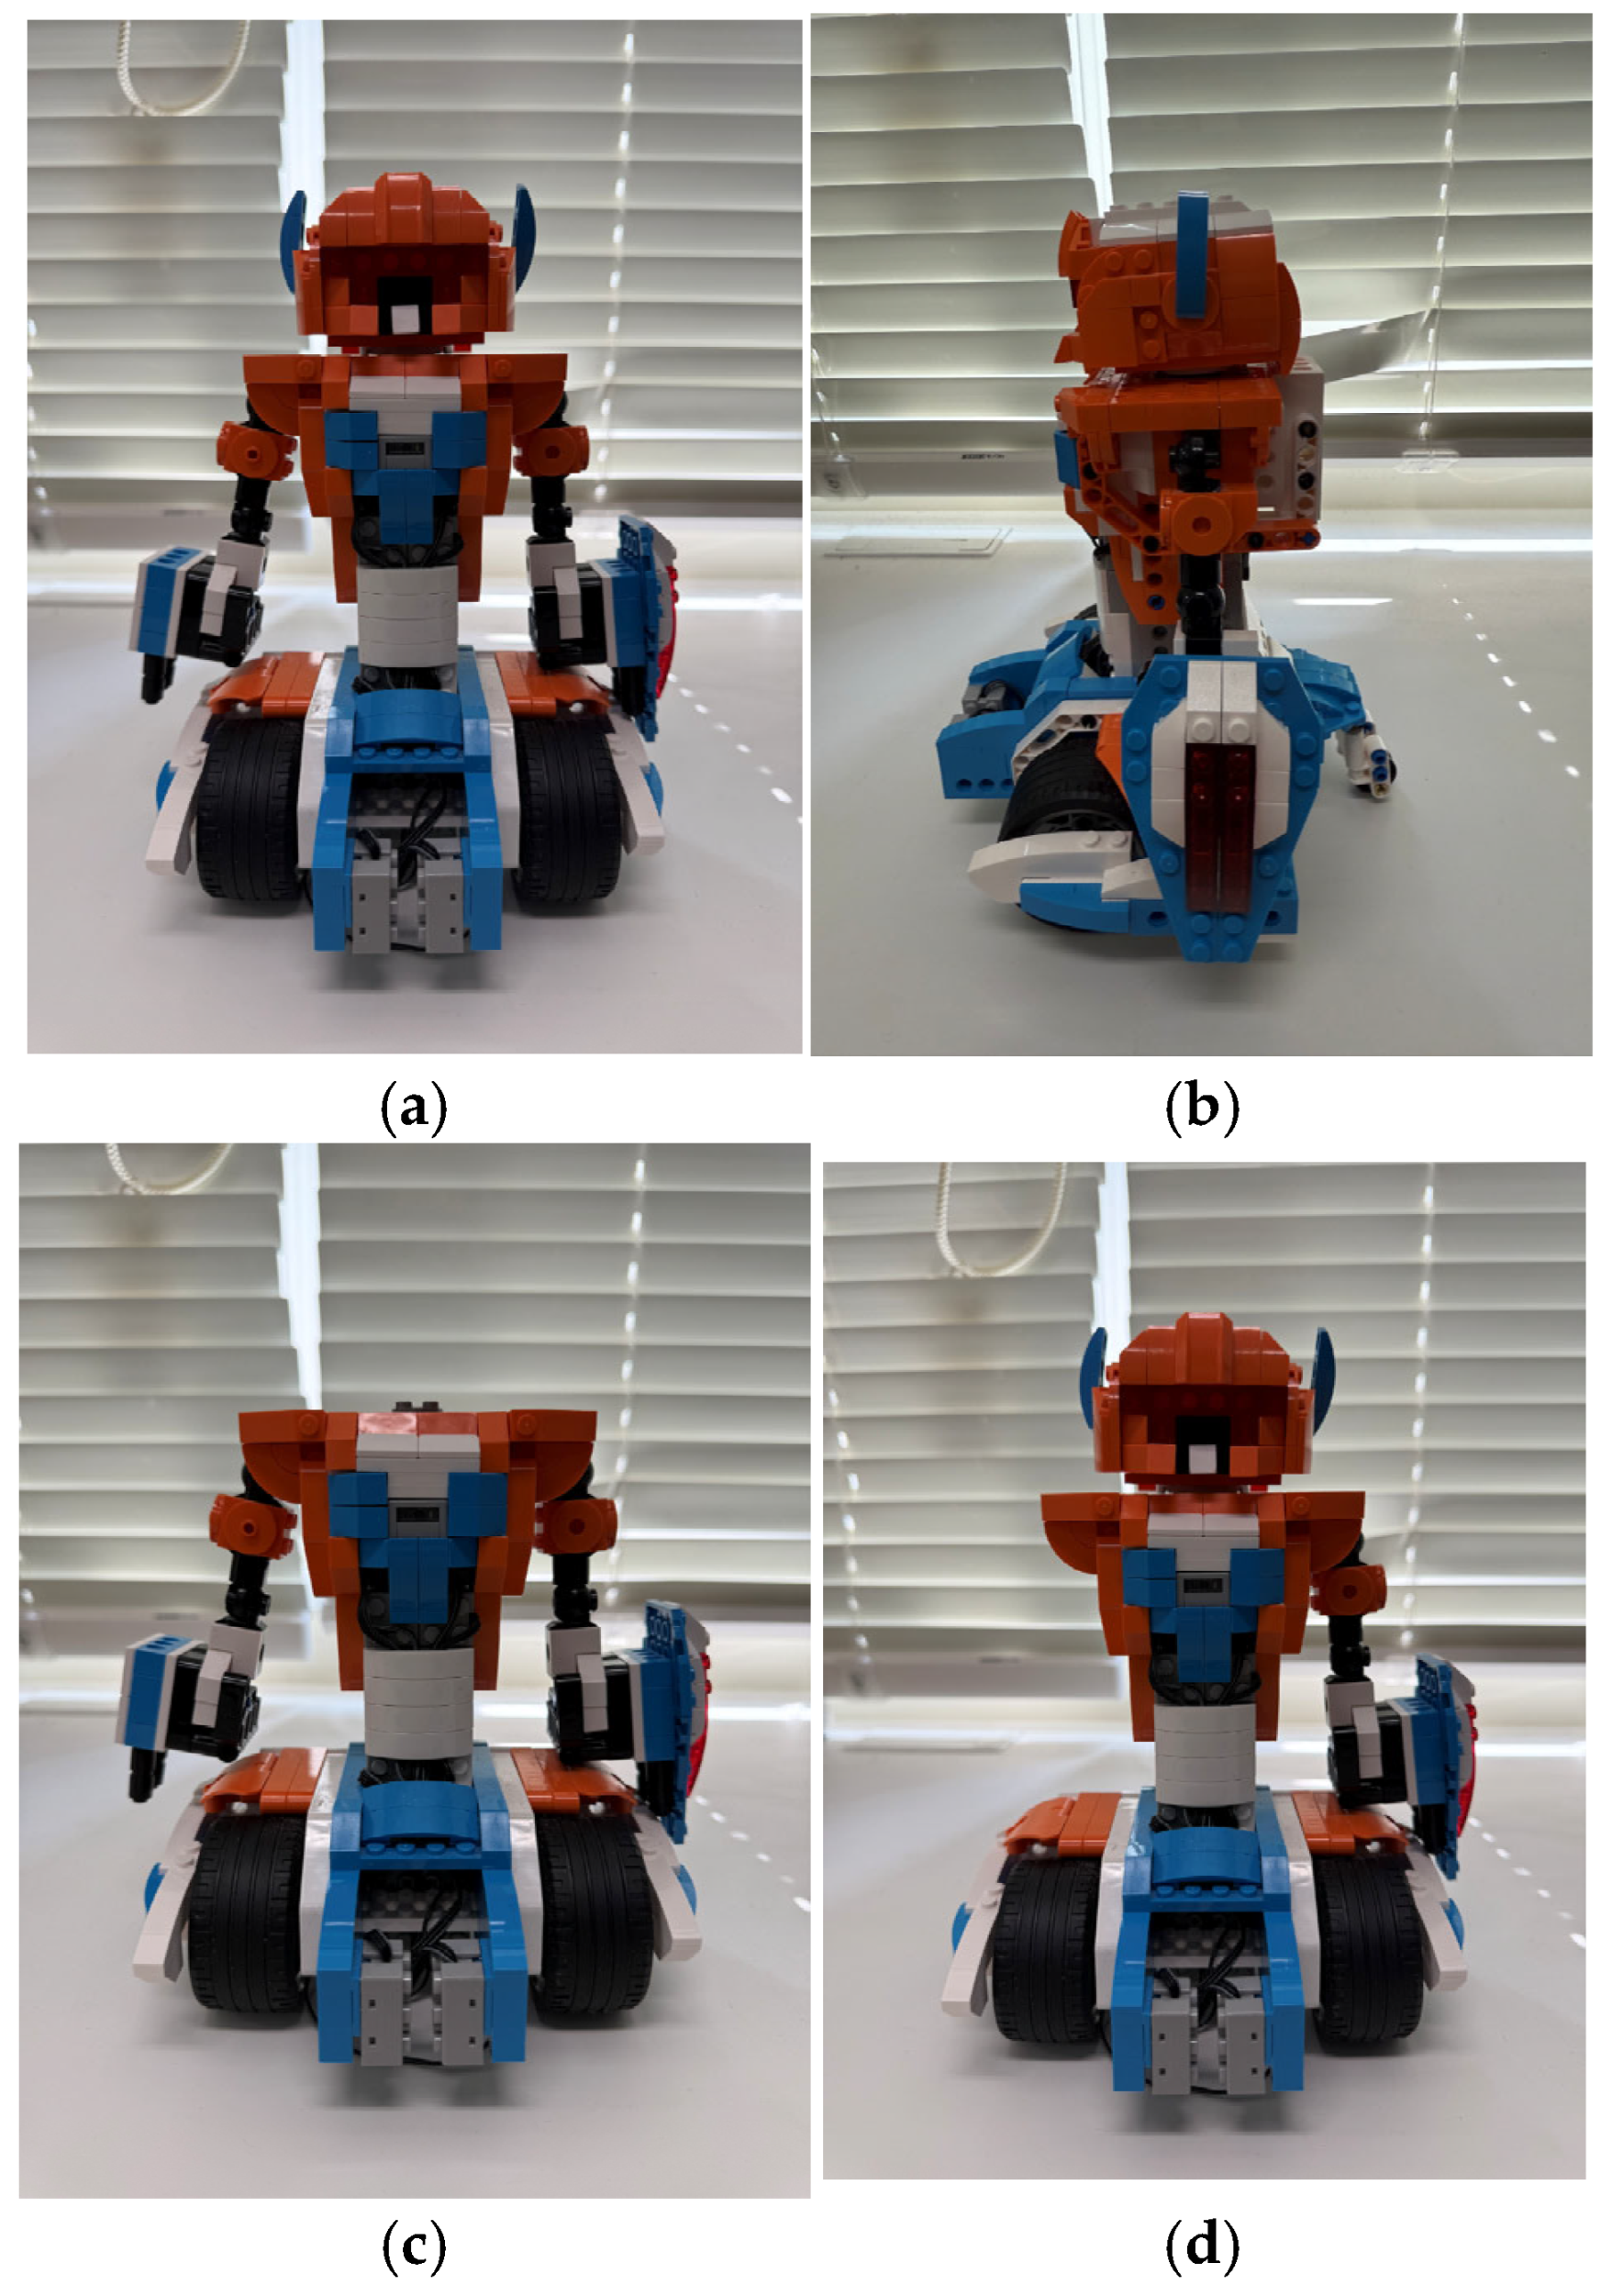
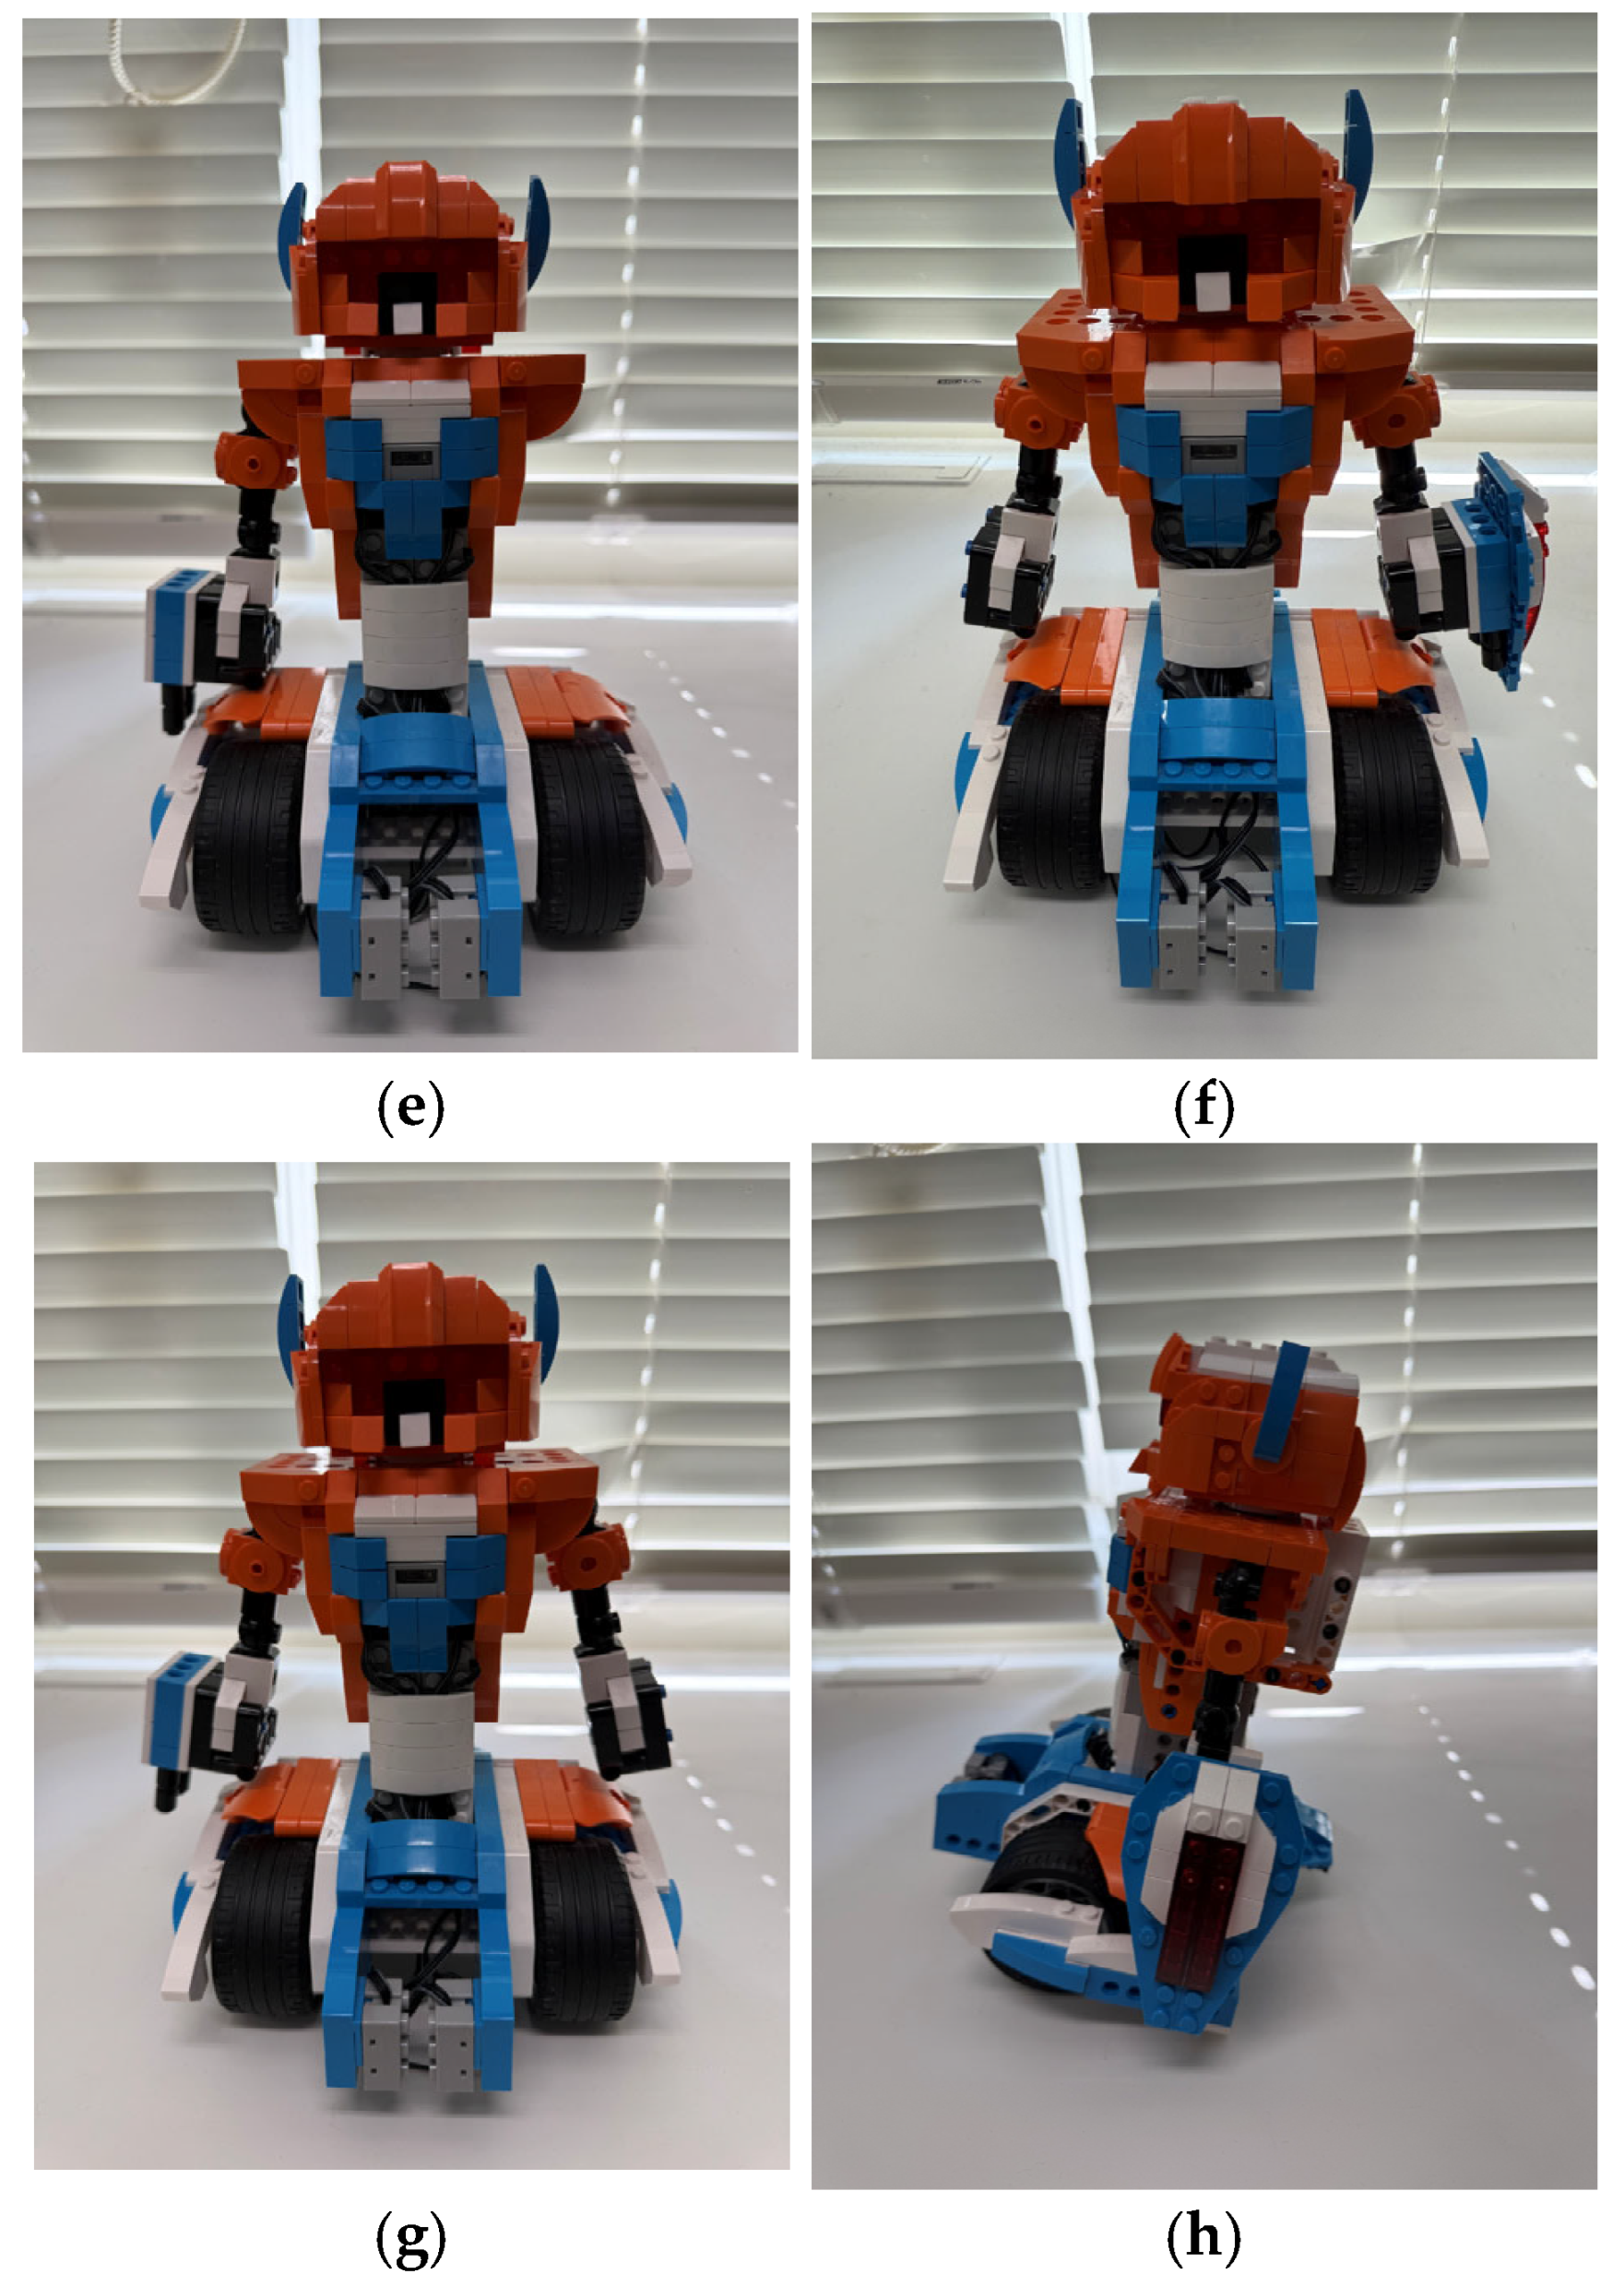
2.2. Experimental Setup and Data Acquisition

A series of controlled experiments were conducted to examine the effectiveness of active acoustic sensing in detecting structural changes in the robot. The Apitor Robot X was used as the test platform, equipped with a Humbird Speaker to generate acoustic signals and a microphone (Sony ECM-LV1) to capture the induced acoustic response propagated through the robot body. The speaker was attached to the abdominal part of the robot to induce structural vibrations, while the stereo microphone (Sony ECM-LV1 (Sony, Tokyo, Japan)) was positioned on the dorsal side to collect the resulting acoustic data. The speaker was positioned to direct sound waves from the front toward the back of the robot. The stereo microphone was fixed laterally on the dorsal side, aligned parallel to the robot’s surface. The experimental environment was kept consistent to minimize variations caused by external noise or reflections. The schematic diagram of the experiment is presented in Figure 2.
The excitation signal was a 10 s linear chirp sweeping from 200 Hz to 3200 Hz, designed to uniformly excite the robot structure across a wide frequency band. To account for the robot’s joint mobility, the experiment was designed to reflect nine discrete arm positions, where the robot’s arms were stopped at fixed angles. For each of these positions, data were collected five times per structural condition. Considering seven different fault conditions, this resulted in a total of 315 training samples. During this experiment, all other joints of the robot were fixed to maintain consistency and isolate the effect of arm position on the acoustic response. This constraint was particularly important because creating artificial fault conditions such as loosening or detaching components inevitably required some manual handling of the robot. Such handling could unintentionally disturb adjacent joints or slightly alter the robot’s posture. To reduce these secondary effects and ensure that the observed acoustic changes were primarily due to the intended structural modifications, the robot’s other joints were kept in fixed positions throughout the recordings. Figure 3 shows the image of the actual recording procedure.
For testing, five random joint positions were selected independently of the training positions. At each of these positions, acoustic responses were recorded for all seven fault conditions, producing 35 test samples in total. The joint angle variations and their impact on sensing are illustrated in Figure 4.
The recording process was automated using Python-based control scripts and synchronized with the playback of chirp signals. The structural configurations tested are summarized in Figure 5.

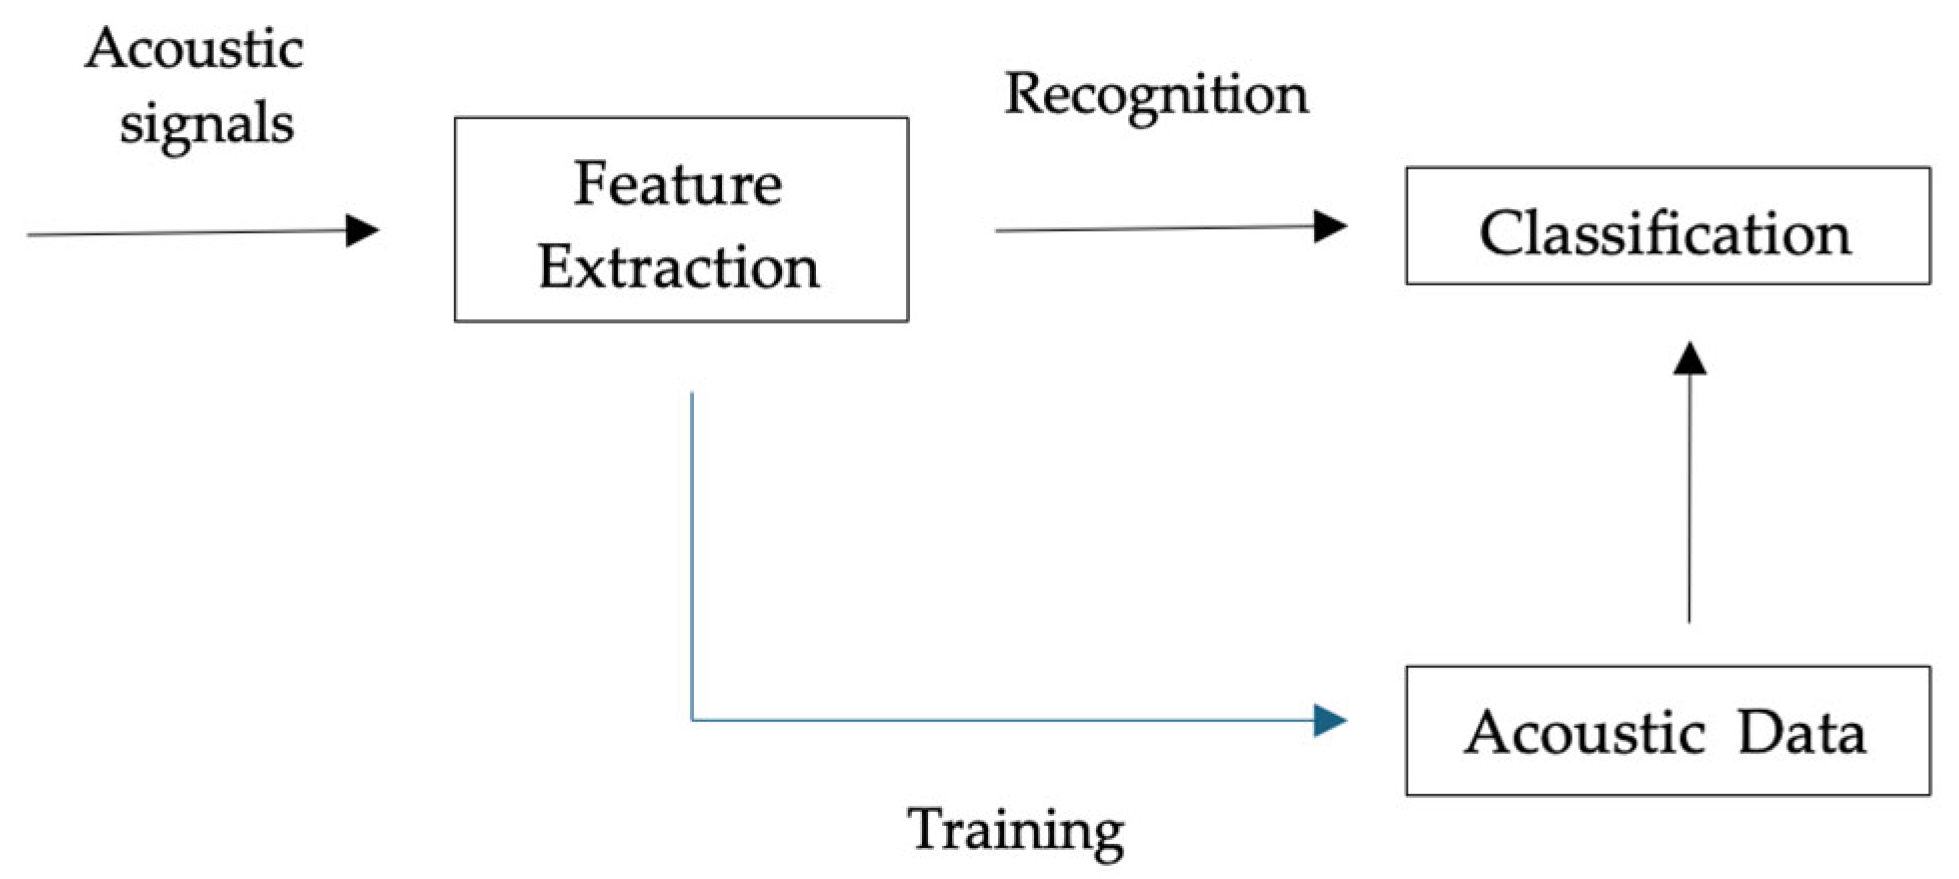
2.3. Signal Processing and Feature Extraction

The recorded signals were processed using the Fast Fourier Transform (FFT) to convert them into frequency-domain representations. All audio signals were sampled at 48,000 Hz and converted to mono by selecting a single channel from stereo inputs, ensuring consistency across files. A 1 s segment (48,000 samples) was extracted from the beginning of each recording and multiplied by a Hamming window to minimize spectral leakage. The FFT was then computed using real-valued FFT, yielding only the positive-frequency components. The magnitude spectrum was calculated from the complex output and paired with the corresponding frequency bins to form a set of frequency–amplitude features. These features were stored in CSV format for each audio file, with one row per frequency component. The entire pipeline was implemented in Python using NumPy (1.26.4), SciPy (1.14.1), and other standard libraries. Custom scripts were developed to automate the batch processing of all recordings.

2.4. Fault Classification and Model Comparison

To evaluate the feasibility of fault localization using acoustic features, six machine learning models were tested using scikit-learn (1.5.2), XGBoost (3.0.0), and LightGBM (4.6.0) library: Support Vector Machine (SVM), Random Forest (RF), K-Nearest Neighbors (KNN), XGBoost, LightGBM, and Multi-Layer Perceptron (MLP).
The models were trained using labeled frequency-domain data obtained from FFT analysis of the recorded signals. Each sample was annotated based on the robot’s structural condition during recording (e.g., normal, head removed, right arm removed, etc.).
Hyperparameter tuning was conducted using the training dataset, based on 5-fold cross-validation. For SVM, KNN, and RF, hyperparameters were optimized using randomized search, while for XGBoost, LightGBM, and MLP, a grid search approach was applied. This tuning procedure aimed to identify model configurations that generalized well across the internal folds of the training set, without reference to the test data.
Once optimal hyperparameters were determined, 5-fold cross-validation was again applied within the training data to assess classification performance under consistent conditions.
Subsequently, the tuned models were applied to a completely independent test dataset to compare the performance of all six classifiers under real-world conditions.
This two-phase process, consisting of a systematic cross-validation-based tuning and independent testing, was designed to support the development of a robust diagnostic system for fault localization using acoustic sensing.

3. Results

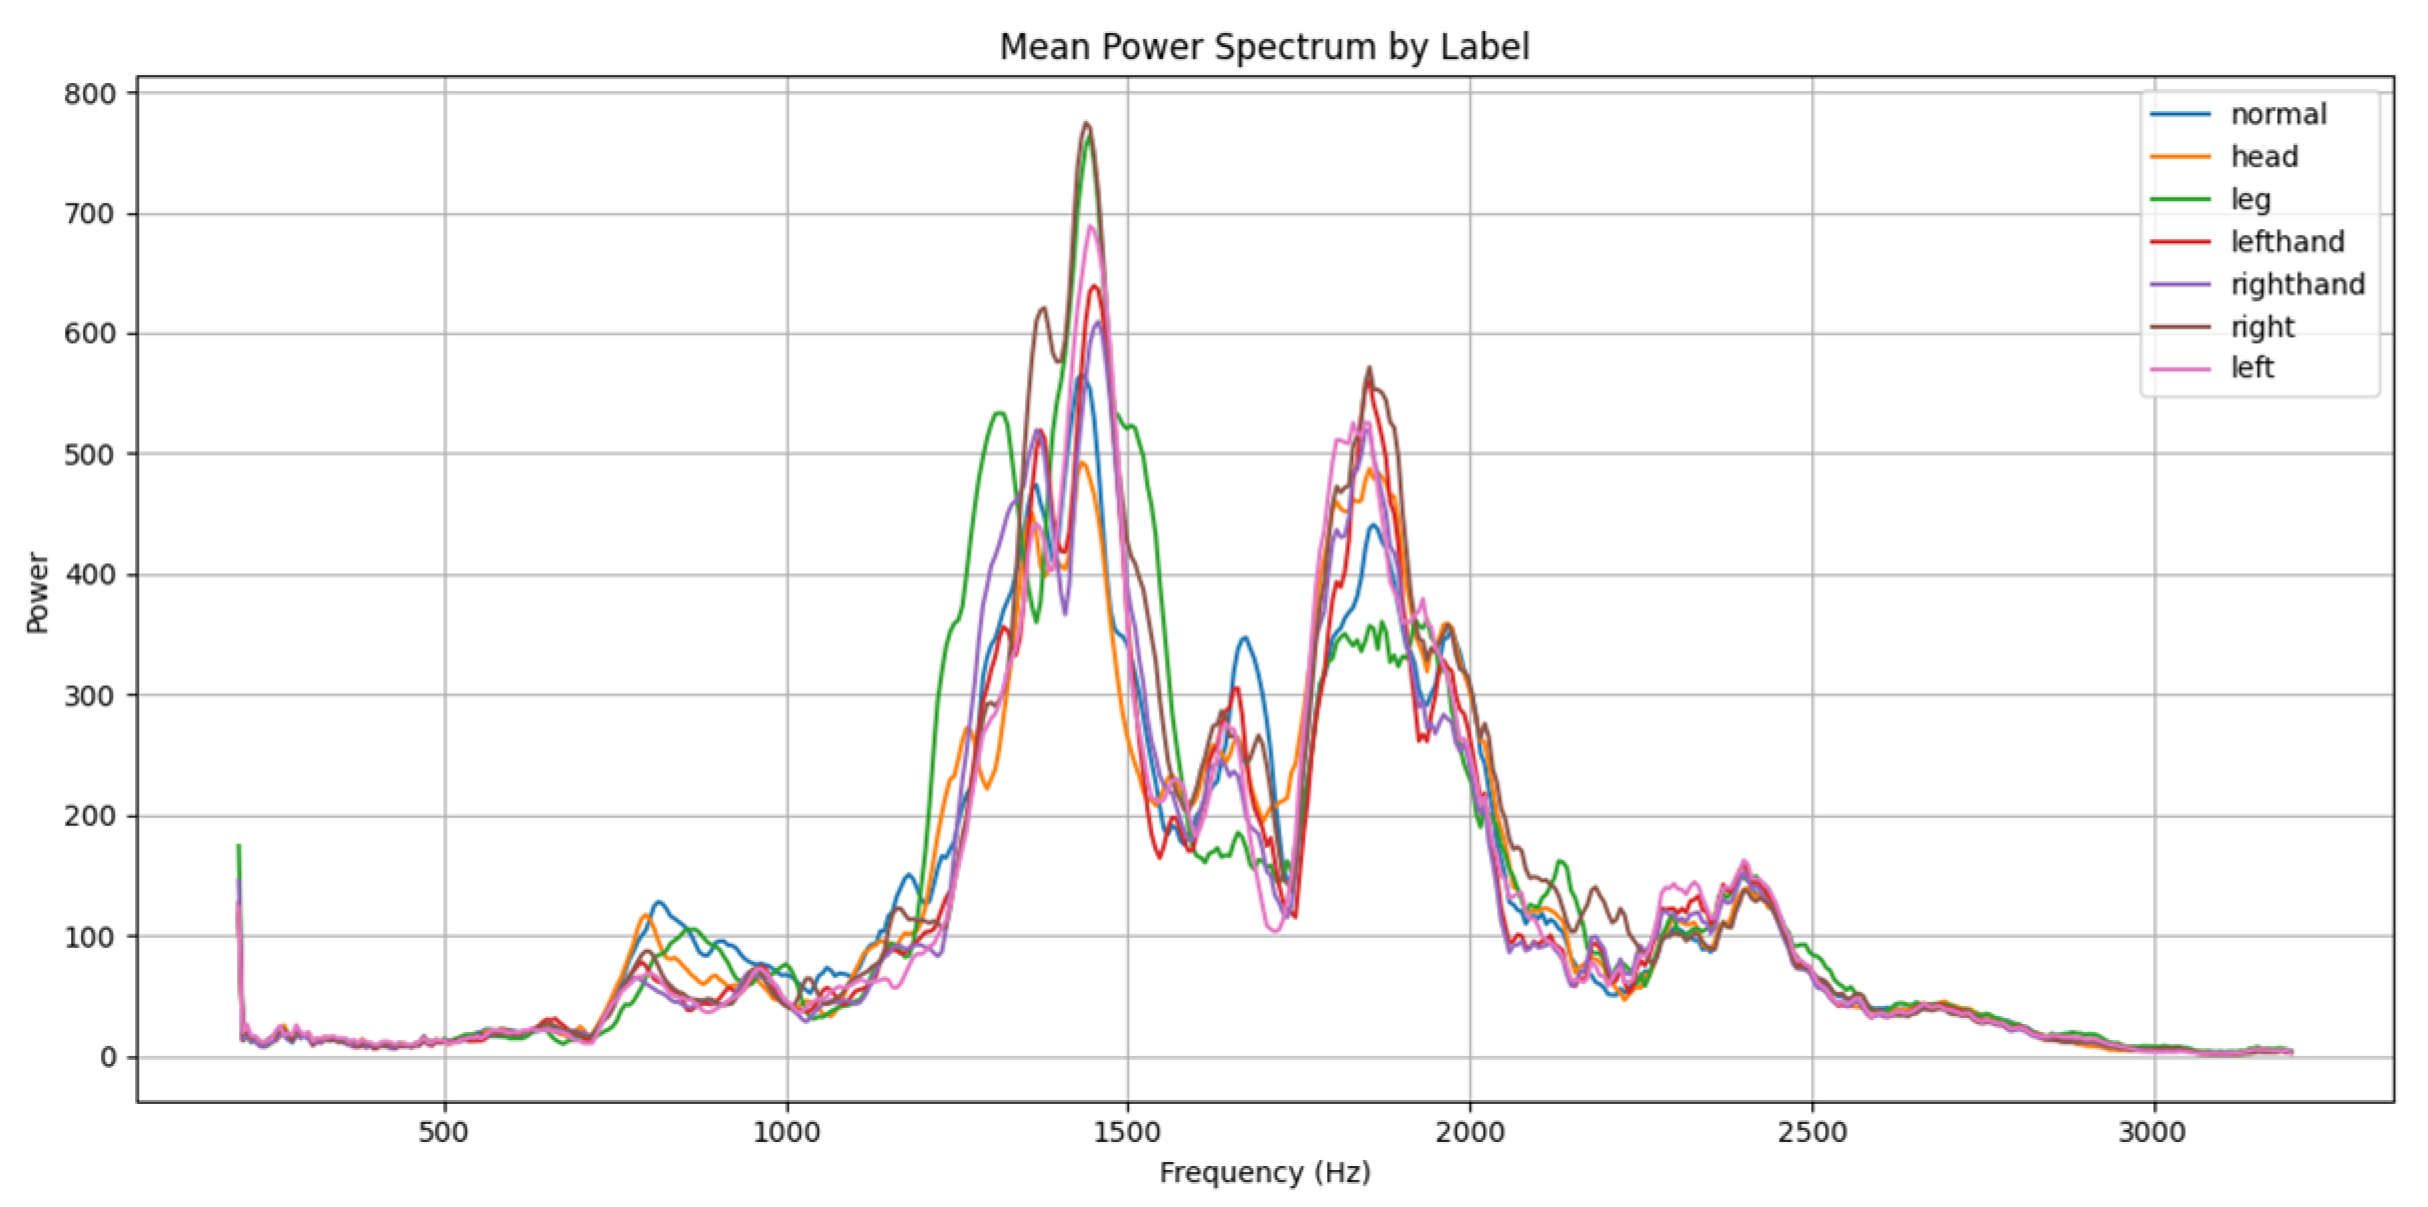
3.1. Acoustic Signal Analysis

The recorded acoustic signals exhibited noticeable spectral variations depending on the robot’s structural state. FFT analysis revealed that the removal of structural components, such as the head, arms, hands, and legs, resulted in shifts in spectral characteristics. These spectral differences indicate that structural modifications affect the robot’s acoustic response in measurable ways. Figure 6 presents the power spectral density corresponding to each structural condition. The power spectra were computed from FFT magnitude values extracted from each recording and averaged for each class. A Hamming window was applied prior to FFT computation, and the resulting magnitude spectra were saved in CSV format. The power values were plotted using Matplotlib (3.9.2) with smoothing via cubic spline interpolation to enhance visual clarity.
While most structural conditions resulted in broadly similar spectral shapes, the spectrum for the “leg removed” condition appeared markedly different from the others. This deviation is especially evident in the mid-frequency band and is thought to be associated not just with the absence of the limb itself but also with the resulting shift in the robot’s overall physical posture. Unlike other component removals, detaching a leg causes the robot to tilt slightly, altering the way acoustic waves reflect and resonate within its body. Although this was not intentionally part of the experimental manipulation, such posture-induced variation likely contributed significantly to the distinctive spectral response observed in that condition.
To ensure the reliability of results under varying joint configurations, all other experimental conditions were kept strictly consistent. The variations in arm position were included in the training data to allow the model to learn their influence and minimize the impact on structural condition classification.
To improve feature clarity and reduce the influence of irrelevant noise, frequency components outside the 200 Hz to 3200 Hz range were filtered out. This filtering process enhanced the robustness of the feature vectors and improved classification consistency across all models. Spectral energy patterns were sufficiently distinct across different structural states to enable reliable feature extraction, forming the basis for machine learning-based classification. While the classification accuracy achieved by each model varied, the overall performance trends suggest that the acoustic features were sufficiently informative to capture structural differences under controlled settings. It is worth noting that the test conditions, though carefully constructed, still represent a simplified version of real-world variability. This emphasizes the importance of gradually extending such experiments to include more realistic sources of variation—such as surface material changes, external vibrations, or minor assembly inconsistencies—to better evaluate model generalizability.

3.2. Classification Performance

Using the extracted frequency-domain features, six classification algorithms—Support Vector Machine (SVM), Random Forest (RF), K-Nearest Neighbors (KNN), XGBoost, LightGBM and Multi-Layer Perceptron (MLP)—were trained and evaluated to assess their effectiveness in identifying structural changes in the robot.
Hyperparameter tuning was conducted on the training dataset using 5-fold cross-validation. For SVM, a linear kernel was selected with moderate regularization. KNN yielded optimal performance with 4 neighbors and a distance-based weighting scheme. The best RF configuration employed 142 trees with a maximum depth of 10. XGBoost and LightGBM both performed best with 100 estimators, a learning rate of 0.1, and a maximum depth of 3, using 80% feature and sample subsampling. For MLP, the best results were obtained with one hidden layer of 100 units, ReLU activation, and an initial learning rate of 0.001. These optimal configurations for each model are summarized in Table 1.
The classification performance of each tuned model was first evaluated on the training set using 5-fold cross-validation. All models achieved perfect performance, suggesting that the acoustic features captured sufficient information for structural classification under controlled conditions.
The same models were then tested on an independent test dataset to assess their generalization performance. The test results are summarized in Table 2. MLP achieved the highest accuracy (71.4%), followed by SVM (65.7%), LightGBM (62.9%), KNN (60%), XGBoost (57.1%), and RF (51.4%).
These findings indicate that while all models performed exceptionally well during training, their performance on unseen data varied. Neural network models such as MLP appear to offer better generalization by capturing complex patterns in the frequency-domain features. In contrast, simpler tree-based and distance-based models were more sensitive to subtle acoustic overlaps or variability across conditions. These results highlight the importance of careful model selection and validation in developing robust models.

4. Discussion

This study demonstrated the feasibility of using active acoustic sensing for non-invasive fault diagnosis in robots. By analyzing frequency-domain features derived from reflected sound signals, the system could reliably distinguish between different structural configurations. This affirms that acoustic responses offer meaningful indicators of internal mechanical states.
However, a key limitation emerged regarding the generalization of model performance. While all classifiers showed perfect accuracy under cross-validation using the training data, their performance dropped significantly when evaluated on an independent test dataset collected under slightly different conditions. Even models like MLP and SVM, which performed best, experienced noticeable declines in accuracy. These discrepancies suggest that environmental noise, slight inconsistencies in joint tension or component attachment, or subtle shifts in joint configuration can lead to instability in spectral features and undermine classification reliability.
This limitation invites reflection on the role and scope of dataset size in acoustic fault diagnosis. While deep learning models are known to benefit from large-scale data, the objective of this study was not to maximize accuracy through extensive data collection, but rather to evaluate the feasibility of low-resource, lightweight diagnostic systems that could be deployed on simple or mass-producible robotic platforms. In such contexts, acquiring thousands of labeled samples for each fault condition would be impractical. The experiment was therefore deliberately designed with a minimal but structured dataset, aiming to determine whether basic acoustic features could still enable meaningful fault classification under constrained data regimes.
Given this experimental framing, strategies for improving generalization focused on model tuning rather than scaling the dataset. Measures such as hyperparameter optimization, feature normalization, and cross-validation across different data segments were adopted to minimize overfitting. Although these methods offered some mitigation, the results indicate that low-data regimes inherently carry trade-offs in model robustness. Therefore, alternative approaches must be considered for real-world deployment.
One promising direction is the integration of moderately complex architectures, such as shallow convolutional neural networks or hybrid models incorporating attention mechanisms, which could extract more invariant patterns even from limited data. Additionally, exploring time–frequency representations like wavelet transforms or phase-based features might yield improved resistance to environmental variation. For settings where small-scale customization is feasible, on-device learning using a small number of self-recorded examples could enable robots to adapt their models locally without centralized retraining.
From a practical perspective, the current setup—relying solely on a speaker and microphone—remains attractive for lightweight deployments. Potential applications include real-time diagnostics in modular robots, swarm systems, or educational kits. Yet to make such systems viable in uncontrolled settings, it is essential to systematically investigate their robustness to environmental shifts and hardware variations.
Overall, this study provides a foundational proof of concept while identifying clear paths forward. Through a combination of modest data expansion, improved feature engineering, and task-specific architecture design, it may be possible to bridge the gap between controlled experimental results and robust performance in real-world conditions. In the future, an integrated diagnostic framework that combines acoustic sensing with complementary modalities such as vibration sensing or thermal imaging could enhance fault localization accuracy. While this study focused solely on acoustic signals, the underlying principles are not exclusive. For instance, accelerometers could provide finer measurements of low-frequency structural oscillations, while acoustic signals excel in capturing higher-frequency resonance and wave interference. Combining such data through sensor fusion techniques may allow for more robust and explainable diagnostic models. These approaches would be particularly beneficial in heterogeneous robot fleets or systems operating in unpredictable environments, where relying on a single sensing modality may prove insufficient.

5. Conclusions

This study explored the use of active acoustic sensing to detect structural faults in robots. By analyzing FFT-based frequency-domain features extracted from recorded acoustic signals, we confirmed that different structural states produce distinctive acoustic patterns, enabling classification via machine learning.
Among the six classifiers tested, the Multi-Layer Perceptron (MLP) and Support Vector Machine (SVM) showed the highest potential, achieving test accuracies of 71.4% and 65.7%, respectively. LightGBM, XGBoost, KNN, and Random Forest also showed moderate performance, though all models exhibited some degradation compared to training results. These outcomes indicate that while the extracted spectral features are informative, they are sensitive to session-dependent variations and may not generalize well without further refinement.
The results confirm that active acoustic sensing is a viable method for robotic fault diagnosis in controlled environments. However, the performance gap between training and testing suggests that practical deployment remains challenging without improved generalization strategies. Future research should focus on building larger and more diverse datasets, refining feature representations, and integrating temporal modeling techniques. Such advancements will be critical in developing scalable, adaptive, and reliable diagnostic systems based on acoustic sensing for real-world robotic platforms.
Additionally, this study demonstrates that meaningful classification can still be achieved under limited-data conditions when the system architecture and features are carefully selected. While deep learning approaches often require extensive datasets, our results suggest that lightweight models trained on minimal but structured data may offer practical advantages, especially for low-cost or modular robotic platforms. Incorporating scalable yet resource-efficient strategies will be essential in translating these findings into field-ready solutions.

Author Contributions

Conceptualization, W.Y. and M.M.; methodology, W.Y.; validation, W.Y.; investigation, W.Y. and M.M.; writing—original draft preparation, W.Y.; writing—review and editing, M.M.; supervision, M.M.; project administration, M.M.; funding acquisition, M.M. All authors have read and agreed to the published version of the manuscript.

Funding

This research was supported by JSPS KAKENHI Grant Number JP24K01129.

Institutional Review Board Statement

Not applicable.

Informed Consent Statement

Not applicable.

Data Availability Statement

The original contributions presented in this study are included in the article. Further inquiries can be directed to the corresponding author.

Conflicts of Interest

The authors declare no conflicts of interest.

Abbreviations

The following abbreviations are used in this manuscript:
AASActive acoustic sensing
AEAcoustic emission
FFTFast Fourier transform
KNNK-nearest neighbor
MLPMulti-layer perceptron
RFRandom forest
SVMSupport vector machine
X s Laplace transform of the input signal
Y s Laplace transform of the output signal
H s Transfer function in the Laplace domain
s Complex frequency variable
σReal part of the s
ωAngular frequency in radians per second
H j ω Frequency response of the system
X(f)Input signal in the frequency domain
Y(f)Output signal in the frequency domain
H f Transfer function in the real frequency domain
x(t)Input signal in the time domain
y(t)Output signal in the time domain
f Frequency in Hertz

References

  1. Chen, L.; Liu, L.; He, M.; Liu, D. Gearbox Fault Diagnosis Based on VMD and Acoustic Emission Technology. In Proceedings of the 2019 IEEE International Instrumentation and Measurement Technology Conference (I2MTC), Auckland, New Zealand, 20–23 May 2019; pp. 1–6. [Google Scholar]
  2. Li, H.; Wu, Z.; Xue, K.; Yang, G. Research on aero-engine bearing fault using acoustic emission technique based on wavelet packet decomposition and support vector machine. In Proceedings of the 2017 IEEE 2nd Advanced Information Technology, Electronic and Automation Control Conference (IAEAC), Chongqing, China, 25–26 March 2017; pp. 1444–1448. [Google Scholar]
  3. Dou, H.; Liu, T.; Yang, X.; Li, Z.; Zhang, J.; Yang, J.; Mao, Y.; Mu, X. Planetary Gear Fault Detection Using PMUT Based Acoustic Emission Sensor. In Proceedings of the 2025 IEEE 38th International Conference on Micro Electro Mechanical Systems (MEMS), Kaohsiung, Taiwan, 19–23 January 2025; pp. 1027–1030. [Google Scholar]
  4. Sause, M. Situ Monitoring of Fiber-Reinforced Composites: Theory, Basic Concepts, Methods, and Applications; Springer Series in Materials Science; Springer: Berlin/Heidelberg, Germany, 2016; Volume 242. [Google Scholar]
  5. Godin, N.; Reynaud, P.; Fantozzi, G. Acoustic Emission and Durability of Composites Materials; ISTE-Wiley: London, UK, 2018; ISBN 9781786300195. [Google Scholar]
  6. Romhany, G.; Czigany, T.; Karger-Kocsis, J. Failure assessment and evaluation of damage development and crack growth in polymer composites via localization and acoustic emission events: A review Polymer Reviews. Polym. Rev. 2017, 57, 397–439. [Google Scholar] [CrossRef]
  7. Morscher, G.N.; Godin, N. Use of Acoustic Emission for Ceramic Matrix Composites; John Wiley&Sons, Inc.: Hoboken, NJ, USA, 2014; pp. 569–590. [Google Scholar]
  8. Lee, X.Y.; Kumar, A.; Vidyaratne, L.; Rao, A.R.; Farahat, A.; Gupta, C. An ensemble of convolution-based methods for fault detection using vibration signals. In Proceedings of the 2023 IEEE International Conference on Prognostics and Health Management (ICPHM), Montreal, QC, Canada, 5–7 June 2023; pp. 172–179. [Google Scholar]
  9. Al-Ghamd, A.M.; Mba, D. A comparative experimental study on the use of acoustic emission and vibration analysis for bearing defect identification and estimation of defect size. Mech. Syst. Signal Process. 2006, 20, 1537–1571. [Google Scholar] [CrossRef]
  10. Eftekharnejad, B.; Carrasco, M.R.; Charnley, B.; Mba, D. The application of spectral kurtosis on Acoustic Emission and vibrations from a defective bearing. Mech. Syst. Signal Process. 2011, 25, 266–284. [Google Scholar] [CrossRef]
  11. Roennau, A.; Heppner, G.; Kerscher, T.; Dillmann, R. Fault diagnosis and system status monitoring for a six-legged walking robot. In Proceedings of the 2011 IEEE/ASME International Conference on Advanced Intelligent Mechatronics (AIM), Budapest, Hungary, 3–7 July 2011; pp. 874–879. [Google Scholar]
  12. Lee, C.J.; Zhang, R.; Agarwal, D.; Yu, T.C.; Gunda, V.; Lopez, O.; Zhang, C. Echowrist: Continuous hand pose tracking and hand-object interaction recognition using low-power active acoustic sensing on a wristband. In Proceedings of the 2024 CHI Conference on Human Factors in Computing Systems, Honolulu, HI, USA, 11–16 May 2024; pp. 1–21. [Google Scholar]
  13. Yu, T.C.; Hu, G.; Zhang, R.; Lim, H.; Mahmud, S.; Lee, C.J.; Li, K.; Agarwal, D.; Nie, S.; Oh, J.; et al. Ring-a-Pose: A Ring for Continuous Hand Pose Tracking. In Proceedings of the ACM on Interactive, Mobile, Wearable and Ubiquitous Technologies; 2024; Volume 8, pp. 1–30. Available online: https://dl.acm.org/journal/imwut/about (accessed on 8 June 2025).
  14. Alemu, M.Y.; Lin, Y.; Shull, P.B. EchoGest: Soft Ultrasonic Waveguides based Sensing Skin for Subject-Independent Hand Gesture Recognition. IEEE Trans. Neural Syst. Rehabil. Eng. 2024, 32, 2366–2375. [Google Scholar] [CrossRef] [PubMed]
  15. Bi, H.; Zhang, W.; Li, S.; Chen, Y.; Zhou, C.; Zhou, T. SmartSit: Sitting posture recognition through acoustic sensing on smartphones. IEEE Trans. Multimed. 2024, 26, 8119–8130. [Google Scholar] [CrossRef]
  16. Kubo, Y.; Koguchi, Y.; Shizuki, B.; Takahashi, S.; Hilliges, O. AudioTouch: Minimally Invasive Sensing of Micro-Gestures via Active Bio-Acoustic Sensing. In Proceedings of the 21st International Conference on Human-Computer Interaction with Mobile Devices and Services (MobileHCI ‘19), Taipei, Taiwan, 1–4 October 2019; Association for Computing Machinery: New York, NY, USA, 2019; Volume 36, pp. 1–13. [Google Scholar]
  17. Kishi, F.; Ito, K.; Fujita, K.; Itoh, Y. Recognizing object localization using acoustic markers with active acoustic sensing. Qual. User Exp. 2024, 9, 2. [Google Scholar] [CrossRef]
  18. Murakami, H.; Nakamura, M.; Yamasaki, S.; Hashizume, H.; Sugimoto, M. Smartphone Localization Using Active-Passive Acoustic Sensing. In Proceedings of the 2018 International Conference on Indoor Positioning and Indoor Navigation (IPIN), Nantes, France, 24–27 September 2018; pp. 206–212. [Google Scholar]
  19. Watanabe, H.; Kakizawa, H.; Sugimoto, M. User Authentication Method Using Active Acoustic Sensing. J. Inf. Process. 2021, 29, 370–379. [Google Scholar] [CrossRef]
  20. Iwakiri, S.; Murao, K. User Authentication Method for Wearable Ring Devices using Active Acoustic Sensing. In Proceedings of the 2023 ACM International Symposium on Wearable Computers (ISWC ‘23), Cancun, Mexico, 8–12 October 2023. [Google Scholar]
  21. Tanigawa, R.; Ishii, Y. Hear-your-action: Human action recognition by ultrasound active sensing. In Proceedings of the ICASSP 2024—2024 IEEE International Conference on Acoustics, Speech and Signal Processing (ICASSP), Seoul, Republic of Korea, 14–19 April 2024; pp. 7260–7264. [Google Scholar]
  22. Noble, W.S. What is a support vector machine? Nat. Biotechnol. 2006, 24, 1565–1567. [Google Scholar] [CrossRef]
  23. Guido, R.; Ferrisi, S.; Lofaro, D.; Conforti, D. An overview on the advancements of support vector machine models in healthcare applications: A review. Information 2024, 15, 235. [Google Scholar] [CrossRef]
  24. Khan, T.A.; Sadiq, R.; Shahid, Z.; Alam, M.M.; Su’ud, M.B.M. Sentiment analysis using support vector machine and random forest. J. Inform. Web Eng. 2024, 3, 67–75. [Google Scholar] [CrossRef]
  25. Alfred, R.; Chinthamu, N.; Jayanthy, T.; Muniyandy, E.; Dhiman, T.K.; John, T.N. Implementation of advanced techniques in production and manufacturing sectors through support vector machine algorithm with embedded system. Meas. Sens. 2024, 33, 101119. [Google Scholar] [CrossRef]
  26. Breiman, L. Random forests. Mach. Learn. 2001, 45, 5–32. [Google Scholar] [CrossRef]
  27. Latifah, A.L.; Shabrina, A.; Wahyuni, I.N.; Sadikin, R. Evaluation of Random Forest model for forest fire prediction based on climatology over Borneo. In Proceedings of the 2019 International Conference on Computer, Control, Informatics and its Applications, Tangerang, Indonesia, 23–24 October 2019; pp. 4–8. [Google Scholar]
  28. Iranzad, R.; Liu, X. A review of random forest-based feature selection methods for data science education and applications. Int. J. Data Sci. Anal. 2024, 1–15. [Google Scholar] [CrossRef]
  29. Xu, W.; Tu, J.; Xu, N.; Liu, Z. Predicting daily heating energy consumption in residential buildings through integration of random forest model and meta-heuristic algorithms. Energy 2024, 301, 131726. [Google Scholar] [CrossRef]
  30. Shih, C.M.; Yang, K.C.; Chao, W.P. Predicting Stock Price Using Random Forest Algorithm and Support Vector Machines Algorithm. In Proceedings of the2023 IEEE International Conference on Industrial Engineering and Engineering Management, Singapore, 18–21 December 2023; pp. 0133–0137. [Google Scholar]
  31. A, U.N.; Dharmarajan, K. Diabetes Prediction using Random Forest Classifier with Different Wrapper Methods. In Proceedings of the 2022 International Conference on Edge Computing and Applications, Tamilnadu, India, 13–15 October 2022; pp. 1705–1710. [Google Scholar]
  32. Yunneng, Q. A new stock price prediction model based on improved KNN. In Proceedings of the 2020 7th International Conference on Information Science and Control Engineering, Changsha, China, 18–20 December 2020; pp. 77–80. [Google Scholar]
  33. Vaishnnave, M.P.; Devi, K.S.; Srinivasan, P.; Jothi, G.A.P. Detection and Classification of Groundnut Leaf Diseases using KNN classifier. In Proceedings of the 2019 IEEE International Conference on Systems, Computing, Automation and Networks, Pondicherry, India, 29–30 March 2019; pp. 1–5. [Google Scholar]
  34. Halder, R.K.; Uddin, M.N.; Uddin, M.A.; Aryal, S.; Khraisat, A. Enhancing K-nearest neighbor algorithm: A comprehensive review and performance analysis of modifications. J. Big Data 2024, 11, 113. [Google Scholar] [CrossRef]
  35. Tajmouati, S.; Wahbi, B.E.; Bedoui, A.; Abarda, A.; Dakkon, M. Applying k-nearest neighbors to time series forecasting: Two new approaches. J. Forecast. 2024, 43, 1559–1574. [Google Scholar] [CrossRef]
  36. Xu, X.; Jia, W.; Xu, S.; Ning, F.; Lei, J. Relationship between high-level color features and temperature mapping of magnesium alloy surface images based on the K-nearest neighbor algorithm. Appl. Therm. Eng. 2025, 259, 124940. [Google Scholar] [CrossRef]
  37. Suprayoga, R.; Zega, S.; Muhathir; Mardiana, S. Classification of Mango Leaf Diseases Using XGBoost Method and HoG Feature Extraction. In Proceedings of the 2023 International Conference on Modeling & E-Information Research, Artificial Learning and Digital Applications (ICMERALDA), Karawang, Indonesia, 24 November 2023; pp. 197–202. [Google Scholar]
  38. Badola, S.; Mishra, V.N.; Parkash, S. Landslide susceptibility mapping using XGBoost machine learning method. In Proceedings of the 2023 International Conference on Machine Intelligence for GeoAnalytics and Remote Sensing (MIGARS), Hyderabad, India, 27–29 January 2023; pp. 1–4. [Google Scholar]
  39. Nageswari, A.; Jyothi, U.; Divya, G.; Ammannamma, T.; Usha, V. Water Quality Classification using XGBoost method. In Proceedings of the 2024 IEEE 6th International Conference on Cybernetics, Cognition and Machine Learning Applications (ICCCMLA), Hamburg, Germany, 19–20 October 2024; pp. 302–306. [Google Scholar]
  40. Dharani Nivash, A.; Ammal Dhanalakshmi, M. Identification of Cyber Bullying Using XGBoost Compared to Random Forest Classifier to Improve Accuracy. In Proceedings of the 2025 International Conference on Artificial Intelligence and Data Engineering (AIDE), Nitte, India, 6–7 February 2025; pp. 856–859. [Google Scholar]
  41. Onoja, M.; Jegede, A.; Mazadu, J.; Aimufua, G.; Oyedele, A.; Olibodum, K. Exploring the Effectiveness and Efficiency of LightGBM Algorithm for Windows Malware Detection. In Proceedings of the 2022 5th Information Technology for Education and Development (ITED), Abuja, Nigeria, 1–3 November 2022; pp. 1–6. [Google Scholar]
  42. Wang, Y.; Zhang, Z.; Wang, Z.; Xian, Y. An Ant Colony Optimization-Enhanced LightGBM Algorithm. In Proceedings of the 2024 IEEE/IAS Industrial and Commercial Power System Asia (I&CPS Asia), Pattaya, Thailand, 9–12 July 2024; pp. 605–609. [Google Scholar]
  43. Kumar, G.V.D.; Deepa, V.; Vineela, N.; Emmanuel, G. Detection of Parkinson’s disease using LightGBM Classifier. In Proceedings of the 2022 6th International Conference on Computing Methodologies and Communication (ICCMC), Erode, India, 29–31 March 2022; pp. 1292–1297. [Google Scholar]
  44. Weng, D.; Chen, R.; Li, Y.; Zhao, D. Techniques and applications of electrical equipment image processing based on improved MLP network using BP algorithm. In Proceedings of the 2016 IEEE 8th International Power Electronics and Motion Control Conference (IPEMC-ECCE Asia), Hefei, China, 22–26 May 2016; pp. 1102–1105. [Google Scholar]
  45. Sameera, N.; Ram, B.A.; Prasad, P.S.S.; Lakshmanarao, A. Plant Disease Detection using MLP, Convnets and Densenet models. In Proceedings of the 2024 Fourth International Conference on Advances in Electrical, Computing, Communication and Sustainable Technologies (ICAECT), Bhilai, India, 11–12 January 2024; pp. 1–5. [Google Scholar]
  46. Amit, M.L.; Fajardo, A.C.; Medina, R.P. Recognition of Real-Time Hand Gestures using Mediapipe Holistic Model and LSTM with MLP Architecture. In Proceedings of the 2022 IEEE 10th Conference on Systems, Process & Control (ICSPC), Malacca, Malaysia, 17 December 2022; pp. 292–295. [Google Scholar]
  47. Xu, C. Applying MLP and CNN on Handwriting Images for Image Classification Task. In Proceedings of the 2022 5th International Conference on Advanced Electronic Materials, Computers a Engineering (AEMCSE), Wuhan, China, 22–24 April 2022; pp. 830–835. [Google Scholar]
  48. Honggang, C.; Mingyue, X.; Chenzhao, F.; Renjie, S.; Zhe, L. Mechanical Fault Diagnosis of GIS Based on MFCCs of Sound Signals. In Proceedings of the 2020 5th Asia Conference on Power and Electrical Engineering (ACPEE), Chengdu, China, 4–7 June 2020; pp. 1487–1491. [Google Scholar]
Figure 1. Operating mechanism of the system [48].
Applsci 15 06564 g001
Figure 2. Schematic diagram of the recording process.
Applsci 15 06564 g002
Figure 3. Image of the actual recording procedure.
Applsci 15 06564 g003
Figure 4. Image of the robot under different arm positions. (a) Step 1; (b) Step 2; (c) Step 3; (d) Step 4; (e) Step 5; (f) Step 6; (g) Step 7; (h) Step 8; (i) Step 9.
Applsci 15 06564 g004aApplsci 15 06564 g004b
Figure 5. Visual illustration of the robot under various structural conditions. (a) Fully assembled robot (baseline condition); (b) fully assembled robot from side (c) robot with head removed; (d) robot with right arm removed; (e) robot with left arm removed; (f) robot with right hand removed; (g) robot with left hand removed; (h) robot with leg removed.
Applsci 15 06564 g005aApplsci 15 06564 g005b
Figure 6. Power spectra corresponding to different structural conditions of the robot.
Applsci 15 06564 g006
Table 1. Best parameters for SVM, RF, KNN, XGBoost, LightGBM and MLP.
ModelHyper Parameters
SVMc = 0.3, kernel = linear
Random Forestn estimators = 142, max depth = 10
KNNn neighbors = 4, weights = distance
XGBoostboosting rounds = 100, learning rate = 0.1
LightGBMboosting rounds = 100, learning rate = 0.1
MLPsingle hidden layer, Relu activation
Table 2. Accuracy of fault detection of six classifiers.
ModelAccuracy
SVM65.7
Random Forest51.4
KNN60.0
XGBoost57.1
LightGBM62.9
MLP71.4
Disclaimer/Publisher’s Note: The statements, opinions and data contained in all publications are solely those of the individual author(s) and contributor(s) and not of MDPI and/or the editor(s). MDPI and/or the editor(s) disclaim responsibility for any injury to people or property resulting from any ideas, methods, instructions or products referred to in the content.

