Article

Numerical Investigation of Factors Influencing Multiple Hydraulic Fracture Propagation from Directional Long Boreholes in Coal Seam Roofs

1
Geotechnical Survey Company, CHN Energy Shendong Coal Group, Shenmu 719300, China
2
CHN Energy Shendong Technology Institute, Shenmu 719300, China
3
State Key Laboratory of Coal Mine Disaster Dynamics and Control, School of Resources and Safety Engineering, Chongqing University, Chongqing 400044, China
*
Author to whom correspondence should be addressed.
Appl. Sci. 2025, 15(12), 6521; https://doi.org/10.3390/app15126521
Submission received: 8 May 2025 / Revised: 4 June 2025 / Accepted: 6 June 2025 / Published: 10 June 2025

Abstract

The hanging of hard roofs in coal seams poses a significant threat to the safe mining of coal. Hydraulic fracturing is an important method to achieve the pre-weakening of coal seam roofs. Clarifying the scope of hydraulic fracturing in coal seam roofs and its influencing factors is a prerequisite for ensuring the effectiveness of the pre-weakening process. In this paper, we developed a fluid–structure coupling numerical simulation model for hydraulic fracturing based on the element damage theory, and have systematically examined the effects of both engineering parameters and geological factors on the hydraulic fracture propagation behavior of the segmented fracturing of coal seam roofs. Results indicate that increasing the injection rate can significantly enhance fracture propagation length. A larger stress difference directs fractures along the maximum principal stress direction and effectively extends their length. Additionally, increasing the spacing between fracture stages reduces stress interference between clusters, leading to a transition from asymmetric to uniform fracture propagation. To validate the numerical simulation results, we conducted a field test on the hydraulic fracturing of the coal seam roof, and monitored the affected area by using transient electromagnetic and microseismic monitoring techniques. Monitoring results indicated that the effective impact range of field hydraulic fracturing was consistent with the numerical simulation results. Through the systematic monitoring of support resistance and coal body stress, the supporting resistance in the fractured zone decreased by 25.10%, and the coal seam stress in the fractured zone exhibited a 1 MPa reduction. Observations demonstrate the significant effectiveness of hydraulic fracturing in regional control of the coal seam roof. This study combines numerical simulation with engineering practice to investigate hydraulic fracturing performance under varying operational conditions, with the findings providing robust technical support for safe and efficient mining production.

1. Introduction

As shallow coal resources are gradually depleted, mining operations are increasingly extending into deeper strata [1], and the increase in in situ stress in deep strata complicates the management of mining disasters, especially accidents caused by the large-scale collapse of thick-hard roofs in the goaf area, which pose severe challenges to the safe production of coal mines [2,3]. Hard roofs can lead to large-scale hanging roofs in working faces, posing the risk of rock bursts and seriously threatening the safe production of coal mines [4,5,6]. Currently, the management of hard roofs can be divided into passive protection and active pressure relief methods, including conventional techniques such as hydraulic fracturing, deep-hole blasting, and pressure relief drilling [7,8,9]. Passive protection methods, such as coal pillar support and backfill mining, are less commonly used in coal mines due to the low mining efficiency and high input costs [10]. The deep-hole blasting method is a traditional approach for controlling hard roof strata. However, it has several drawbacks that make it unsuitable for safe and efficient coal mine production [11]. The method requires large amounts of explosives, which not only pose significant safety risks but also contribute to underground air pollution. Moreover, in high-gas mines or coal seams, blasting increases the risk of gas or coal dust explosions, posing a severe safety hazard.
As a technique for enhancing oil and gas permeability, hydraulic fracturing has been increasingly applied in the coal industry, especially in weakening hard roofs and relieving stress in high-stress roadways [12,13,14]. This technology can reduce the strength and integrity of hard roofs and promote the layered collapse of hard roofs, thereby reducing the periodic weighting interval and mitigating the negative impacts of large-scale roof collapse on mining operations [15]. Therefore, it is widely used in the management of hard roofs and has achieved good results [16,17,18]. However, conventional hydraulic fracturing typically uses short boreholes [19,20], which have limited effectiveness in managing strong mining pressure induced by high-position hard roofs. It cannot address the problem at the source in high-position strata, and can only indirectly mitigate the negative effects of high-position strata by controlling low-position strata, making it difficult to ensure prevention and control effects. Thus, there is an urgent need to develop a preemptive and regional pressure relief method for high-position thick hard roofs [21,22].
Determining the influence range of segmented hydraulic fracturing is a critical aspect of evaluating roof weakening effectiveness. Various numerical simulation methods have been used to study the extent of segmented fracturing and its influencing factors, providing guidance for optimizing hydraulic fracturing design and reducing associated risks. The main numerical calculation methods for hydraulic fracturing include the finite element method (FEM), extended finite element method (XFEM), and boundary element method (BEM). Boone and Ingraffea [23] used FEM to simulate the fracture propagation process in porous elastic materials. Hunsweck et al. [24] simulated hydraulic fracture propagation in impermeable elastic media considering fluid lag using traditional FEM. Bao et al. [25,26] combined stiffness condensation technology with FEM to propose a fully coupled method for simulating hydraulic fracturing. Shi et al. [27] used FEM to investigate the interaction between hydraulic fractures and natural fractures. Belytschko and Black [28] first proposed the extended finite element method, solving the problem of remeshing during numerical simulation. Gordeliy and Peirce [29] proposed a new coupled XFEM algorithm and a new implicit level set algorithm to handle the singularity at the crack tip of hydraulic fractures. Wang [30], Feng et al. [31], and Shi et al. [32] used XFEM to simulate non-planar hydraulic fracture propagation. Crouch [33] proposed the boundary element method to solve the problem of discontinuous displacement fields between fracture walls. Dontsov et al. [34,35,36] proposed an improved pseudo-3D model based on the boundary element method to simulate hydraulic fracture propagation. These methods are extensively used in numerical simulations of hydraulic fracturing. However, XFEM involves complex fracture propagation criteria, and BEM struggles with matrix processing [37]. Due to its wide applicability, FEM is the preferred approach for analyzing hydraulic fracture propagation, particularly for calculating fracture width using mesh surfaces.
Hence, this study aims to develop a fluid–structure coupling hydraulic fracturing numerical simulation model based on element damage theory for investigating the effects of engineering and geological parameters. The inter-fracture interaction mechanisms on the hydraulic fracture propagation of segmented fracturing, and directional long-hole segmented hydraulic fracturing technology, were tested in the target stratum of a coal mine in the Shendong mining area of China. Compared with conventional hydraulic fracturing, the borehole trajectory can precisely reach the target stratum and be arranged in advance of the working face, achieving pre-emptive and regional weakening of the hard roof. Finally, the monitoring results of transient electromagnetic responses, and microseismic and mine pressure variations, were analyzed to assess the roof-weakening effect.

2. Methodology

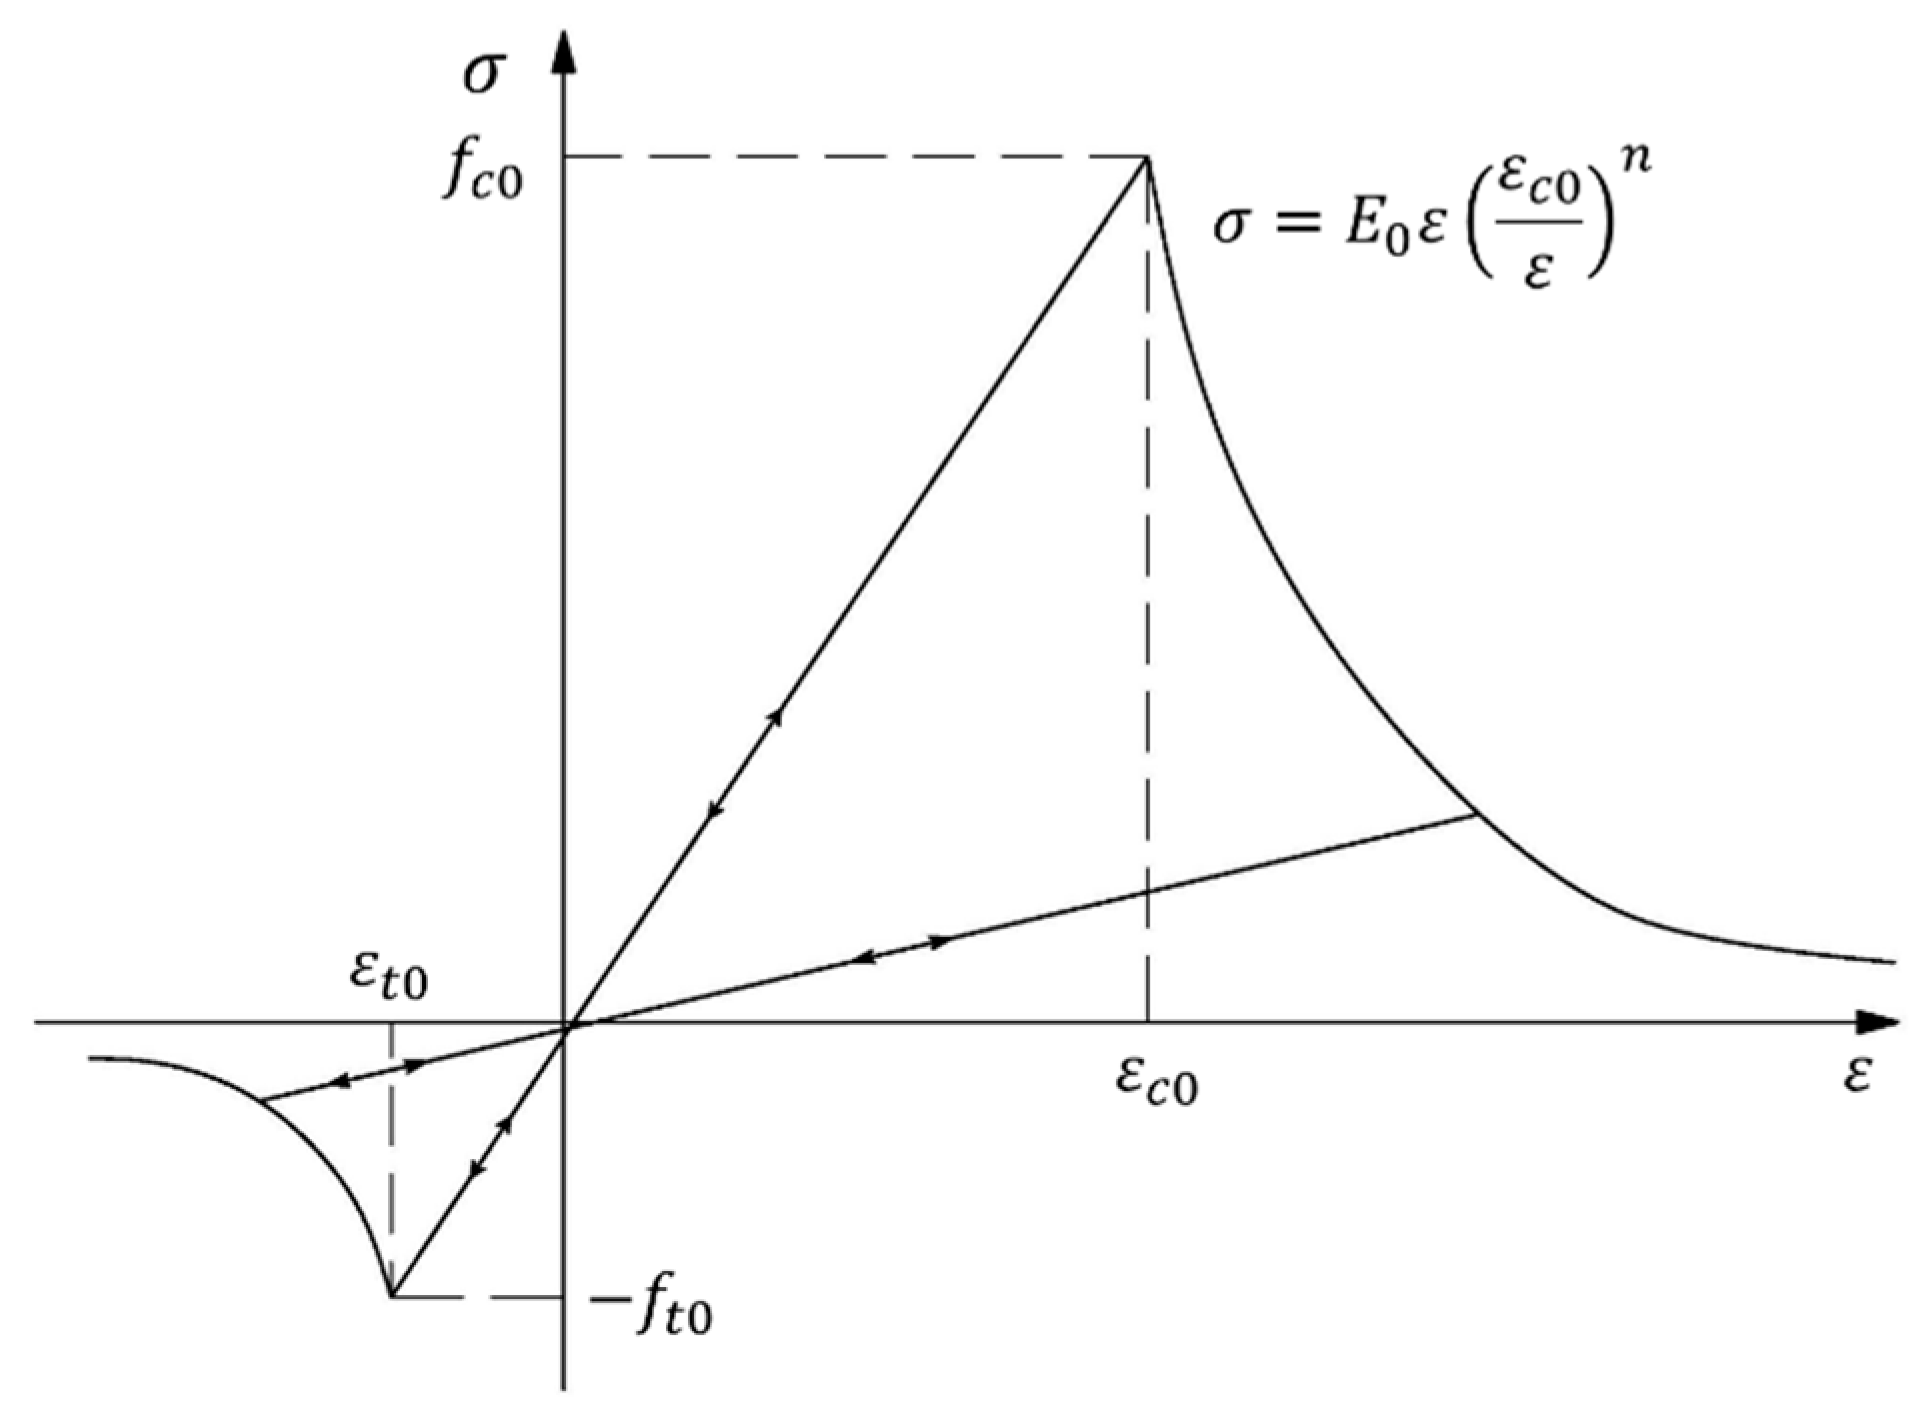
2.1. Governing Equation of Rock Deformation and Damage

The elastic damage constitutive relationship is used to describe the fracture propagation behavior during hydraulic fracturing. As shown in Figure 1, compressive stress (strain) is taken as positive. In the initial stage of loading, the porous medium is elastic. According to generalized Hooke’s law, the porous medium satisfies the constitutive equation expressed by displacement and pore fluid pressure:
G u i , j j + G 1 2 v u j , i i + α p + F i = 0
where G is the shear modulus of the medium, G = E/2 (1 + v); v is the drained Poisson’s ratio of the medium; Fi and ui (i = x, y, z) are the components of body force and displacement in the i direction, respectively; α is Biot’s coefficient.
When the stress state of a porous medium satisfies the maximum tensile stress criterion or the Mohr–Coulomb criterion, it undergoes tensile or shear damage, respectively, leading to the formation of fractures in the formation [38].
F 1 = σ 3 f t 0 = 0 F 2 = σ 1 σ 3 1 + s i n f 1 s i n f f c 0 = 0
where ft0 and fc0 are the uniaxial tensile and compressive strengths of the unit, respectively; Functions F1 and F2 represent the stress state of the medium. A value of zero indicates the onset of tensile and shear damage, respectively. It should be noted that tensile damage is assessed first under all loading conditions. The damage variable D for the element is defined as follows:
0 F 1 < 0 , F 2 < 0 1 ε t 0 ε 3 n F 1 = 0 , d F 1 > 0 1 ε c 0 ε 1 n F 2 = 0 , d F 2 > 0
where εt0 and εc0 represent the maximum principal tensile strain and maximum principal compressive strain when tensile and shear damage occur, respectively; n is a coefficient for the evolution of unit damage, taken as n = 2; dF1 > 0 and dF2 > 0 are the continued loading states after the two types of damage, which can cause an increase in the damage variable. When dF1 > 0 or dF2 > 0, the material is considered to be unloading, and no additional damage occurs. In this case, the damage variable retains the value from the previous loading step.

2.2. Seepage Equation

According to the assumptions of porous media theory, the porous medium consists of a solid matrix containing pores, which are fully saturated with freely flowing pore fluid. Based on the mass conservation equation for fluids and Darcy’s law, the following relationship can be derived:
( c ρ w ρ w φ + ρ w ( α φ ) K s ( 1 + S ) ) p t ( ρ w k μ w i p ) = ρ w ( φ α ) 1 + s ε v t
where c ρ w = 1 ρ w ρ w p is the compressibility of the fluid; Ks is the bulk modulus of solid particles; S = εv + p/Ks is the saturation of the fluid; ρw is the density of the fracturing fluid; εv is the volumetric strain; μw is the viscosity of the fracturing fluid.

2.3. Influence of Damage on Physical Field Parameters

According to elastic damage theory, the elastic modulus of the unit is given by:
E = ( 1 D ) E 0
where E0 and E are the elastic moduli before and after damage, respectively. It is assumed that damage and its evolution are isotropic, so E0, E, and D are scalars. The porosity of the rock layer is related to its stress state and can be expressed as:
ϕ = ( ϕ 0 ϕ r ) exp ( α ϕ σ V ¯ ) + ϕ r
where Φ0 is the initial porosity; αΦ is the stress sensitivity coefficient of porosity; Φr is the limit value of porosity under high compressive stress; σ V ¯ is the average effective stress, which can be calculated as:
σ V ¯ = ( σ 1 + σ 2 + σ 3 ) / 3 α p
where α is Biot’s coefficient, and σ1, σ2, and σ3 are the three principal stresses. Additionally, the permeability after damage can be considered to satisfy the following power function relationship with porosity:
k = k 0 ( f / f 0 ) 3 e x p ( α k D )
where k0 is the initial permeability (m2); k is the permeability after damage (m2); αk is the influence coefficient of damage on permeability, αk = 5.

3. Numerical Modelling and Validation

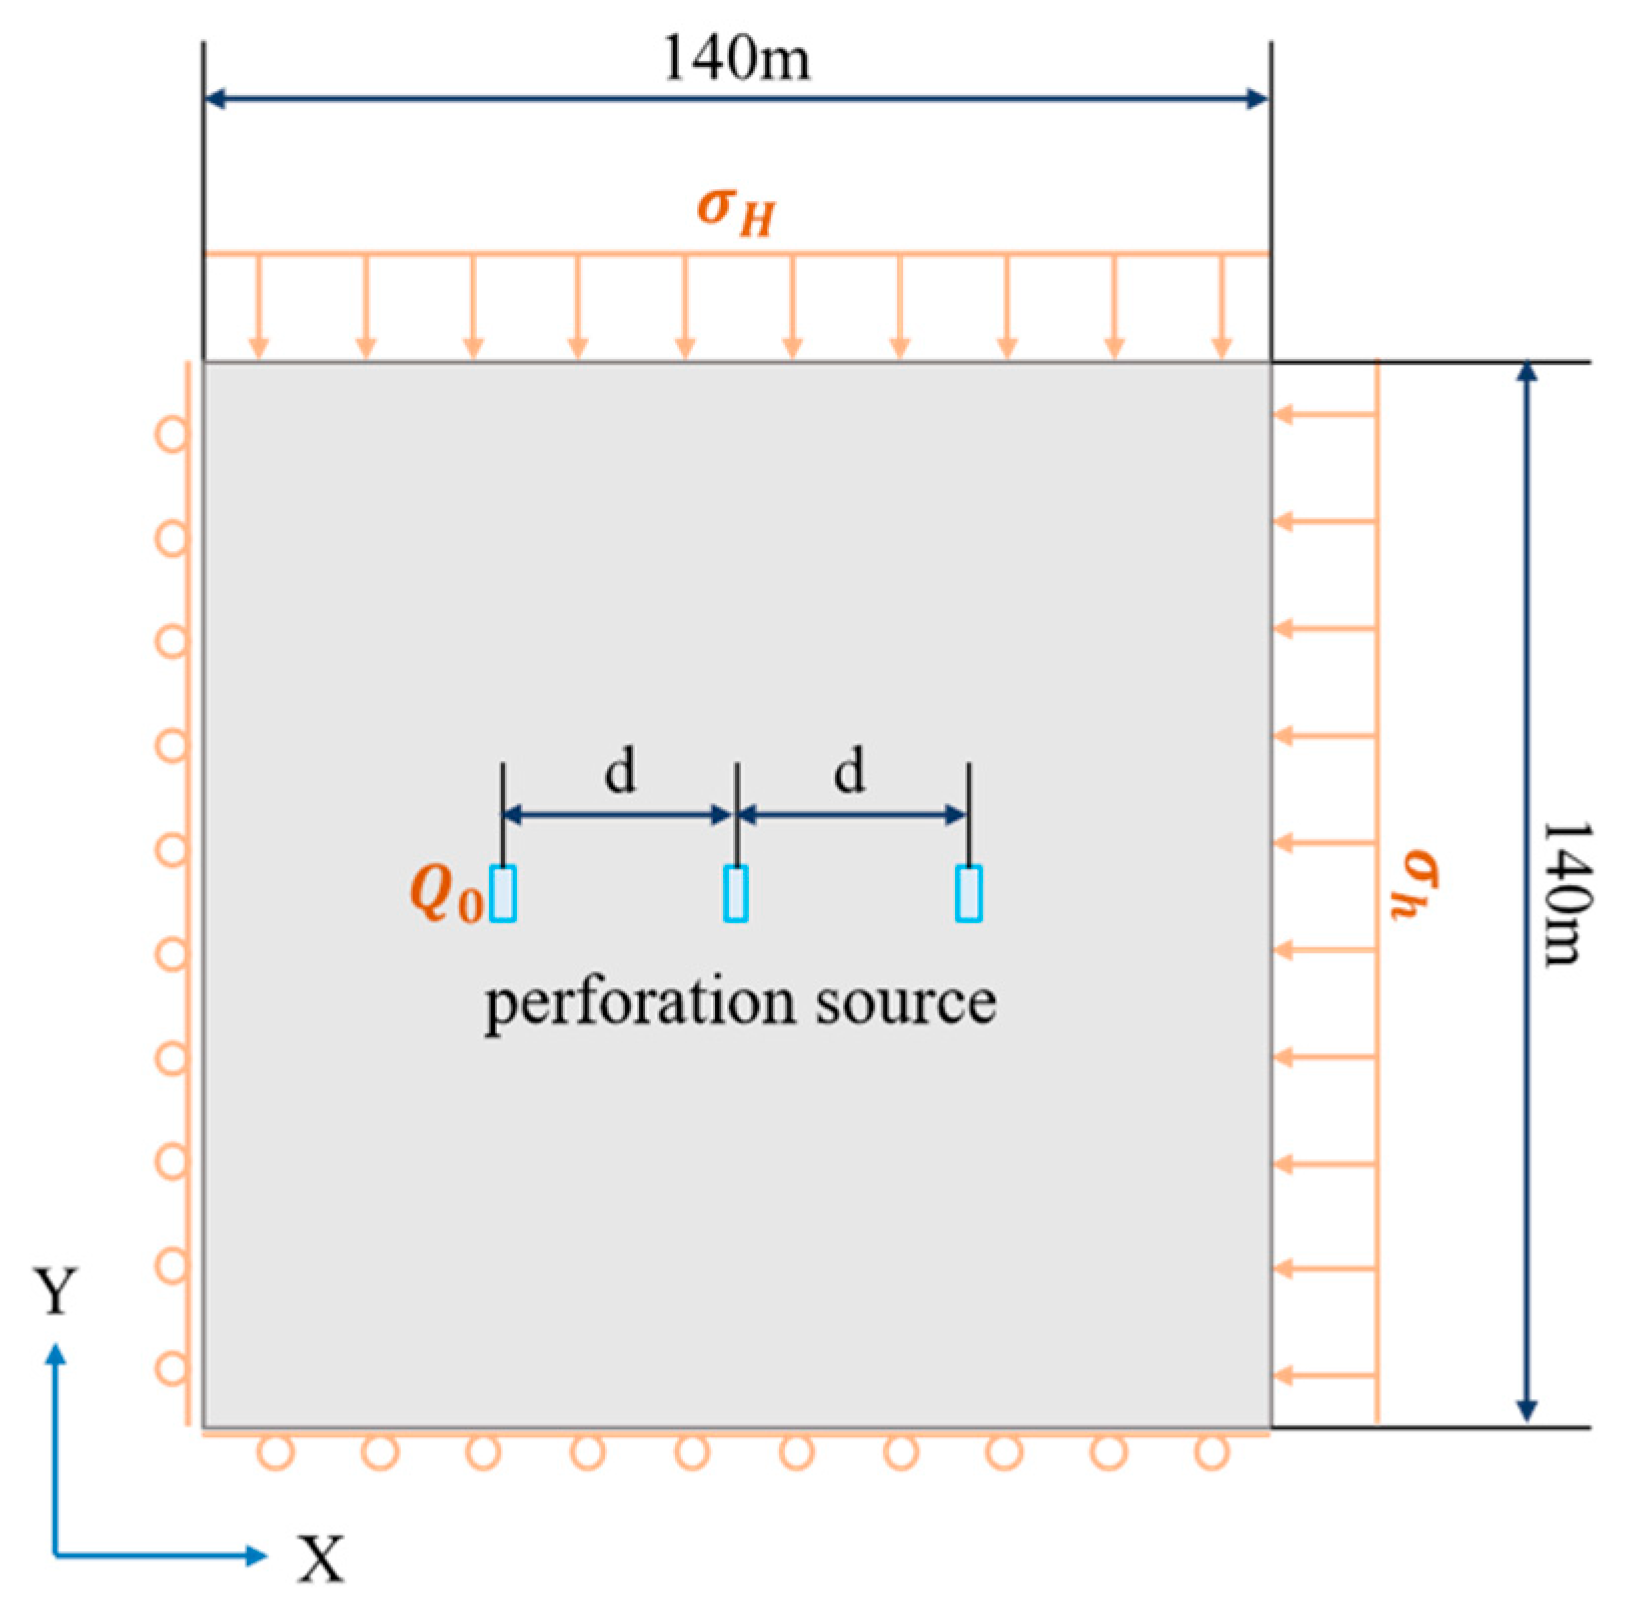
3.1. Numerical Model Establishment

This study uses COMSOL Multiphysics 6.2 to develop a multi-fracture propagation model with heterogeneous characteristics to simulate the fracture propagation process. Specifically, the model is used to investigate the effects of pumping rate, compressive strength, in situ stress difference, and segment length on multi-fracture propagation. Furthermore, it investigates the influence of stress shadowing on fracture propagation, providing a theoretical foundation for field hydraulic fracturing operations.
The multi-cluster fracture propagation model adopts a sequential fracturing method. The 2D geometric model is shown in Figure 2. The model includes 41,430 domain elements and 502 boundary elements. Mesh sensitivity analysis showed a small variation in fracture length when reducing element count from 41k to 13k. The model assumes plane strain deformation, with the material being linear elastic, homogeneous, and isotropic. The fluid is modeled as a Newtonian laminar flow obeying the cubic law, while gravitational effects are neglected. In the model, the formation properties follow a Weibull distribution. Three fracture clusters are initialized with the same length a, and the spacing between clusters is set to d. The model dimensions are defined by length L and height H. The heterogeneity coefficient m was set to 10. The model parameters are listed in Table 1.

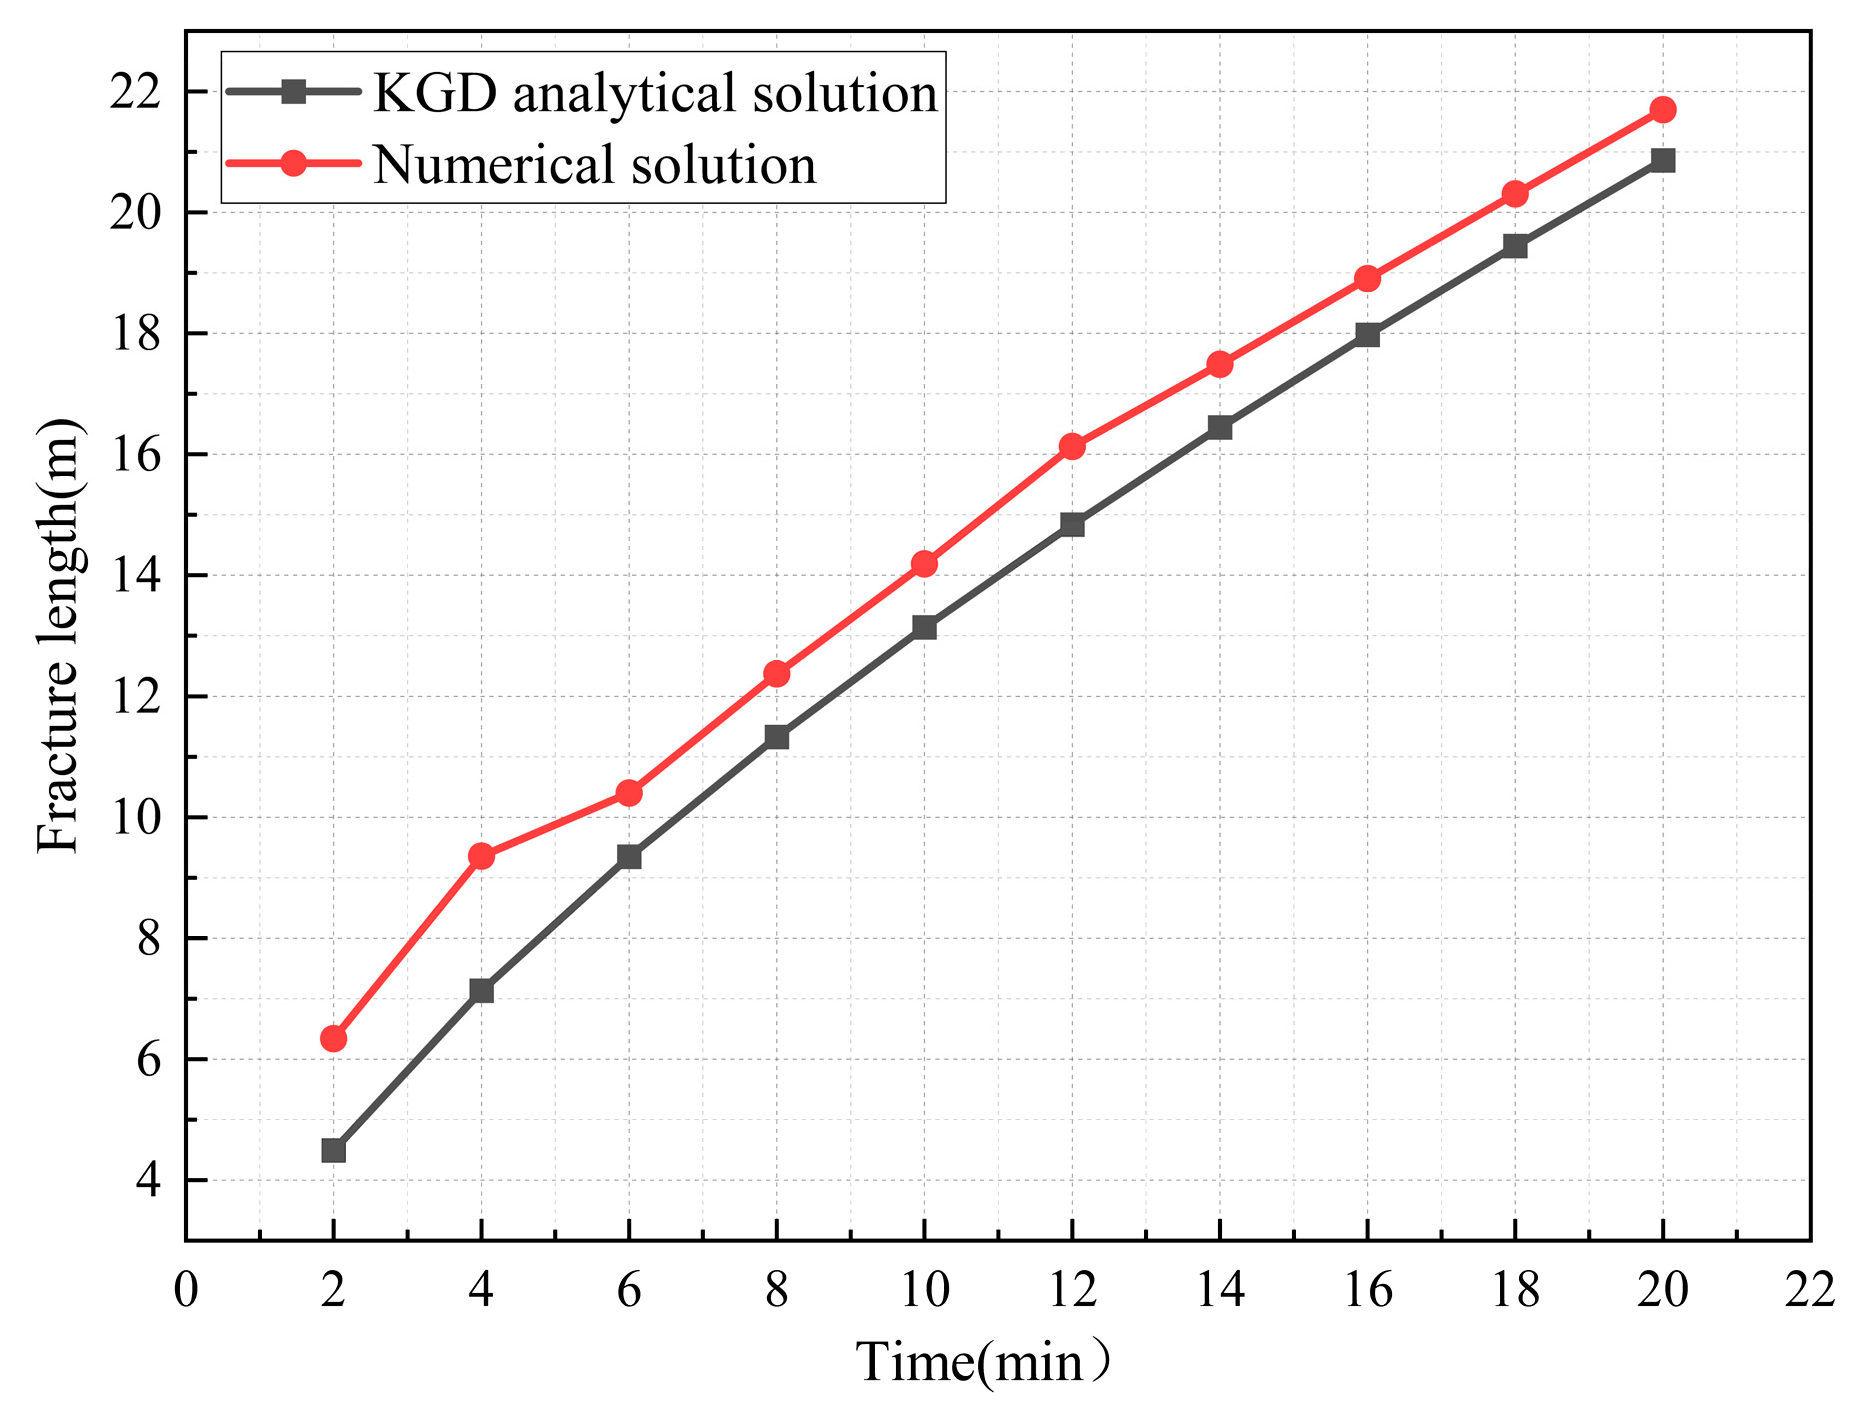
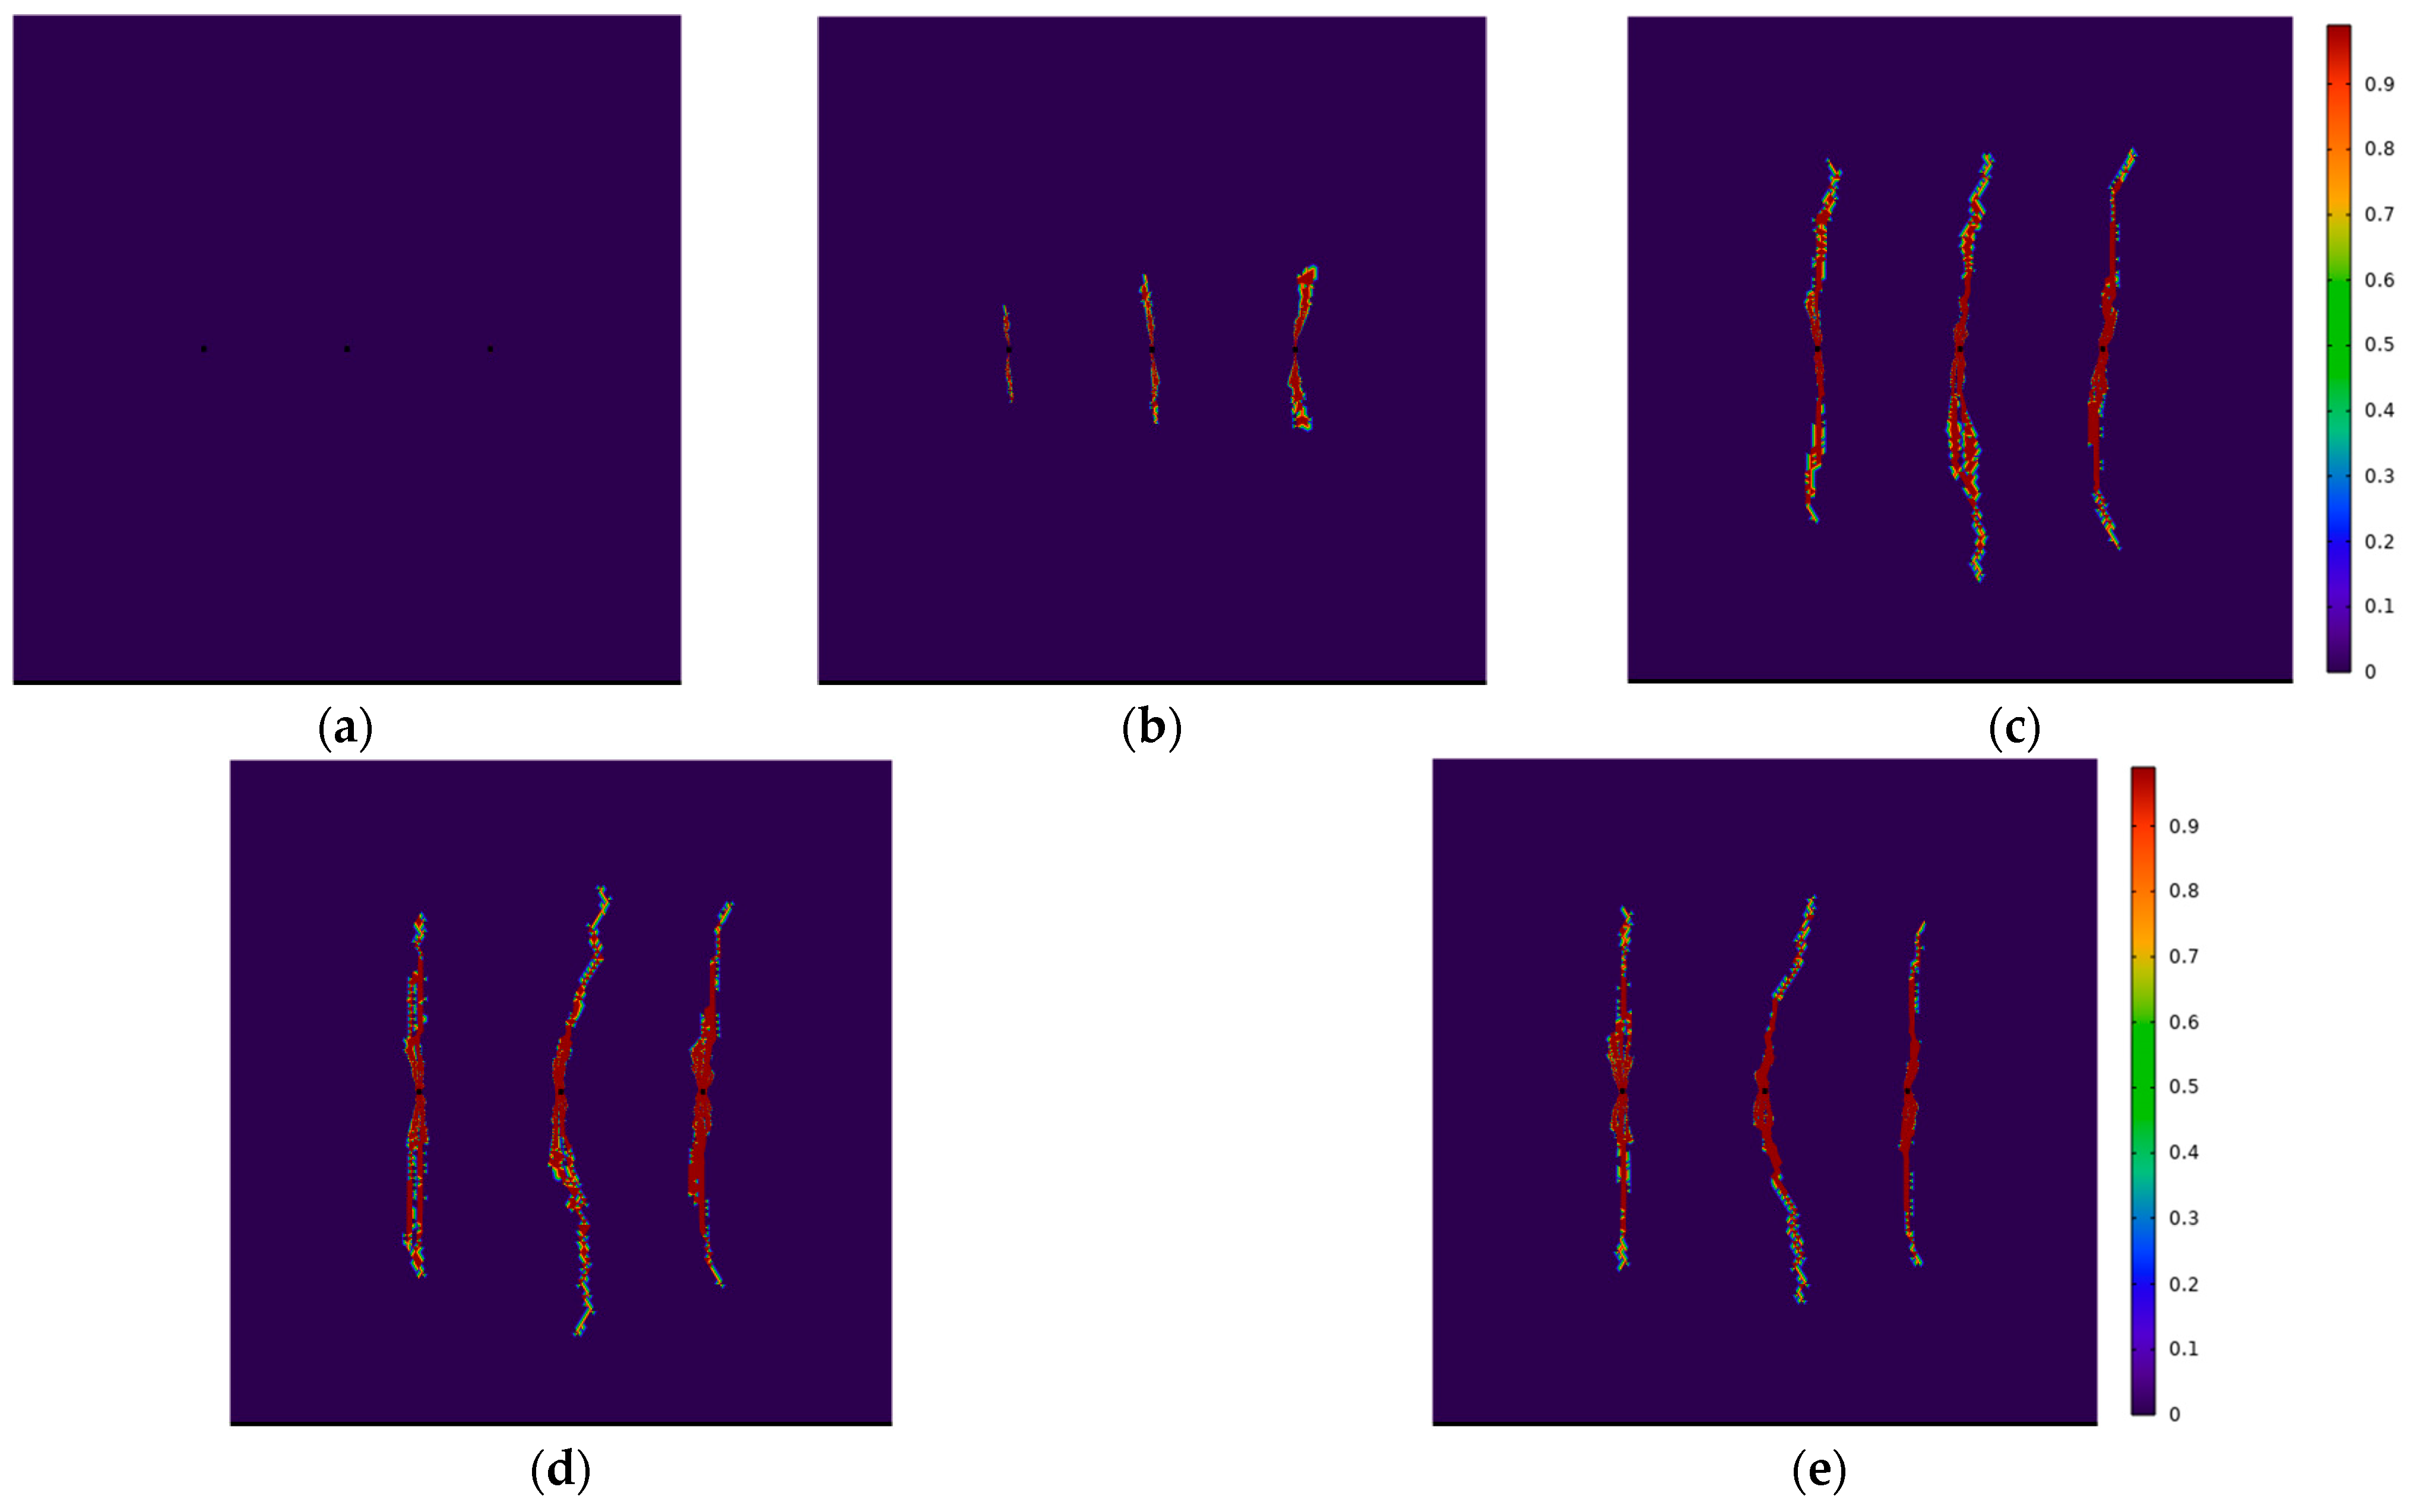
3.2. Model Validation

To validate the feasibility of the numerical model, we compare its simulation results with the analytical solution of the classical KGD model, as shown in Figure 3. The fracture length in the KGD model is calculated using the following equation [37]:
L f ( t ) = 2 0.539 E q 3 μ w h f 3 1 6 t 2 3
where q is the pumping rate; E′ is the elastic modulus under plane strain, E = E 1 υ 2 ; μw is the fluid viscosity; hf is the fracture height (in the 2D model, hf = 10 m); t is time. Comparative results show that the fracture length of the numerical model is consistent with the trend of the KGD model.

4. Analysis of Factors Influencing Hydraulic Fracture Propagation Behavior

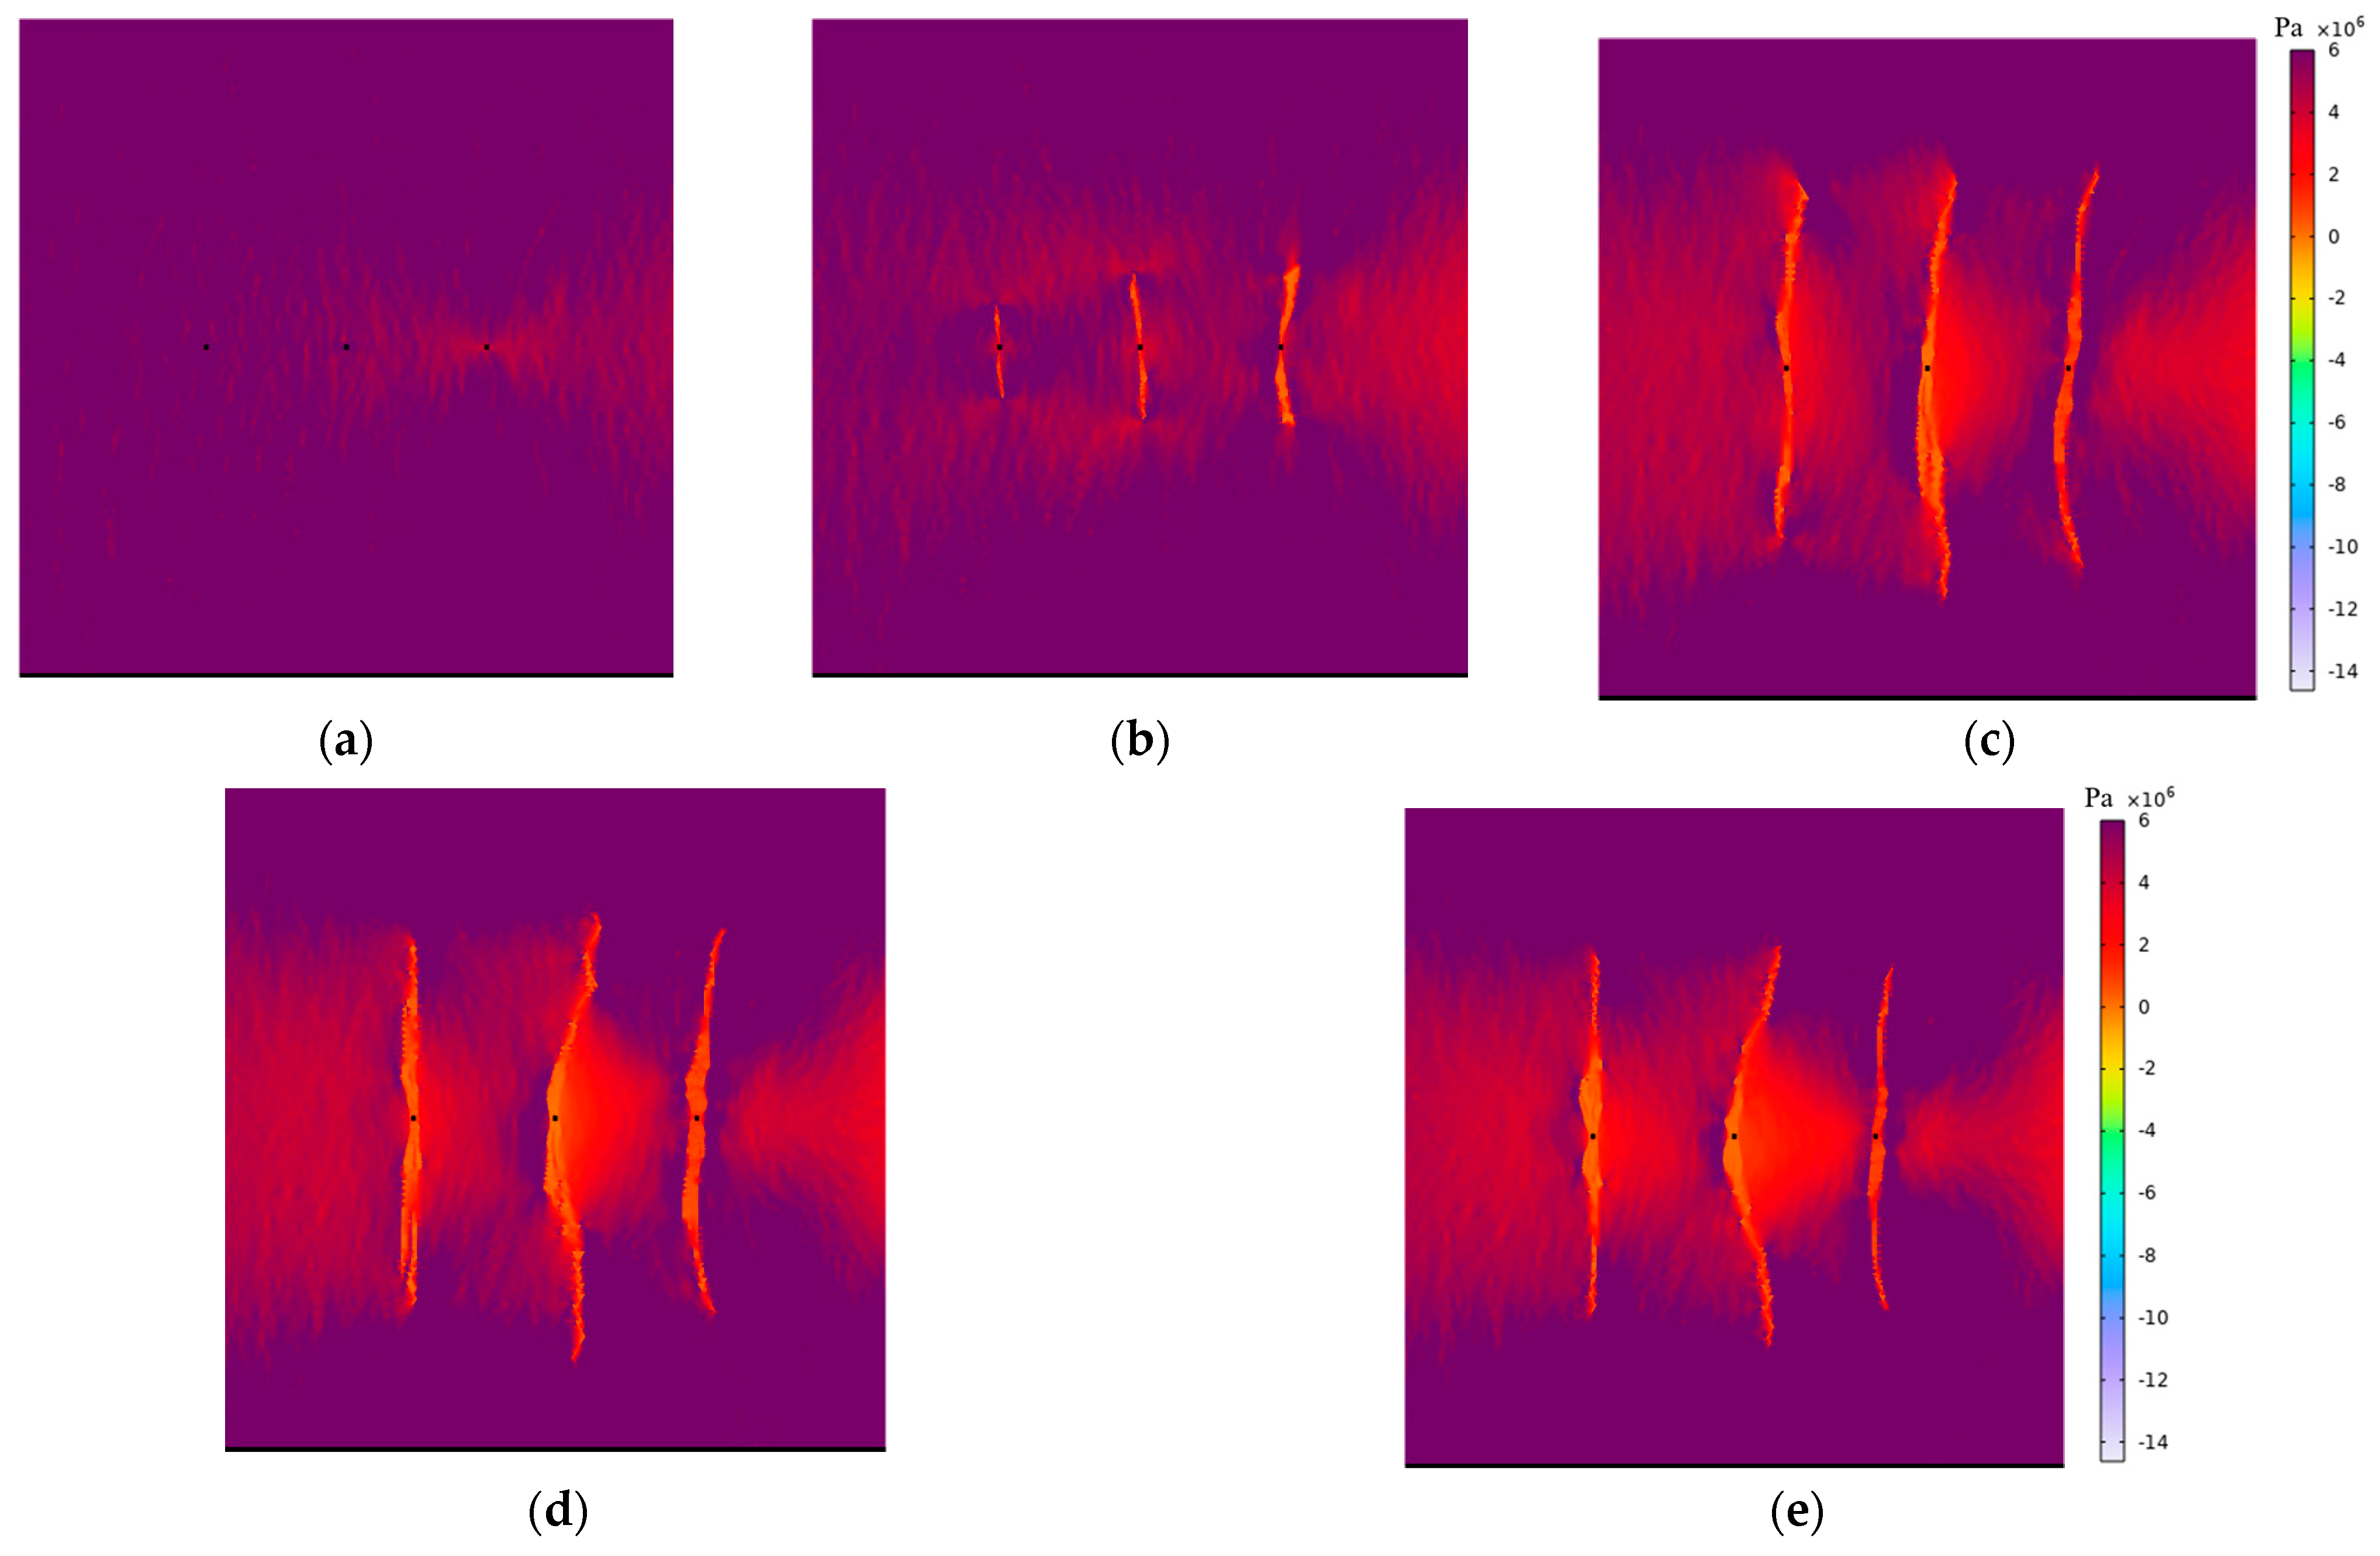
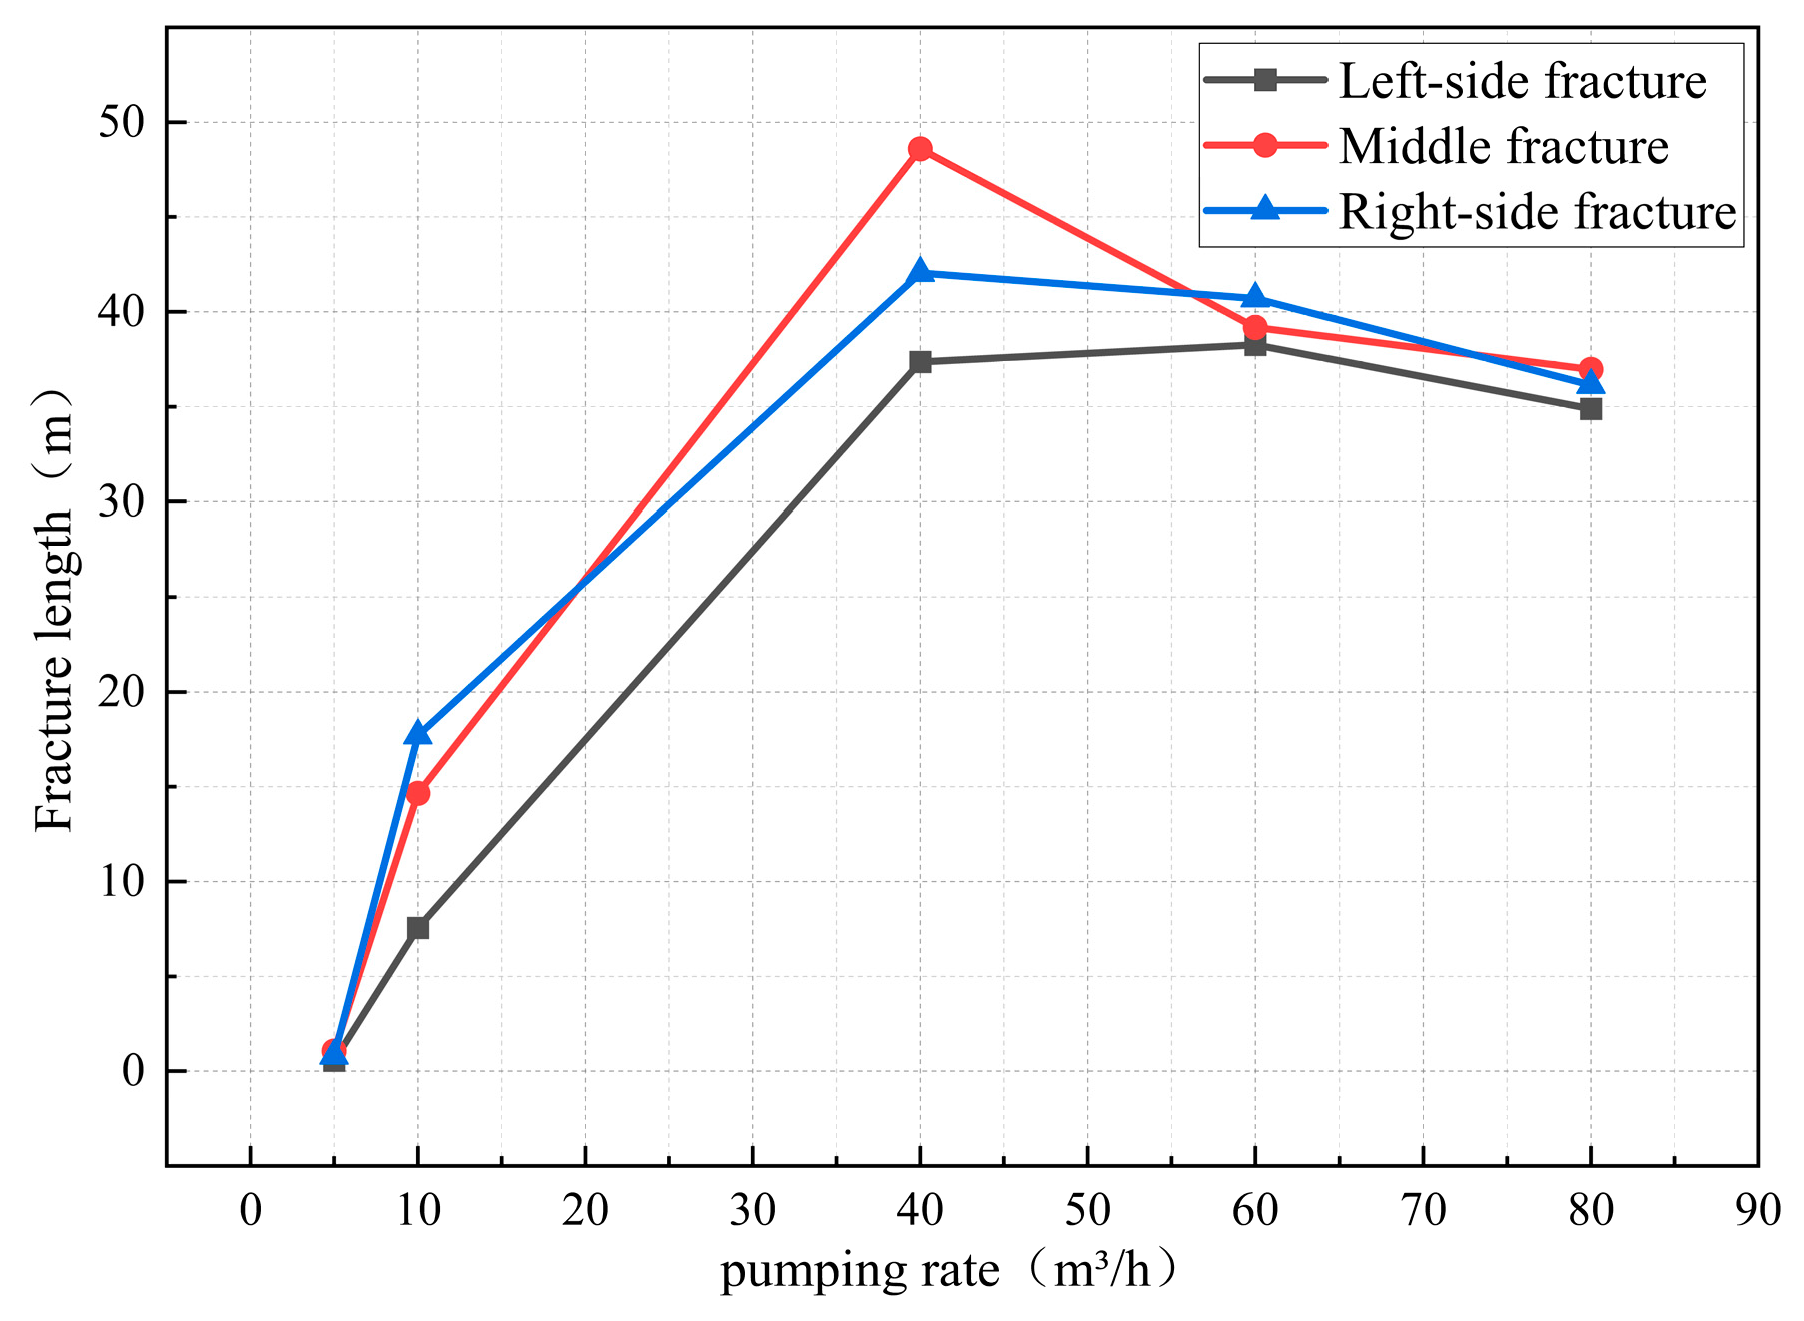
4.1. Influence of Pumping Rate on Multi-Fracture Propagation

Understanding the influence of fluid flow on fracture propagation is essential for optimizing hydraulic fracturing parameters. The pumping rate is a critical factor affecting the fracturing outcome. In this study, injection rates of 5, 10, 40, 60, and 80 m3/h are tested. The corresponding simulation times are set to 480, 240, 60, 40, and 30 min, respectively, to ensure that the total injected fluid volume remains constant across all cases.
As shown in Figure 4, with an increase in injection rate, the damage zone around the fractures gradually expands, and the extent of damage increases. This indicates that higher injection rates induce greater stress disturbance in the rock, making microcracks more likely to initiate, propagate, and coalesce, thereby enlarging the damage area around the fractures. Figure 4a shows that at an injection rate of 5 m3/h, the fracture development is not clearly visible. This may be due to the low injection rate causing significant fluid loss into the formation. Therefore, the available fluid pressure is insufficient to overcome the in situ stress and rock tensile strength, preventing effective fracture initiation.
The distribution of Misses stress under different pumping rates is shown in Figure 5. The results demonstrate that increasing the injection rate enhances stress interactions between fracture clusters, leading to a greater degree of deflection in the central fracture. Under high injection rates, the heterogeneity of fracture damage becomes more pronounced, with localized damage concentration observed. This may be attributed to the uneven distribution of fluid pressure, which increases the stress variation across different locations and lead to a more complex damage distribution. Due to the effects of heterogeneity, the rock’s resistance to deformation varies along different hydraulic fracture paths, causing the fracture to expand asymmetrically or even exhibit multiple-wing propagation. Additionally, the stress induced by pre-existing fractures can lead to deflection in the growth direction of subsequent fractures.
The distribution of Misses stress under different pumping rate is shown in Figure 5. The results demonstrate that increasing the injection rate enhances stress interactions between fracture clusters, leading to a greater degree of deflection in the central fracture. Under high injection rates, the heterogeneity of fracture damage becomes more pronounced, with localized damage concentration observed. This may be attributed to the uneven distribution of fluid pressure, which increases the stress variation across different locations and lead to a more complex damage distribution. Due to the effects of heterogeneity, the rock’s resistance to deformation varies along different hydraulic fracture paths, causing the fracture to expand asymmetrically or even exhibit multiple-wing propagation. Additionally, the stress induced by pre-existing fractures can lead to deflection in the growth direction of subsequent fractures.
Figure 6 shows that, as the pumping rate increases, the lengths of the three fractures first increase and then decrease. Among these, the fracture length increased by 98% as the injection rate was raised from 5 to 40 m3/h, peaking at the maximum tested rate of 40 m3/h. Subsequently, as the rate increased to 80 m3/h, the fracture length decreased by 24%. This indicates that a higher injection rate can initially enhance fracture propagation length. However, when the injection rate reaches a certain level, the injection time decreases due to the fixed fluid volume. The reduced duration of fluid application to the fracture results in a shorter fracture length.
Heterogeneity complicates fluid flow and pressure distribution. Areas with higher permeability and lower rock strength tend to disperse the overall fracturing energy, reducing the extension of the main fracture, especially at higher injection rates. In the three-cluster model, as the injection rate increases, fracture propagation accelerates, and the influence of stress interference diminishes.

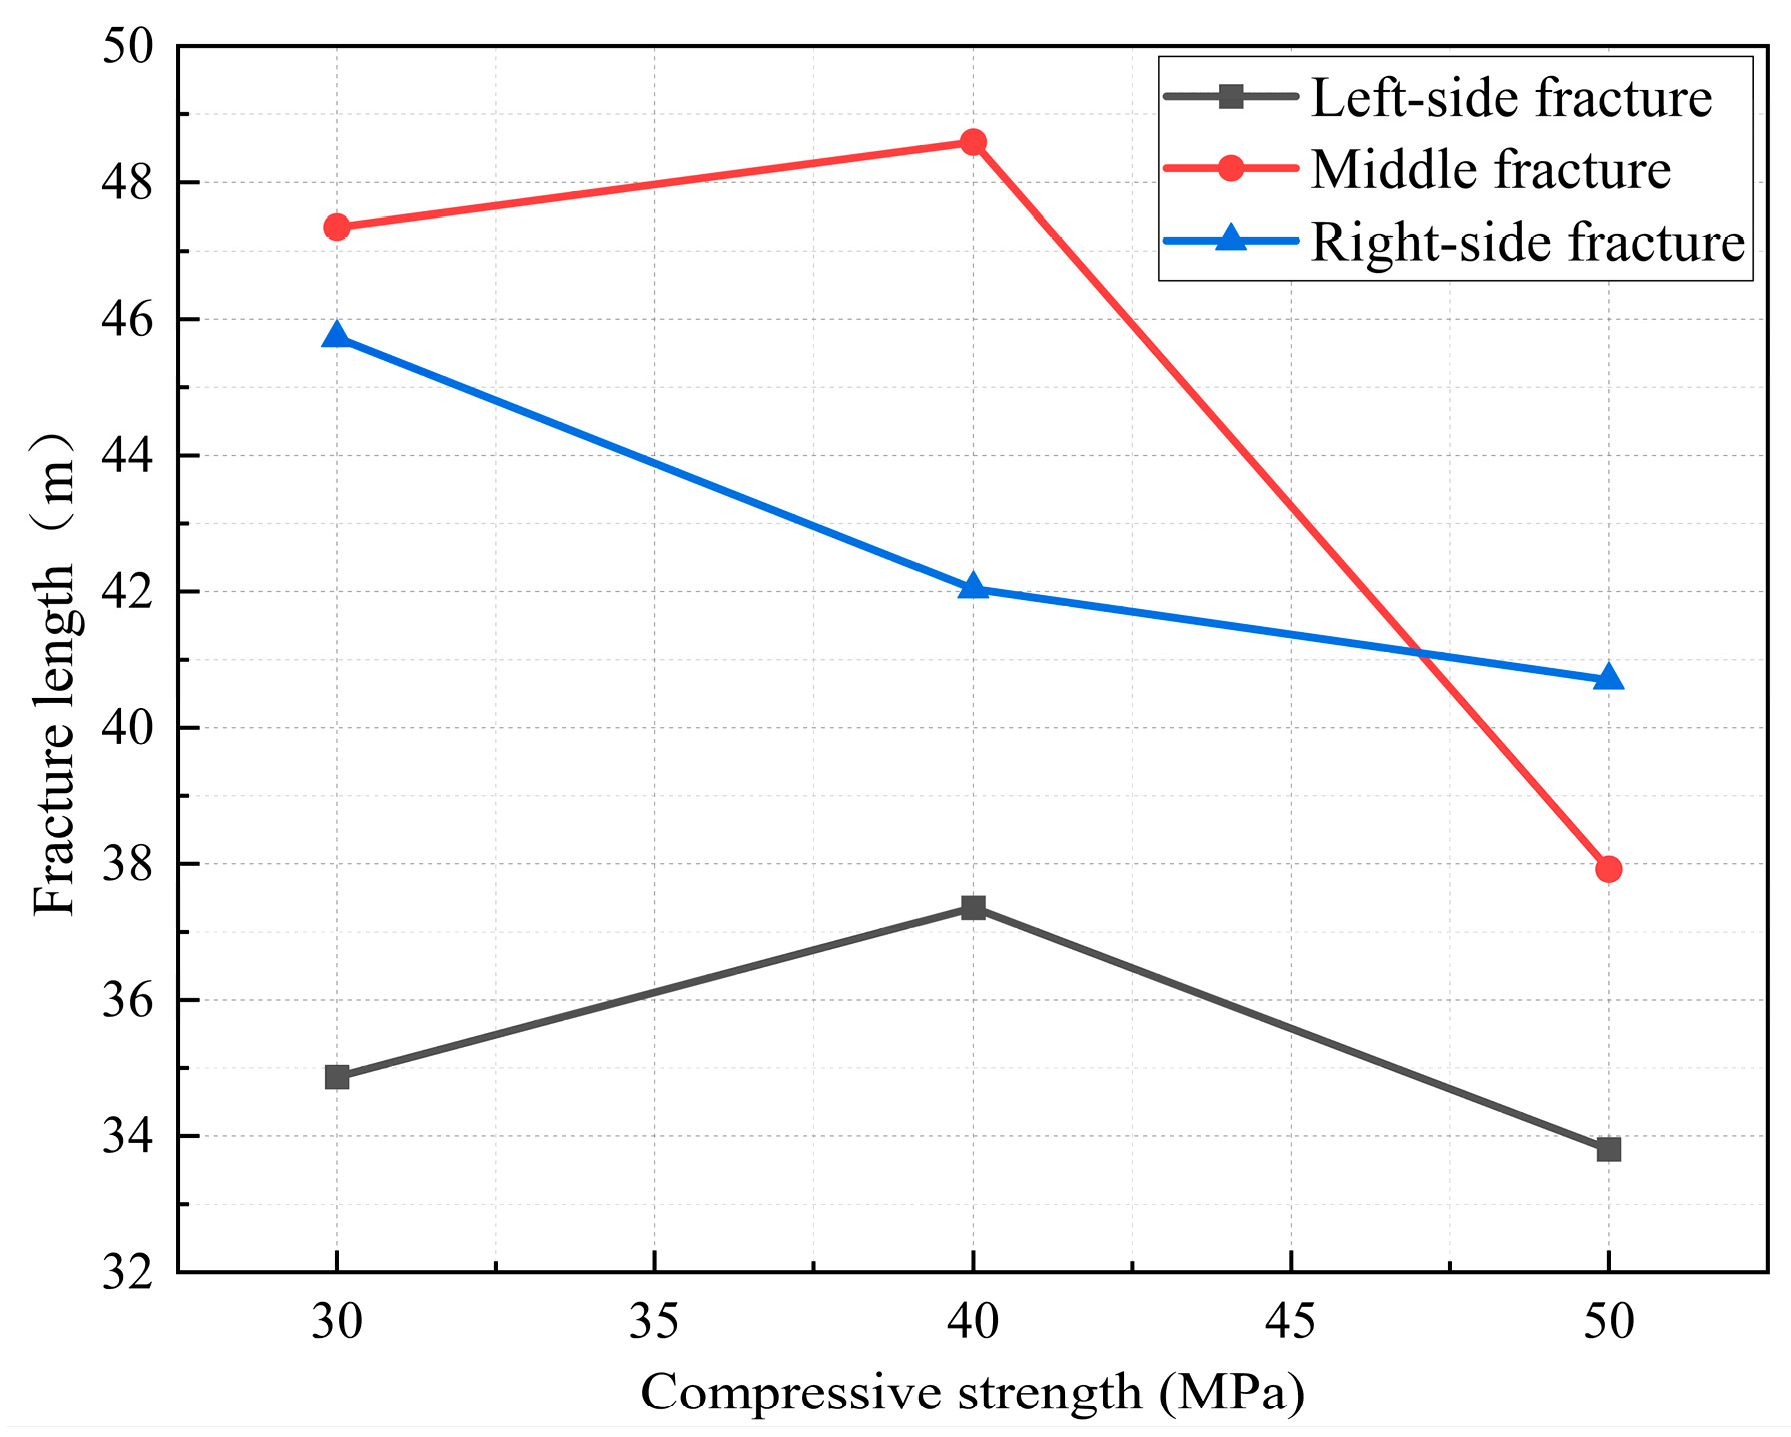
4.2. Influence of Compressive Strength on Multi-Fracture Propagation

Hydraulic fracturing must overcome rock resistance which is directly related to the rock strength. Rock compressive strength is a key factor influencing hydraulic fracture propagation. Therefore, this study investigates the effect of compressive strength on fracture propagation by setting it to 30, 40, and 50 MPa.
Figure 7 shows that, as compressive strength increases, the damage zone around fractures shrinks significantly. High-strength rocks require higher pressures to initiate microcracks. Low-strength rocks (e.g., 30 MPa) reach peak strength more easily, leading to more intense damage and wider crushing zones. Fractures in such rocks also exhibit less deflection, as lower fracture initiation stress promotes rapid fracture propagation rather than energy-consuming deviation.
Figure 8 shows the variation in fracture propagation length. The results show that as compressive strength increases, the lengths of the left and central fractures first increase and then decrease, while the right fracture continuously shortens. In high-strength formations, weak zones become focal points for fracture propagation. Despite overall strength increases, localized high pressures in these zones facilitate fracture initiation. Heterogeneous stress distribution also causes reorientation and branching, counteracting some of the restrictions imposed by higher strength. However, as strength further increases, fracture toughness and the critical stress intensity factor rise, making propagation more difficult. The central fracture shortens progressively, possibly due to increased stress interference from the left and central fractures, compounded by higher toughness, limiting right fracture extension.

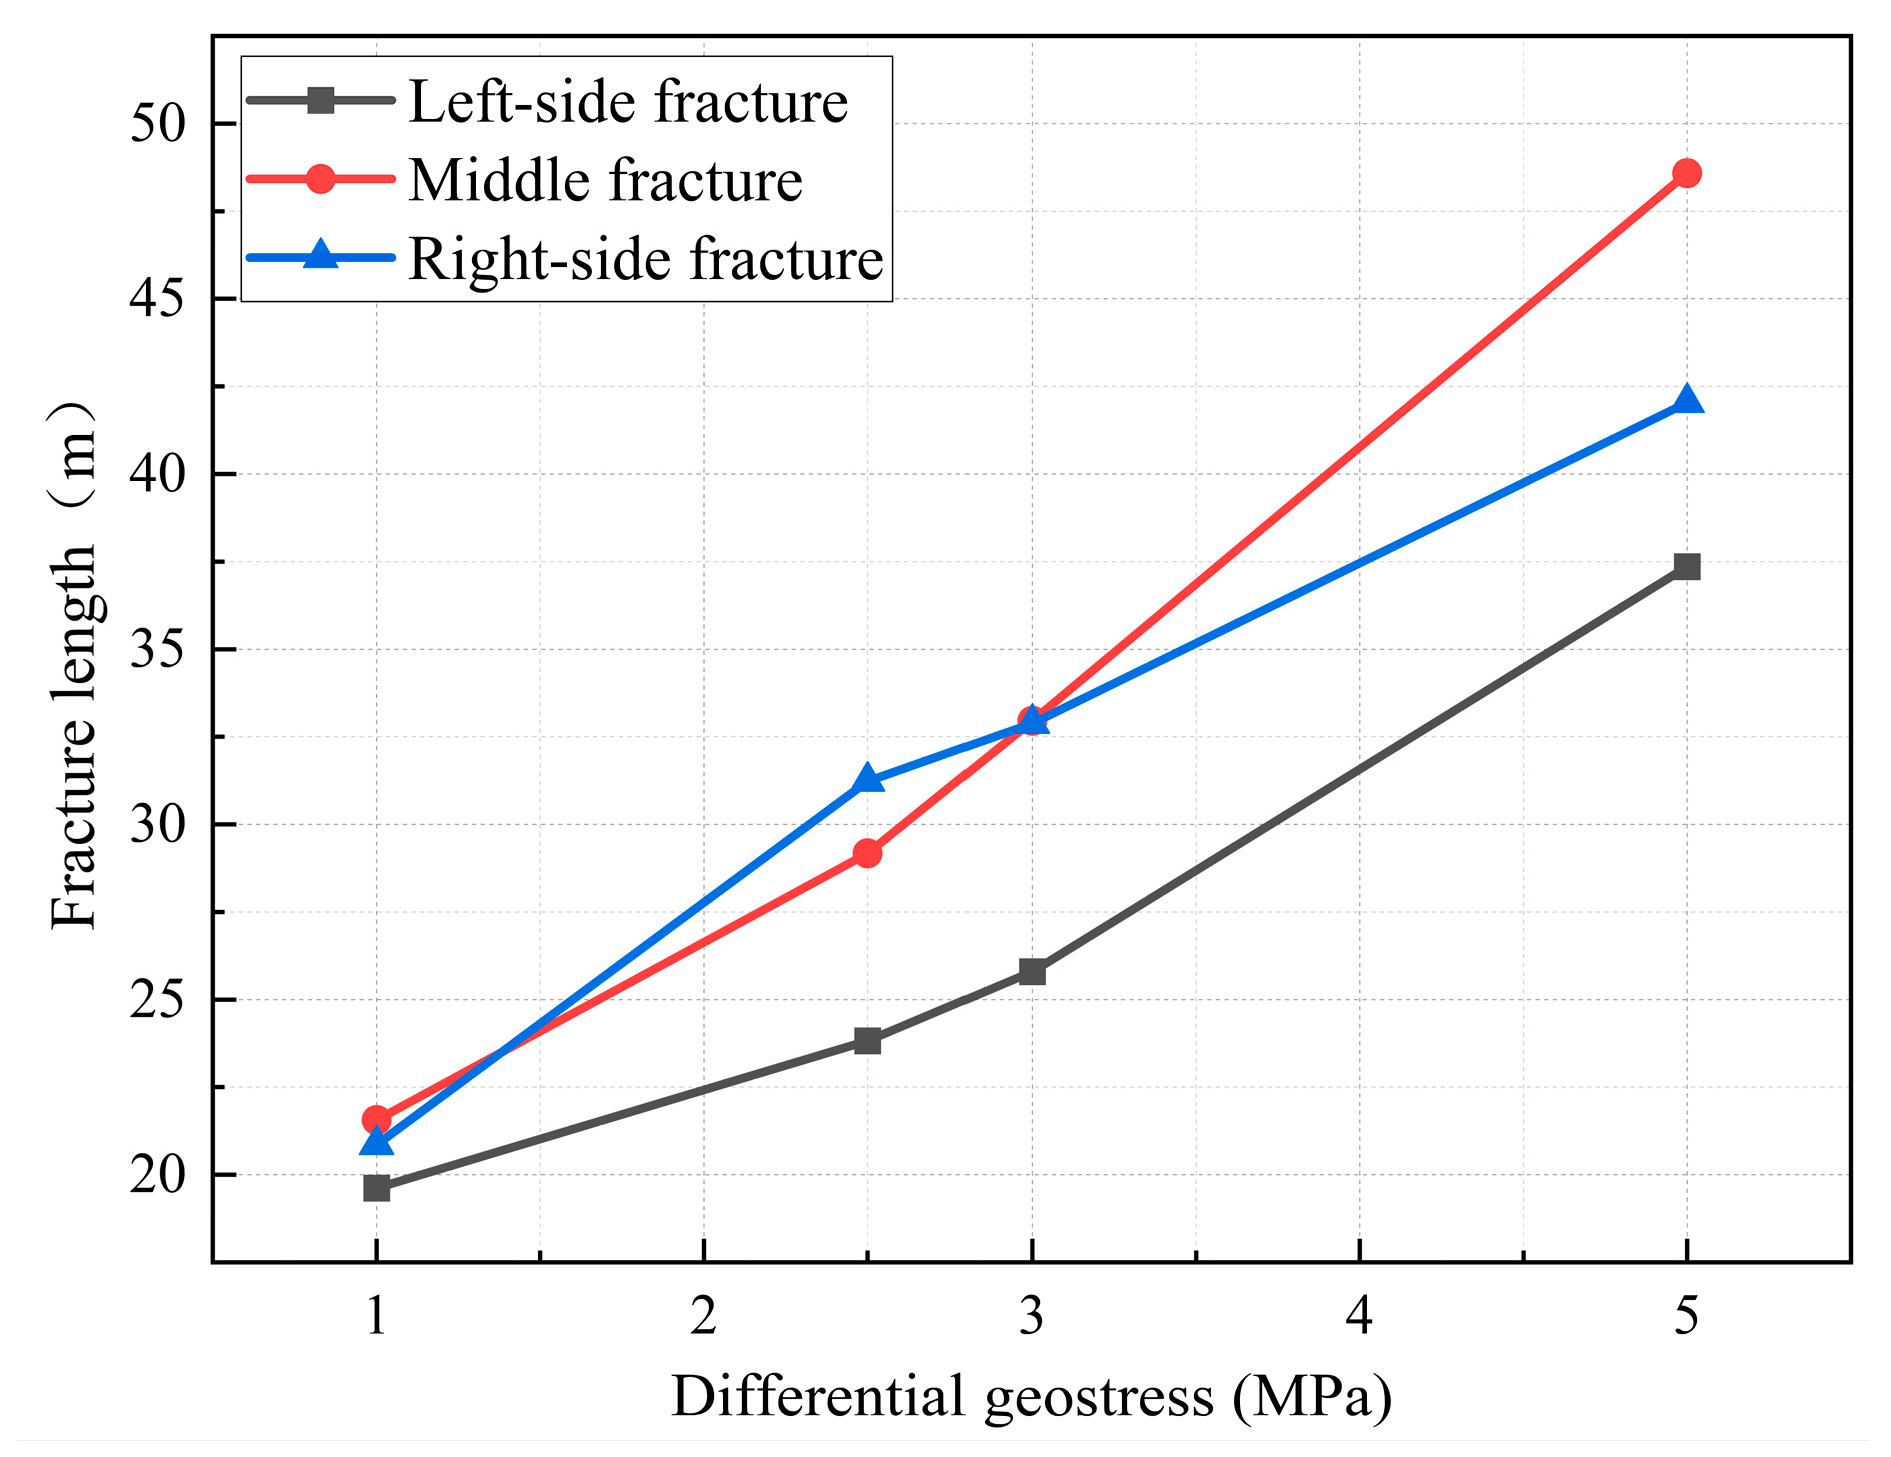
4.3. Influence of In Situ Stress Difference on Multi-Fracture Propagation

In situ stress difference is a key factor influencing hydraulic fracture propagating orientation and network formation. This study applies stress difference conditions of 1, 2.5, 3, and 5 MPa to investigate their effects.
Figure 9 shows that as stress difference increases, the red damage zone around fractures expands, and propagation shifts from random to alignment with the maximum principal stress. High stress differences provide greater driving force, directing fractures along the path of least resistance. It is important to note that the crack propagation in Figure 9a deviates from the direction of the maximum principal stress. This indicates that under conditions of small stress differences, fractures in the center and right are more easily influenced by fractures on the left, and the induced stress exceeds the in situ stress.
Figure 10 shows the variation in crack length under different stress difference conditions. The results indicate that all three fractures lengthen as stress difference increases. Higher differences concentrate propagation along the principal stress direction, enhancing length. The right and central fractures are longer than the left, likely due to rock strength differences. Stress interference also varies between clusters, affecting their lengths.

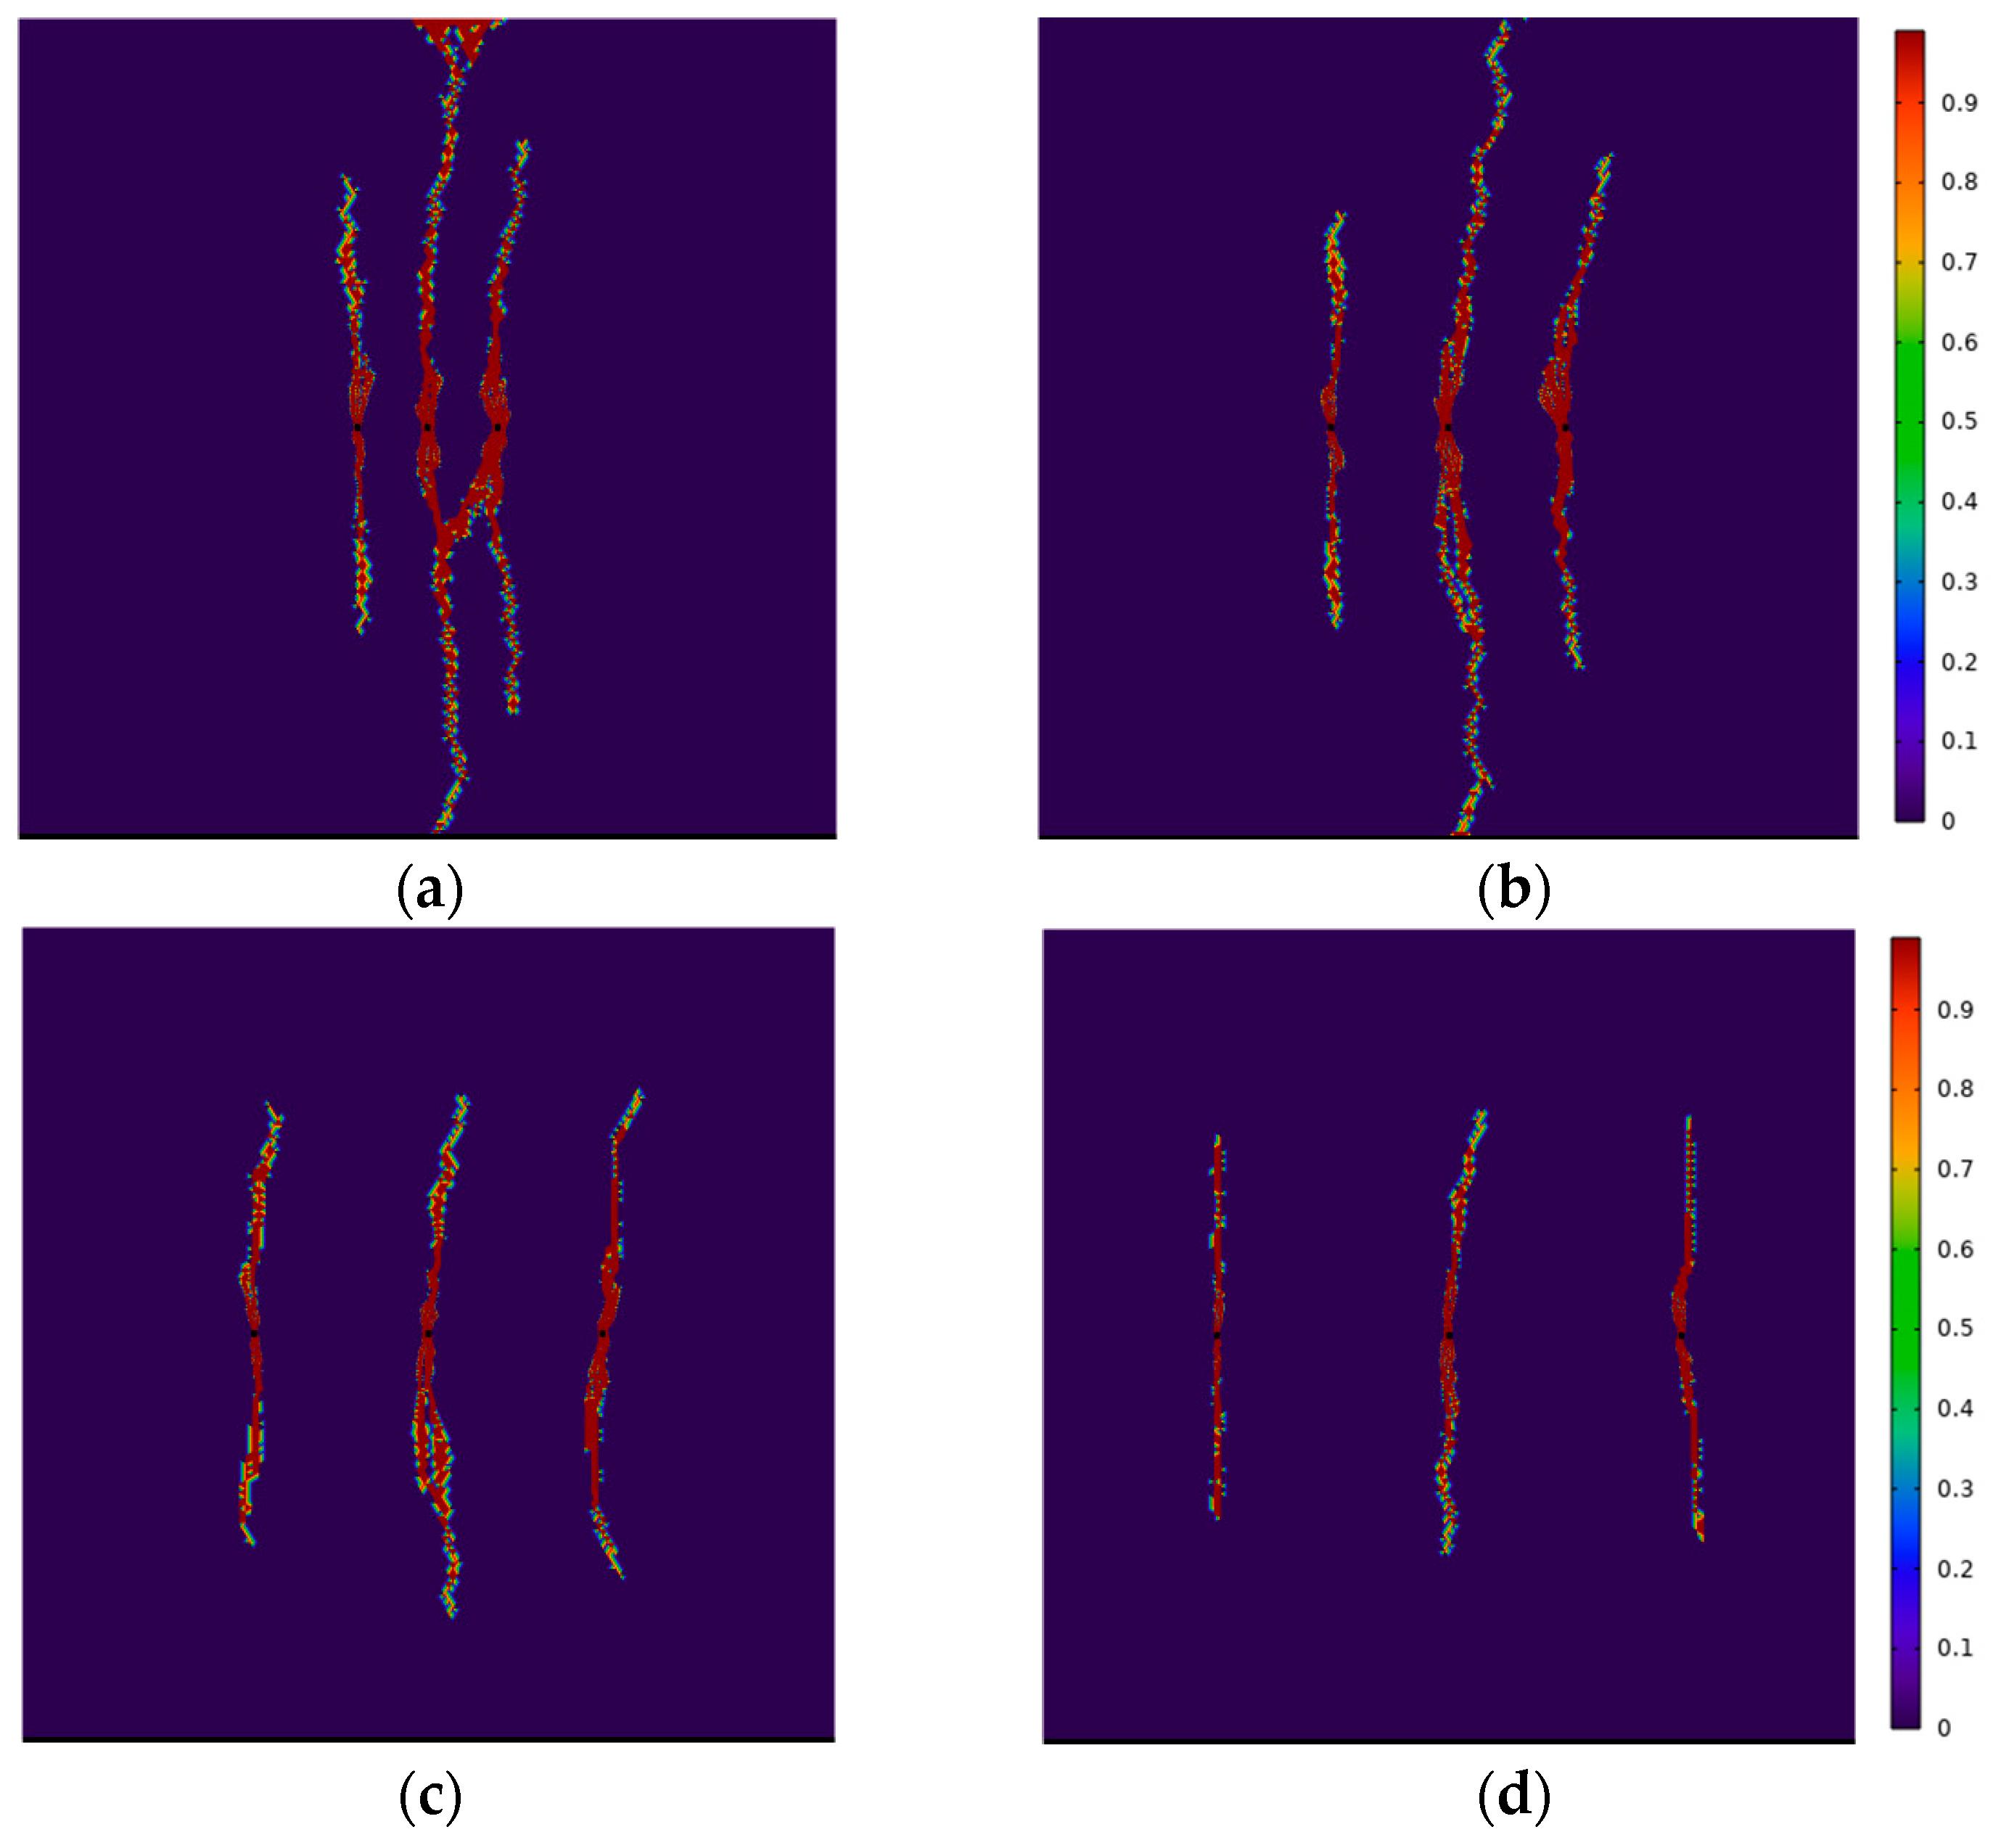
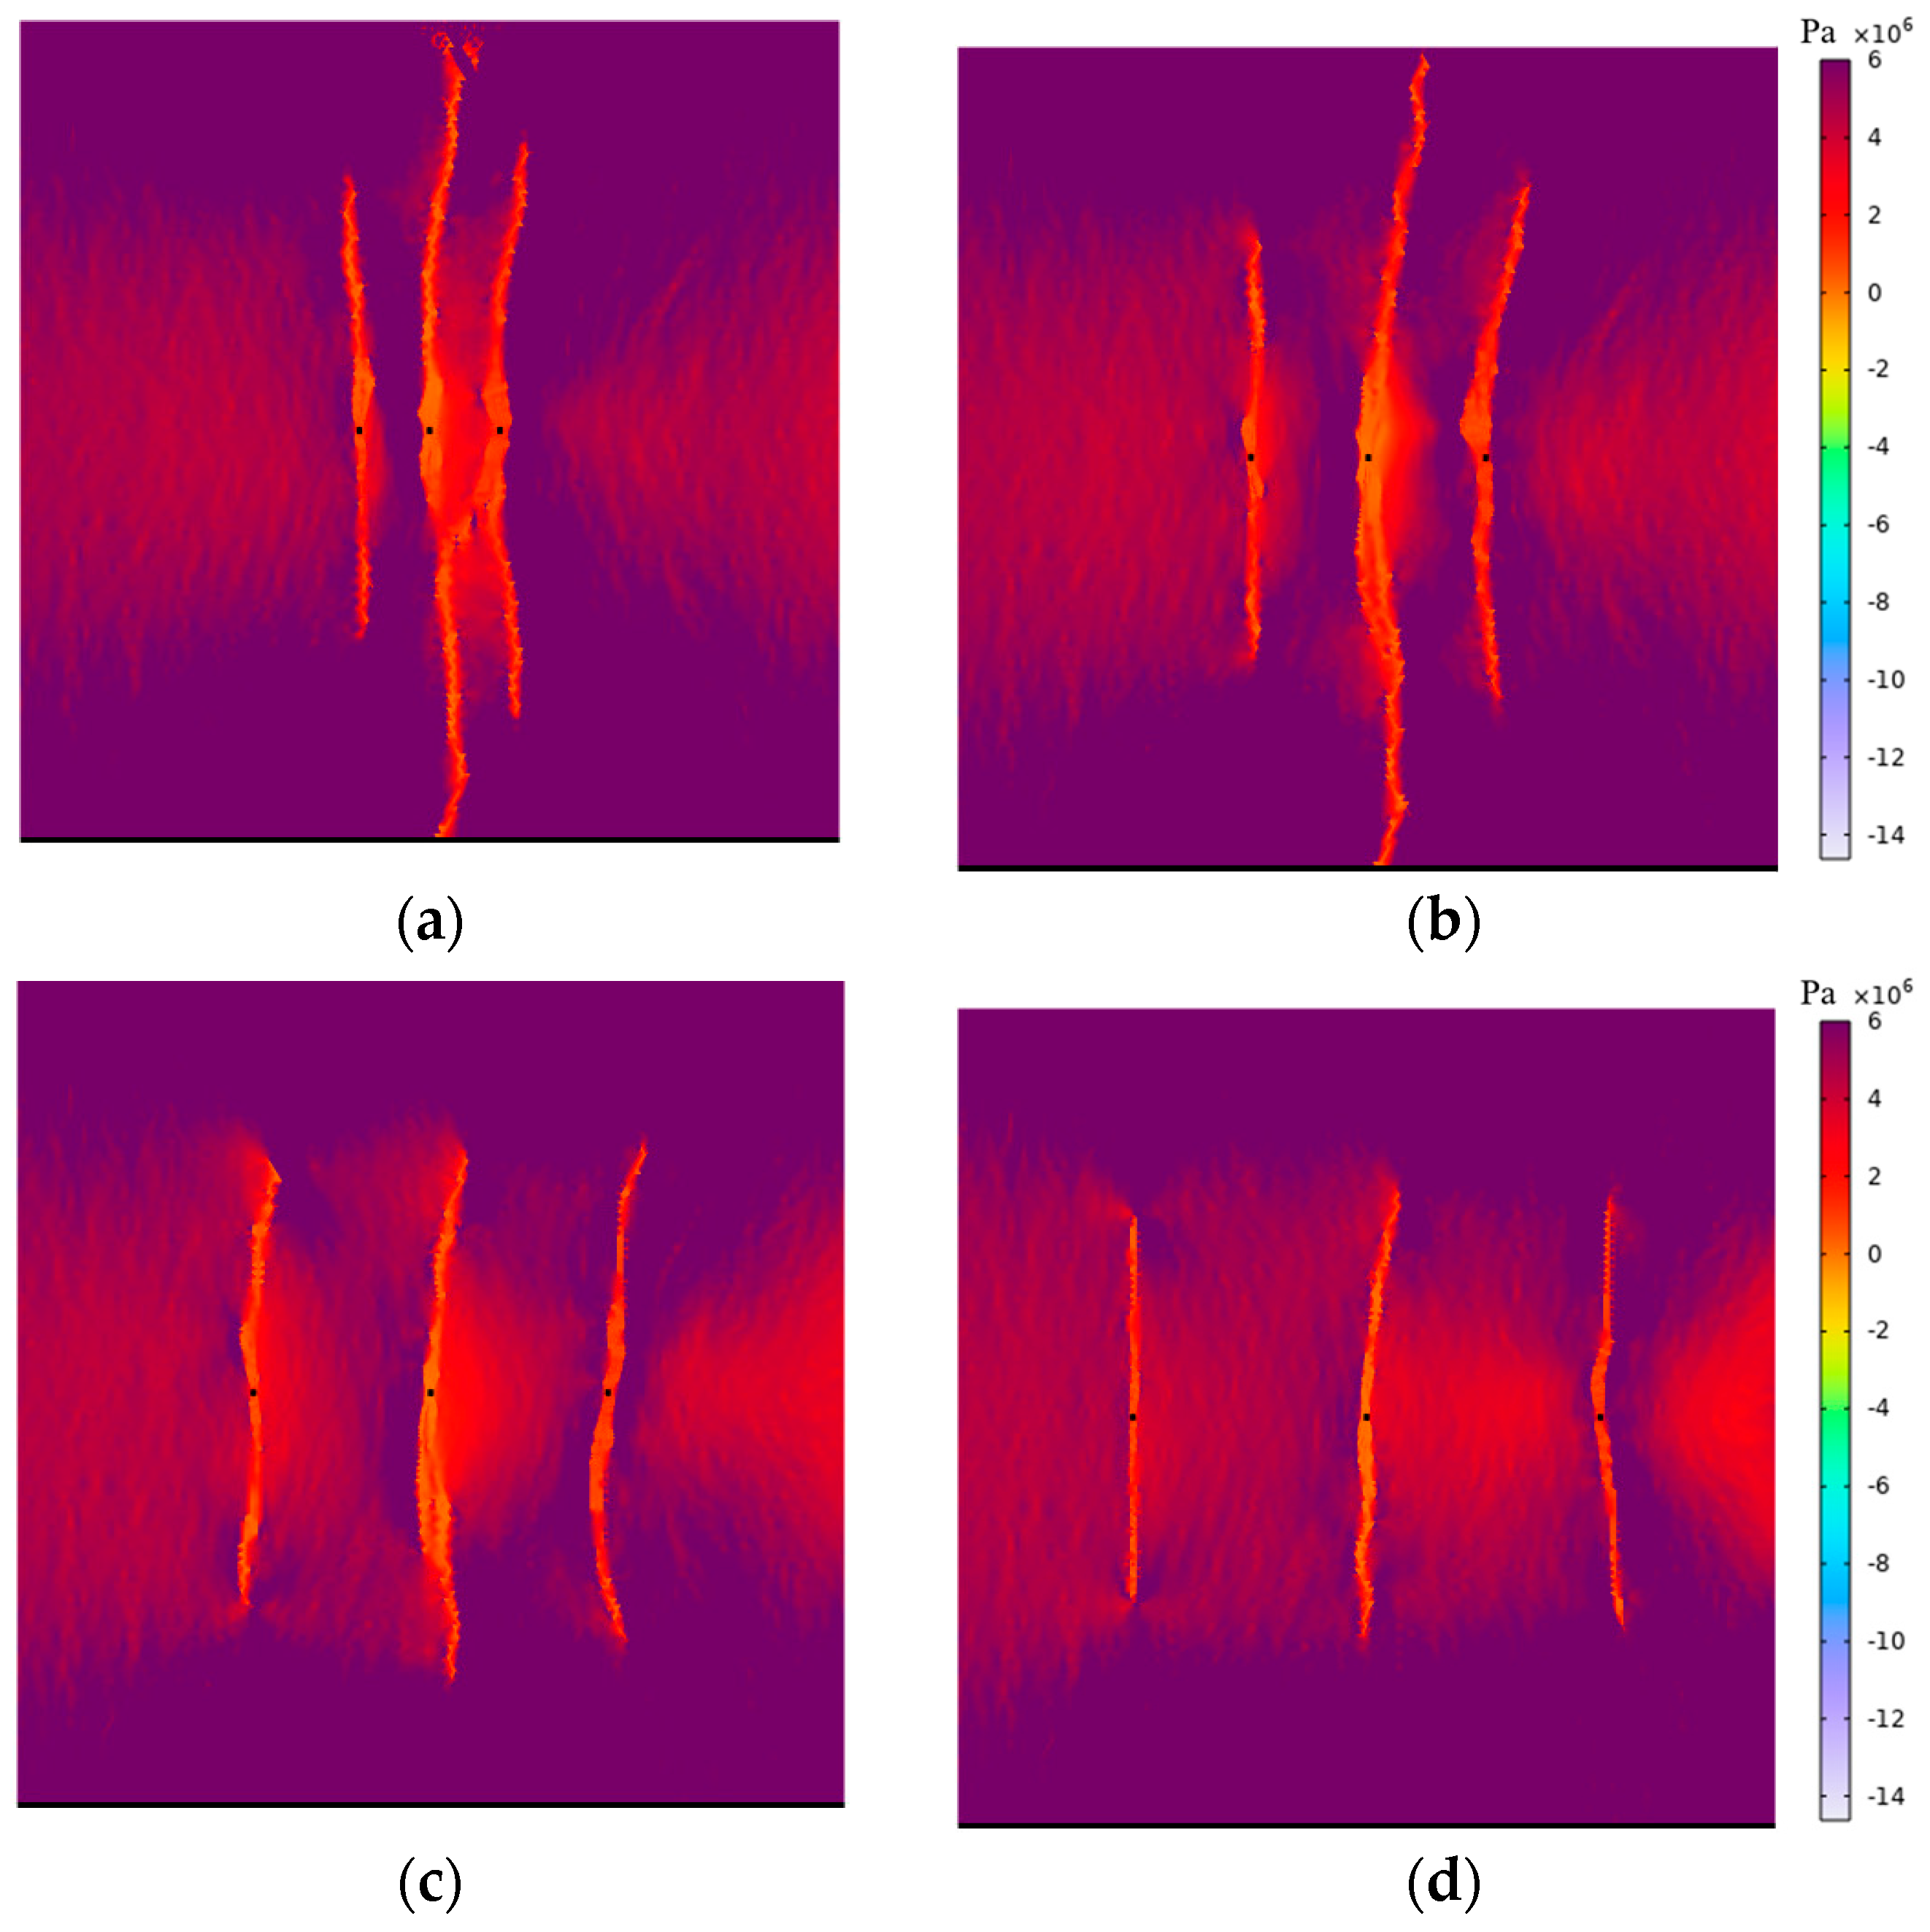
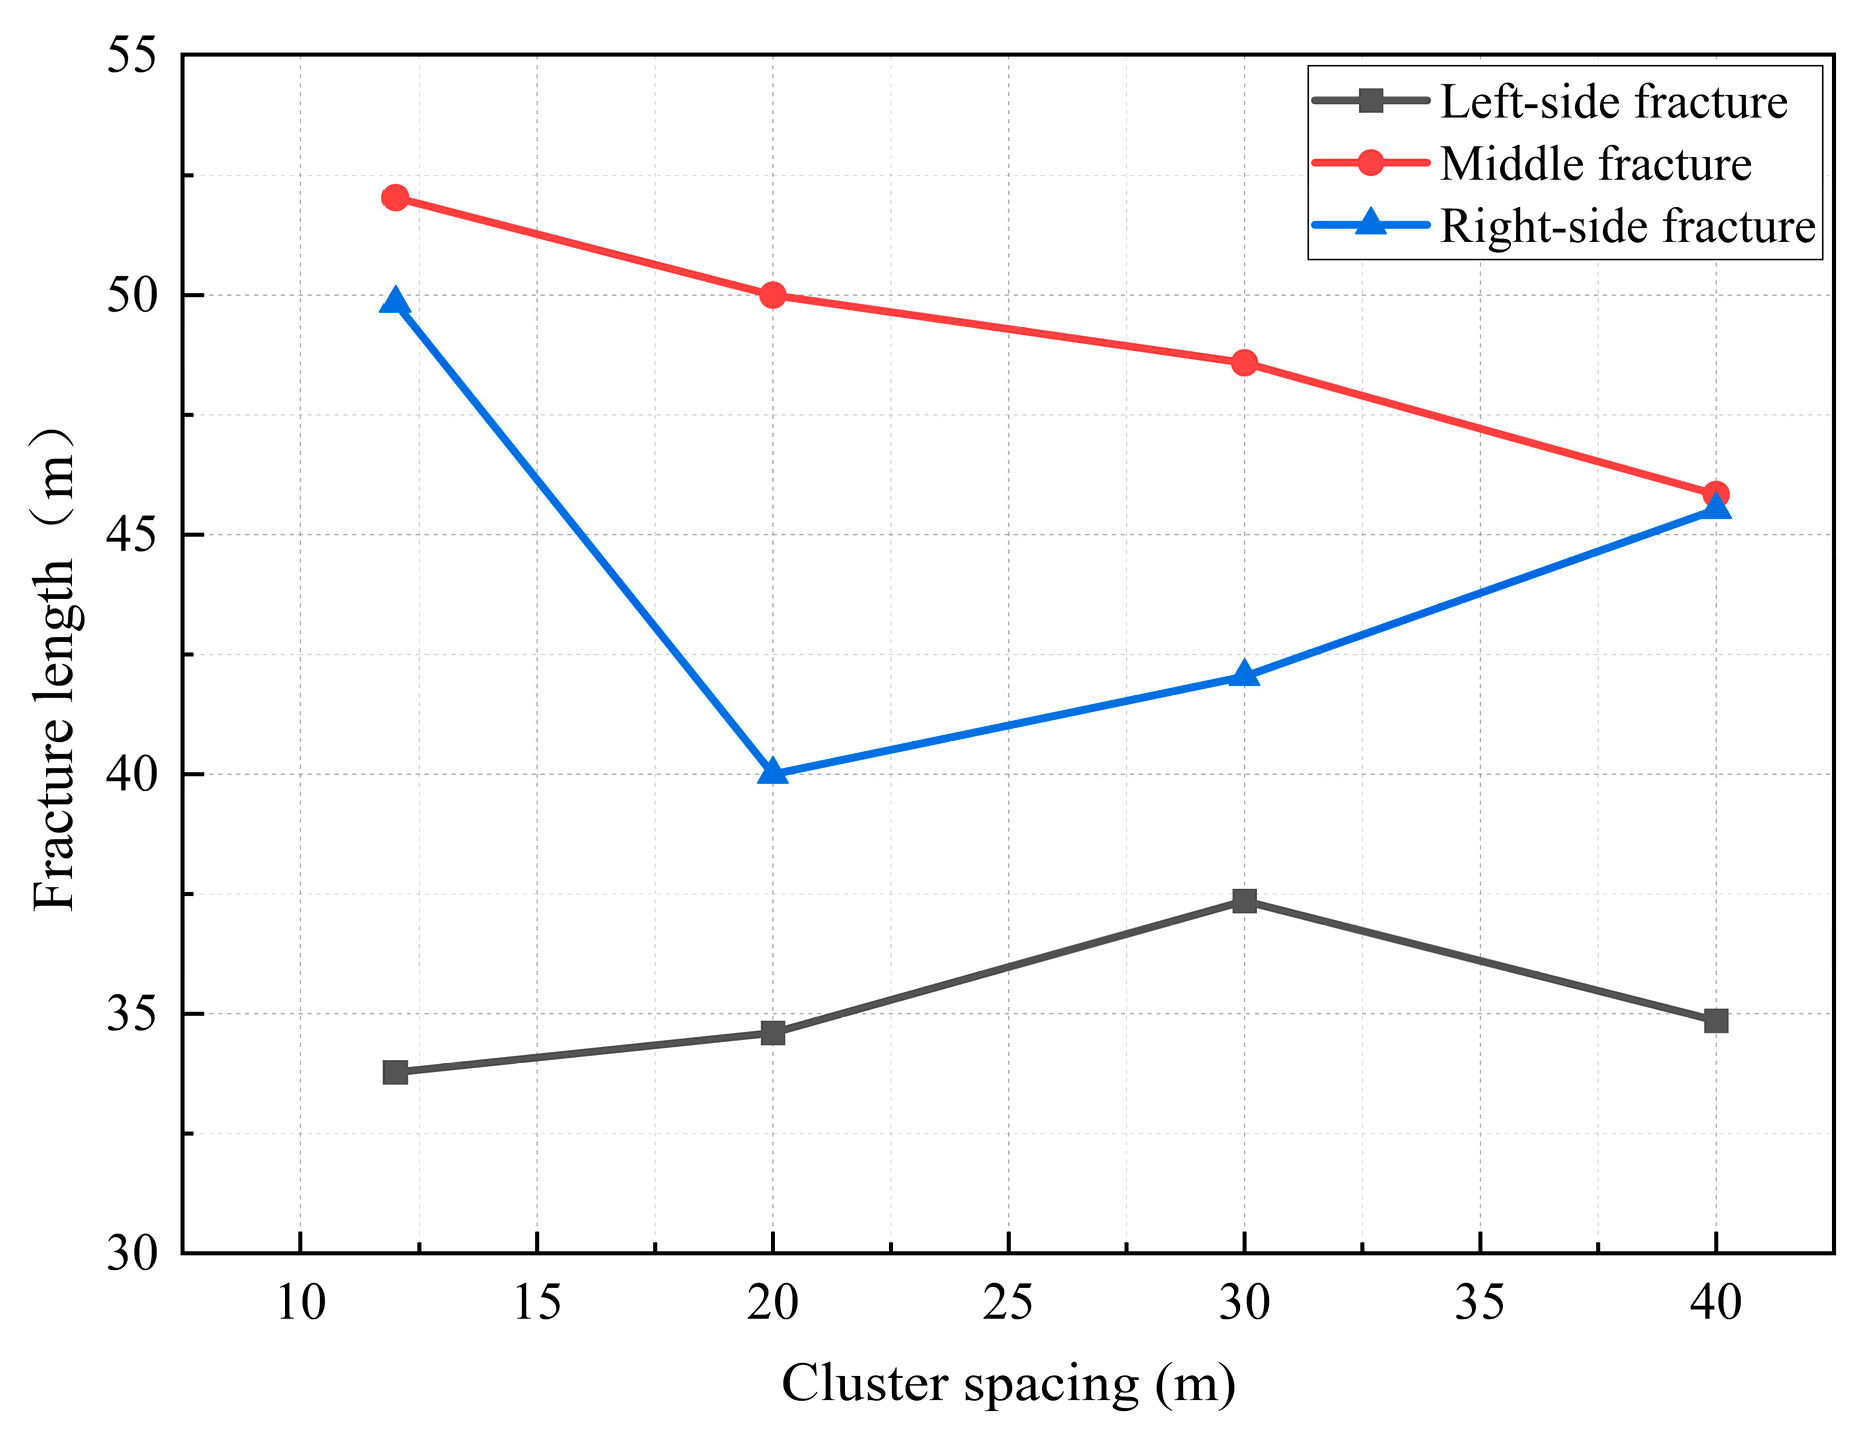
4.4. Influence of Segment Length on Multi-Fracture Propagation

The segment length in hydraulic fracturing of coal seam roofs is a key factor influencing roof-weakening. Generally, a smaller segment length leads to more densely and uniform cracks, which facilitate stress release in the roof. However, this comes with higher economic costs and longer construction timelines. Therefore, this study examines segment length of 12, 20, 30, and 40 m to investigate its impact on the propagation of multiple cracks.
Figure 11 and Figure 12 show that, as segment length increases, fractures propagate more uniformly. At smaller segment lengths, fractures deflect due to stress interference, exacerbating asymmetry and forming complex branches. At 40 m, fractures extend symmetrically with narrow, straight damage zones, following the maximum principal stress. Figure 13 shows that the left fracture extends slightly before shortening, and the fracture length stabilized at approximately 35 m, possibly due to rock heterogeneity. The central fracture continuously shortens, and the crack length decreased from 52.03 m to 45.84 m, indicating a 12% reduction, likely because the wider segment length disperses fluid energy, while interference from the left fracture further inhibits its growth. The length of the right fracture initially decreases and then increases.

5. Engineering Application

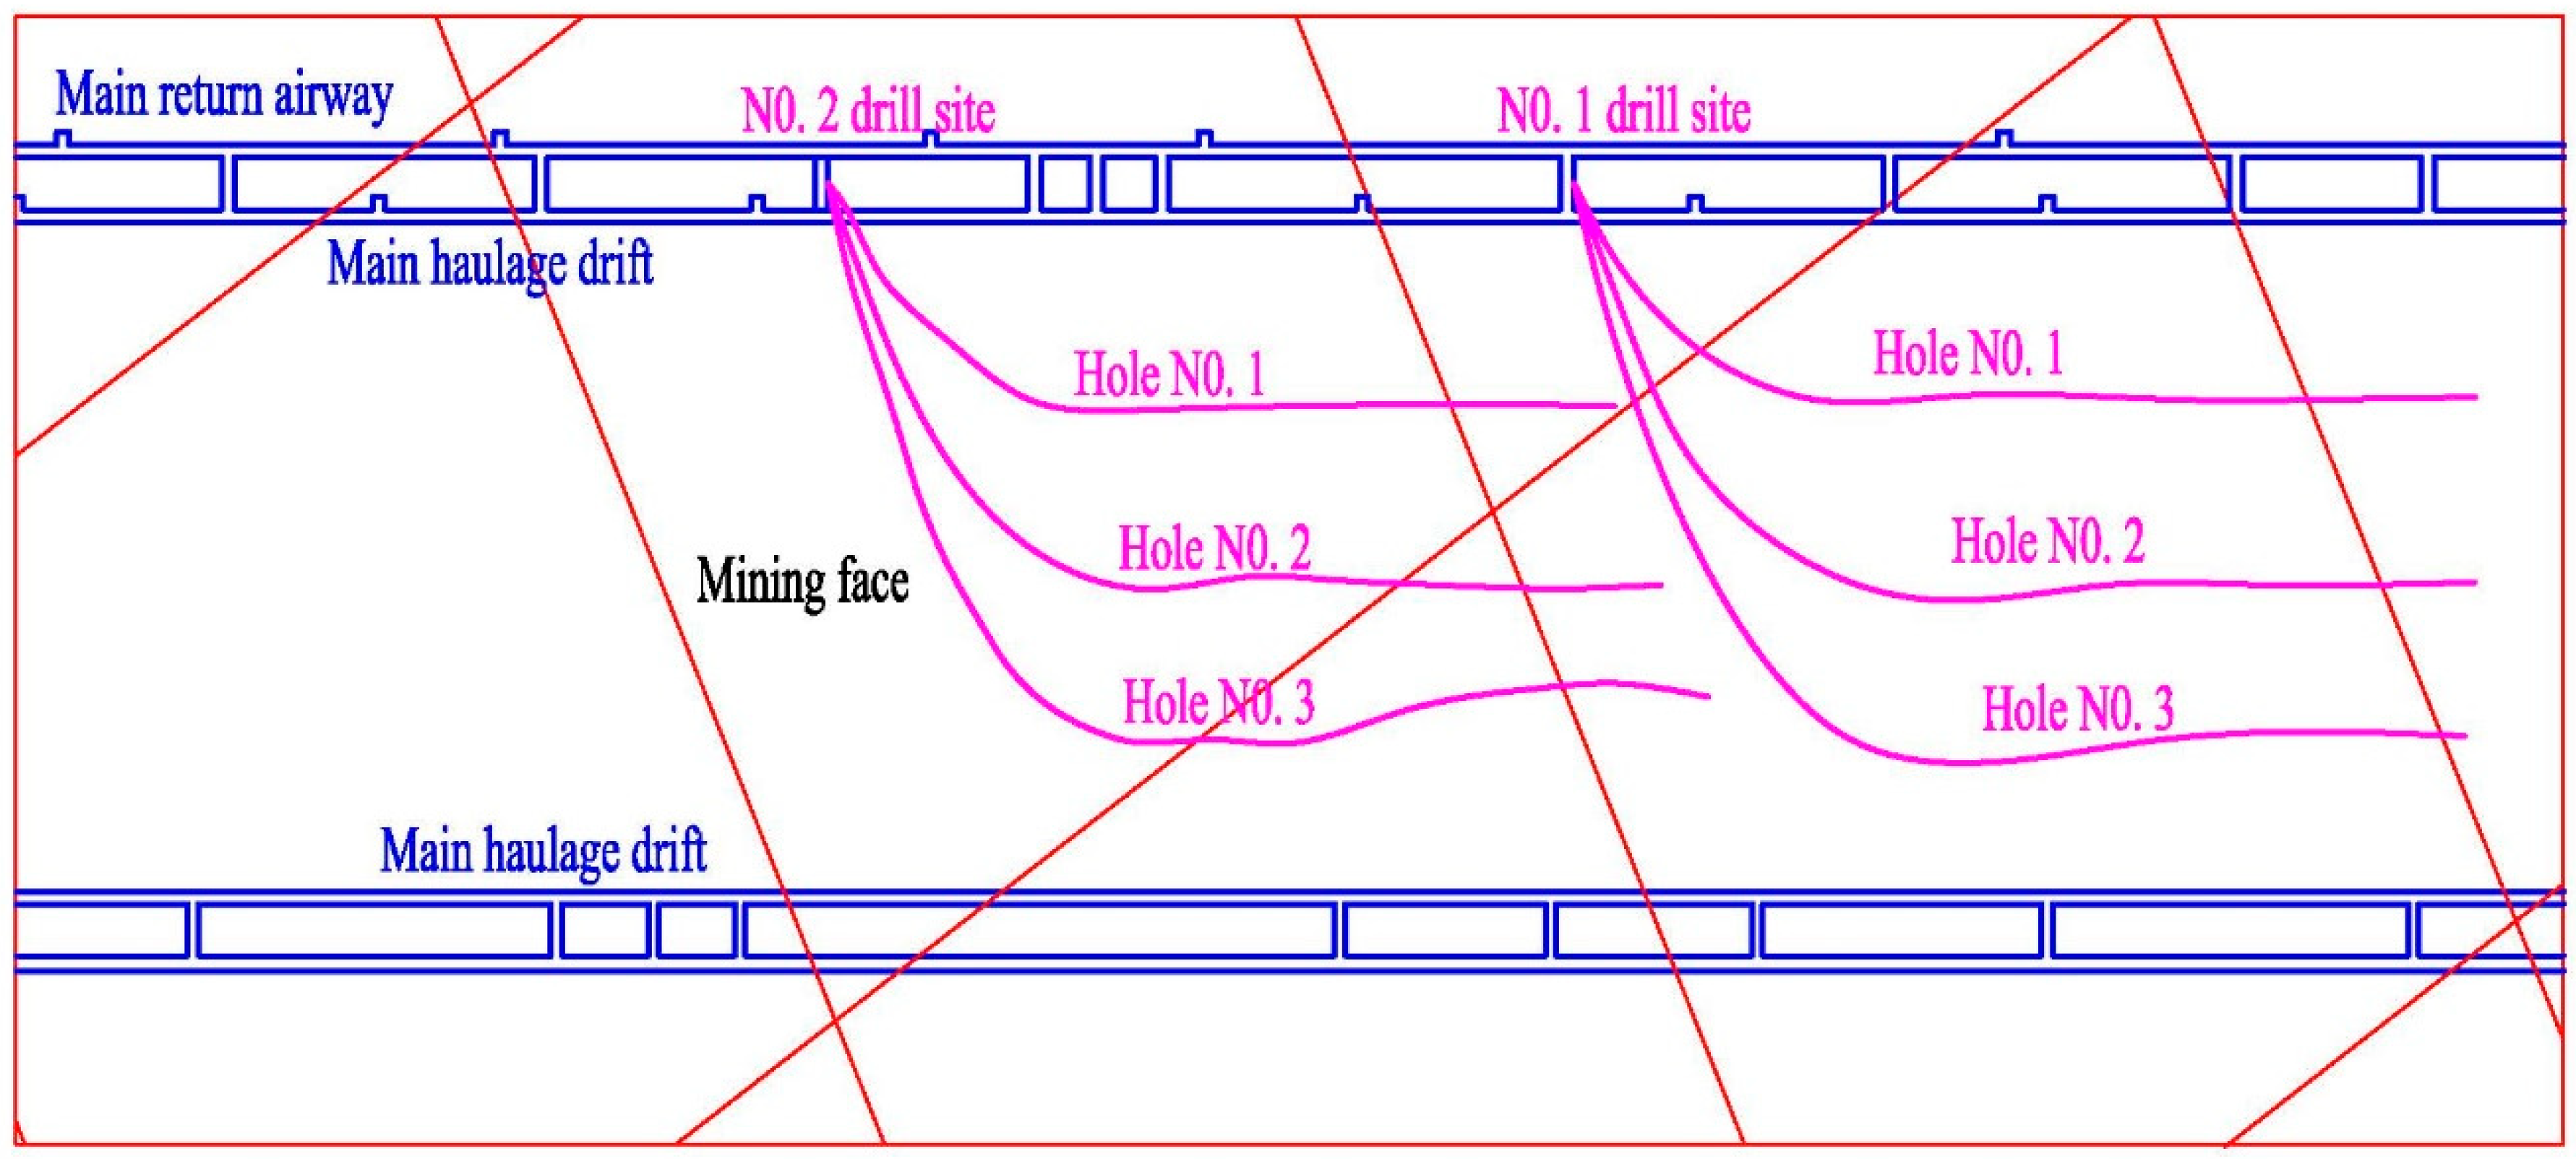
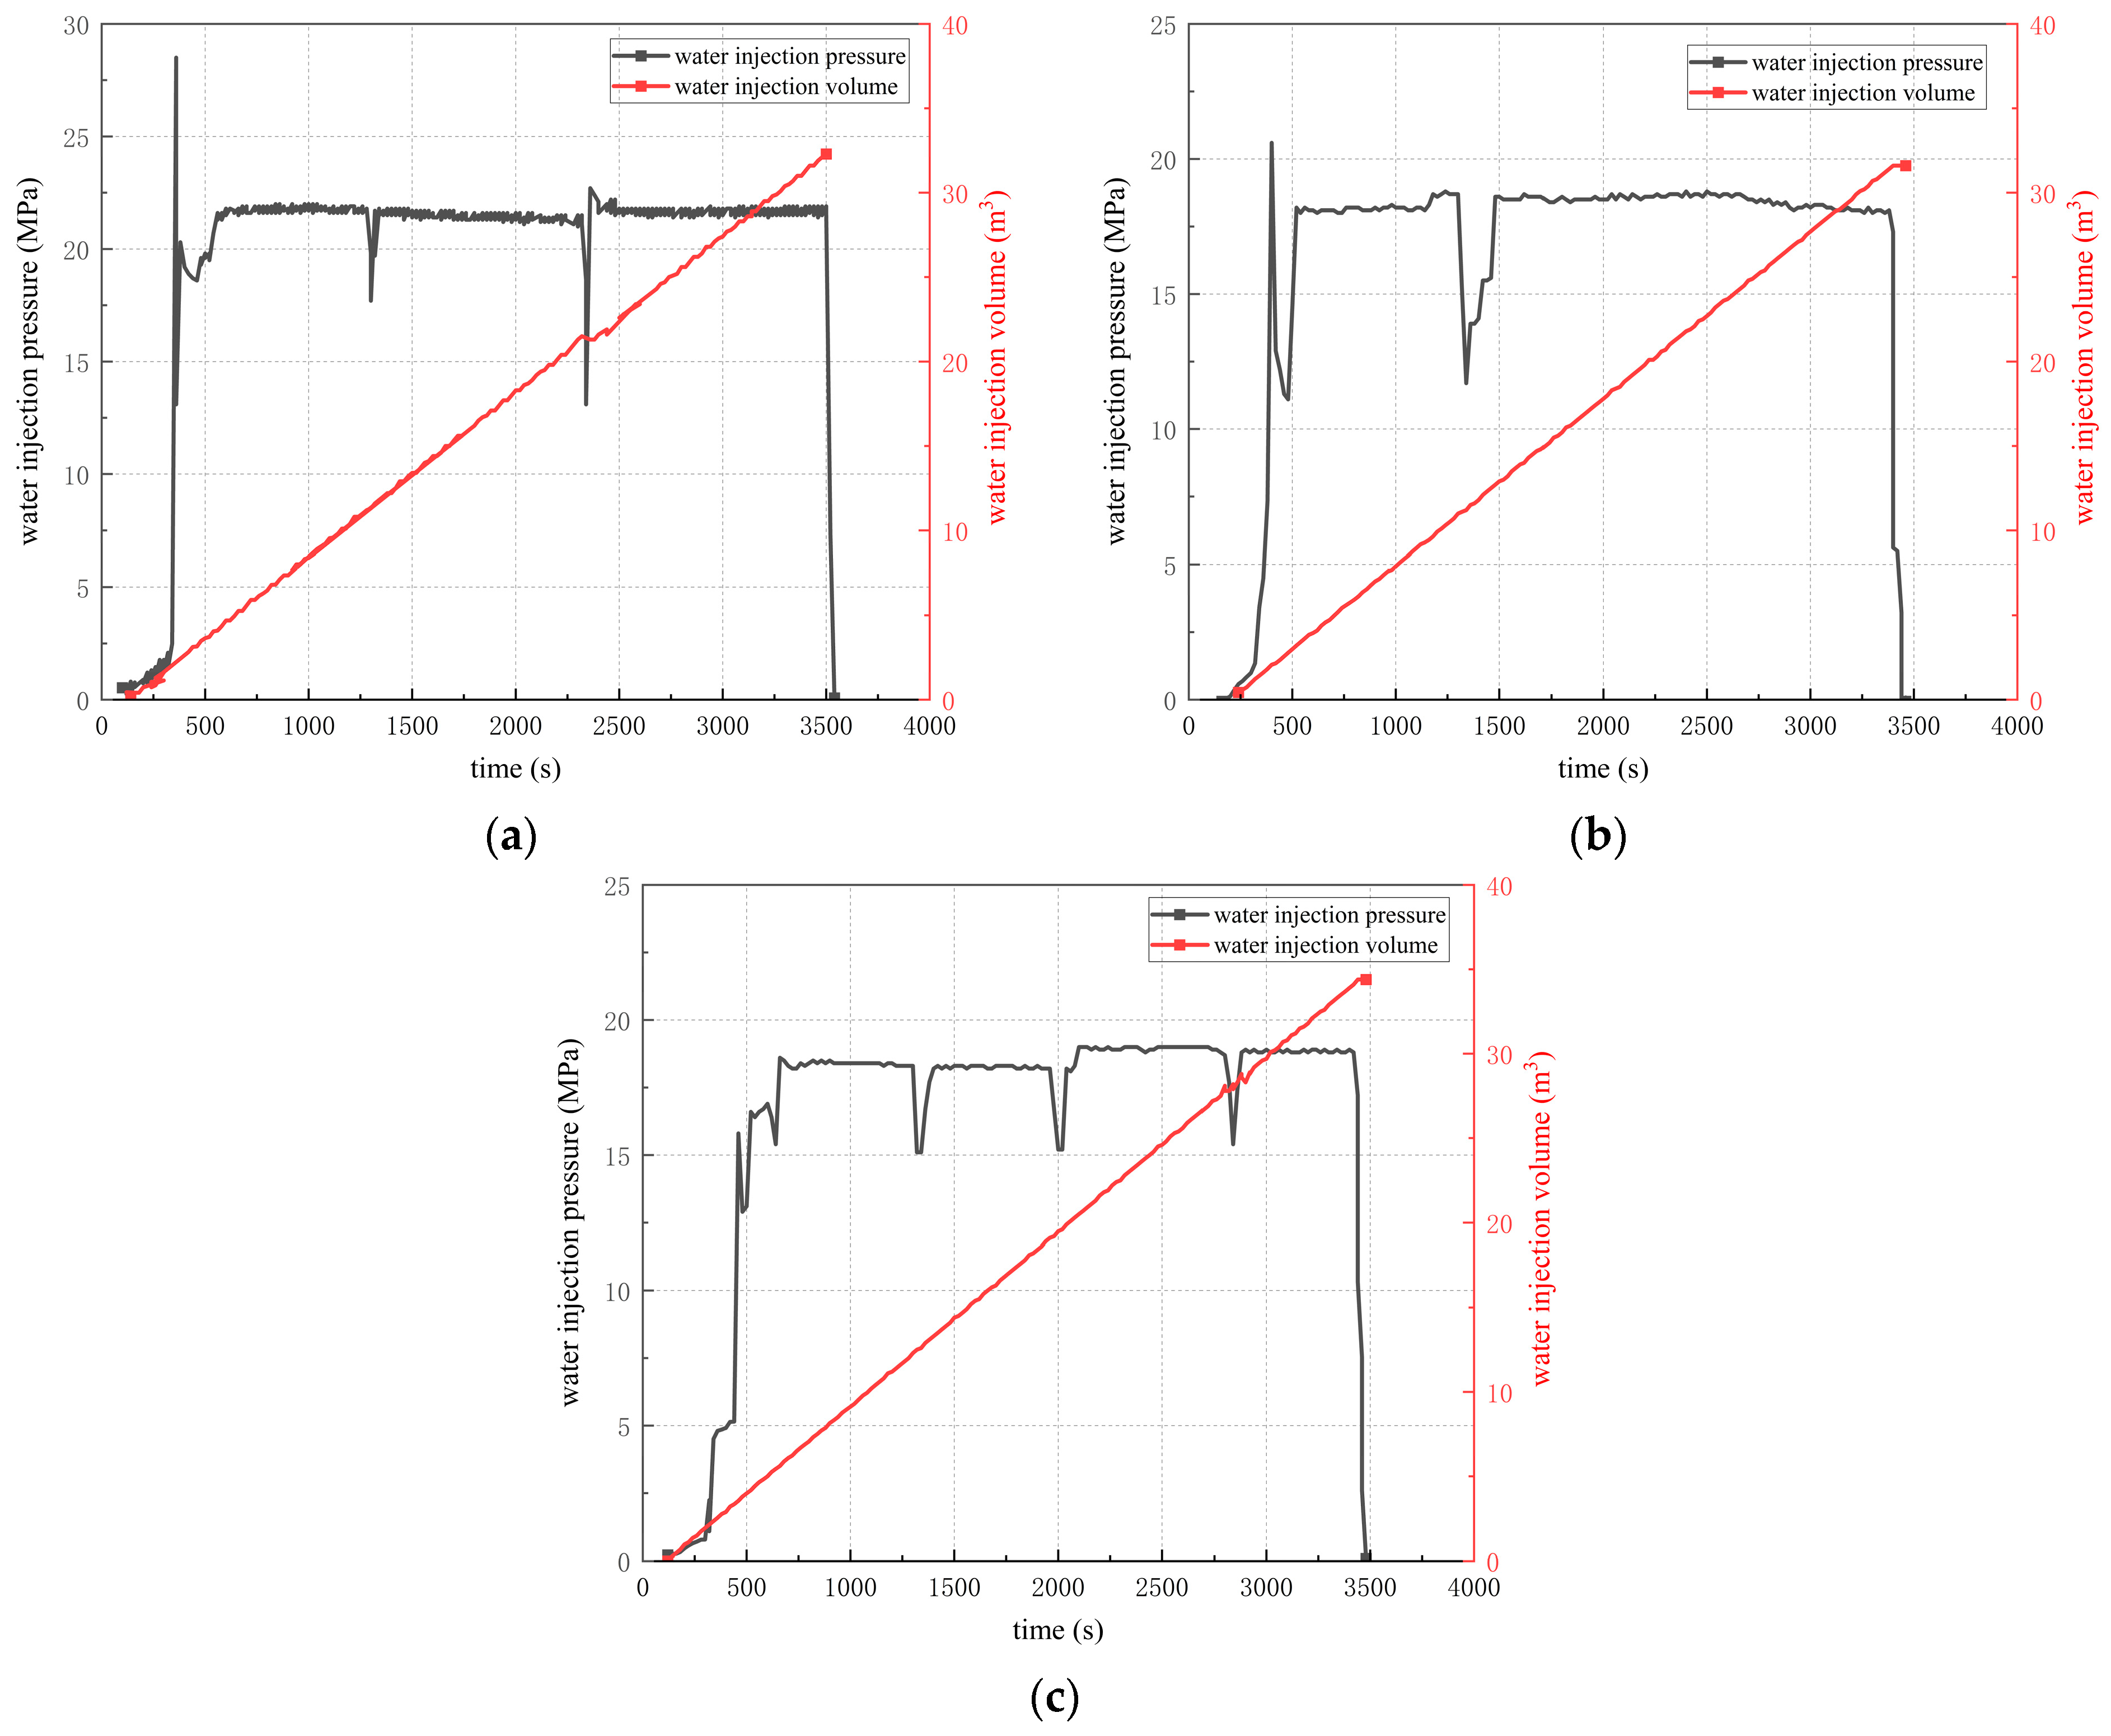
5.1. Fracturing Design and Construction Process

A test was conducted at a coal mine in the Shendong mining area, China, to assess the impact of underground directional long-hole segmented fracturing on weakening hard roof strata. The test involved six directional hydraulic fracturing long holes, spaced 60 m apart, as shown in Figure 14. Transient electromagnetic responses, and microseismic and mine pressure variations in the fractured zone, were monitored to evaluate the roof-weakening effect and improvements in mine pressure.
The process of segmented hydraulic fracturing for coal seam roofs are as follows: The water injection pump is first activated to slowly expand the packer. The pressure gradually increases with the injection volume. Once the packer is fully seated, pumping pressure is continuously increased to fracture the target formation. During segmented hydraulic fracturing, remote computers are used to automatically monitor and record fracturing data. This enables the real-time measurement of water injection pressure at each segment. The water injection pressure–time curves of single segments during fracturing are shown in Figure 15. Pressure curves show multiple sharp drops, signaling fracture initiation and propagation.
In the fracturing of segment 6 of hole No. 1 at drilling site No. 1 (Figure 15a), the initial pump pressure spiked to 25 MPa before sharply dropping to 14.9 MPa. With continued injection, the pressure quickly rebounded to 17 MPa, stabilized, then dropped again to 14.3 MPa. After a high-rate injection, pressure rapidly recovered to 17 MPa, held steady, then dropped to 10 MPa before rising back above 17 MPa until fracturing concluded. In the fracturing of segment 8 of hole No. 2 at drilling site No. 2 (Figure 15b), the pressure initially surged to 15 MPa, then increased in a saw tooth pattern to 18 MPa. After stabilization, it dropped abruptly to 15.1 MPa. With continued injection, the pressure rapid recovery to 18 MPa, followed by another drop to 15.2 MPa. Then the pressure rebounded to 19 MPa, held for 10 min, and dropped again before recovering above 18 MPa until the target volume of water was injected. During the fracturing of segment 6 of hole No. 2 at drilling site No. 2 (Figure 15c), two significant pressure drops were recorded. The initial pressure spiked to 20.6 MPa before sharply dropping to 10.9 MPa. The pressure then rebounded and stabilized at 18 MPa before falling again to 11.7 MPa. Subsequently, the pressure fluctuated upward to 19 MPa and remained stable until the process was complete.

5.2. Fracturing Effect Validation

Microseismic monitoring was conducted in the hydraulic fracturing process. Fifteen geophones installed in adjacent tunnels recorded microseismic events during fracturing, enabling the mapping of fracture geometry and spatial distribution, as shown in Figure 16. The YTZ3 high-precision microseismic monitoring system was adopted, which can monitor microseismic events with energy greater than 100 J and a frequency range of 1~1000 Hz. The sampling frequency is 1 KHz. Figure 16a shows that microseismic events were concentrated near the fracturing borehole, with scattered activity in other areas. The events followed the fracturing segments but exhibited localized clustering, likely influenced by weaker strata or segment spacing. Figure 16b reveals that fractures mainly extended along the minimum principal stress direction but deviated partially, likely due to “stress shadow” effects causing uneven propagation. Fracture radii were about 35 m, consistent with numerical simulations.
Due to potential errors in microseismic monitoring, transient electromagnetic detection was also performed to validate the hydraulic fracturing range. The YCSZ drilling transient electromagnetic instrument was used, which can be pushed to a depth of 300 m with the help of a drill pipe. During detection, a transmitting coil and probe were inserted into the borehole to conduct point-by-point three-component measurements. The vertical component (Z) of the secondary field identified low-resistivity anomalies around the borehole, while horizontal components (X, Y) determined their spatial orientation. This created a cylindrical detection zone centered on the borehole. As shown in Figure 17, post-fracturing resistivity decreased significantly. Comparing post-fracturing data with pre-fracturing background values revealed a clear resistivity anomaly distribution (Figure 17b). In some segments, resistivity decreased by up to 60 Ωm, with block-like patterns suggesting fracture connectivity. Segments 10–12 showed contiguous low-resistivity zones, suggesting weaker strata or overlapping fractures due to spacing variations.
Additionally, mine pressure was analyzed. Figure 18 presents supporting resistance and stress in a coal seam of the fractured and non-fractured zones. The red dashed box represents the fractured zone. The supporting resistance in the fractured zone ranged from 326 to 417 bar, with an average of 376.4 bar. In contrast, the supporting resistance in the non-fractured zone ranged from 463 to 544 bar, averaging 502.7 bar. The supporting resistance in the fractured zone decreased by 25.10% compared to the non-fractured zone, confirming significant pressure relief. The coal seam stress also decreased, as shown in Figure 19. The average stress in the non-fractured zone was 6.5 MPa, whereas in the fractured zone it was reduced to 5.5 MPa. A decrease in peak stress indicates a reduction in stress concentration. The fractured zone shows smoother stress change curves, indicating more uniform and periodic rock failure. This is beneficial for mining planning and management.

6. Conclusions

This study employed numerical simulations to analyze fracture propagation under varying pumping rates, compressive strengths, in situ stress differences, and segment length conditions. The impact of these parameters on the extent of fracture expansion was examined. Additionally, field experiments were conducted on segmented hydraulic fracturing in underground coal mine directional boreholes. Transient electromagnetic and microseismic techniques were used to assess the fracture extent. Monitoring data, including resistivity differences, microseismic events, and mine pressure changes of fractured and unfractured zones, were collected. Based on the monitoring results, the spatiotemporal characteristics of fracture propagation were analyzed. Finally, the effectiveness of segmented hydraulic fracturing in weakening hard coal seam roofs and improving mine pressure distribution was evaluated. The key findings are as follows:
(1)
During the process of increasing the segment spacing from 12 m to 40 m, the fracture length decreased by 12%, limiting the overall fracture propagation. However, excessively small segment length can cause fractures to be influenced by the induced stress of adjacent clusters, leading to asymmetric propagation. Therefore, segment length should be optimized based on the specific objectives of the fracturing operation. Considering economic factors and fracture length, this study recommends a segment spacing of 30 m for the field application.
(2)
During the progressive increase of pumping rate from 5 to 40 m3/h, a 98% extension in fracture length was observed. However, underground space constraints impose limitations on equipment capacity, including flow rate and pump pressure. Thus, fracturing designs should be tailored to the characteristics of the working face, segment length, and flow parameters. Based on the results of numerical simulations, a pumping rate of 40 m3/h is recommended for the field application.
(3)
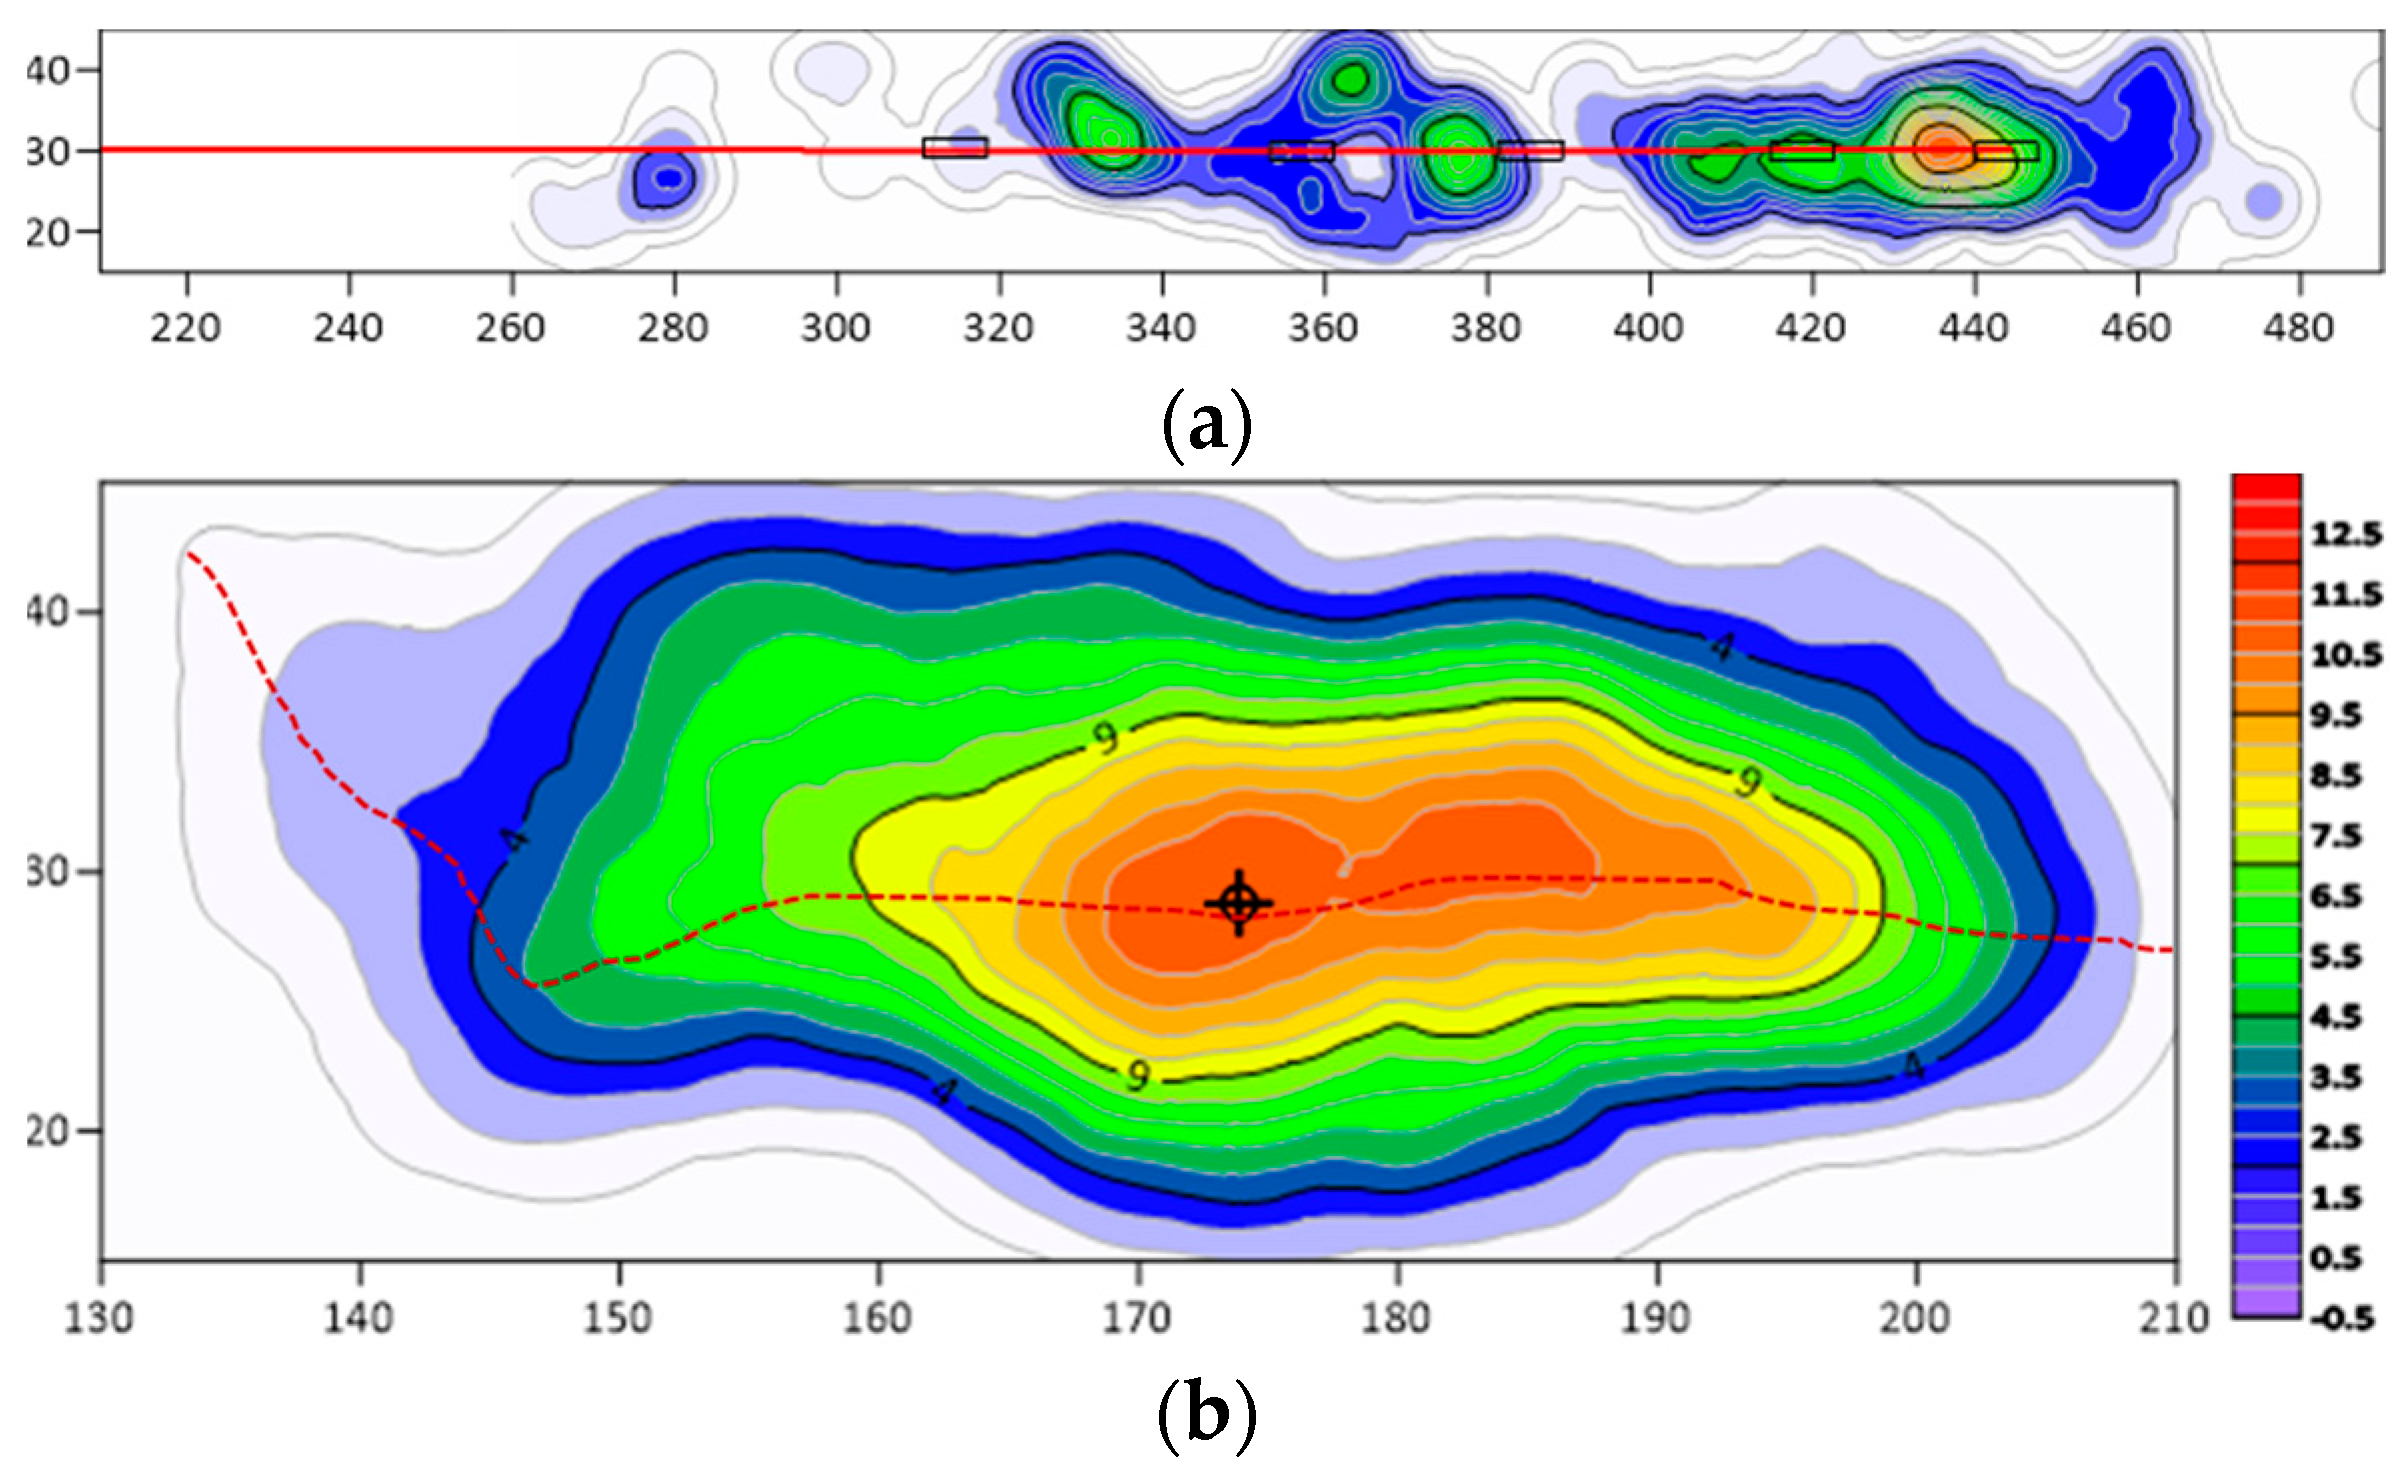
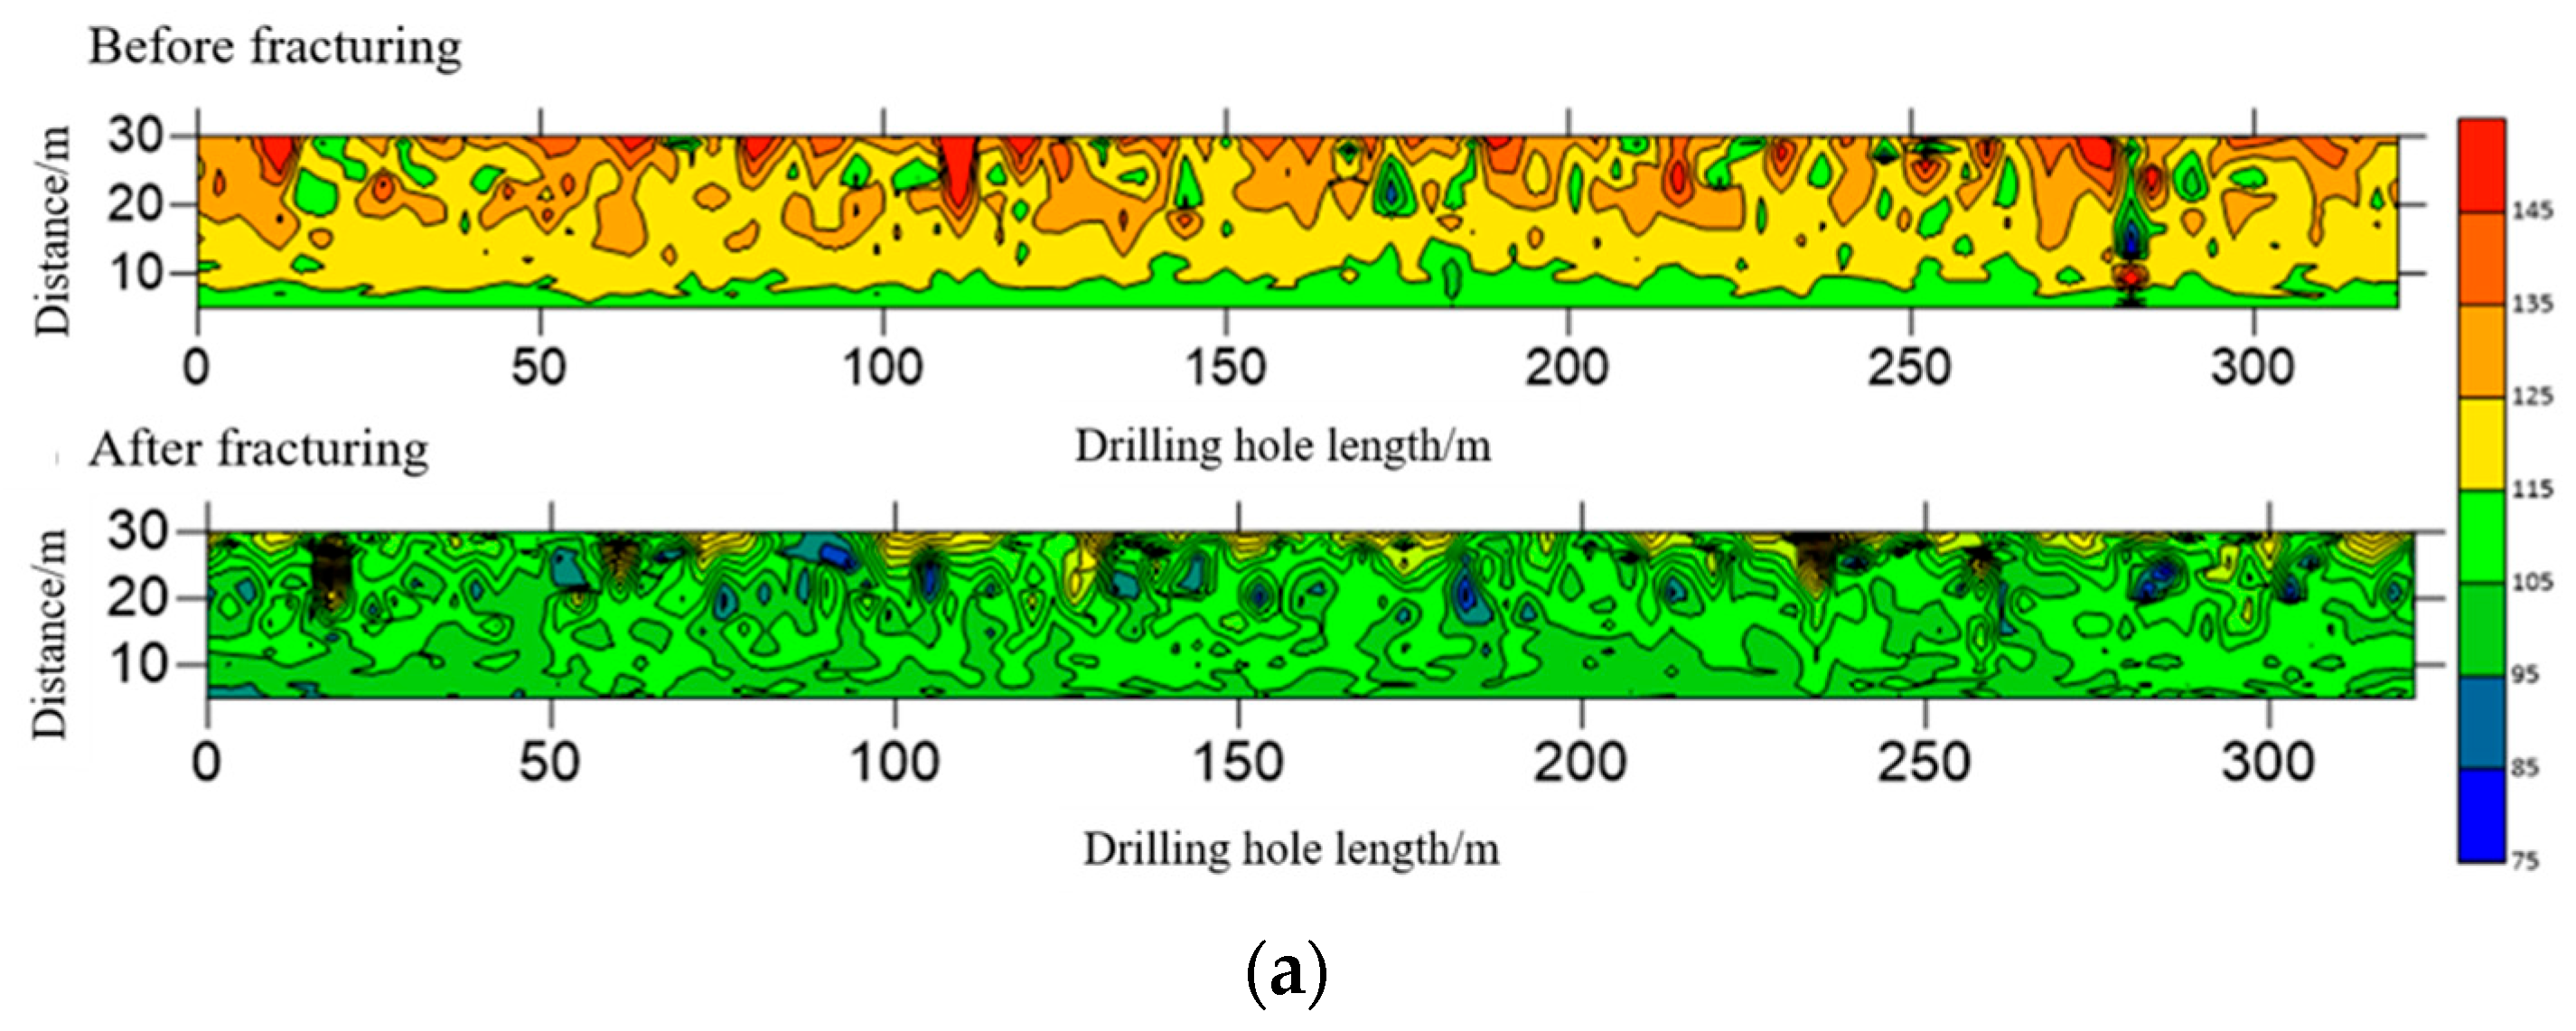
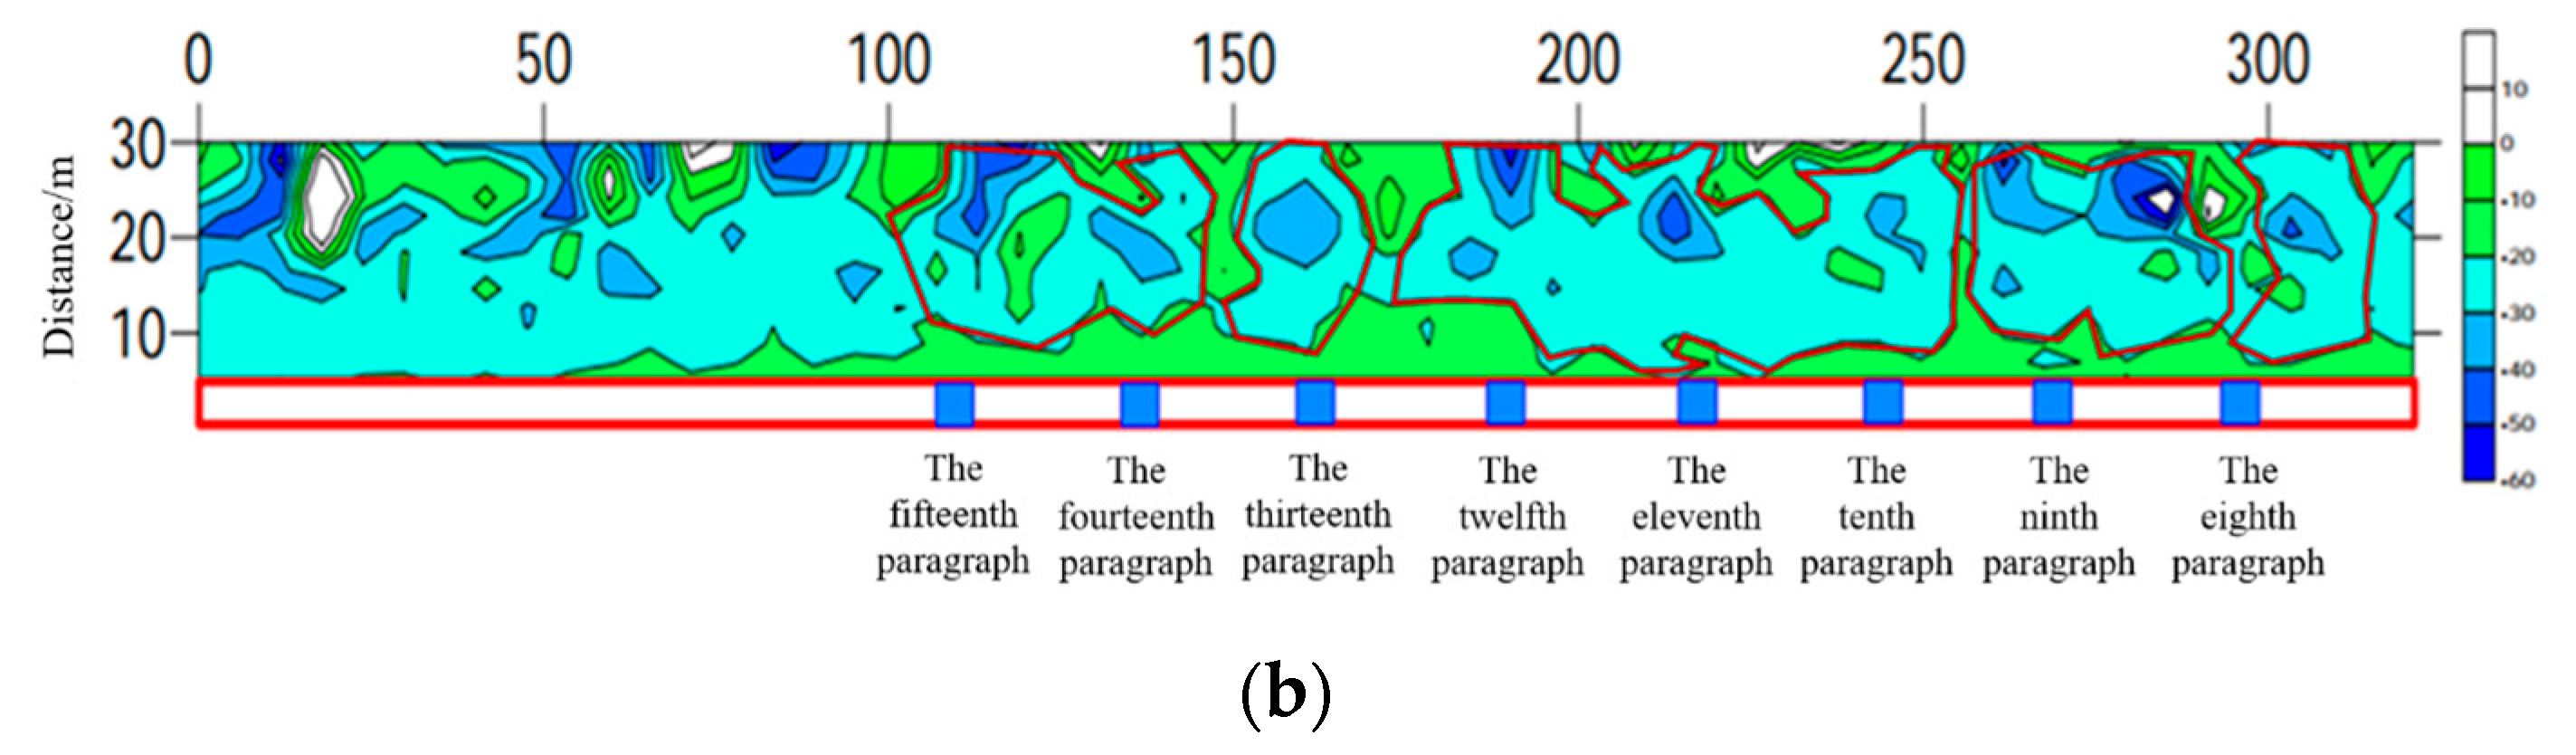
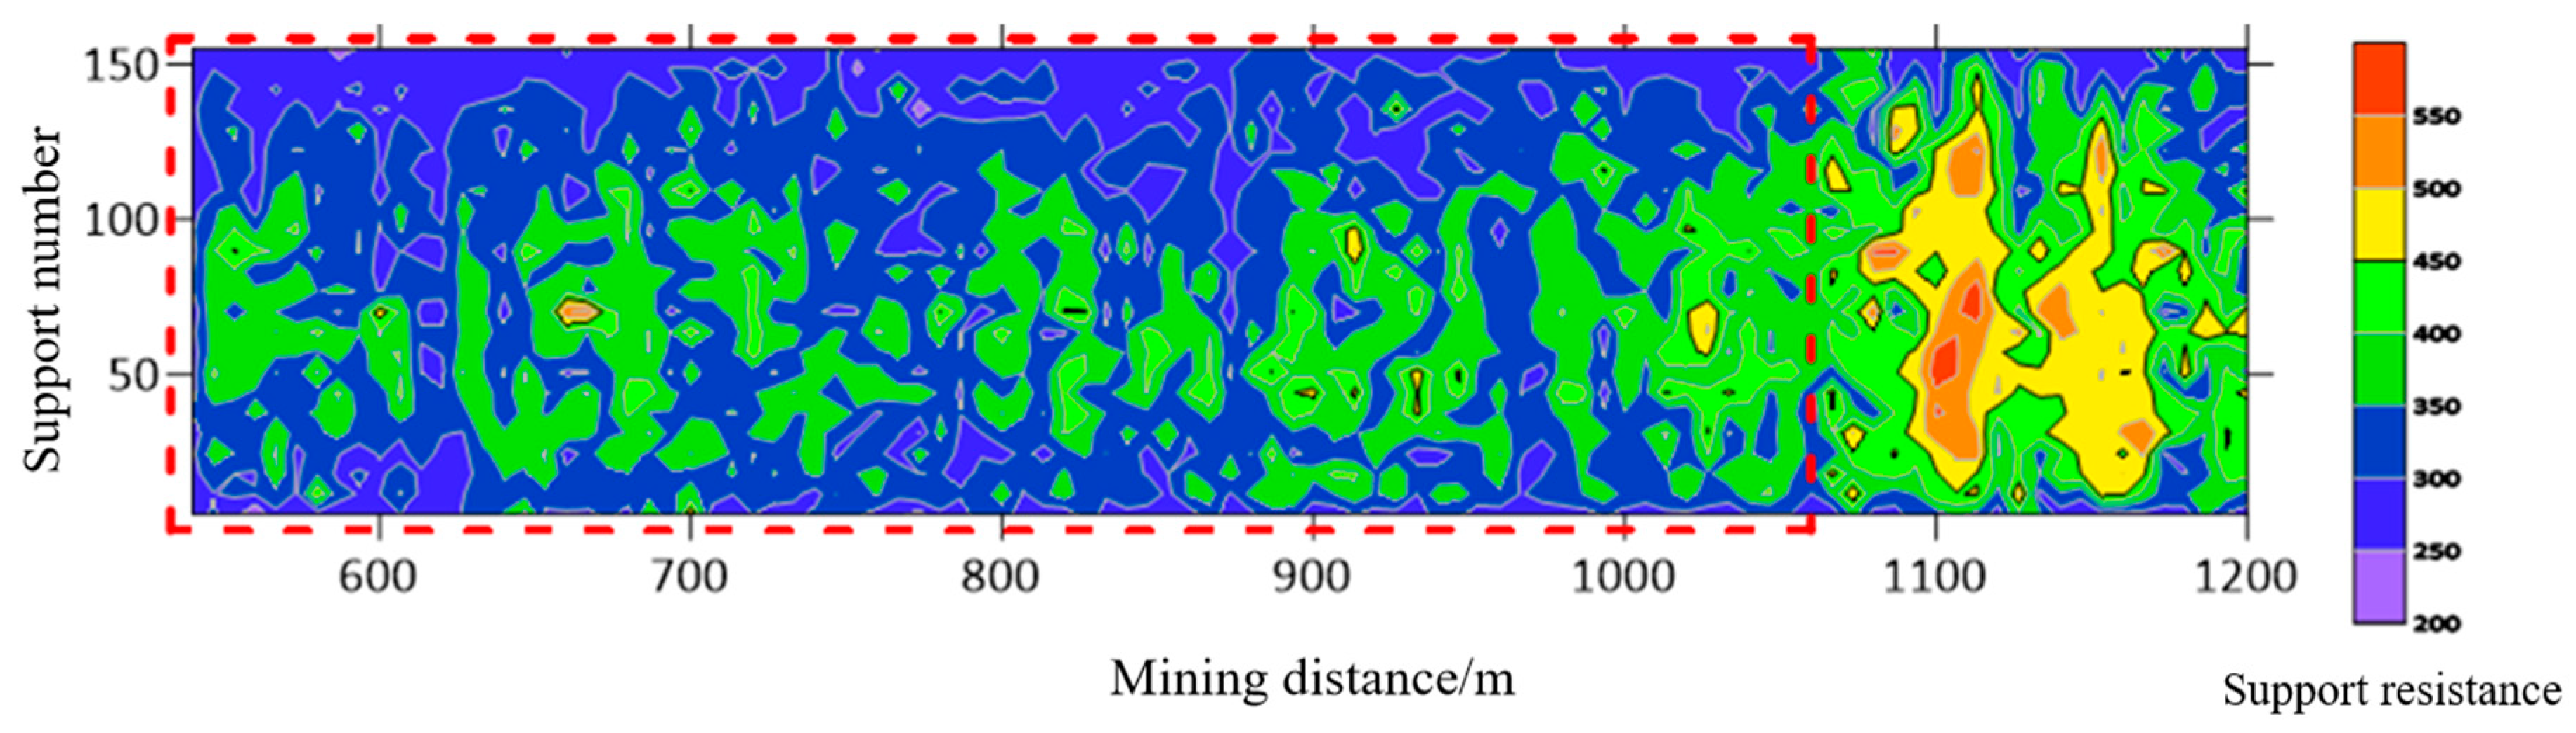
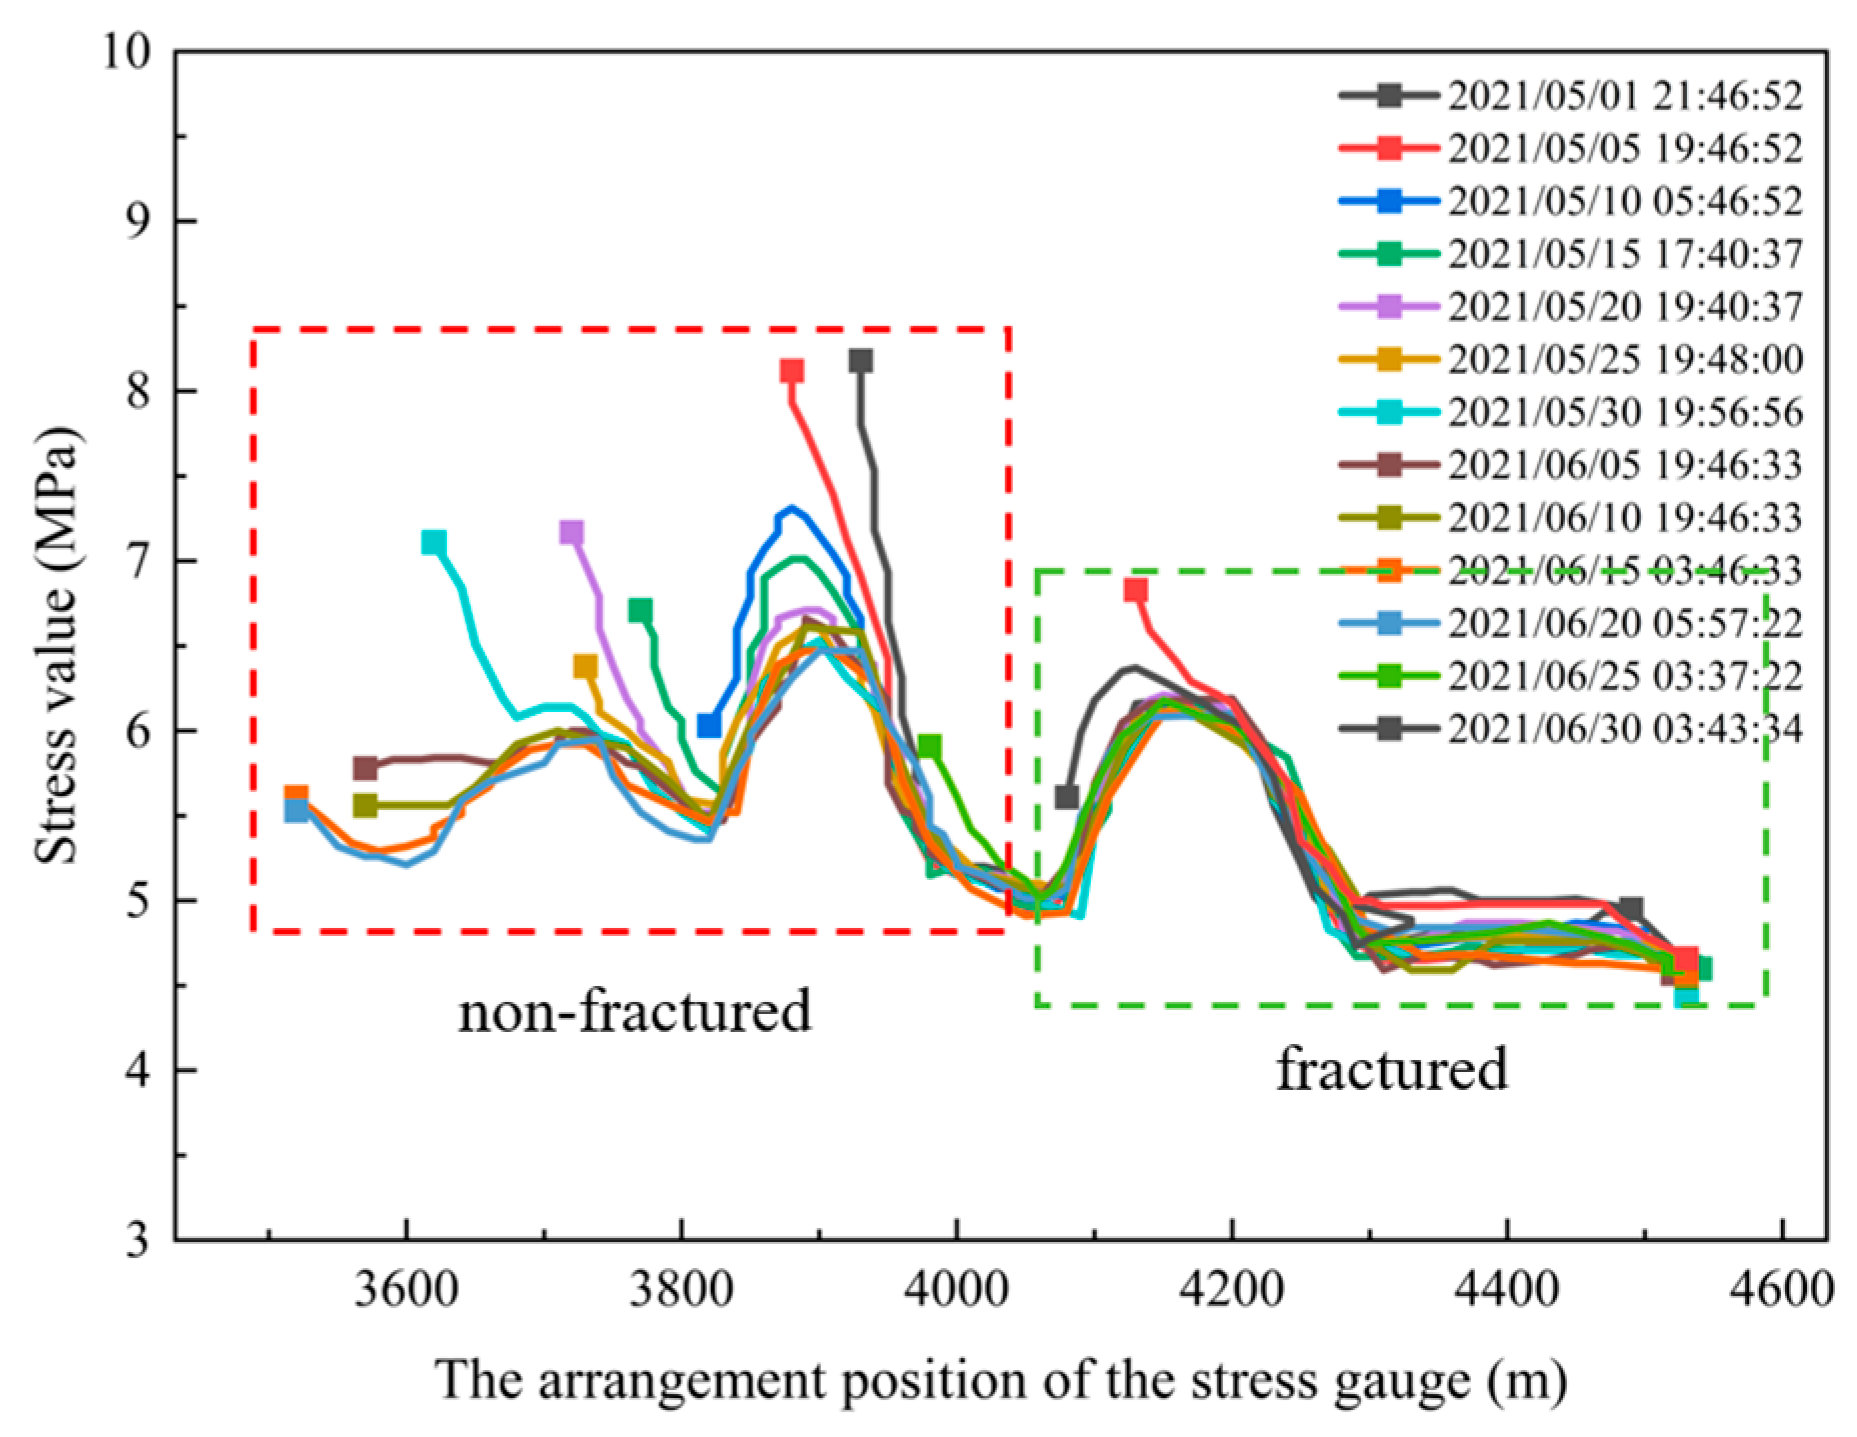
Segmented hydraulic fracturing in underground directional boreholes exhibits significant responses in resistivity, microseismic activity, and mine pressure variations. The experimental results indicate that this technique effectively weakens hard coal seam roofs and improves mine pressure distribution, facilitating coal mine production planning and management.
(4)
The numerical simulation framework developed in this study is flexible and adaptable. By adjusting key geological parameters, it can be extended to assess hydraulic fracturing performance under varying geological conditions.

Author Contributions

Conceptualization, M.Y.; methodology, X.W.; software, Y.M.; validation, Y.M.; formal analysis, M.Y.; investigation, M.Y.; resources, S.L.; data curation, X.W.; writing—original draft preparation, Y.M. and M.Y.; writing—review and editing, S.W. and J.H.; visualization, M.Y.; supervision, S.L.; project administration, J.H. and S.L.; funding acquisition, M.Y. All authors have read and agreed to the published version of the manuscript.

Funding

This work was financially supported by the National Natural Science Foundation of China (No. 52104118), and Project No. 2024CDJXY025 supported by the Fundamental Research Funds for the Central Universities.

Institutional Review Board Statement

Not applicable.

Informed Consent Statement

Not applicable.

Data Availability Statement

The original contributions presented in this study are included in the article. Further inquiries can be directed to the corresponding authors.

Conflicts of Interest

Author Maolin Yang was employed by the company Geotechnical Survey Company, CHN Energy Shendong Coal Group. The remaining authors declare that the research was conducted in the absence of any commercial or financial relationships that could be construed as a potential conflict of interest.

References

  1. Zhang, J.; Li, B.; Zhou, N.; Zhang, Q. Application of solid backfilling to reduce hard-roof caving and longwall coal face burst potential. Int. J. Rock Mech. Min. Sci. 2016, 88, 197–205. [Google Scholar] [CrossRef]
  2. He, H.; Dou, L.; Fan, J.; Du, T.; Sun, X. Deep-hole directional fracturing of thick hard roof for rockburst prevention. Tunn. Undergr. Space Technol. 2012, 32, 34–43. [Google Scholar] [CrossRef]
  3. Yu, B.; Gao, R.; Kuang, T.; Huo, B.; Meng, X. Engineering study on fracturing high-level hard rock strata by ground hydraulic action. Tunn. Undergr. Space Technol. 2019, 86, 156–164. [Google Scholar] [CrossRef]
  4. Sun, T.; Li, Z.; He, Q.; Ma, D.; Liu, B.; Gao, X. Research on Hydraulic Fracturing Technology for Roof Stratigraphic Horizon in Coal Pillar Gob-Side Roadway. Appl. Sci. 2025, 15, 4759. [Google Scholar] [CrossRef]
  5. Ju, J.; Qi, C.; Li, Z. Effect of Thick–Hard Main Roof Fracturing on the Spatiotemporal Evolution of Overburden Fractures. Appl. Sci. 2024, 14, 10308. [Google Scholar] [CrossRef]
  6. Lu, J.; Jiang, C.; Jin, Z.; Wang, W.; Zhuang, W.; Yu, H. Three-dimensional physical model experiment of mining-induced deformation and failure characteristics of roof and floor in deep underground coal seams. Process Saf. Environ. Prot. 2021, 150, 400–415. [Google Scholar] [CrossRef]
  7. Zhu, X.; Zhai, C.; Yu, X.; Sun, Y.; Cong, Y.; Zheng, Y.; Tang, W.; Chen, A. Fracture damage characteristics of hard roof with different bedding angles induced by modified soundless cracking agents. Eng. Fract. Mech. 2023, 289, 109387. [Google Scholar] [CrossRef]
  8. Yang, L.; Wang, X.; Niu, T. Propagation Characteristics of Multi-Cluster Hydraulic Fracturing in Shale Reservoirs with Natural Fractures. Appl. Sci. 2025, 15, 4418. [Google Scholar] [CrossRef]
  9. Liu, D.; Deng, J.; Yang, T.; Zhang, J.; Lin, H.; Liu, H.; Sun, J.; Zhang, Y. Research on Disaster Prevention and Control Technology for Directional Hydraulic Fracturing and Roof Plate Unloading. Appl. Sci. 2024, 14, 8733. [Google Scholar] [CrossRef]
  10. Lu, C.; Liu, Y.; Liu, G.; Zhao, T. Stress evolution caused by hard roof fracturing and associated multi-parameter precursors. Tunn. Undergr. Space Technol. 2019, 84, 295–305. [Google Scholar] [CrossRef]
  11. Cao, M.; Yang, S.; Du, S.; Li, Y.; Wang, S. Study on fault-slip process and seismic mechanism under dynamic loading of hard roof fracture disturbance. Eng. Fail. Anal. 2024, 163, 108598. [Google Scholar] [CrossRef]
  12. Dai, H.; Yin, T.; Wu, Y.; Chen, Y.; Ma, J.; Li, X. A study of geothermal hydraulic fracture surface morphology and heat transfer characteristics. Energy 2024, 312, 133527. [Google Scholar] [CrossRef]
  13. He, Q.; Suorineni, F.T.; Ma, T.; Oh, J. Effect of discontinuity stress shadows on hydraulic fracture re-orientation. Int. J. Rock Mech. Min. Sci. 2017, 91, 179–194. [Google Scholar] [CrossRef]
  14. Liu, C.; Hu, Y.; Zhang, P.; Deng, E.; Huang, Y.; Nie, Z.; Zhang, X. Experimental study on directional fracturing by slotted hydraulic blasting in underground drilling. Nat. Gas Ind. B 2024, 11, 454–467. [Google Scholar] [CrossRef]
  15. Bai, Q.; Tu, S.; Wang, F.; Zhang, C. Field and numerical investigations of gateroad system failure induced by hard roofs in a longwall top coal caving face. Int. J. Coal Geol. 2017, 173, 176–199. [Google Scholar] [CrossRef]
  16. Deng, J.; Song, H. Formulizing relationships between producing area of fracture-controlled unit and productivity of segmented multi-cluster fractured well by delineating water saturation limit. Geoenerg. Sci. Eng. 2025, 244, 213448. [Google Scholar] [CrossRef]
  17. Zhou, J.; Wu, G.; Geng, Y.; Guo, Y.; Chang, X.; Peng, C.; Ai, C. Laboratory study of the factors affecting hydraulic fracturing effect for inter-salt oil shale layers, Qianjiang Depression, China. Petrol. Sci. 2023, 20, 1690–1706. [Google Scholar] [CrossRef]
  18. Zhuang, J.; Mu, Z.; Cai, W.; He, H.; Hosking, L.J. Multistage hydraulic fracturing of a horizontal well for hard roof related coal burst control: Insights from numerical modelling to field application. Int. J. Min. Sci. Technol. 2024, 34, 1095–1114. [Google Scholar] [CrossRef]
  19. Xia, B.; Zhou, Y.; Zhang, X.; Zhou, L.; Ma, Z. Physical and numerical investigations of target stratum selection for ground hydraulic fracturing of multiple hard roofs. Int. J. Min. Sci. Technol. 2024, 34, 699–712. [Google Scholar] [CrossRef]
  20. Shi, Z.; Li, B.; Li, L.; Wang, N.; Zhang, J. Study on the directional extension law of hydraulic fractures induced by pre-cast slot under tru-triaxial. Theor. Appl. Fract. Mech. 2024, 133, 104546. [Google Scholar] [CrossRef]
  21. Liu, J.; Liu, C.; Yao, Q.; Si, G. The position of hydraulic fracturing to initiate vertical fractures in hard hanging roof for stress relief. Int. J. Rock Mech. Min. Sci. 2020, 132, 104328. [Google Scholar] [CrossRef]
  22. Huang, B.; Liu, J.; Zhang, Q. The reasonable breaking location of overhanging hard roof for directional hydraulic fracturing to control strong strata behaviors of gob-side entry. Int. J. Rock Mech. Min. Sci. 2018, 103, 1–11. [Google Scholar] [CrossRef]
  23. Boone, T.J.; Ingraffea, A.R. A numerical procedure for simulation of hydraulically-driven fracture propagation in poroelastic media. Int. J. Numer. Anal. Meth. Geomech. 1990, 14, 27–47. [Google Scholar] [CrossRef]
  24. Hunsweck, M.J.; Shen, Y.; Lew, A.J. A finite element approach to the simulation of hydraulic fractures with lag. Int. J. Numer. Anal. Meth. Geomech. 2013, 37, 993–1015. [Google Scholar] [CrossRef]
  25. Bao, J.Q.; Fathi, E.; Ameri, S. A coupled finite element method for the numerical simulation of hydraulic fracturing with a condensation technique. Eng. Fract. Mech. 2014, 131, 269–281. [Google Scholar] [CrossRef]
  26. Bao, J.Q.; Fathi, E.; Ameri, S. Uniform investigation of hydraulic fracturing propagation regimes in the plane strain model. Int. J. Numer. Anal. Meth. Geomech. 2015, 39, 507–523. [Google Scholar] [CrossRef]
  27. Shi, F.; Wang, X.; Liu, C.; Wu, H. An XFEM-based method with reduction technique for modeling hydraulic fracture propagation in formations containing frictional natural fractures. Eng. Fract. Mech. 2017, 173, 64–90. [Google Scholar] [CrossRef]
  28. Belytschko, T.; Black, T. Elastic crack growth in finite elements with minimal remeshing. Int. J. Numer. Meth. Eng. 1999, 45, 601–620. [Google Scholar] [CrossRef]
  29. Gordeliy, E.; Peirce, A. Coupling schemes for modeling hydraulic fracture propagation using the XFEM. Comput. Meth. Appl. Mech. Eng. 2013, 253, 305–322. [Google Scholar] [CrossRef]
  30. Wang, H.Y. Numerical modeling of non-planar hydraulic fracture propagation in brittle and ductile rocks using XFEM with cohesive zone method. J. Petrol. Sci. Eng. 2015, 135, 127–140. [Google Scholar] [CrossRef]
  31. Feng, Y.; Gray, K.E. Modeling of curving hydraulic fracture propagation from a wellbore in a poroelastic medium. J. Nat. Gas Sci. Eng. 2018, 53, 83–93. [Google Scholar] [CrossRef]
  32. Shi, F.; Liu, J. A fully coupled hydromechanical XFEM model for the simulation of 3D non-planar fluid-driven fracture propagation. Comput. Geotech. 2021, 132, 103971. [Google Scholar] [CrossRef]
  33. Crouch, S.L. Solution of plane elasticity problems by the displacement discontinuity method. I. Infinite body solution. Int. J. Numer. Meth. Eng. 1976, 10, 301–343. [Google Scholar] [CrossRef]
  34. Skopintsev, A.M.; Dontsov, E.V.; Kovtunenko, P.V.; Baykin, A.N.; Golovin, S.V. The coupling of an enhanced pseudo-3D model for hydraulic fracturing with a proppant transport model. Eng. Fract. Mech. 2020, 236, 107177. [Google Scholar] [CrossRef]
  35. Dontsov, E.V.; Peirce, A.P. An enhanced pseudo-3D model for hydraulic fracturing accounting for viscous height growth, non-local elasticity, and lateral toughness. Eng. Fract. Mech. 2015, 142, 116–139. [Google Scholar] [CrossRef]
  36. Dontsov, E.V.; Peirce, A.P. Comparison of toughness propagation criteria for blade-like and pseudo-3D hydraulic fractures. Eng. Fract. Mech. 2016, 160, 238–247. [Google Scholar] [CrossRef]
  37. Geertsma, J.; De Klerk, F. A rapid method of predicting width and extent of hydraulically induced fractures. J. Petrol. Technol. 1969, 21, 1571–1581. [Google Scholar] [CrossRef]
  38. Khalil, A.; Khan, Z.; Attom, M.; Khalafalla, O. Evaluation of Ground Improvement with Dynamic Replacement and Rapid Impact Compaction of an Artificial Island in the UAE—A Case Study. Geo-Congress 2024, 351, 116–125. [Google Scholar] [CrossRef]
  39. Zheng, K.; Wang, L.; Li, B.; Li, Y.; Yang, H.; Yang, S.; Dai, N.; Wang, H.; Wang, Z.; Xi, J. Dynamic disaster evolution mechanism of high mine pressure at hard roof and advance area prevention and control technology. Coal Geol. Explor. 2022, 50, 62–71. [Google Scholar] [CrossRef]
  40. Zheng, K.; Wang, L.; Wang, Y. Study on advanced regional control technology for strong mine pressure dynamic disaster in hard roof. China Coal 2024, 50, 36–45. [Google Scholar] [CrossRef]
Figure 1. The constitutive law of rock under uniaxial stress condition.
Applsci 15 06521 g001
Figure 2. The geometric model.
Applsci 15 06521 g002
Figure 3. Comparison between the results of the numerical model and the KGD model.
Applsci 15 06521 g003
Figure 4. Fracture propagation characteristics under different pumping rate conditions. The colours indicate the degree of damage. The higher the value, the higher the degree of damage. (a) 5 m3/h; (b) 10 m3/h; (c) 40 m3/h; (d) 60 m3/h; (e) 80 m3/h.
Applsci 15 06521 g004
Figure 5. The distribution of Misses stress under different pumping rate conditions. (a) 5 m3/h; (b) 10 m3/h; (c) 40 m3/h; (d) 60 m3/h; (e) 80 m3/h.
Applsci 15 06521 g005
Figure 6. The fracture propagation lengths under different pumping rate conditions.
Applsci 15 06521 g006
Figure 7. Fracture propagation characteristics under different compressive strength conditions. (a) 30 MPa; (b) 40 MPa; (c) 50 MPa.
Applsci 15 06521 g007
Figure 8. The fracture propagation lengths under different compressive strengths.
Applsci 15 06521 g008
Figure 9. Fracture propagation characteristics under different in situ stress difference conditions. (a) 1 MPa; (b) 2.5 MPa; (c) 3 MPa; (d) 5 MPa.
Applsci 15 06521 g009
Figure 10. The fracture propagation lengths under different in situ stress difference conditions.
Applsci 15 06521 g010
Figure 11. Fracture propagation characteristics under different segment length conditions. (a) 12 m; (b) 20 m; (c) 30 m; (d) 40 m.
Applsci 15 06521 g011
Figure 12. The distribution of Misses stress with different segment length. (a) 12 m; (b) 20 m; (c) 30 m; (d) 40 m.
Applsci 15 06521 g012
Figure 13. The fracture propagation lengths with different segment lengths.
Applsci 15 06521 g013
Figure 14. Hydraulic fracturing directional long borehole trajectories.
Applsci 15 06521 g014
Figure 15. Typical hydraulic fracturing pump injection pressure curves. (a) Segment 6 of hole No. 1 at No. 1 drilling sit; (b) Segment 8 of hole No. 2 at No. 2 drilling sit; (c) Segment 6 of hole No. 2 at No. 2 drilling sit.
Applsci 15 06521 g015
Figure 16. Location results of microseismic events near the borehole. (a) Along the borehole axial direction; (b) along the cross-section of the borehole.
Applsci 15 06521 g016
Figure 17. Resistivity changes before and after fracturing and abnormal resistivity areas after fracturing. (a) Resistivity changes before and after fracturing; (b) abnormal resistivity areas after fracturing.
Applsci 15 06521 g017aApplsci 15 06521 g017b
Figure 18. The supporting resistance in the fractured (red dashed box) and non-fracturing areas during the mining process [39,40].
Applsci 15 06521 g018
Figure 19. Stress of the fractured and non-fracturing area [39].
Applsci 15 06521 g019
Table 1. Simulation parameters.
Parameter NameSymbolValueUnitParameter NameSymbolValueUnit
Heterogeneity Coefficientm10/Initial Permeabilityk05 × 10−15m2
Compressive Strengthfc040MPaPumping rateq40m3/h
Poisson’s Ratioυ0.2/Injection Pressurep25Mpa
Internal Friction Angleφ40°Fluid Densityρw1 × 103kg/m3
Initial PorosityΦ00.1/Maximum Principal Stressσ111Mpa
Residual Porosityφr0.001/Biot Coefficientα0.5/
Model LengthL140mFluid Viscosityμw1 × 10−3Pa·s
Model WidthH140mPorosity of Matrix Regionnr0.1/
Initial Hydraulic Fracture Lengtha1mMinimum horizontal stressσ26Mpa
Segment lengthd30m
Disclaimer/Publisher’s Note: The statements, opinions and data contained in all publications are solely those of the individual author(s) and contributor(s) and not of MDPI and/or the editor(s). MDPI and/or the editor(s) disclaim responsibility for any injury to people or property resulting from any ideas, methods, instructions or products referred to in the content.

