
Intelligent Recognition of Rock Mass Discontinuities on the Basis of RGB-Enhanced Point Cloud Features


Abstract
1. Introduction
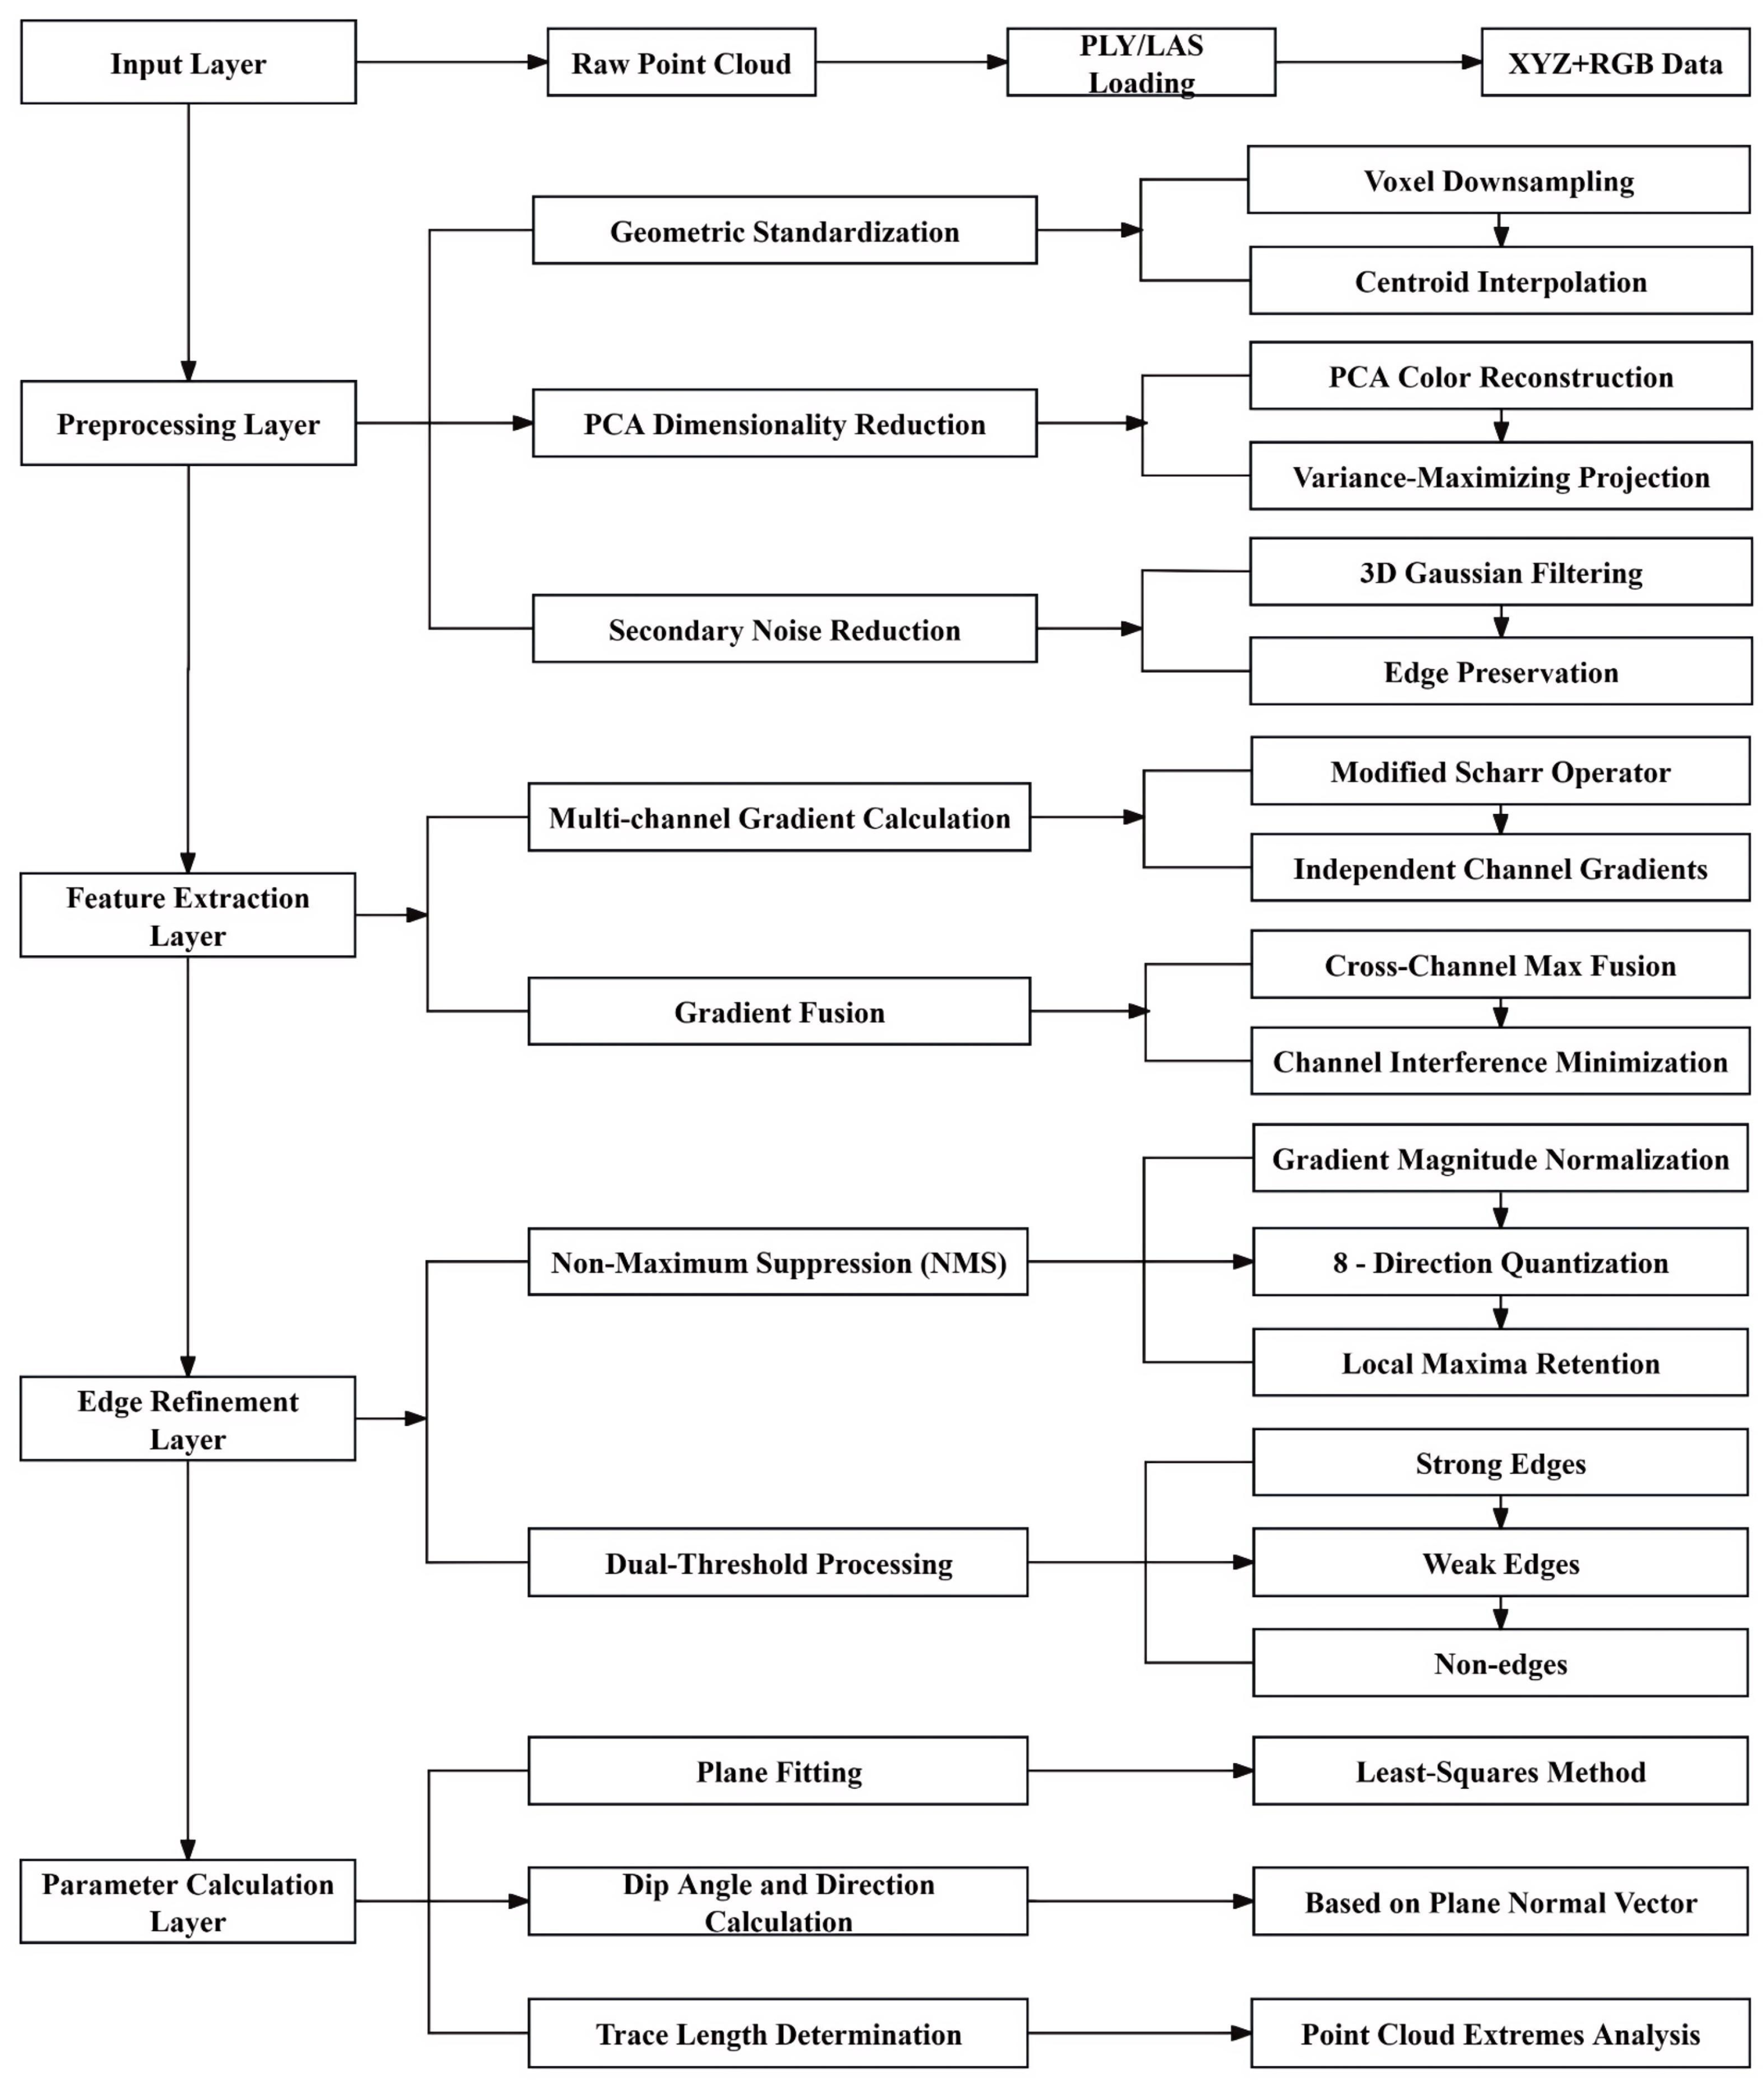
2. Methods
2.1. Geometric Standardization with PCA
2.2. Multi-Channel Gradient Fusion
2.3. Cascaded Edge Detection
2.4. Geometric Parameter Calculation of Discontinuity
3. Data Acquisition
3.1. Overview of the Study Slopes
3.2. Field Work Framework for UAV Operations
4. Results
4.1. The Results of UAV-Based Multi-Angle Nap-of-the-Object Photogrammetry Modeling
4.2. Discontinuity Identification Results
4.3. Statistical Characterization of Discontinuities
5. Conclusions and Discussion
- (1)
- The algorithm proposed in this paper performs well in the identification of rock discontinuities and can effectively identify structural traces in complex environments and to some extent suppress the influence of interference factors such as illumination, vegetation, and color mutation. However, there is still room for improvement in missed detection, false detection, and trace continuity. Future research can further optimize the algorithm to improve its detection accuracy and robustness under complex conditions.
- (2)
- All groups of discontinuities in the study slope exhibit log-normal trace length distributions dominated by short traces, with limited long-trace occurrences. The systematic spatial organization and maturity of the discontinuity network strongly imply tectonic controls, consistent with regional structural frameworks. This statistical framework enhances the efficiency of discontinuity characterization while advancing methods for rock slope hazard assessment.
- (3)
- The occurrence of rock mass discontinuities and their spatial relationship with slope surfaces give rise to two distinct types of discontinuities. One manifests as planar discontinuities approximately parallel to the slope surface, while the other presents as linear structural features formed by intersections with the slope surface, which are commonly referred to as lineation. The technical workflow proposed in this study specifically focuses on lineation that exhibits significant color contrast with slope surfaces. Regarding the identification of planar discontinuities, extensive research has been conducted by numerous scholars, such as Pola et al. [26] and Chen et al. [27]. Both types of discontinuities require consideration in subsequent rock slope hazard assessments. Therefore, the technical framework we propose serves as a supplement to previous research. In practical engineering applications, these two identification methodologies should be employed in combination.
Author Contributions
Funding
Data Availability Statement
Conflicts of Interest
Abbreviations
| PCA | Principal component analysis |
| UAV | Unmanned aerial vehicle |
References
- Liu, Y.C.; Chen, C.S. A new approach for application of rock mass classification on rock slope stability assessment. Eng. Geol. 2007, 89, 129–143. [Google Scholar] [CrossRef]
- Salmi, E.F.; Hosseinzadeh, S. Slope stability assessment using both empirical and numerical methods: A case study. Bull. Eng. Geol. Environ. 2015, 74, 13–25. [Google Scholar] [CrossRef]
- Basahel, H.; Mitri, H. Application of rock mass classification systems to rock slope stability assessment: A case study. J. Rock Mech. Geotech. Eng. 2017, 9, 993–1009. [Google Scholar] [CrossRef]
- Zheng, Y.; Li, J.; Li, J.; Wang, Y. Quantitative risk assessment of road posed by levee slope failure: A novel framework integrating Monte Carlo simulation and material point method. Eng. Geol. 2025, 353, 108148. [Google Scholar] [CrossRef]
- Khanna, R.; Dubey, R.K. Comparative assessment of slope stability along road-cuts through rock slope classification systems in Kullu Himalayas, Himachal Pradesh, India. Bull. Eng. Geol. Environ. 2021, 80, 993–1017. [Google Scholar] [CrossRef]
- Stead, D.; Wolter, A. A critical review of rock slope failure mechanisms: The importance of structural geology. J. Struct. Geol. 2015, 74, 1–23. [Google Scholar] [CrossRef]
- Zheng, Y.; Li, J.; Zhu, T.; Li, J. Experimental and MPM modelling of widened levee failure under the combined effect of heavy rainfall and high riverine water levels. Comput. Geotech. 2025, 184, 107259. [Google Scholar] [CrossRef]
- Sun, L.; Grasselli, G.; Liu, Q.S.; Tang, X.H.; Abdelaziz, A. The role of discontinuities in rock slope stability: Insights from a combined fnite-discrete element simulation. Comput. Geotech. 2022, 147, 104788. [Google Scholar] [CrossRef]
- Ding, Q.R.; Guo, C.Q.; Fan, X.A.; Liu, X.H.; Gong, X.C.; Zhou, W.; Ma, G. Multi-source monitoring data helps revealing and quantifying the excavation-induced deterioration of rock mass. Eng. Geol. 2023, 325, 107281. [Google Scholar] [CrossRef]
- Li, X.J.; Chen, Z.Y.; Chen, J.Q.; Zhu, H.H. Automatic characterization of rock mass discontinuities using 3D point clouds. Eng. Geol. 2019, 259, 105131. [Google Scholar] [CrossRef]
- Chen, J.Q.; Zhang, W.; Lu, C.W.; Zheng, Y.H.; Liu, H.C.; Li, W.K.; Yin, H.; Wang, J.; Wang, Y.D. Evolution and migration patterns of sediments in an earthquake-affected catchment in Wenchuan, Sichuan Province, China. CATENA 2025, 249, 108712. [Google Scholar] [CrossRef]
- Kociuba, W.; Janicki, G.; Rodzik, J.; Stępniewski, K. Comparison of volumetric and remote sensing methods (TLS) for assessing the development of a permanent forested loess gully. Nat. Hazards 2015, 79, 139–158. [Google Scholar] [CrossRef]
- Sun, Q.; Du, L.; Zhang, W.; Chen, J.; Wang, J.; Zhang, H.; Yin, H.; Zhao, Y. Investigation into the evolutionary mechanisms of catastrophic bedding rock landslides in deeply incised canyon regions: A case study of the Zhisi Mountain landslide. Landslides 2025, 1–16. [Google Scholar] [CrossRef]
- Zhuang, D.Y.; Ning, Z.X.; Argilaga, A.; Ma, K.; Tang, C.; Li, J.L.; Xu, W.J.; Zhang, S. Stability analysis of jointed rock mass in large underground caverns based on multi-scale analysis method. Transp. Geotech. 2023, 42, 101109. [Google Scholar] [CrossRef]
- Liu, C.; Liu, X.L.; Peng, X.C.; Wang, E.Z.; Wang, S.J. Application of 3D-DDA integrated with unmanned aerial vehicle–laser scanner (UAV-LS) photogrammetry for stability analysis of a blocky rock mass slope. Landslides 2019, 16, 1645–1661. [Google Scholar] [CrossRef]
- Zhang, W.; Han, J.L.; Lu, C.W.; Liu, H.C.; Chen, J.Q.; Wang, J.; Li, T.Y.; Chen, J.P. Geometric searching of 3D critical slip surface of a non-persistent fracture-dominated rock slope. Comput. Geotech. 2024, 173, 106493. [Google Scholar] [CrossRef]
- Cirillo, D.; Zappa, M.; Tangari, A.C.; Brozzetti, F.; Ietto, F. Rockfall Analysis from UAV-Based Photogrammetry and 3D Models of a Cliff Area. Drones 2024, 8, 31. [Google Scholar] [CrossRef]
- Albarelli, D.S.N.A.; Mavrouli, O.C.; Nyktas, P. Identification of potential rockfall sources using UAV-derived point cloud. Bull. Eng. Geol. Environ. 2021, 80, 6539–6561. [Google Scholar] [CrossRef]
- Lyu, W.; Ke, W.; Sheng, H.; Ma, X.; Zhang, H. Dynamic Downsampling Algorithm for 3D Point Cloud Map Based on Voxel Filtering. Appl. Sci. 2024, 14, 3160. [Google Scholar] [CrossRef]
- Atasever, U.H.; Kesikoglu, M.H.; Ozkan, C. A new artificial intelligence optimization method for pca based unsupervised change detection of remote sensing image data. Neural Netw. World 2016, 26, 141–154. [Google Scholar] [CrossRef]
- Jia, C.C.; Wang, C.J.; Yang, T.; Fan, B.H.; He, F.G. A 3D point cloud filtering algorithm based on surface variation factor classification. Procedia Comput. Sci. 2019, 154, 54–61. [Google Scholar] [CrossRef]
- Tao, Y.; Wang, Z.; Hadigheh, S.A. Enhancing X-ray micro-CT analysis for detecting voids and carbon fibre features in fibre-reinforced cementitious composites using advanced 3D gaussian filtering. Measurement 2025, 249, 117018. [Google Scholar] [CrossRef]
- Jing, J.; Liu, S.; Wang, G.; Zhang, W.; Sun, C. Recent advances on image edge detection: A comprehensive review. Neurocomputing 2022, 503, 259–271. [Google Scholar] [CrossRef]
- Ali, M.; Clausi, D. Using the canny edge detector for feature extraction and enhancement of remote sensing images. In IGARSS 2001. Scanning the Present and Resolving the Future, Proceedings of the IEEE 2001 International Geoscience and Remote Sensing Symposium, Sydney, NSW, Australia, 9–13 July 2001; IEEE: New York, NY, USA, 2001. [Google Scholar] [CrossRef]
- Xu, Z.; Ji, X.; Wang, M.; Sun, X. Edge detection algorithm of medical image based on canny operator. J. Phys. Conf. Ser. 2021, 1955, 012080. [Google Scholar] [CrossRef]
- Pola, A.; Herrera-Díaz, A.; Tinoco-Martínez, S.R.; Macias, J.L.; Soto-Rodríguez, A.N.; Soto-Herrera, A.M.; Sereno, H.; Avellán, D.R. Rock characterization, UAV photogrammetry and use of algorithms of machine learning as tools in mapping discontinuities and characterizing rock masses in Acoculco Caldera Complex. Bull. Eng. Geol. Environ. 2024, 83, 260. [Google Scholar] [CrossRef]
- Chen, N.; Du, C.-J.; Ding, X. Intelligent Interpretation of the Geometric Properties of Rock Mass Discontinuities Based on an Unmanned Aerial Vehicle. Front. Earth Sci. 2021, 9, 711866. [Google Scholar] [CrossRef]


| Edges Characteristic | Threshold | Detailed Description |
|---|---|---|
| Strong edges | M ≥ high threshold | High-confidence edges with significant gradient magnitudes. |
| Weak edges | low threshold ≤ M < high threshold | High-confidence edges with significant gradient magnitudes. |
| Non-edges | M < low threshold | Discarded as irrelevant noise. |
| UAV Platform Parameters | |
| Positioning accuracy | 1.5 cm + 1 ppm (vertical), 1 cm + 1 ppm (horizontal) |
| Maximum speed | 14 m/s |
| Operation temperature Flight duration | 0 °C to 40 °C |
| 30 min | |
| Camera Parameters | |
| Lens | DJI DL 24 mm F2.8 LS ASPH, FOV 84° |
| Image dimensions | 8192 × 5460 with 45 MP effective pixels |
| Sensor size | 35.9 × 24 mm |
Disclaimer/Publisher’s Note: The statements, opinions and data contained in all publications are solely those of the individual author(s) and contributor(s) and not of MDPI and/or the editor(s). MDPI and/or the editor(s) disclaim responsibility for any injury to people or property resulting from any ideas, methods, instructions or products referred to in the content. |
© 2025 by the authors. Licensee MDPI, Basel, Switzerland. This article is an open access article distributed under the terms and conditions of the Creative Commons Attribution (CC BY) license (https://creativecommons.org/licenses/by/4.0/).
Share and Cite
Cui, H.; Chen, J.; Wang, X.; Zhao, Z.; Han, J.; Sun, Q.; Zhang, W. Intelligent Recognition of Rock Mass Discontinuities on the Basis of RGB-Enhanced Point Cloud Features. Appl. Sci. 2025, 15, 6510. https://doi.org/10.3390/app15126510
Cui H, Chen J, Wang X, Zhao Z, Han J, Sun Q, Zhang W. Intelligent Recognition of Rock Mass Discontinuities on the Basis of RGB-Enhanced Point Cloud Features. Applied Sciences. 2025; 15(12):6510. https://doi.org/10.3390/app15126510
Chicago/Turabian StyleCui, Honghai, Junqi Chen, Xinyue Wang, Zihan Zhao, Jiali Han, Qi Sun, and Wen Zhang. 2025. "Intelligent Recognition of Rock Mass Discontinuities on the Basis of RGB-Enhanced Point Cloud Features" Applied Sciences 15, no. 12: 6510. https://doi.org/10.3390/app15126510
APA StyleCui, H., Chen, J., Wang, X., Zhao, Z., Han, J., Sun, Q., & Zhang, W. (2025). Intelligent Recognition of Rock Mass Discontinuities on the Basis of RGB-Enhanced Point Cloud Features. Applied Sciences, 15(12), 6510. https://doi.org/10.3390/app15126510