Spatio-Temporal Characterization of Metal Stocks at a Provincial Scale: The Case of Iron and Steel Industry in Henan Province, China
Abstract
1. Introduction
2. Materials and Methods
2.1. Quantification of the Historical Steel Stocks
2.2. Spatial Autocorrelation Analysis
2.3. Decoupling Analysis Between SIUS and Economic Growth
2.4. Prediction of Future SIUS and Flows
3. Results
3.1. The Temporal Characteristic of SIUS
3.1.1. Total SIUS in 2000–2023
3.1.2. Specific Distribution of SIUS
3.1.3. Per Capita SIUS
3.2. The Spatial Characteristic of SIUS
3.2.1. The Spatial Distribution of SIUS for 18 Prefecture-Level Cities in Henan
3.2.2. Spatial Autocorrelation Analysis of SIUS
3.3. Decoupling Analysis
- (1)
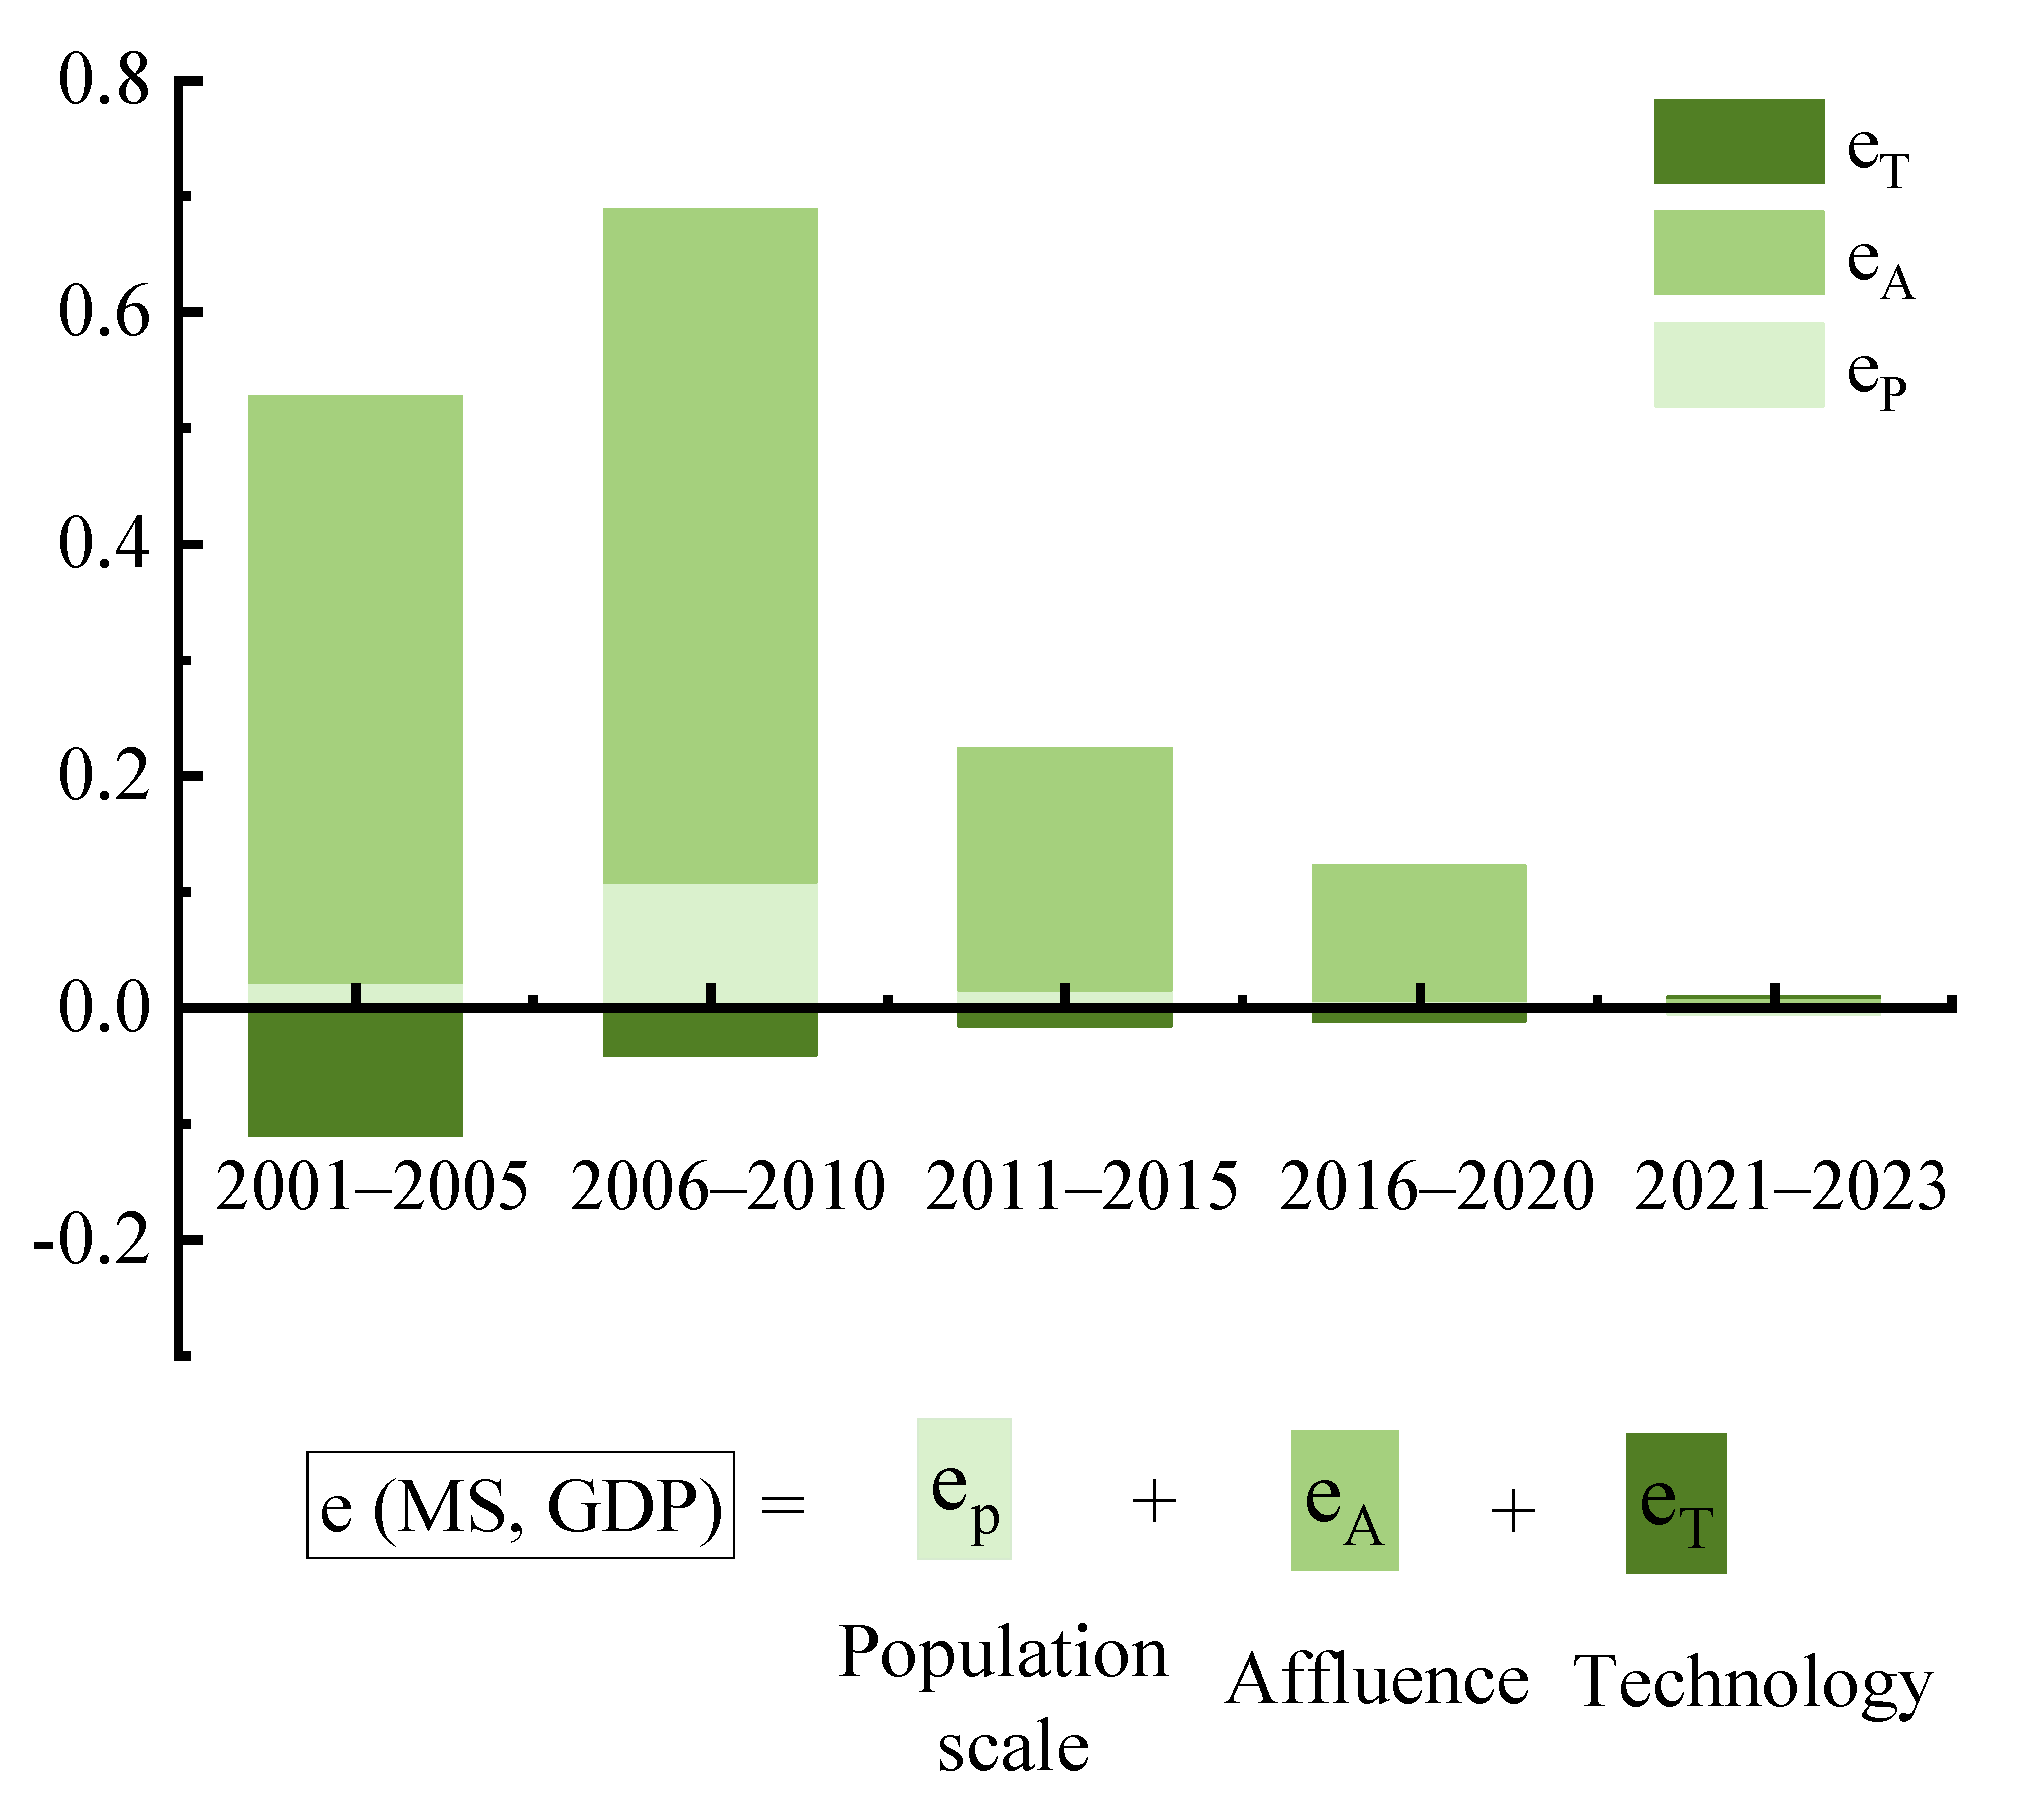
- The affluence factor is the most significant disincentive to decoupling. Its contribution to the decoupling index reached 0.51 during the 10th Five-Year Plan period but sharply dropped to just 0.008 in the early 14th Five-Year Plan period. According to the Outline of China’s 14th Five-Year Plan, China’s economy should maintain an average annual growth rate of above 5% in the second half, while Henan’s 14th Five-Year Plan has set a target of 6%. This suggests that the driving role of affluence will be weakened. Although the affluence factor is declining, it remains an important factor influencing decoupling.
- (2)
- The population scale factor exerts a noticeable inhibitory effect on the decoupling state, although its influence on the decoupling elasticity index is relatively weak. Overall, this effect has demonstrated a downward trend over time. The effect of the population scale factor is predominantly demonstrated through rural–urban migration. With the aim of accommodating more people, the government needs to build large quantities of buildings and infrastructure, thereby increasing resource consumption. Henan’s population has been on an upward trend, growing from 94.66 million in 2000 to 99.41 million in 2020, and then declining to 98.15 million in 2023. Notably, during the transition from the 13th to the early 14th Five-Year Plan periods, a population decrease of 1.66 million occurred. This decline in population scale alleviated the pressure on resource consumption, effectively promoting the decoupling process. Consequently, the population scale factor might contribute to achieving decoupling in the future.
- (3)
- The technological factor positively drives the decoupling process, despite its contribution rate being −5%. As Dai et al. (2023) noted, the decrease in the utilization intensity of SIUS is quantified as a negative value in the model [43]. This seemingly contradictory negative value actually reflects improved efficiency in steel resource utilization. As illustrated in Figure S2, the utilization intensity of SIUS has been on a downward trend, decreasing by 24% annually. This decline evidently shows that technological advancements have facilitated more efficient utilization of SIUS, thereby reducing the steel requirement per unit of economic output. The negative contribution rate, rather than indicating ineffectiveness, precisely underscores the pivotal role of technological progress in offsetting the growth in steel consumption induced by other factors, thereby accelerating the decoupling process. To further strengthen the positive influence of the technological factor on decoupling and promote more sustainable utilization of steel resources, continuous innovation and the adoption of advanced production techniques are essential.
3.4. Forecast of SIUS and Scrap
4. Discussion
4.1. Comparison with Other Regions
4.2. Uncertainty Analysis
4.3. Policy Implications
- (1)
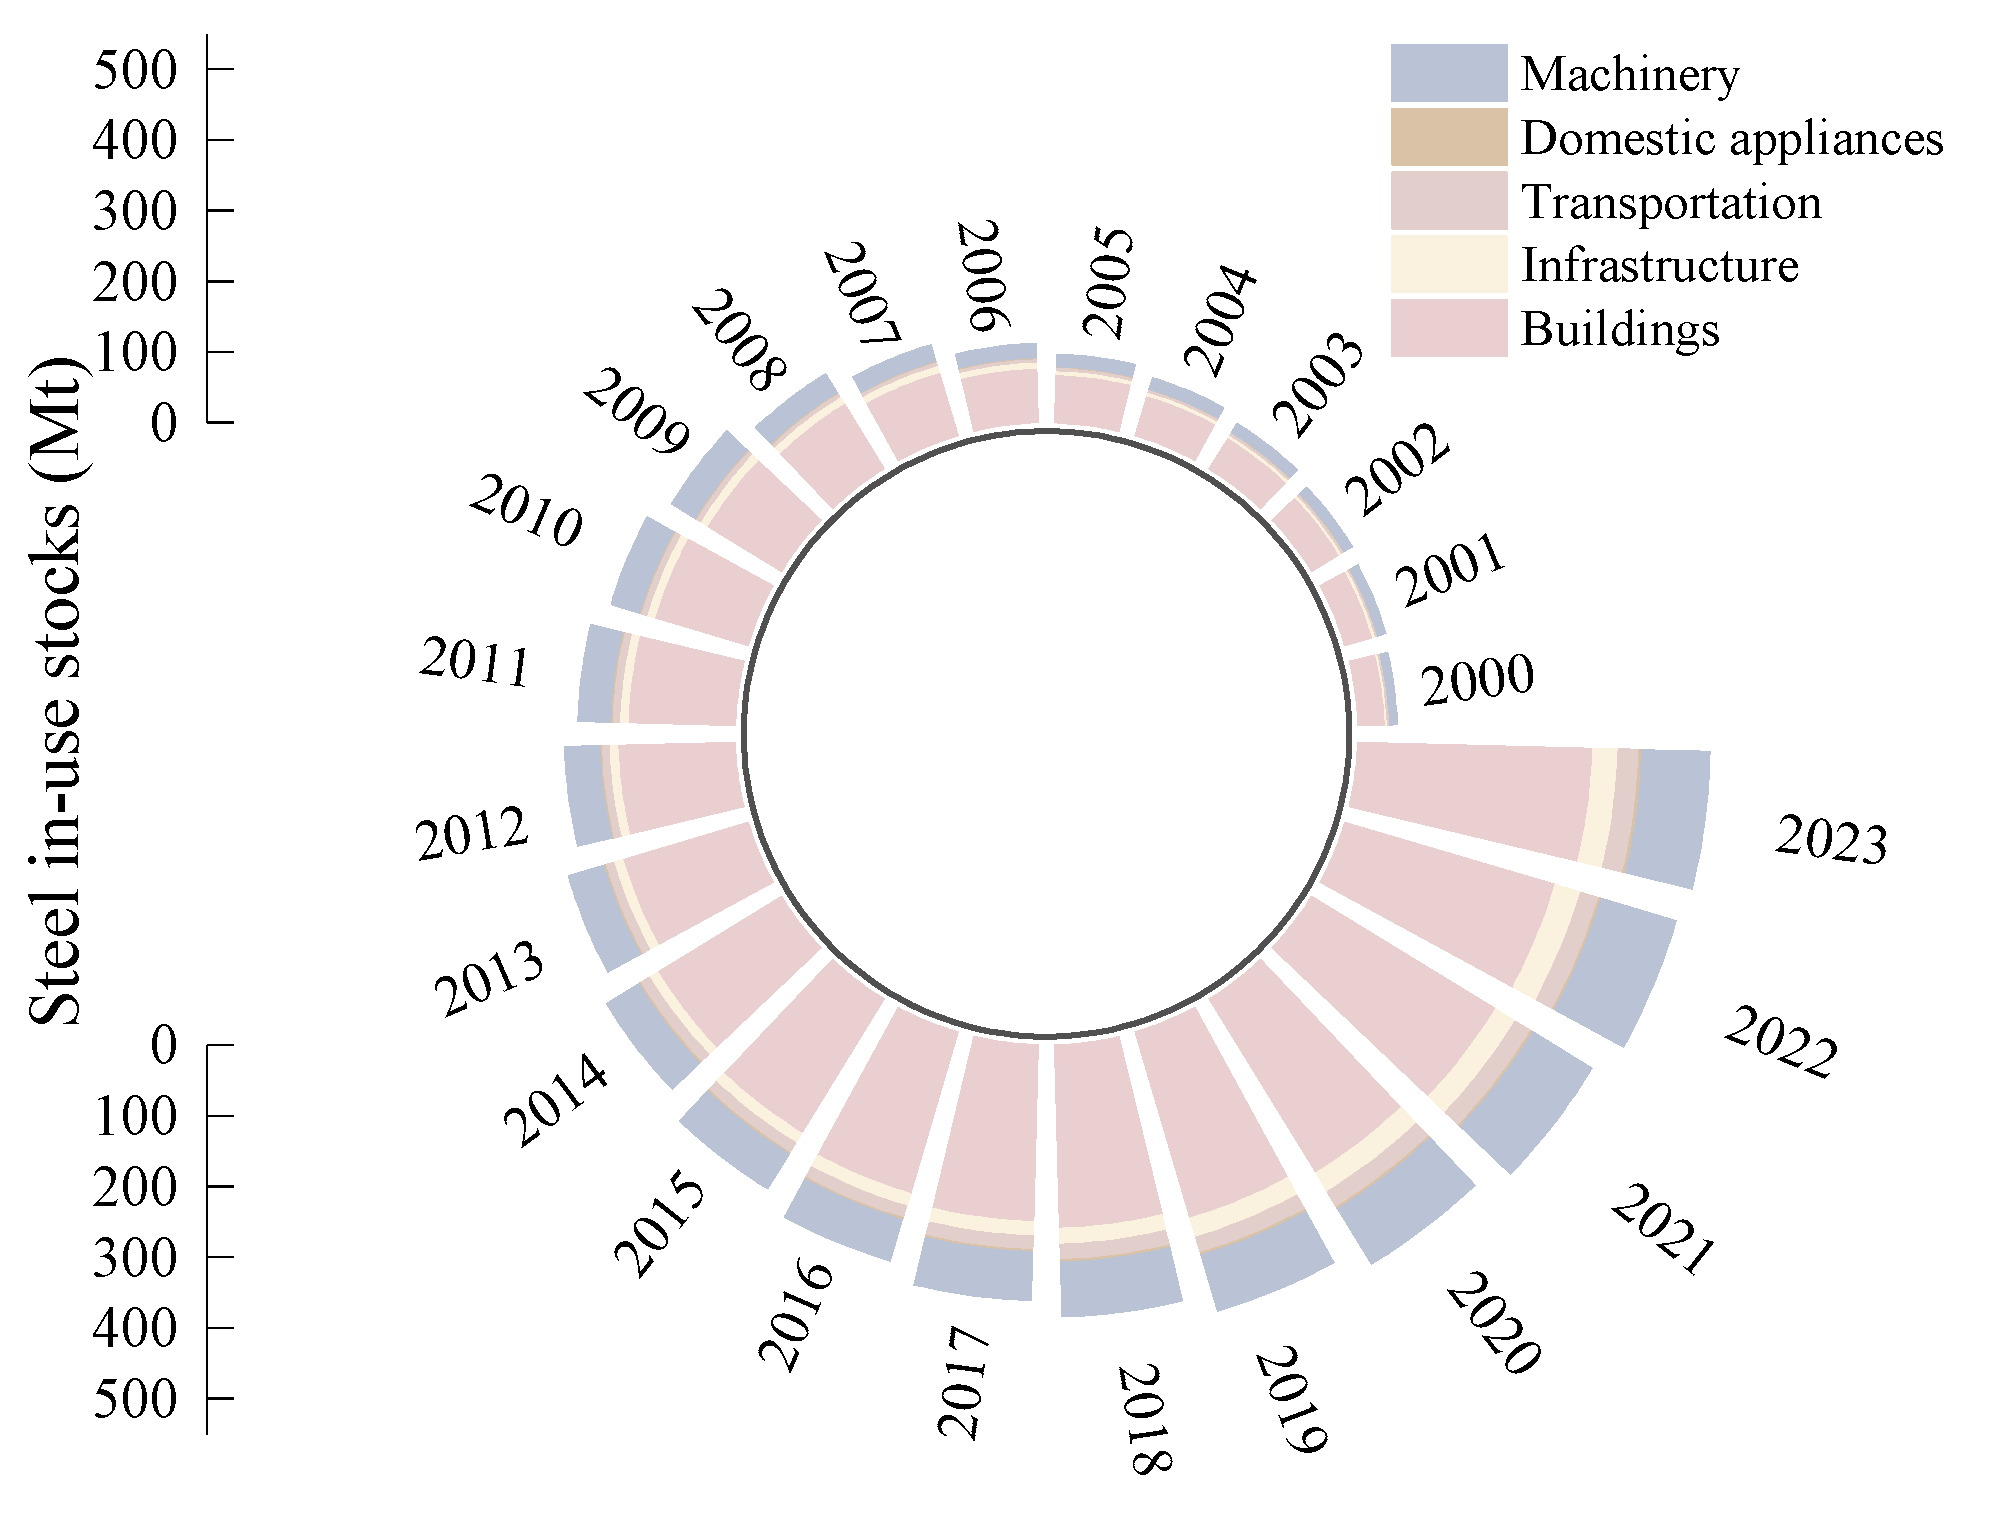
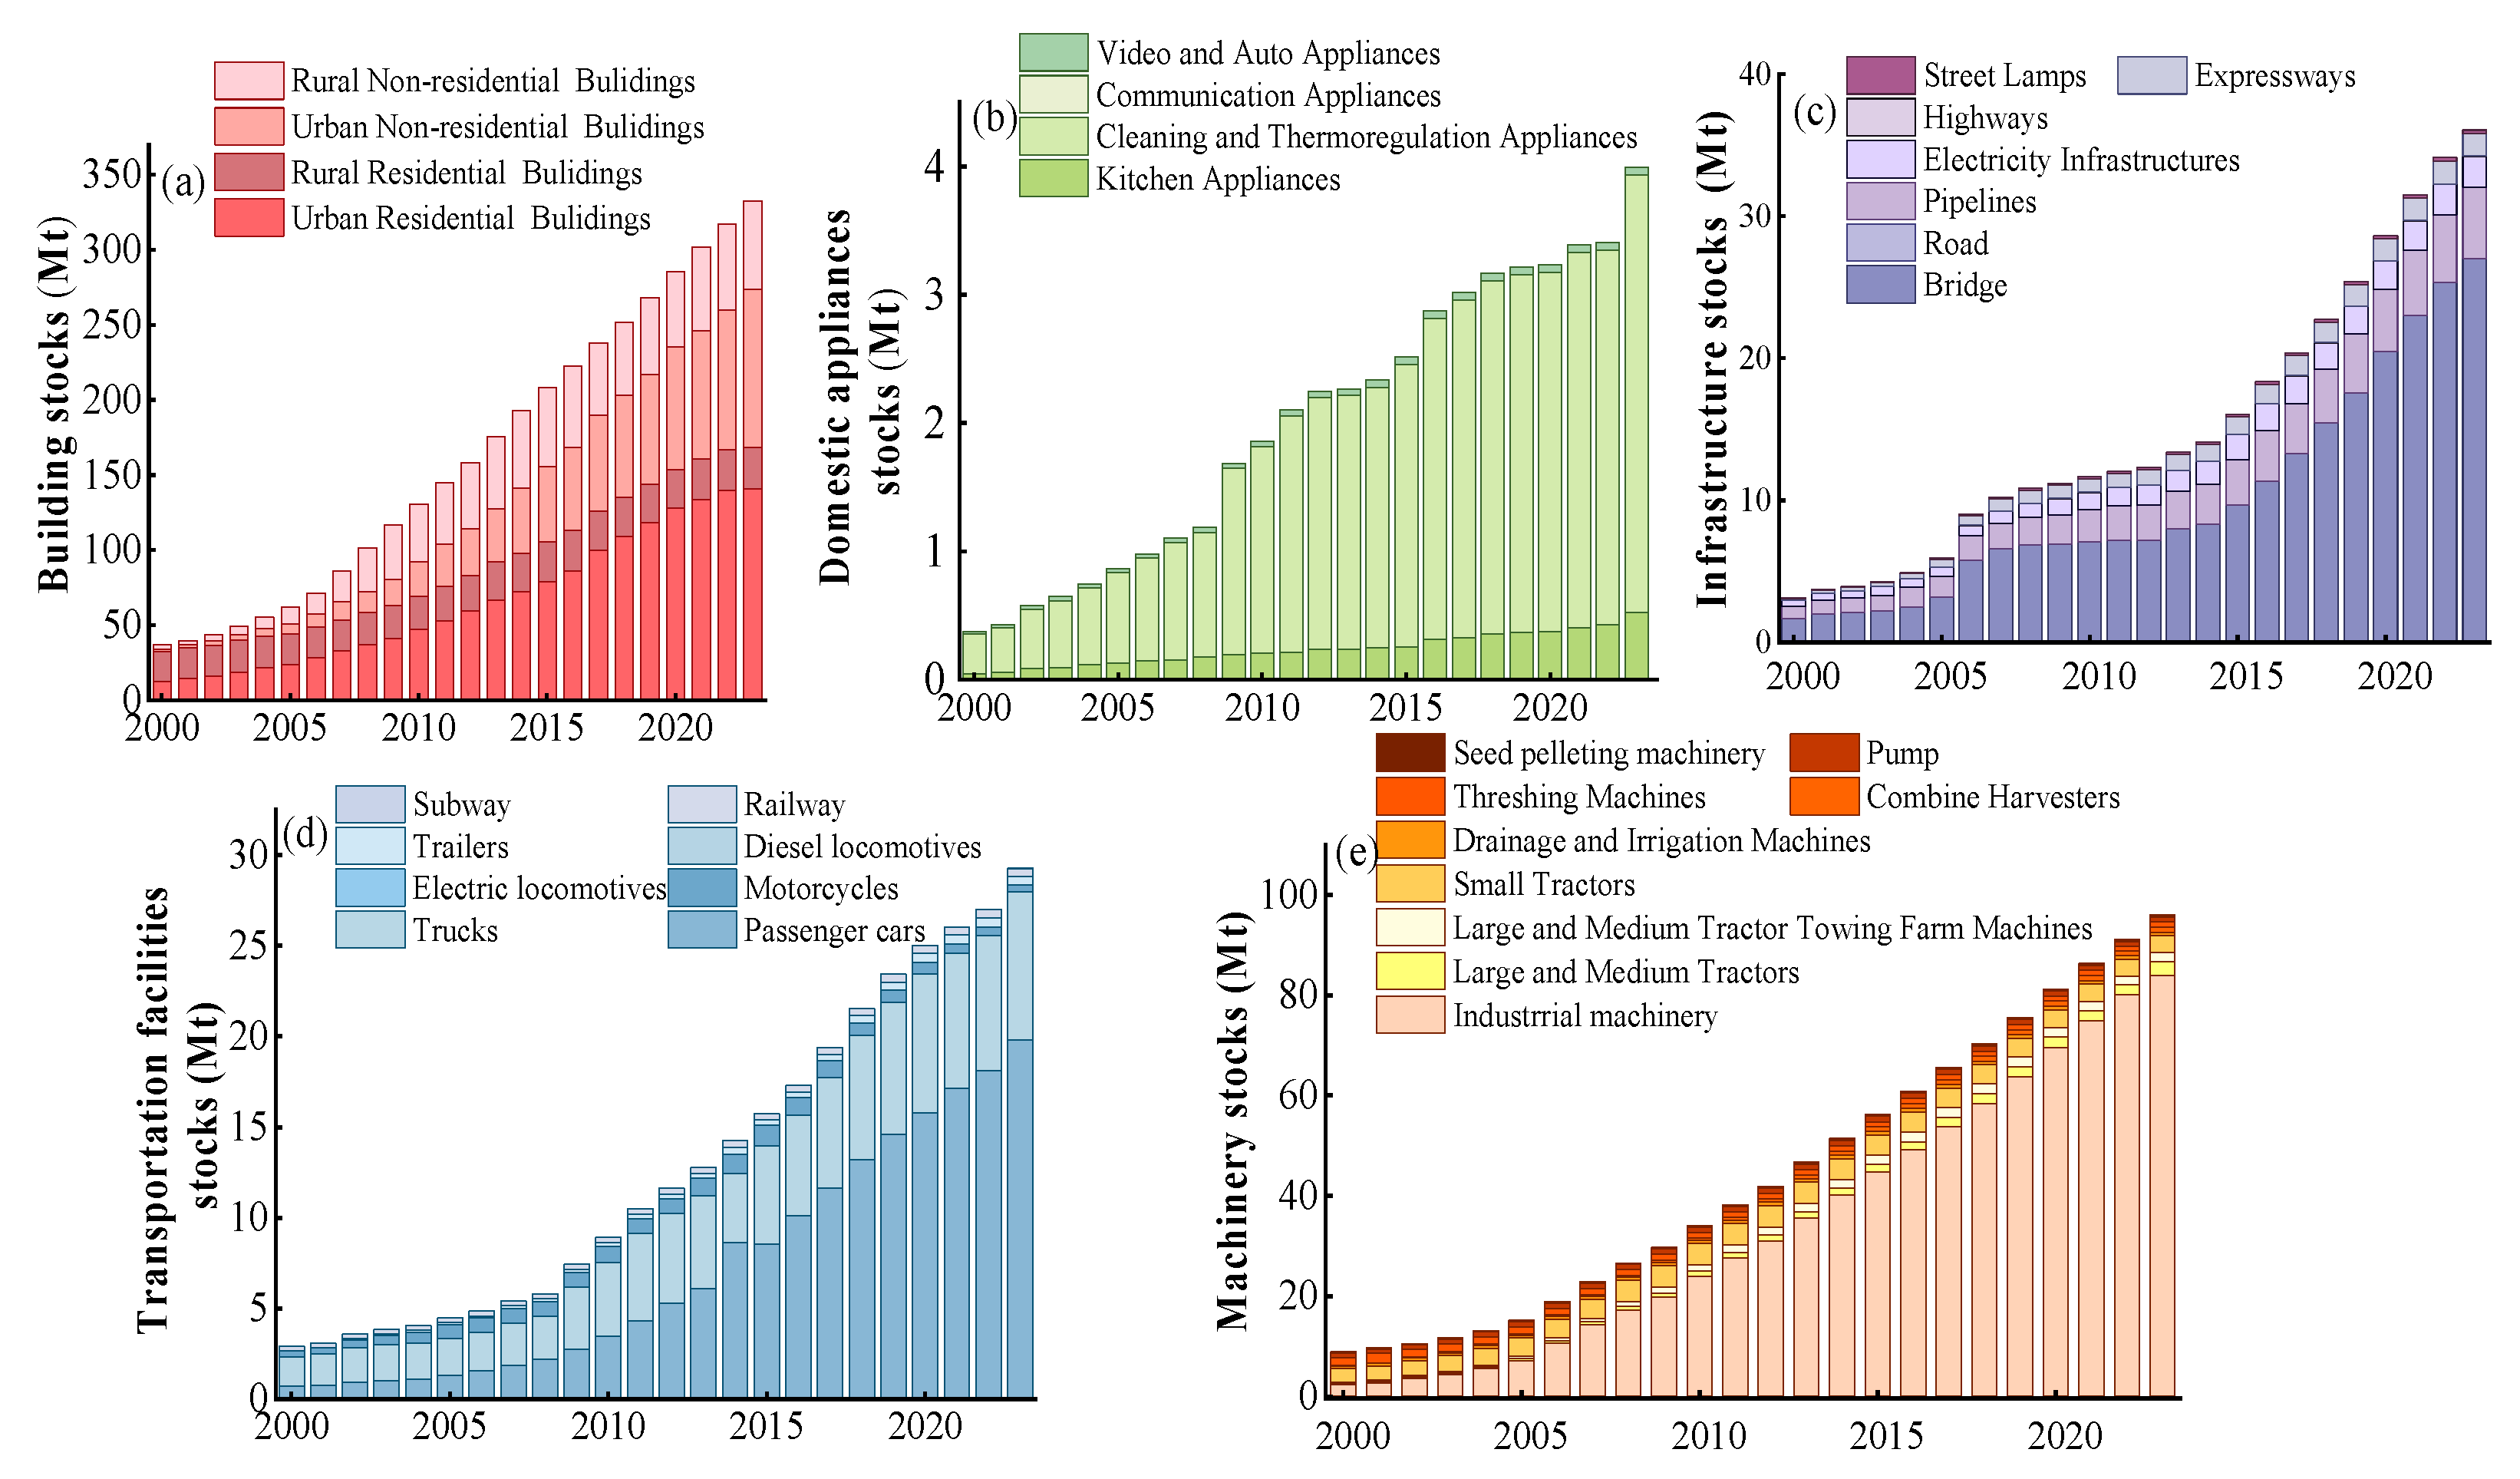
- Completing the scrap steel recycling chain from the perspective of industrial distribution. In the downstream sectors, SIUS in the building sector continues to grow and remains the primary source of SIUS, reaching 67% of the total SIUS in 2023. The lifetime of a building is typically around 30–50 years [58], meaning that a large amount of SIUS will be phased out at the end of their lifespan in the future. However, Guo et al. (2019) found that the utilization rate of building waste in China is less than 10% [50]. To achieve more efficient utilization of iron and steel resources, steel recyclers must enhance their integration capabilities, particularly for professional dismantling and fine sorting. Additionally, it is essential to continuously optimize the overall development of scrap steel recycling, dismantling, processing, and distribution and to improve the scrap steel resource recycling network.
- (2)
- Optimizing the recycling layout of scrap resources based on the SIUS at the prefecture-level cities. Building on the findings of this research and considering the distribution of the steel industry in Henan Province, this study prioritizes the establishment of scrap steel recycling bases around Jiaozuo and Jiyuan. This approach aims to improve the utilization efficiency of steel resources, promote the agglomeration and large-scale green development of recycling enterprises, and cultivate leading enterprises. Meanwhile, it is recommended to establish scrap recycling outlets in Zhengzhou, Nanyang, and other cities with a significant concentration of SIUS to improve resource recycling efficiency.
- (3)
- Promoting the decoupling between SIUS and economic development through technology. Henan Province is currently in the industrialization stage, and SIUS will continue to grow with economic growth. According to the findings of this study, technology plays a crucial role in accelerating the decoupling between SIUS and economic growth. Therefore, it is essential to enhance technological innovation and appropriately substitute materials. At the same time, financial subsidies should be provided to support technological innovation in enterprises, alongside improvements to fiscal and tax preferential policies.
5. Conclusions
- (1)
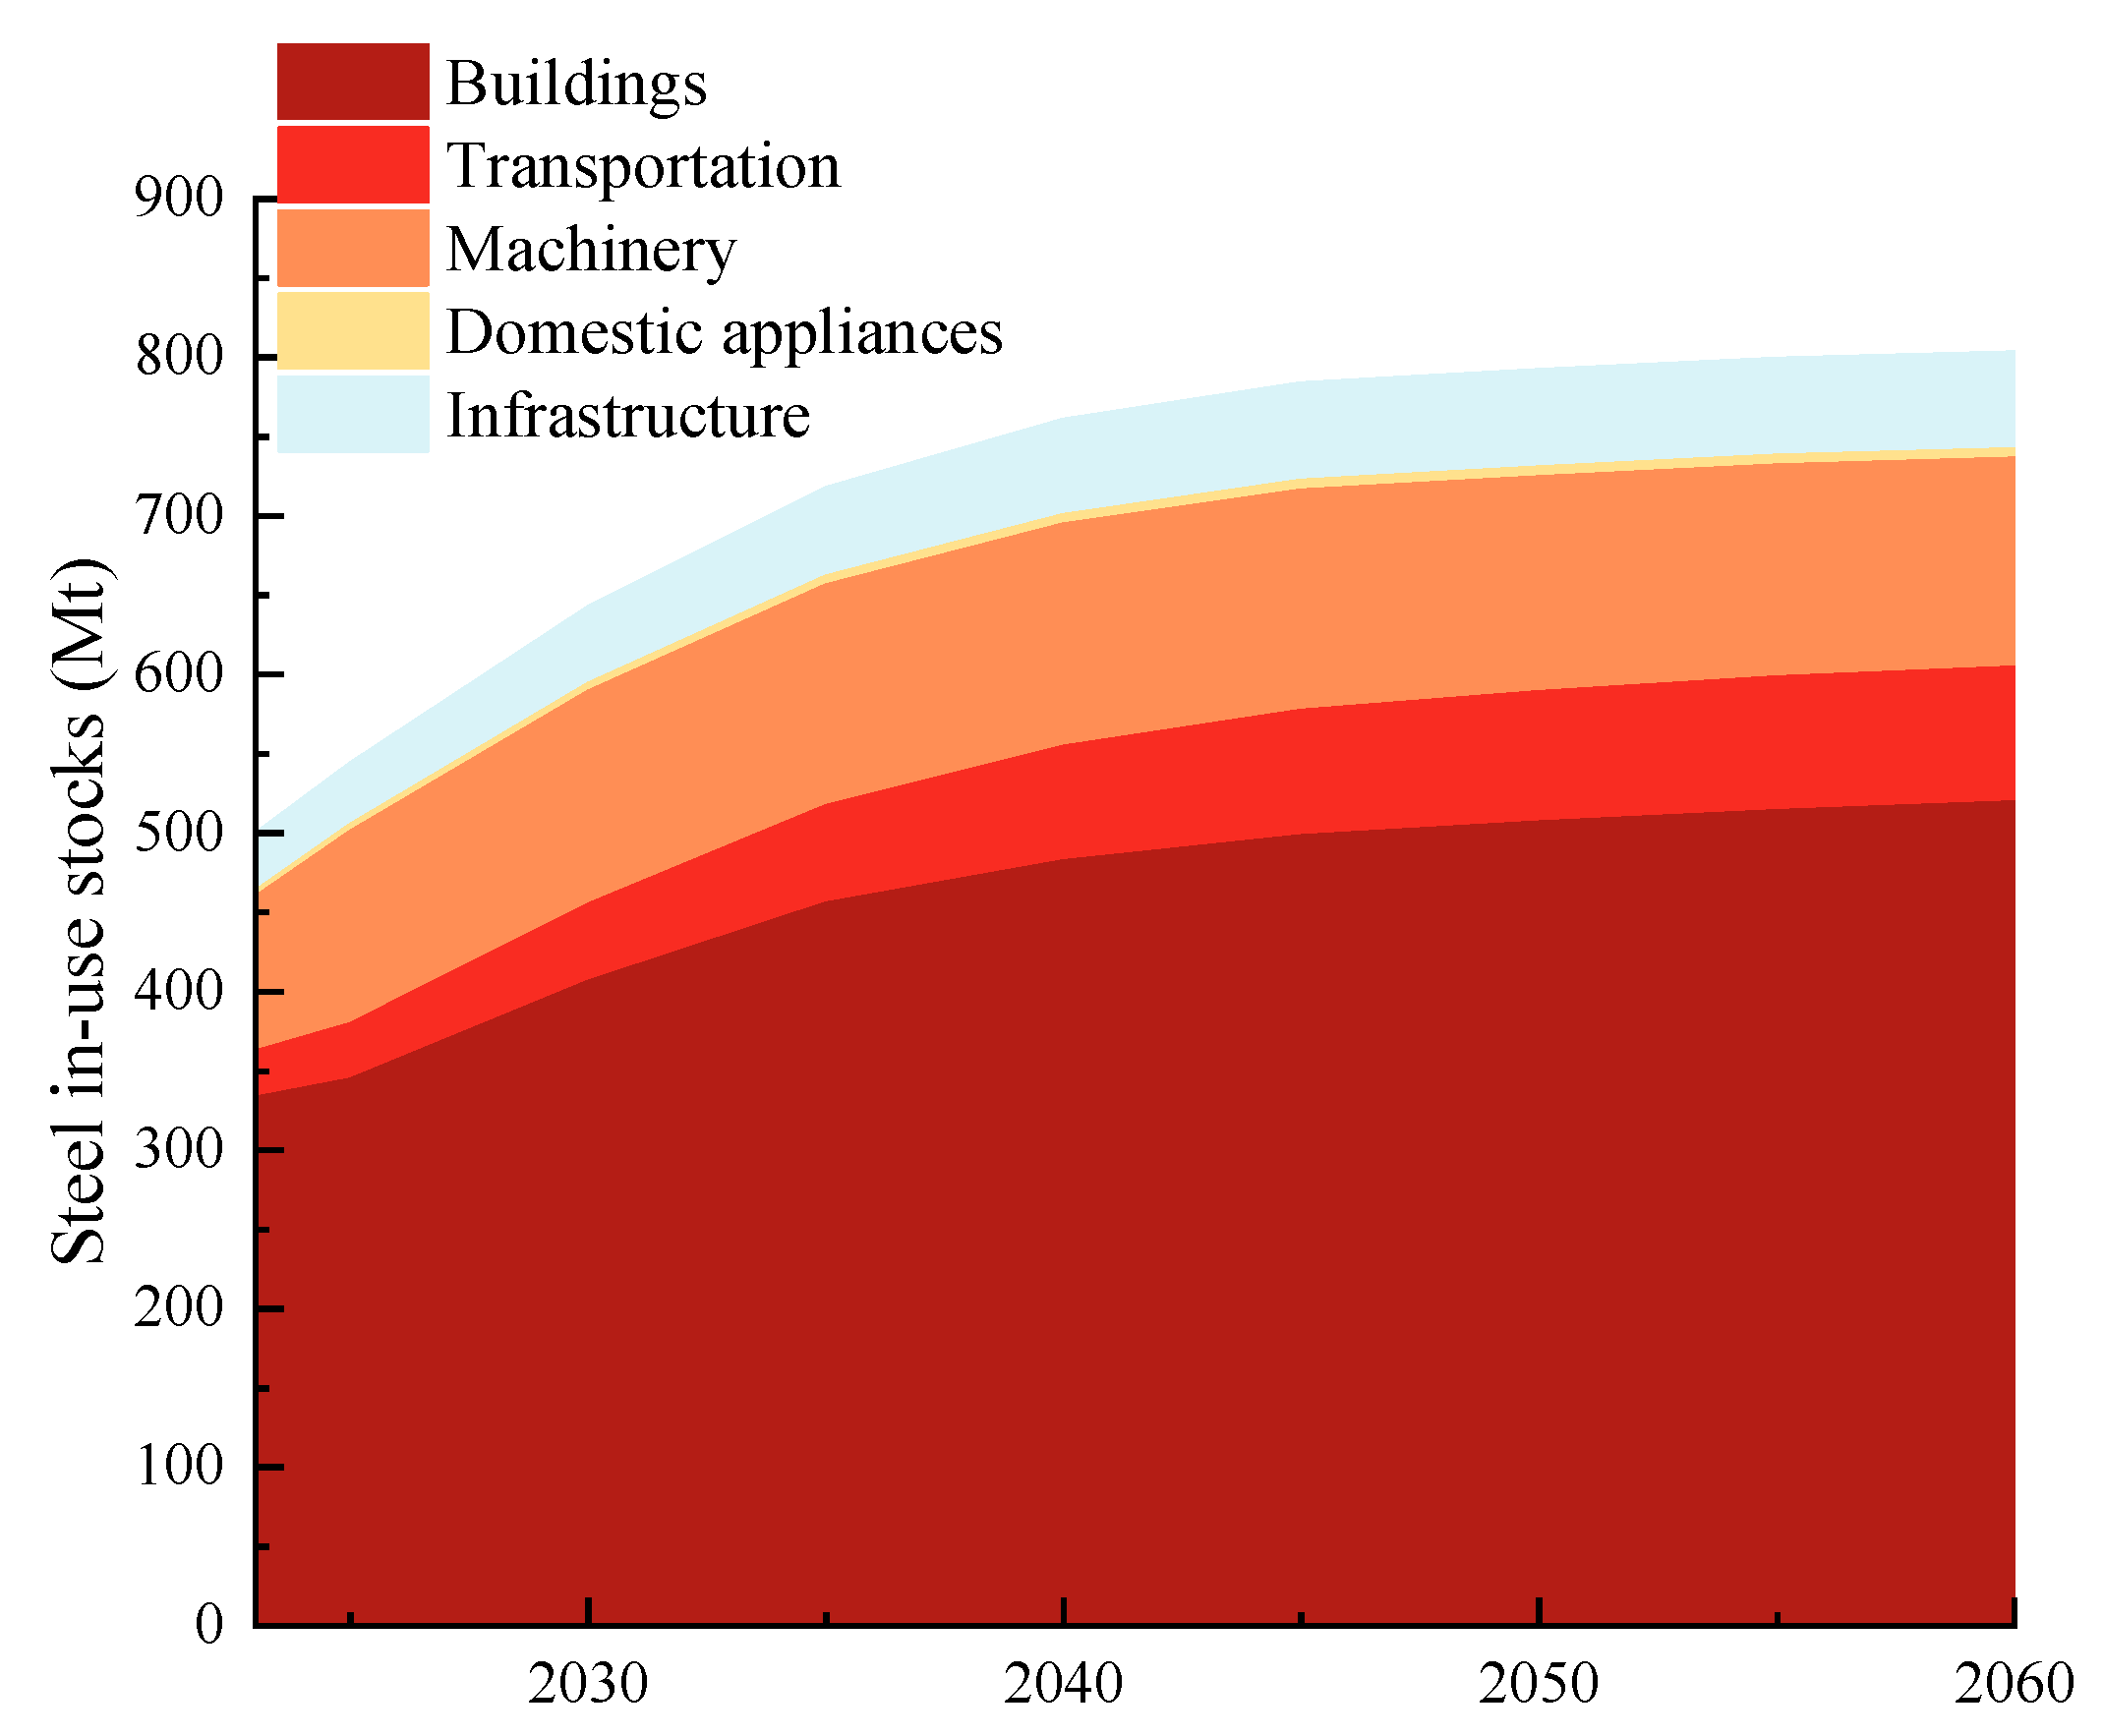
- Henan Province’s SIUS increased from 53.41 Mt in 2000 to 499.35 Mt in 2023, with per capita SIUS rising from 0.56 t/cap to 5.09 t/cap, an increase of 9.04 times. Projections indicate that SIUS will reach 802.99 Mt by 2060, with the annual growth rate declining from 10% in 2023 to 5% by 2060, suggesting that SIUS is nearing saturation. This reflects a significant transformation in the iron and steel industry in Henan Province, marking a shift from primary steel production to scrap-based steelmaking. The buildings sector will remain the primary contributor, accounting for 65% of total SIUS by 2060, highlighting its dominant role in steel stock dynamics.
- (2)
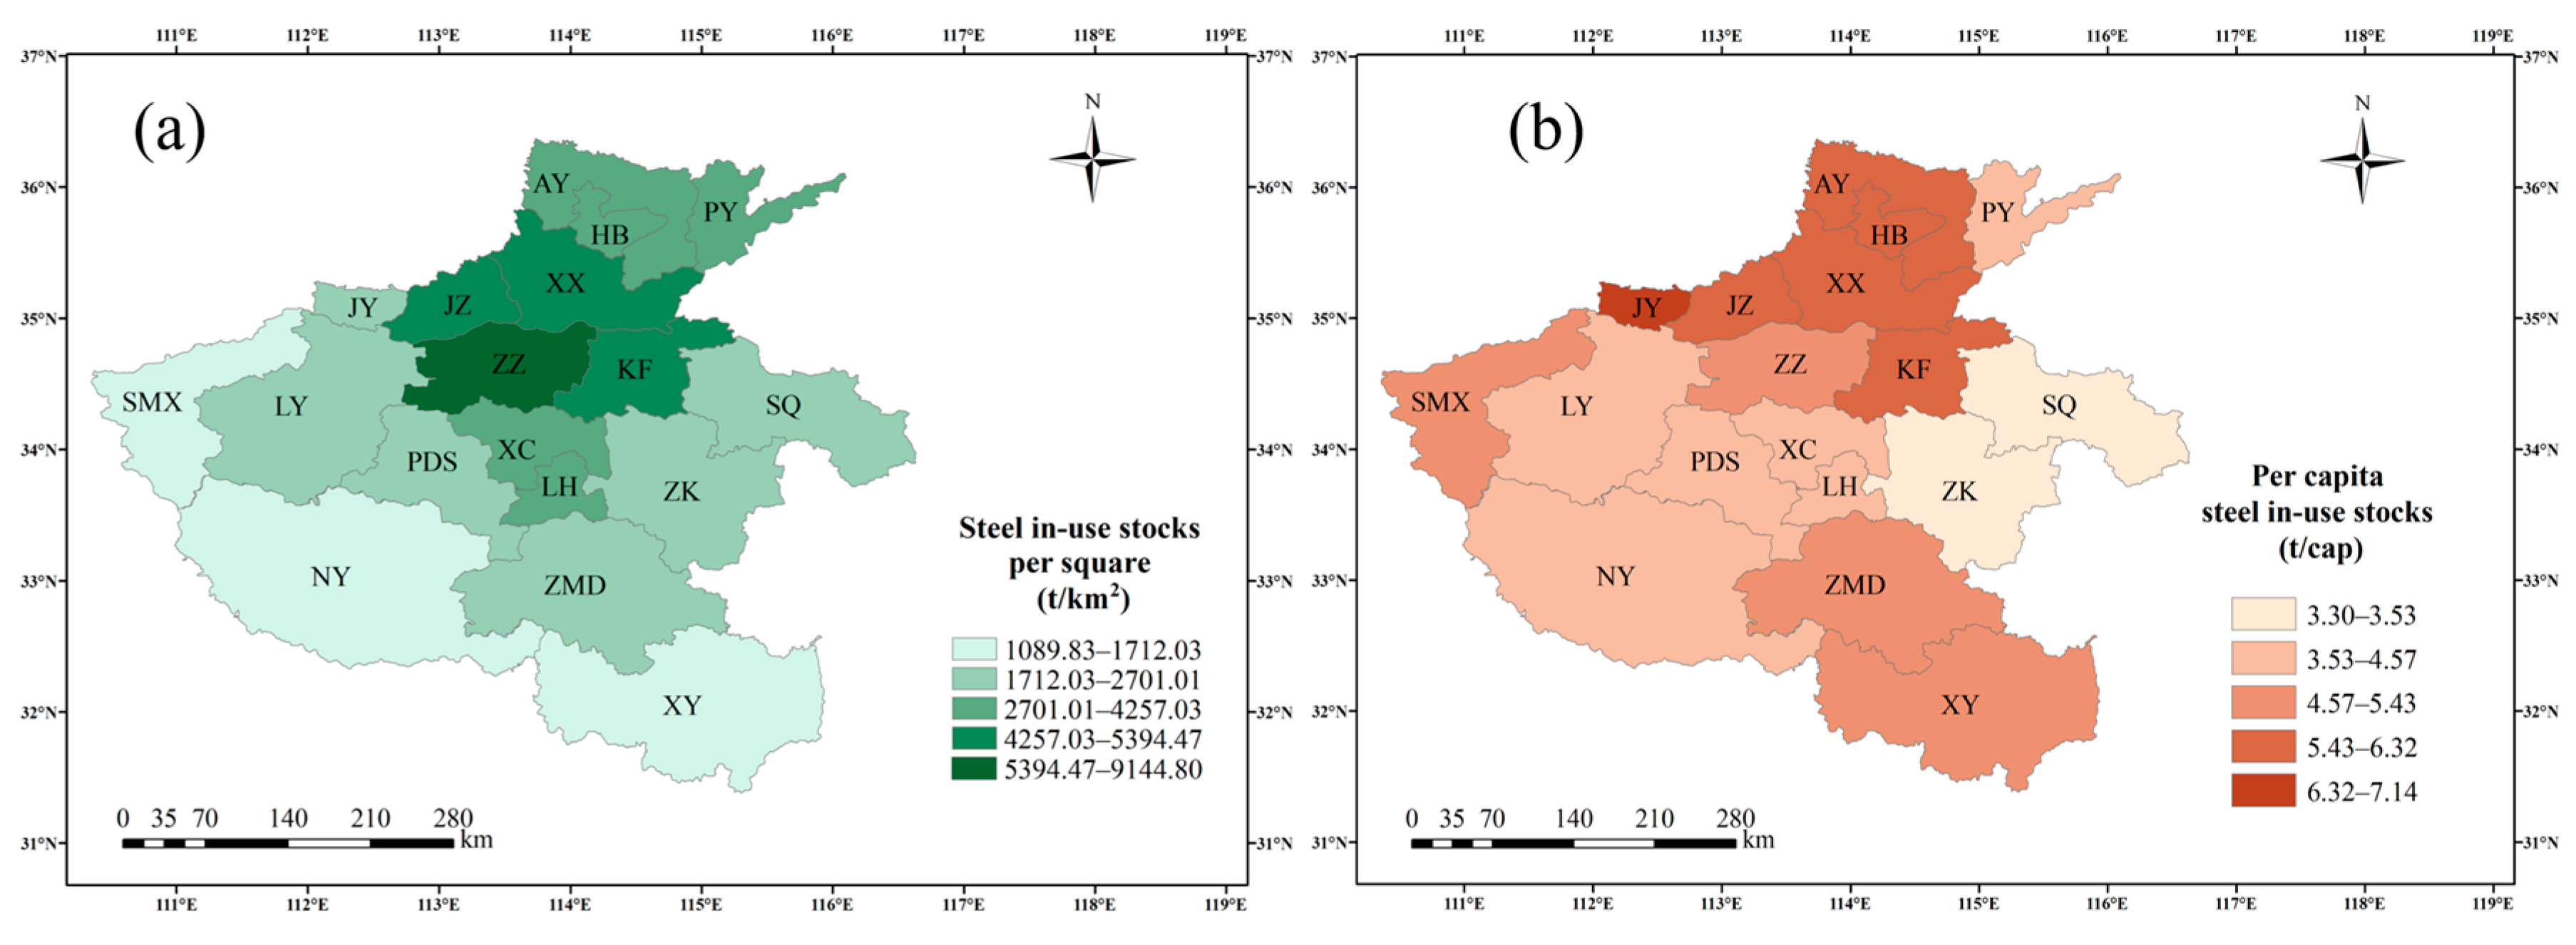
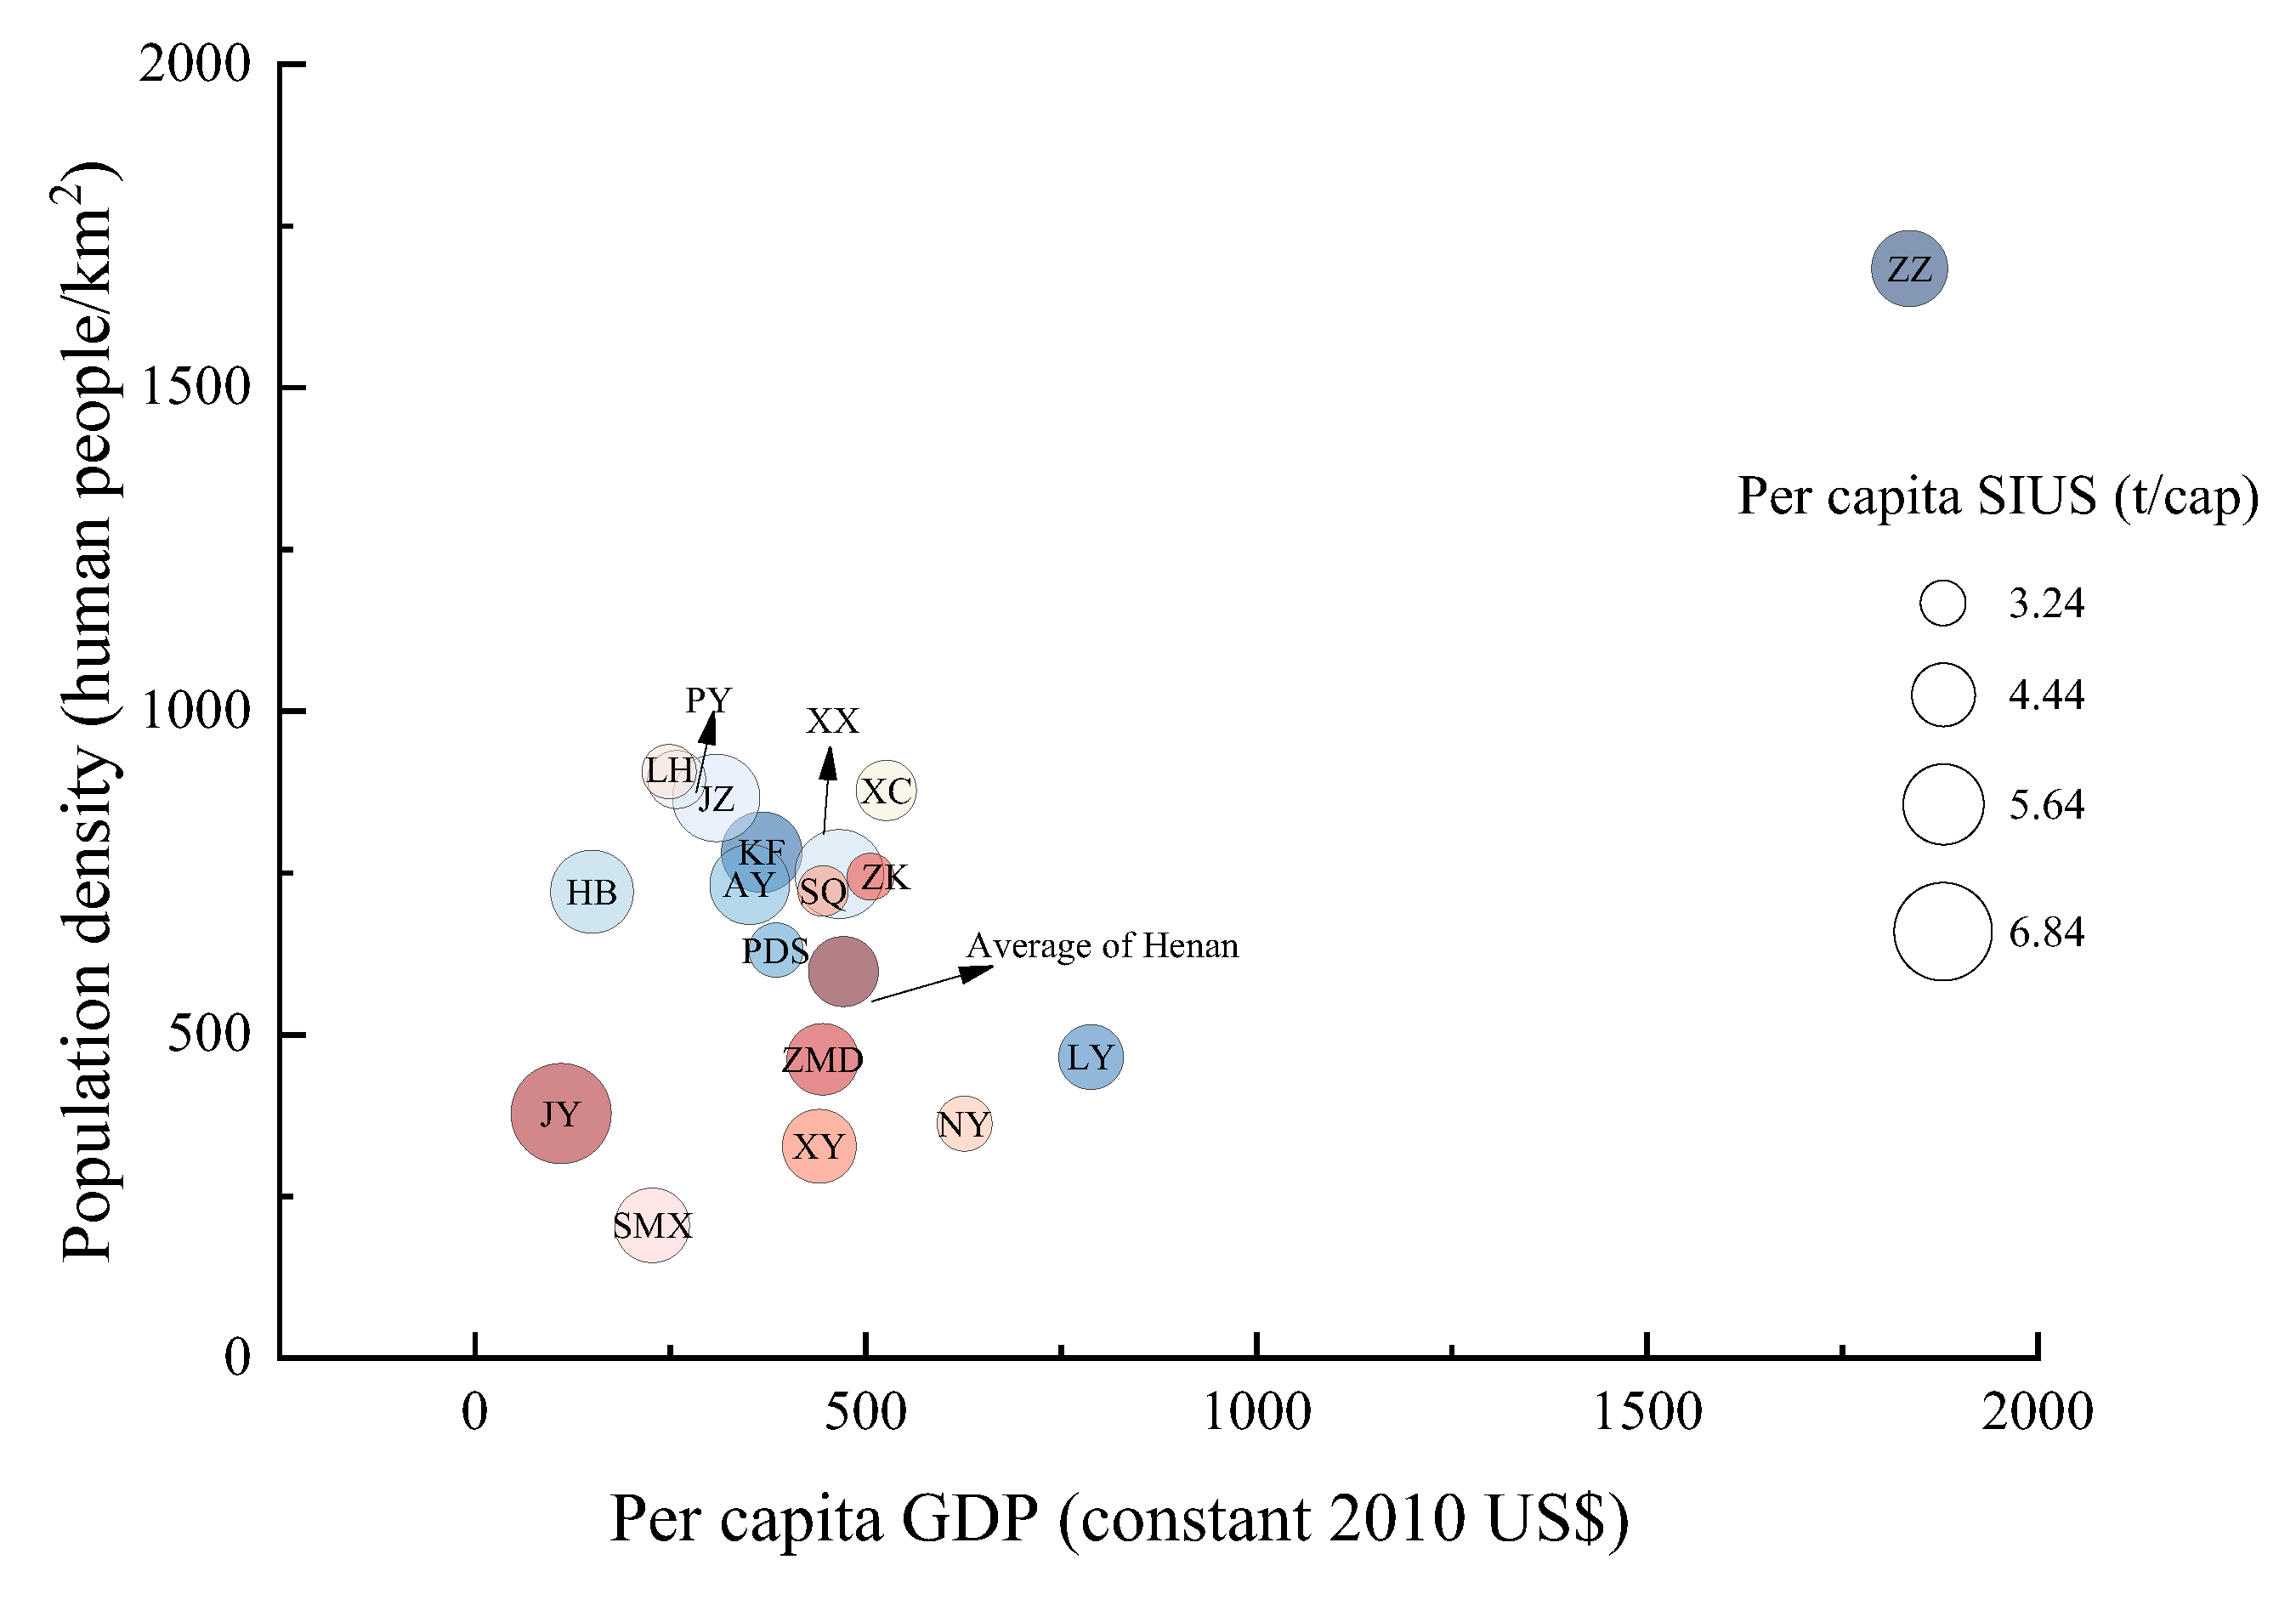
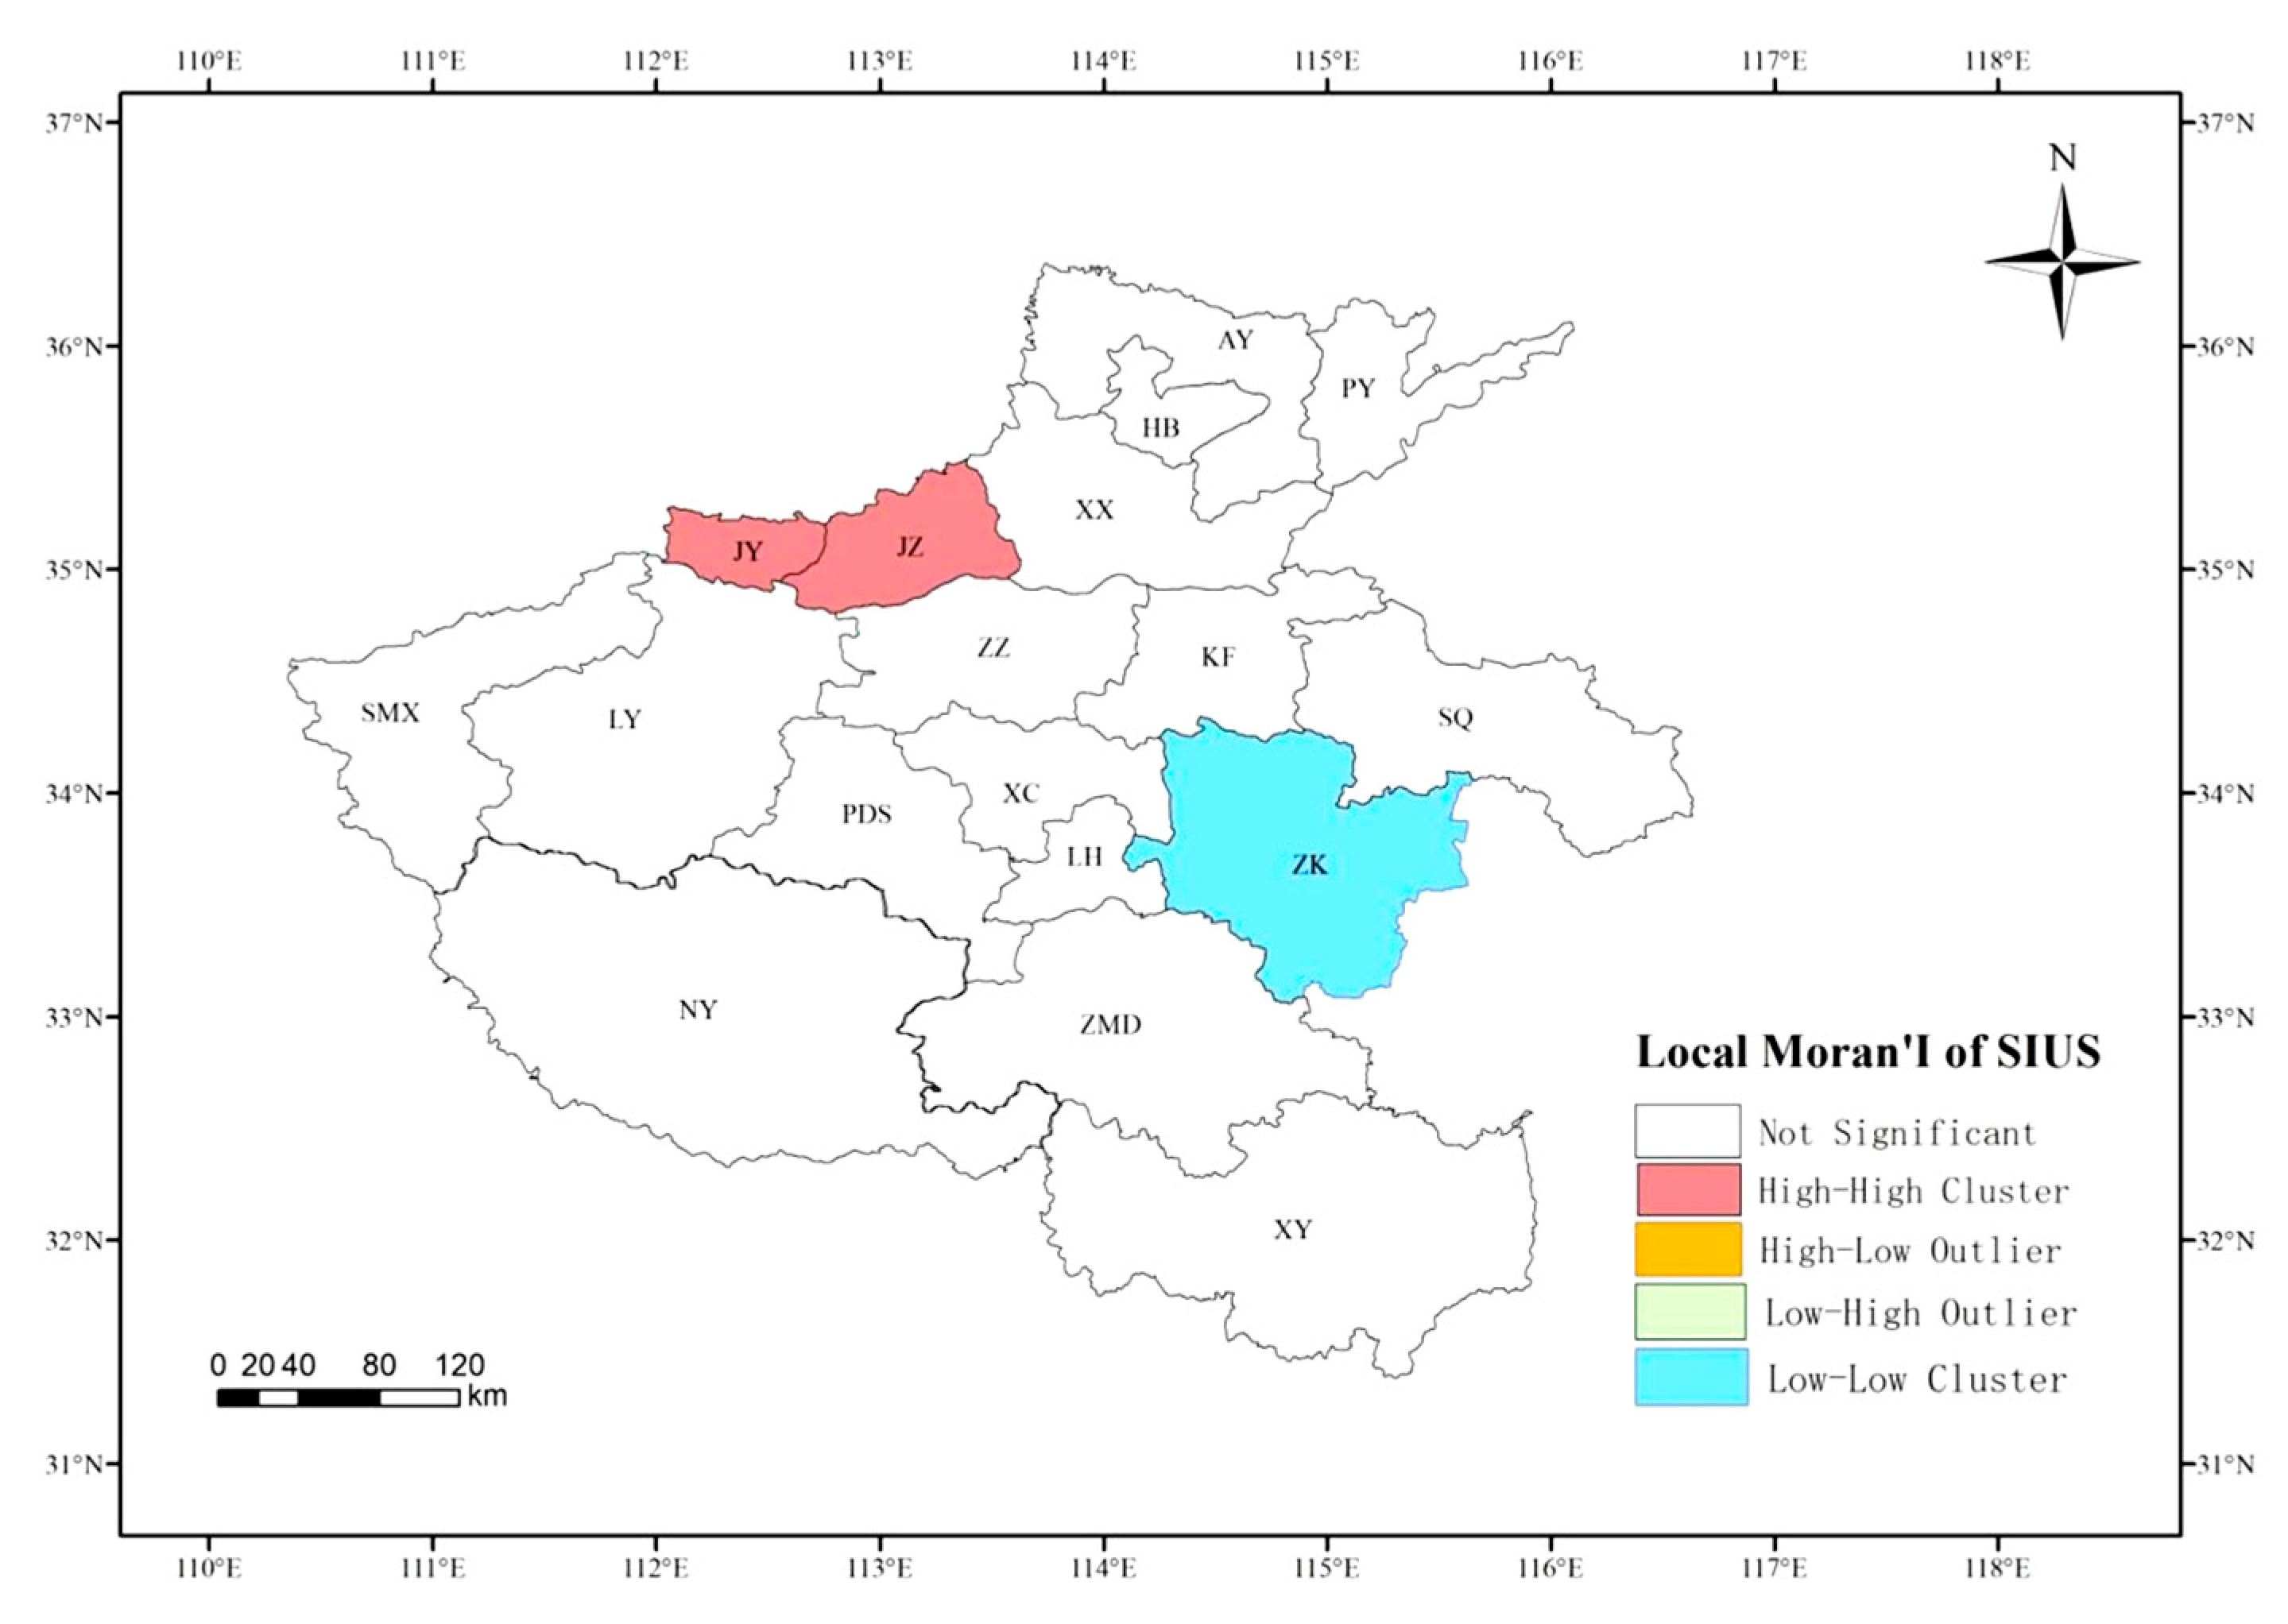
- At prefecture-level cities, while category distribution patterns are relatively consistent across 18 cities, stock density varies significantly, between 1055.35 and 8855.35 t/km2, revealing signification spatial heterogeneity. Spatial autocorrelation analysis highlights significant clustering of per capita SIUS in Jiaozuo and Jiyuan, necessitating the establishment of regional scrap recycling hubs in these areas to optimize collection efficiency.
- (3)
- The Tapio model shows a persistent weak decoupling between SIUS and economic growth, with the correlation gradually weakening. Through the decomposition analysis of decoupling factors, this study finds that the technology factor and the population scale factor can promote decoupling in the future.
- (4)
- The total recyclable scrap steel resources will rise from 11.05 Mt to 19.48 Mt from 2023 to 2060. Depreciation scrap has always been the main source of recyclable scrap steel resources and will reach 17.96 Mt in 2060, accounting for 88% of the total recyclable scrap steel, underscoring its importance in the circular steel economy.
Supplementary Materials
Author Contributions
Funding
Institutional Review Board Statement
Informed Consent Statement
Data Availability Statement
Conflicts of Interest
Abbreviations
| SIUS | Steel in-used stocks |
| Tapio–LMDI model | Tapio-Logarithmic Mean Divisia Index model |
| IPAT equation | Impact-Population-Affluence-Technology equation |
| GDP | Gross Domestic Product |
| TS | The total recyclable scrap steel |
| HS | Home Scrap |
| PS | Process Scrap |
| DS | Depreciated Scrap |
| Mt | Million tonnes |
| Scrap-EAF | Scrap-Electric Arc Furnace |
References
- Yue, Q.; Wang, H.M.; Gao, C.K.; Du, T.; Li, M.J.; Lu, Z.W. Analysis of iron in-use stocks in China. Resour. Policy 2016, 49, 315–322. [Google Scholar] [CrossRef]
- WSA. Steel Statistical Yearbook. World Steel Association. 2023. Available online: https://worldsteel.org/media/press-releases/2023/2023-steel-statistical-yearbook-published/ (accessed on 1 April 2024).
- Müller, D.B.; Wang, T.; Duval, B. Patterns of iron use in societal evolution. Environ. Sci. Technol. 2011, 45, 182–188. [Google Scholar] [CrossRef] [PubMed]
- WSA. World Steel in Figures; World Steel Association: Brussels, Belgium, 2019. [Google Scholar]
- NDRCC. “The 14th Five-Year Plan” for the Development of Circular Economy. National Development and Reform Commission of China. 2021. Available online: https://www.gov.cn/zhengce/zhengceku/2021-07/07/content_5623077.htm (accessed on 13 September 2024).
- NDRCC. Guiding Opinions on Accelerating the Construction of Waste Material Recycling System. National Development and Reform Commission of China. 2022. Available online: https://www.gov.cn/zhengce/zhengceku/2022-01/22/content_5669857.htm (accessed on 13 September 2024).
- CAMR. China Recycling Industry Development Report; China Association for Material Recycling: Beijing, China, 2023. [Google Scholar]
- Müller, D.B.; Wang, T.; Duval, B.; Graedel, T.E. Exploring the engine of anthropogenic iron cycles. Proc. Natl. Acad. Sci. USA 2006, 103, 16111–16116. [Google Scholar] [CrossRef] [PubMed]
- Lou, Y.; Shi, L. Metal stock analysis at the city scale—An example of steel and aluminium stocks in Handan City in 2005. Resour. Sci. 2008, 30, 147–152. (In Chinese) [Google Scholar]
- Yu, B.Y.; An, R.Y.; Zhao, J.P. Spatial and temporal disparity of the in-use steel stock for China. Resour. Conserv. Recycl. 2020, 155, 104667. [Google Scholar] [CrossRef]
- Hao, M.; Song, L.L.; Dai, M.; Liu, Y.P.; Dai, T.; Chen, W.Q. Urban mining assessment of copper, iron and aluminum in Fujian province. Resour. Ind. 2020, 22, 66–74. (In Chinese) [Google Scholar] [CrossRef]
- Wang, P.; Li, W.; Kara, S. Cradle-to-cradle modeling of the future steel flow in China. Resour. Conserv. Recycl. 2017, 117, 45–57. [Google Scholar] [CrossRef]
- Watari, T.; Giurco, D.; Cullen, J. Scrap endowment and inequalities in global steel decarbonization. J. Clean. Prod. 2023, 425, 139041. [Google Scholar] [CrossRef]
- Song, L.L.; Wang, P.; Hao, M.; Dai, M.; Xiang, K.Y.; Li, N.; Chen, N.Q. Mapping provincial steel stocks and flows in China: 1978–2050. J. Clean. Prod. 2020, 262, 121393. [Google Scholar] [CrossRef]
- Liu, Q.; Cao, Z.; Liu, X.; Liu, L.; Dai, T.; Han, J.; Duan, H.; Wang, C.; Wang, H.; Liu, J.; et al. Product and metal stocks accumulation of China’s megacities: Patterns, drivers, and implications. Environ. Sci. Technol. 2019, 53, 4128–4139. [Google Scholar] [CrossRef]
- Duan, L.; Liu, Y.; Yang, Y.; Song, L.; Hao, M.; Li, J.; Dai, M.; Chen, W.Q. Spatiotemporal dynamics of in-use copper stocks in the Jing-Jin-Ji urban agglomeration, China. Resour. Conserv. Recycl. 2021, 175, 105848. [Google Scholar] [CrossRef]
- Shen, W.R.; Liang, H.W.; Dong, L.; Ren, J.Z.; Wang, G.J. Synergistic CO2 reduction effects in Chinese urban agglomerations: Perspectives from social network analysis. Sci. Total Environ. 2021, 798, 149352. [Google Scholar] [CrossRef] [PubMed]
- Zhao, D.D.; Lei, Y.; Zhang, Y.; Shi, X.R.; Liu, X.; Xu, Y.L.; Xue, W.B. Analysis of vehicular CO2 emission in the Central Plains of China and its driving forces. Sci. Total Environ. 2022, 814, 152758. [Google Scholar] [CrossRef] [PubMed]
- Wang, Y.F.; Lv, W.Y.; Wang, M.J.; Chen, X.; Li, Y. Application of improved Moran’s I in the evaluation of urban spatial development. Spat. Stat. 2023, 54, 100736. [Google Scholar] [CrossRef]
- Fishman, T.; Schandl, H.; Tanikawa, H. The socio-economic drivers of material stock accumulation in Japan’s prefectures. Ecol. Econ. 2015, 113, 76–84. [Google Scholar] [CrossRef]
- Krausmann, F.; Wiedenhofer, D.; Lauk, C.; Haas, W.; Tanikawa, H.; Fishman, T.; Miatto, A.; Schandl, H.; Haberl, H. Global socioeconomic material stocks rise 23-fold over the 20th century and require half of annual resource use. Proc. Natl. Acad. Sci. USA 2017, 114, 1880–1885. [Google Scholar] [CrossRef]
- Song, L.L.; Wang, P.; Xiang, K.; Chen, W.Q. Regional disparities in decoupling economic growth and steel stocks: Forty years of provincial evidence in China. J. Environ. Manag. 2020, 271, 111035. [Google Scholar] [CrossRef]
- Zhang, C.; Wang, T.; Chen, W.Q.; Liu, G.; Du, H.Z. Simulation of China’s long-term steel demand and evaluation of the trend of overcapacity of steel industry. China J. Popul. Resour. 2018, 28, 169–176. (In Chinese) [Google Scholar]
- Zhao, F.; Yue, Q.; He, J.H.; Li, Y.; Wang, H.M. Quantifying China’s iron in-use stock and its driving factors analysis. J. Environ. Manag. 2020, 274, 111220. [Google Scholar] [CrossRef]
- Li, S.P.; Wang, Z.; Zhang, T.G.; Yue, Q. Quantification and spatial distribution of aluminum in-use stocks in Henan Province, China. Resour. Conserv. Recycl. 2022, 186, 1006540. [Google Scholar] [CrossRef]
- NBS. Statistical Yearbook of Urban Construction. National Bureau of Statistics of China. 2001–2023. Available online: https://www.mohurd.gov.cn/ (accessed on 5 April 2024).
- NBS. Urban and Rural Construction Statistical Yearbook. National Bureau of Statistics of China 2001–2023. Available online: https://www.mohurd.gov.cn/ (accessed on 5 April 2024).
- NBS. China Statistical Yearbook. National Bureau of Statistics of China. 2024. Available online: https://www.stats.gov.cn/ (accessed on 5 May 2025).
- HSB. Statistical Yearbook of Henan. Henan Statistical Bureau. 2001–2023. Available online: https://tjj.henan.gov.cn/ (accessed on 18 May 2024).
- Wang, T.; Müller, D.B.; Hashimoto, S. The ferrous find: Counting iron and steel stocks in China’s economy. J. Ind. Ecol. 2015, 19, 877–889. [Google Scholar] [CrossRef]
- Moran, P.A. Notes on continuous stochastic phenomena. Biome 1950, 37, 17–23. [Google Scholar] [CrossRef]
- Zhang, Y.; Teoh, B.K.; Zhang, L. Exploring driving force factors of building energy use and GHG emission using a spatio-temporal regression method. Energy 2023, 269, 126747. [Google Scholar] [CrossRef]
- Anselin, L. Local indicators of spatial association lisa. Geogr. Anal. 1995, 27, 93–115. [Google Scholar] [CrossRef]
- Xie, P.J.; Gao, S.S.; Sun, F.H. An analysis of the decoupling relationship between CO2 emission in power industry and GDP in China based on LMDI method. J. Clean. Prod. 2019, 211, 598–606. [Google Scholar] [CrossRef]
- Wang, X.F.; Shen, D.J.; Li, W. Research on the mechanism, model and application of decoupling between water resources utilization and economic growth. China Popul. Resour. Environ. 2019, 29, 139–147. (In Chinese) [Google Scholar] [CrossRef]
- Chen, Y.; Zhu, X.H.; Zeng, A.Q. Decoupling analysis between economic growth and aluminum cycle: From the perspective of aluminum use and carbon emissions. J. Environ. Manag. 2023, 344, 118461. [Google Scholar] [CrossRef]
- Kermeli, K.; Edelenbosch, O.Y.; Crijns-Graus, W.; Ruijven, B.J.; Vuuren, D.P.; Worrell, E. Improving material projections in Integrated Assessment Models: The use of a stock-based versus a flow-based approach for the iron and steel industry. Energy 2022, 239, 122434. [Google Scholar] [CrossRef]
- Pauliuk, S.; Wang, T.; Müller, D.B. Steel all over the world: Estimating in-use stocks of iron for 200 countries. Resour. Conserv. Recycl. 2013, 71, 22–30. [Google Scholar] [CrossRef]
- Lin, Y.C.; Ma, L.W.; Li, Z.; Ni, W.D. Coordinating energy and material efficiency strategies for decarbonizing China’s iron and steel sector. J. Clean. Prod. 2023, 425, 139038. [Google Scholar] [CrossRef]
- Zhang, Y.P.; Zhao, H.T.; Yu, Y.D.; Wang, T.; Zhou, W.J.; Jiang, J.; Chen, D.J.; Zhu, B. Copper in-use stocks accounting at the sub-national level in China. Resour. Conserv. Recycl. 2019, 147, 49–60. [Google Scholar] [CrossRef]
- Wang, P.; Jiang, Z.; Geng, X.Y.; Hao, S.Y.; Zhang, X.X. Quantification of Chinese steel cycle flow: Historical status and future options. Resour. Conserv. Recycl. 2014, 87, 191–199. [Google Scholar] [CrossRef]
- Kozawa, S.; Tsukihashi, F. Analysis of global demand for ironsource by estimation of in-use steel stock. Tetsu Hagane 2009, 95, A710–A719. (In Japanese) [Google Scholar] [CrossRef][Green Version]
- Dai, T.J.; Yue, Z.C. The evolution and decoupling of in-use stocks in Beijing. Energ. Econ. 2023, 203, 107606. [Google Scholar] [CrossRef]
- Pauliuk, S.; Wang, T.; Müller, D.B. Moving Toward the Circular Economy: The Role of Stocks in the Chinese Steel Cycle. Environ. Sci. Technol. 2011, 46, 148–154. [Google Scholar] [CrossRef]
- Cui, Z.F.; Shangguan, F.Q.; Wang, F.J.; Zhou, J.C.; Xu, A.J. Analysis andprediction of scrap resources in China from 2022 to 2060. Iron Steel 2023, 58, 126–133. (In Chinese) [Google Scholar]
- Duan, W.P.; Yang, S.F.; Li, J.S.; Zhang, F.J.; Xi, X.J. Progress in Rapid Melting Technology of Steel Scrap in Modern EAF Steelmaking in China. Chin. Metall. 2021, 31, 78–84+109. (In Chinese) [Google Scholar]
- Zhang, C.X. Study on the Influence of Scrap Steel Resources on Energy Consumption in Steel Production. Master’s Thesis, University of Science and Technology Liaoning, Anshan, China, 2012. (In Chinese). [Google Scholar]
- Wu, Y.G.; Xiao, B.Q.; Zhu, L.G.; Wang, Y. Present situation analysis and prospect of steel raw materials for EAF steelmaking. Iron Steel 2021, 56, 55–62. [Google Scholar]
- Shangguan, F.Q.; Zhou, J.C.; Wang, H.F.; Li, X.P. Climate change and decarbonization development of steel industry. Iron 2021, 56, 1–6. (In Chinese) [Google Scholar]
- Guo, J.; Miatto, A.; Shi, F.; Tanikawa, H. Spatially explicit material stock analysis of buildings in Eastern China metropoles. Resour. Conserv. Recycl. 2019, 146, 45–54. [Google Scholar] [CrossRef]
- United States Geological Survey (USGS). Metal Stocks in Use in the United States. America. 2005. Available online: https://pubs.usgs.gov/fs//2005/3090/2005-3090.pdf (accessed on 5 May 2025).
- Drakonakis, K.; Rostkowski, K.; Rauch, J.; Graedel, T.E.; Gordon, R.B. Metal capital sustaining a north American city: Iron and copper in NewHaven CT. Resour. Conserv. Recycl. 2017, 49, 406–420. [Google Scholar] [CrossRef]
- Tanikawa, H.; Hashimoto, S. Urban stock over time: Spatial material stock analysis using 4d-GIS. Build. Res. Inf. 2019, 37, 483–502. [Google Scholar] [CrossRef]
- Schöller, G.; Oberleitner, C.; Fehringer, R.; Döberl, G.; Brunner, P.H. Verknüpfung, Rohstof–Flager–Anthropogene Lager–Letzte Senken im Bundesland Steiermark; Vienna University of Technology: Vienna, Austria, 2006. [Google Scholar]
- Salemdeeb, R.; Saint, R.; Clark, W.; Lenaghan, M.; Pratt, K.; Millar, F. A pragmatic and industry-oriented framework for data quality assessment of environmental footprint tools. Resour. Environ. Sustain. 2021, 3, 100019. [Google Scholar] [CrossRef]
- Zhang, L.; Yuan, Z.; Bi, J. Estimation of copper in-use stocks in Nanjing, China. J. Ind. Ecol. 2012, 16, 191–202. [Google Scholar] [CrossRef]
- Zhang, L.; Yang, J.M.; Cai, Z.J.; Yuan, Z.W. Understanding the spatial and temporal patterns of copper in-use stocks in China. Environ. Sci. Technol. 2015, 49, 6430–6437. [Google Scholar] [CrossRef]
- Hu, M.; Pauliuk, S.; Wang, T.; Huppes, G.; Voet, E.V.D.; Müller, D.B. Iron and steel in Chinese residential buildings: A dynamic analysis. Resour. Conserv. Recycl. 2010, 54, 591–600. [Google Scholar] [CrossRef]
- Sarfarazi, S.; Shamass, R.; Guarracino, F.; Mascolo, I.; Modano, M. Exploring the stainless-steel beam-to-column connections response: A hybrid explainable machine learning framework for characterization. Front. Struct. Civ. Eng. 2025, 19, 34–59. [Google Scholar] [CrossRef]
- Müller, E.; Hilty, M.L.; Widmer, R.; Schluep, M.; Faulstich, M. Modeling Metal Stocks and Flows: A Review of Dynamic Material Flow Analysis Methods. Environ. Sci. Technol. 2014, 48, 2102–2113. [Google Scholar] [CrossRef]
- Song, L.L.; Han, J.; Li, N.; Huang, Y.Y.; Hao, M.; Dai, M.; Chen, W.Q. China material stocks and fows account for 1978–2018. Sci. Data 2021, 8, 303. [Google Scholar] [CrossRef]


| Years | GDP% | MS% | Decoupling Index | Degree of Decoupling |
|---|---|---|---|---|
| 2001–2005 | 0.75 | 0.56 | 0.42 | Weak decoupling |
| 2006–2010 | 0.84 | 0.77 | 0.65 | Weak decoupling |
| 2011–2015 | 0.48 | 0.44 | 0.21 | Weak decoupling |
| 2016–2020 | 0.43 | 0.39 | 0.11 | Weak decoupling |
| 2021–2023 | 0.05 | 0.11 | 0.0037 | Weak decoupling |
| Region | Method | Time Estimated | Per Capita SIUS (t/cap) | References |
|---|---|---|---|---|
| USA | Top-down | 2002 | 14.3 | USGS (2005) [51] |
| USA | Top-down | 2004 | 11–12 | Müller et al. (2006) [8] |
| USA | Top-down | 2004 | 10.92 | Kozawa et al.(2009) [42] |
| New Haven (USA) | Bottom-up | 2000 | 9.2 | Drakonakis et al. (2007) [52] |
| Australia | Top-down | 2005 | 10±2 | Müller et al. (2011) [3] |
| Canada | Top-down | 2005 | 12±2 | Müller et al. (2011) [3] |
| Wakayama (Japan) | Bottom-up | 2004 | 2.08 | Tanikawa and Hashimoto (2009) [53] |
| CIS and the Middle East and Others | Bottom-up | 2019 | 8.2 | Watari (2023) [13] |
| Steiermark (Austria) | Bottom-up | 2003 | 10 | Schöller et al. (2006) [54] |
| Global | Average use life method | 2013 | 2.8 | Yue et al. (2016) [1] |
| China | Bottom-up | 2018 | 5.9 | Song et al. (2020) [14] |
| Handan (China) | Bottom-up | 2005 | 1.33 | Lou et al. (2008) [9] |
| Zhejiang (China) | Bottom-up | 2016 | 5.48 | Yu et al. (2020) [10] |
| Fujian (China) | Bottom-up | 2016 | 7.6 | Hao et al. (2020) [11] |
| Nanjing (China) | Bottom-up | 2016 | 6.2 | Liu et al. (2019) [15] |
| Shenzhen (China) | Bottom-up | 2016 | 2.5 | Liu et al. (2019) [15] |
| Henan (China) | Bottom-up | 2023 | 5.09 | This study |
| Category | Subcategory | Uncertainty | Percentage of Total Iron in-Use Stocks (%) |
|---|---|---|---|
| Buildings | Urban and rural residential | Low | 33.8 |
| Urban and rural non-residential | Medium | 32.8 | |
| Infrastructure | Bridge | Low | 5.42 |
| Pipelines | Low | 1.01 | |
| Electricity Infrastructures | Medium | 0.44 | |
| Highways | Low | 0.01 | |
| Expressways | Low | 0.32 | |
| Street Lamps | Low | 0.05 | |
| Transportation | Low | 5.86 | |
| Domestic appliances | Medium | 0.8 | |
| Machinery | Medium | 19.5 |
Disclaimer/Publisher’s Note: The statements, opinions and data contained in all publications are solely those of the individual author(s) and contributor(s) and not of MDPI and/or the editor(s). MDPI and/or the editor(s) disclaim responsibility for any injury to people or property resulting from any ideas, methods, instructions or products referred to in the content. |
© 2025 by the authors. Licensee MDPI, Basel, Switzerland. This article is an open access article distributed under the terms and conditions of the Creative Commons Attribution (CC BY) license (https://creativecommons.org/licenses/by/4.0/).
Share and Cite
Liu, Y.; Wang, S.; Li, Y.; Sun, H.; Zhao, Y.; Zhang, R. Spatio-Temporal Characterization of Metal Stocks at a Provincial Scale: The Case of Iron and Steel Industry in Henan Province, China. Appl. Sci. 2025, 15, 6506. https://doi.org/10.3390/app15126506
Liu Y, Wang S, Li Y, Sun H, Zhao Y, Zhang R. Spatio-Temporal Characterization of Metal Stocks at a Provincial Scale: The Case of Iron and Steel Industry in Henan Province, China. Applied Sciences. 2025; 15(12):6506. https://doi.org/10.3390/app15126506
Chicago/Turabian StyleLiu, Yilei, Shanshan Wang, Yeke Li, Huijie Sun, Yingying Zhao, and Ruiqin Zhang. 2025. "Spatio-Temporal Characterization of Metal Stocks at a Provincial Scale: The Case of Iron and Steel Industry in Henan Province, China" Applied Sciences 15, no. 12: 6506. https://doi.org/10.3390/app15126506
APA StyleLiu, Y., Wang, S., Li, Y., Sun, H., Zhao, Y., & Zhang, R. (2025). Spatio-Temporal Characterization of Metal Stocks at a Provincial Scale: The Case of Iron and Steel Industry in Henan Province, China. Applied Sciences, 15(12), 6506. https://doi.org/10.3390/app15126506


