Article

Spatio-Temporal Characterization of Metal Stocks at a Provincial Scale: The Case of Iron and Steel Industry in Henan Province, China

1
College of Chemistry, Zhengzhou University, Zhengzhou 450001, China
2
School of Ecology and Environment, Zhengzhou University, Zhengzhou 450001, China
3
Henan Key Laboratory of Environmental Chemistry and Low Carbon Technology, Zhengzhou 450001, China
*
Author to whom correspondence should be addressed.
Appl. Sci. 2025, 15(12), 6506; https://doi.org/10.3390/app15126506
Submission received: 6 May 2025 / Revised: 3 June 2025 / Accepted: 4 June 2025 / Published: 9 June 2025

Abstract

With rapid urbanization and industrialization, steel in-use stocks (SIUS) have experienced significant growth, playing an important role in urban mining and future renewable resources. Although previous studies have quantified SIUS at the provincial level, a comprehensive understanding of its spatial distribution remains limited. This study uses Henan Province as a case to assess SIUS and its spatial distribution at the provincial level. A spatio-temporal characterization framework is developed to systematically analyze SIUS dynamics, integrating the bottom-up model, the spatial autocorrelation model, the Tapio–LMDI model, and the stock-driven model. The findings show that total SIUS has been continuously increasing, reaching 499.35 Mt in 2023, with the buildings sector being the largest contributor, accounting for 67%. However, due to its large population, per capita SIUS was 5.09 t/cap in 2023, lower than that of China. Spatial analysis reveals significant autocorrelation in per capita SIUS, with notable spatial heterogeneity in its density. Moreover, the average annual growth rate of SIUS is projected to decline from 10% in 2023 to 5% in 2060, suggesting that SIUS in Henan is approaching a saturation phase, consistent with theoretical expectations.

1. Introduction

Steel has become an indispensable material in modern industry because of its high strength, excellent toughness, and wide applicability. In recent decades, accelerated urbanization and industrialization in China have significantly increased steel consumption across various sectors [1]. To meet the growing demand, China has become the world’s leading producer and consumer of steel, accounting for 54% of global crude steel production in 2023 [2]. This increasing consumption has resulted in a large accumulation of steel-containing products in downstream sectors such as buildings, machinery, and others, known as steel in-use stocks (SIUS). SIUS can be recycled, processed, and reused after reaching the end of their lifetime, making them a key source of secondary resource recycling and utilization in the future. This can help reduce the demand for crude steel and lower the carbon footprint of steel products [3,4].
The 14th Five-Year Plan for the Development of Circular Economy [5] and Recycling of Waste Materials [6] both emphasize that it is important to increase the recycling rate of steel scrap. Scrap steel accounted for 65% of the major recycling recoveries in 2022 [7], making SIUS one of the key resources in the future. Therefore, accounting for SIUS can help to clarify the amount of scrap steel, and the spatial characteristics of SIUS can aid in the rational layout of the renewable resource processing industry. Thus, investigating the characteristics and quantity of SIUS is essential.
In general, two research approaches are commonly used to quantify steel flows and SIUS. The first is the top-down approach, which is mainly suitable for calculating SIUS at the national level. In this approach, SIUS is obtained by calculating the difference between the inflow and outflow steel. This approach is typically applied to estimate SIUS at the national level [3,8,9]. The second approach is the bottom-up approach, which involves collecting the quantity of steel products and the steel content per unit of products from the five sub-sectors [10,11]. Compared to the top-down approach, the bottom-up approach provides more detailed information about the distribution of SIUS in different sectors. Therefore, in this study, the bottom-up approach is used to calculate SIUS and forecast the future steel stocks, demand, and available scrap resources.
At present, most studies on SIUS primarily focus on the national level, such as the United States [8], China [12], and Japan [3]. Watari (2023) [13] found that SIUS in developed countries is significantly higher than in China. Additionally, some studies have examined the differences in SIUS among provinces and cities. Song et al. (2020) and Yu et al. (2020) used the bottom-up method to explore the heterogeneity of SIUS in 31 provinces [10,14]. Liu et al. (2019) studied the metal stocks of 10 megacities in China [15]. However, fewer studies provide in-depth analyses of the characteristics of the provinces with large SIUS and forecast steel demand based on stocks, which does not provide sufficient support for local policies.
Currently, research on the spatial characteristics of SIUS focuses primarily on the distribution characteristics. Song et al. (2020) found that the eastern zone has the largest share of SIUS by analyzing the total SIUS [14]. Yu et al. (2020) analyzed per capita SIUS and found that its distribution is highly uneven, with higher values in the eastern and coastal regions [10]. By systematically analyzing the spatial characteristics of SIUS, it is possible to identify the distribution patterns of iron and steel resources within different prefecture-level cities. The current analysis of SIUS’s spatial characteristics is relatively shallow. Incorporating a spatial autocorrelation model can better identify the clustering patterns of SIUS across different cities, which is crucial for optimizing the location and capacity planning of resource recovery bases [16]. Currently, the spatial autocorrelation model is primarily employed to examine the spatial correlation of carbon emissions [17,18,19], and few studies have analyzed the spatial correlation of SIUS.
Moreover, the relationship between stock and economy has attracted considerable attention [20,21,22]. Stock can directly demonstrate the physical basis of the economy [23]. Zhao et al. (2020) analyzed the decoupling relationship between SIUS and economic growth by using the decoupling index of resource consumption [24]. Current research shows that the relationship between SIUS and economic growth is complex [22], indicating the need to examine the decoupling relationship between SIUS and economic development. However, scholars typically focus on the decoupled state between the economy and the SIUS, and few studies reflect the role of relevant factors in the decoupling process.
In summary, existing studies have made significant progress in SIUS, but there are still areas that warrant further investigation: (1) Prior research on SIUS has primarily explored their spatial and temporal characteristics. However, relatively few studies have examined their relationships with future SIUS trends and material flows at the provincial level. (2) Most spatial studies of SIUS focus on characterizing distribution patterns, leaving the in-depth exploration of spatial features insufficient. Additionally, while the spatial autocorrelation model is widely used in research on carbon emissions, it has not been applied to analyze the spatial characteristics of SIUS, hindering a deeper understanding of regional interactions. (3) Most scholars have explored the decoupling state between the economy and SIUS, but the factors driving this process remain unexplored and unquantified.
To address existing research gaps, this study proposes a spatio-temporal characterization framework that integrates multiple models, including the bottom-up model, spatial autocorrelation model, Tapio–Logarithmic Mean Divisia Index (Tapio–LMDI) model, and stock-driven model. By combining temporal, spatial, and predictive analyses, this integrated framework offers a holistic perspective on SIUS. Building on previous research, the study further expands spatial analysis through the application of spatial autocorrelation models, enabling a deeper exploration of spatial patterns. In summary, this framework analyzes the spatio-temporal characteristics, decoupling relationships, and future trends of SIUS, providing a scientific basis for regional resource recycling strategies and policy development.
Henan Province is located in the central region and is an emerging industrial province. Previous studies have shown that the central region will become a major supplier of waste steel after 2040 [14], and Henan Province has the third-largest total SIUS in China [10]. Therefore, this study chose Henan Province as the research subject. The province consists of 18 cities with varying economic, demographic, and administrative characteristics, which prompted this study to explore the internal heterogeneity of Henan Province.
The paper is structured as follows. Section 2 describes the methods used in this study. Section 3 discusses the temporal and spatial characteristics of provincial SIUS over the years, the decoupling relationship and driving factors between SIUS and the economy, and the future steel stocks and scrap resources. Section 4 analyzes its uncertainty and puts forward policy suggestions. Finally, Section 5 presents the conclusion of this paper.

2. Materials and Methods

As shown in Figure 1, this study developed a comprehensive model designed to quantify and explore the characteristics of SIUS. First, the paper adopted a bottom-up approach to analyze the trends and characteristics of SIUS at the provincial and prefecture-level cities over different time scales. Second, the spatial autocorrelation model was used to explore the correlation and distribution characteristics of SIUS across cities. Third, a decoupling effort model was constructed by combining the traditional LMDI model and the Tapio model, which analyzed the decoupling state of SIUS and the economy and identified the key factors affecting decoupling. Finally, based on the historical steel stocks, this study forecasted future SIUS and available scrap resources.

2.1. Quantification of the Historical Steel Stocks

The time span of this study is 23 years (2000–2023), with all administrative districts of Henan Province as the spatial boundaries. Within these time and spatial boundaries, this study divides the steel terminal products into five major sectors, buildings, infrastructure, machinery, domestic appliances, and transportation facilities, and each industry is further divided into several subcategories (see Table S1). The bottom-up approach was applied to calculate SIUS by collecting information about final product stocks in Henan Province and material intensity [25], as illustrated by Equation (1):
S ( t ) = p j n P j M j
where S ( t ) represents the SIUS of the investigated area; P j represents the quantity of product j stocks; M j represents the steel content per unit of product j (see Table S2); p represents the five downstream sector p; and n represents the overall quantity of steel-containing products. The quantity of steel-containing products come from Statistical Yearbook [26,27,28,29], and the steel content parameters of related products mainly come from Song et al. (2020); Yu et al. (2020); and Wang et al. (2015) [10,14,30]. The steel stock calculations of each downstream sector are shown in Text S1.

2.2. Spatial Autocorrelation Analysis

Spatial autocorrelation represents a statistical approach used to measure the distribution characteristics and mutual relations of spatial data. There may be some dependence or similarity between data values in adjacent or close positions, and this dependence or similarity weakens or disappears as the distance increases. From a spatial perspective, global and local Moran’s I were used in the paper to analyze the differences in the distribution characteristics of per capita SIUS among different prefecture-level cities in Henan Province. In 1950, Moran introduced the global Moran’s I for the first time [31]. This statistic depicts the spatial autocorrelation across the entire research region. The formula for the global Moran’s I statistic is given below.
I G = i = 1 n j = 1 n i j ( x i x ) ( x j x ¯ ) S 2 i = 1 n j = 1 n W i j
where I G indicates the global Moran’s index; W i j is the value of each element in the spatial weight matrix; x ¯ is the average value of the attribute values of all cities; and W is the sum of the spatial weights.
The value of Moran’s I varies between −1 and 1 and is positively spatially correlated when it is greater than 0. The greater the value, the more pronounced the spatial correlation. When the value is less than zero, it indicates a spatially negative correlation [32]. The Z-score tests the significance of this index. If the Z-score is close to 0, there is no significant clustering. A positive Z-score indicates clusters with high attribute values and vice versa for clusters with low attribute values. However, only when the outcome of the significance test shows p < 0.05 does it imply that the value of the research target exhibits significant spatial autocorrelation. In this case, the value of Moran’s I is statistically significant.
To improve the accuracy of the identified region, Anselin (1995) put forward the local Moran’s index (Ii), which effectively evaluated the correlation between each area and adjacent areas [33]. The formulas are given below.
I i = ( x i x ¯ ) S 2 j W i j ( x i x ¯ )

2.3. Decoupling Analysis Between SIUS and Economic Growth

According to the overall idea of the Tapio decoupling model, the decoupling elasticity indicator between SIUS and economic growth (measured by Gross Domestic Product (GDP)) can be expressed as
e ( M S , G D P ) = ( M S Y M S 0 ) M S 0 ( G D P Y G D P 0 ) G D P 0
where e ( M S , G D P ) represents the decoupling coefficient between SIUS and economic development; M S Y and M S 0 refer to SIUS in the final period Y and the baseline period 0; and G D P Y and G D P 0 represent economic development in the final period Y and the base period 0.
The Tapio model primarily addresses the decoupling relationship between SIUS and GDP, but it does not identify the underlying factors driving this change. Economic growth, population dynamics, and technological progress are key determinants of social integration. To extend the Tapio model, this paper introduces the IPAT (Impact–Population–Affluence–Technology) equation. The decoupling factors in this study are categorized into three dimensions: population size, affluence, and technology. The contributions of these three factors are quantified using the LMDI model. Therefore, this paper integrates the IPAT equation, LMDI decomposition, and Tapio model to thoroughly analyze the underlying reasons behind the changes in the decoupling relationship [34,35,36].
The IPAT equation is expressed in Equations (S4) and (S5), and changes in SIUS from year 0 to year R can be represented by Equation (S6) using the LMDI method, see Text S2. The factors M S T , M S A and M S P represent the impacts of technology, affluence and population scale on the changes in SIUS, respectively. By integrating the Tapio model, the decomposition of e(MS, GDP) is attributed to three primary drivers: e T , e A and e P (Equations (5)–(7)), corresponding to technology, affluence, and population scale factors.
e M S , G D P = ( M S r + M S A + M S P ) / M S 0 G D P / G D P 0
e M S , G D P = G D P 0 M S 0 G D P M S T + G D P 0 M S 0 G D P M S A + G D P 0 M S 0 G D P M S P
e M S , G D P = e T + e A + e P

2.4. Prediction of Future SIUS and Flows

Empirical evidence from major developed countries that have completed industrialization and urbanization shows that SIUS, particularly per capita SIUS, follows an S-shaped growth trajectory. The logistic curve, being the most widely adopted model for such sigmoidal growth patterns [23,37,38], is employed in this study to estimate future per capita SIUS across downstream sectors ( S p ( t ) ) (Equation (8)). To fit this model using historical stock data, it is common to first externalize the value of K to reflect expectations of future socio-economic levels of material metabolism. The setting of K in this study is based on Lin et al. (2023) and Song et al. (2020) (Table S4) [14,39]. Finally, by fitting historical trends and considering the population development trends, the SIUS are predicted.
S p ( t ) = K 1 + m × e a ( t t 0 )
S ( t ) = p S p ( t ) × P ( t )
where p represents the downstream sectors; m and a are the parameters of the logistic curve fitted based on historical values; and P ( t ) represents the population in year t, million persons.
The total recyclable scrap steel (TS) is mainly divided into three categories: Home Scrap (HS), Process Scrap (PS) and Depreciated Scrap (DS). HS is the scrap produced in the production of steel, whereas PS refers to the scrap produced at each stage of steel product manufacturing and processing. DS refers to the scrap steel that exceeds its service life in steel products, which can be obtained from the stock-driven model (see Text S3). The calculation of scrap resources is as follows:
H S ( t ) = ε F i n ( t )
P S ( t ) = ρ S P ( t )
D S ( t ) = γ p F o u t ( t ) = γ p t t F i n ( t ) × λ ( t ) , ( t t )
T S ( t ) = H S ( t ) + N W ( t ) + D S ( t )
where F i n ( t ) represents the total steel inflow from the steel system of each downstream sector p in t year, Mt; α represents the recovery rate of H S , which is about 5% [40]; S P ( t ) represents the steel production, Mt; β represents the recovery ratio of P S , approximately 6% [41]; F o u t ( t ) represents the outflow from the steel system after the end of the service life of steel products, Mt; and γ indicates the recovery ratio of D S from the downstream sector p [41]. See Table S4.

3. Results

3.1. The Temporal Characteristic of SIUS

3.1.1. Total SIUS in 2000–2023

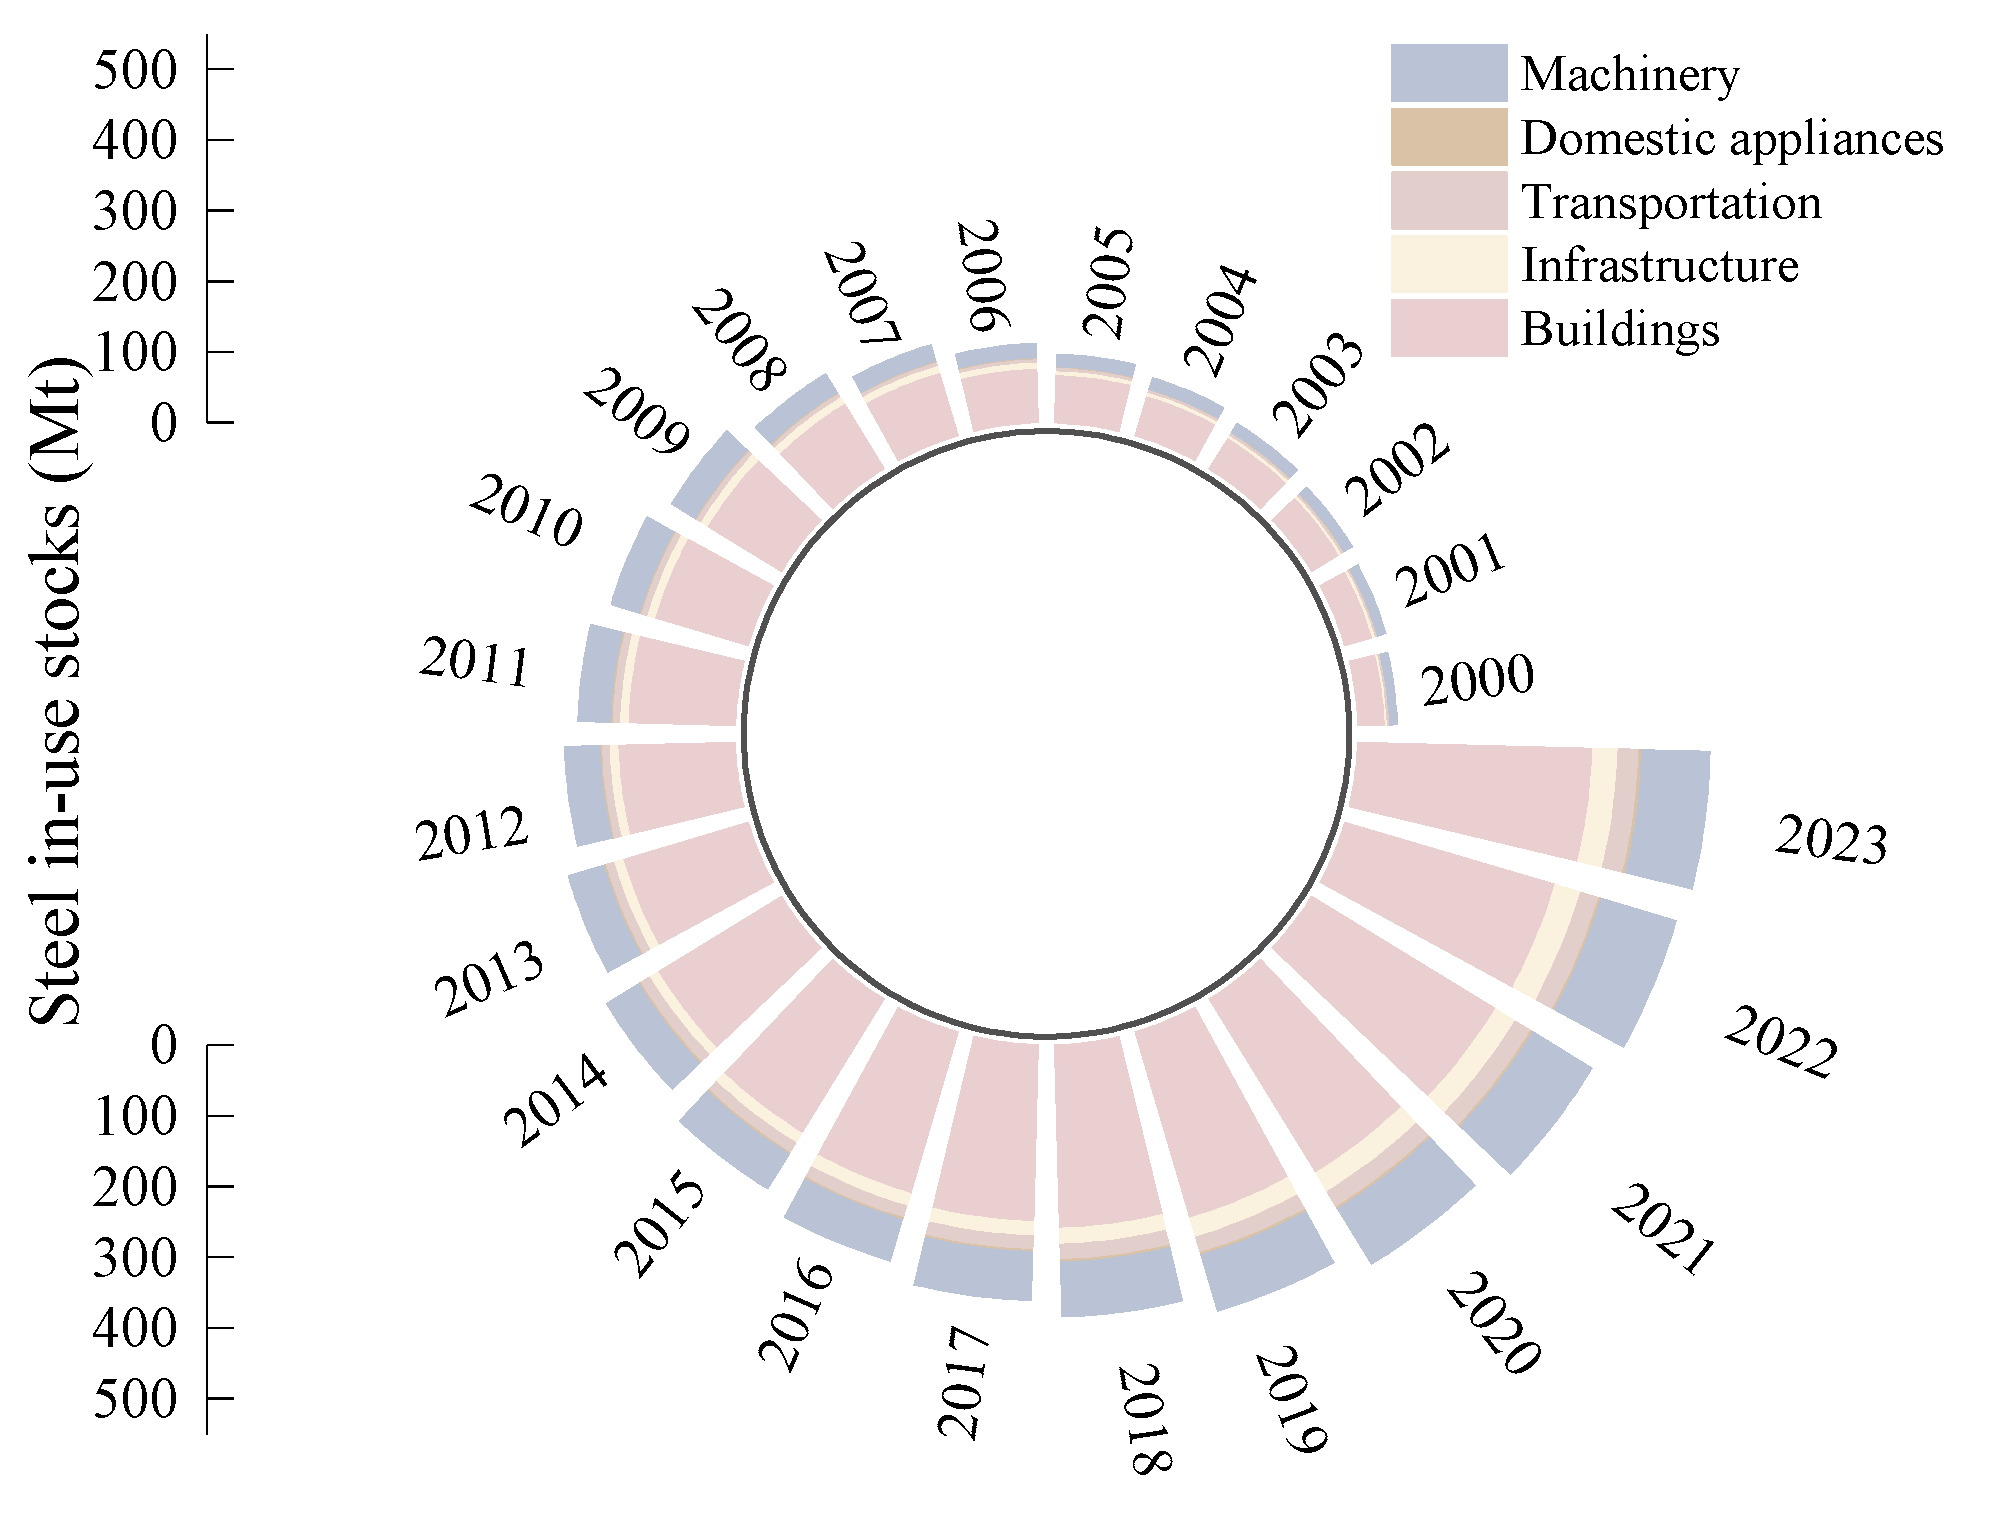
Figure 2 presents the SIUS valuation results for Henan Province. The findings reveal that total SIUS increased from 53.41 Mt in 2000 to 499.35 Mt by 2023, exhibiting an average annual increase rate of 10%. Among the five downstream sectors, the building sector holds the largest share of SIUS, accounting for 67% of the total in 2023. With rapid urbanization, SIUS in the buildings sector in Henan Province continued to grow, from 37.11 Mt to 332.62 Mt. The second downstream sector is the machinery sector, which experienced significant growth from 9.89 Mt in 2000 to 97.37 Mt in 2023, maintaining an average annual expansion rate of 10%. The remaining three sectors (infrastructure, transportation, and domestic appliances) have smaller proportions of the total SIUS, not exceeding 14% in 2023.

3.1.2. Specific Distribution of SIUS

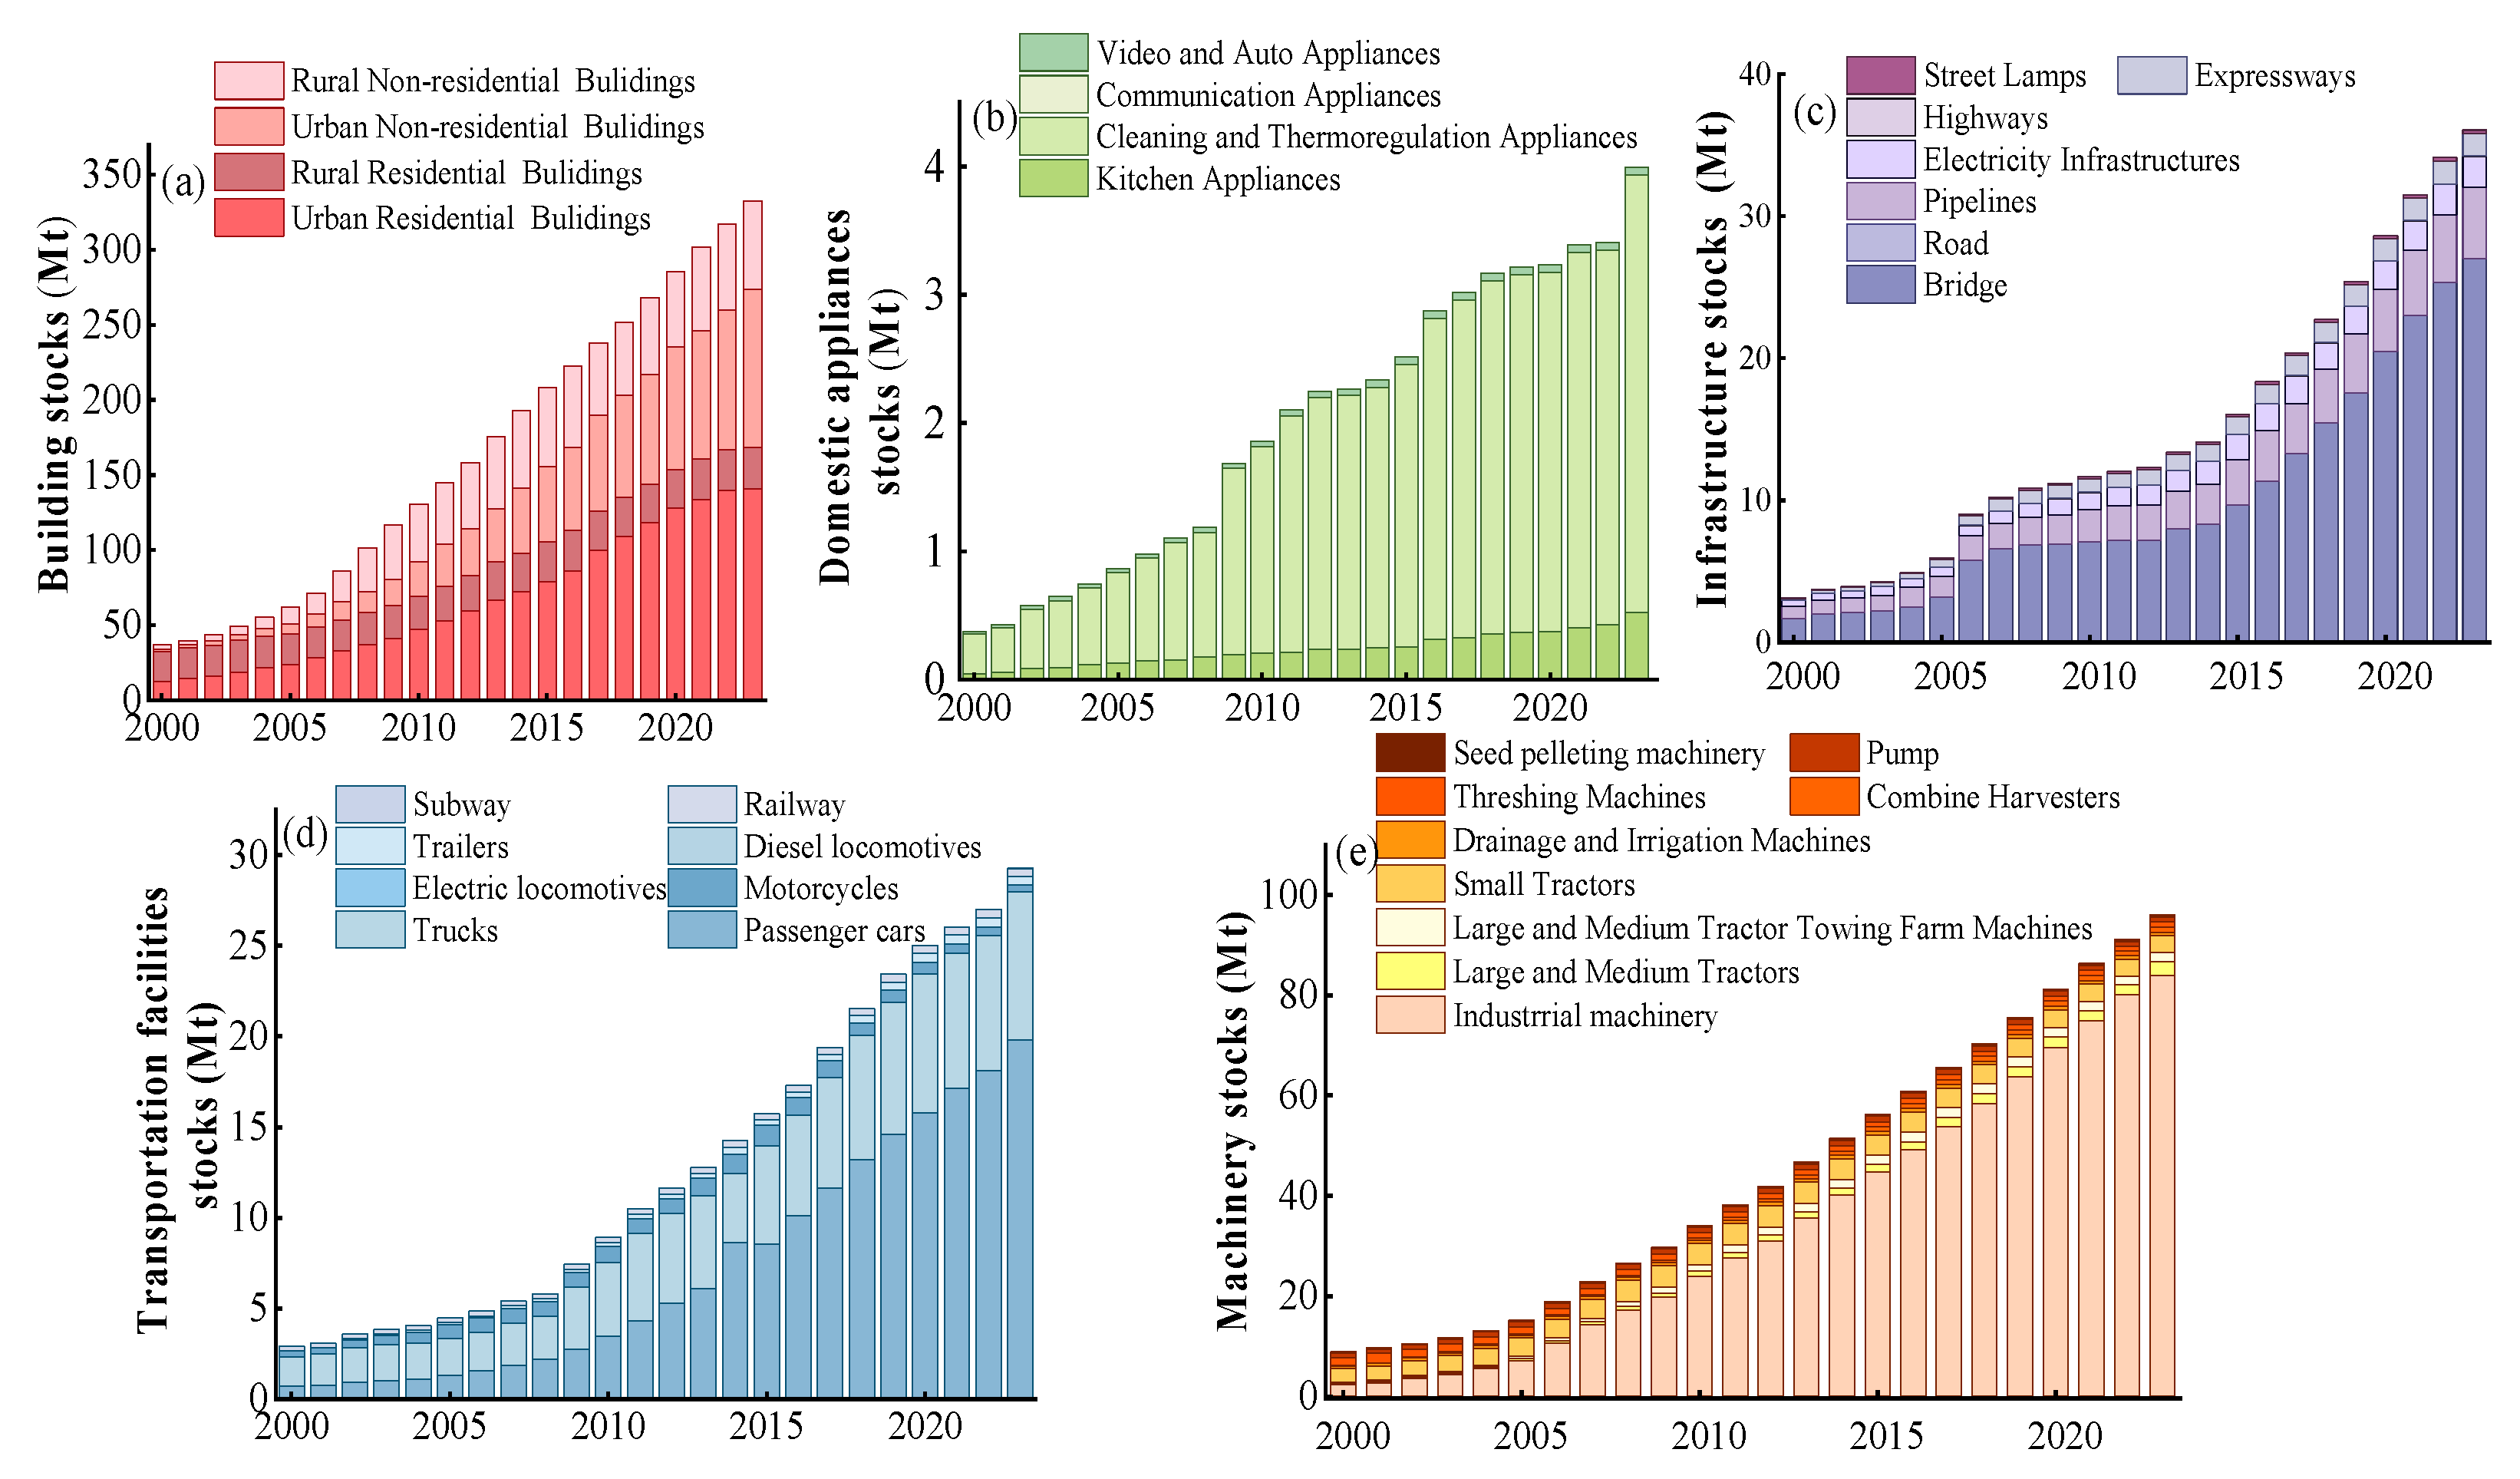
The buildings sector holds the largest share of SIUS, comprising both residential and non-residential buildings. On average, residential and non-residential building stocks make up 42% and 27% of the total SIUS, respectively. Since the 10th Five-Year Plan, SIUS in urban residential buildings increased due to the migration of the rural population to urban areas. Consequently, urban residential buildings became the most significant accumulation sector for SIUS (Figure 3a), with a proportion ranging from 34% to 42%. This was followed by urban non-residential buildings stocks, which accounted for 21% of the total buildings sector in 2023.
Figure 3b illustrates the evolution of SIUS in the domestic appliances sector, which grew significantly from 0.38 Mt in 2000 to 3.97 Mt in 2023. Driven by rising living standards since the reform and opening-up period, domestic appliances (primarily cleaning and thermoregulation devices) have become essential to daily life, comprising 85% of the sector’s SIUS in 2023.
In the infrastructure sector, SIUS increased significantly from 3.13 Mt to 36.09 Mt during 2000–2023. Among all components in the infrastructure domain, the bridge emerged as the most substantial element of SIUS (Figure 3c). During 2000–2023, SIUS in the bridge increased from 1.69 Mt to 27.05 Mt. This prominence is attributed to the high steel strength of bridges, which provides superior structural stability and durability. This is followed by pipelines and electricity infrastructures, accounting for 14% and 4% of the total sector in 2023.
As shown in Figure 3d, the stocks of passenger cars and trucks represent a significant proportion of the transportation sector. Passenger car stocks have been growing faster, with an average annual growth rate of 16% from 2000 to 2023. The number of cars (especially passenger cars) increased since the late 2000s, accounting for 68% of the total sector. This is followed by truck stocks, which account for 28% of the total sector in 2023.
Between 2000 and 2023, the share of the machinery sector increased from 18% to 20%, making it the second-largest downstream sector for SIUS. It consists mainly of industrial and agricultural machinery. Industrial machinery holds the largest share, accounting for 81% of the total sector in 2023 (Figure 3e). Agricultural machinery includes nine primary types of equipment. Among them, small tractors’ SIUS account for the largest proportion of the whole agricultural machinery sector, at 25%.

3.1.3. Per Capita SIUS

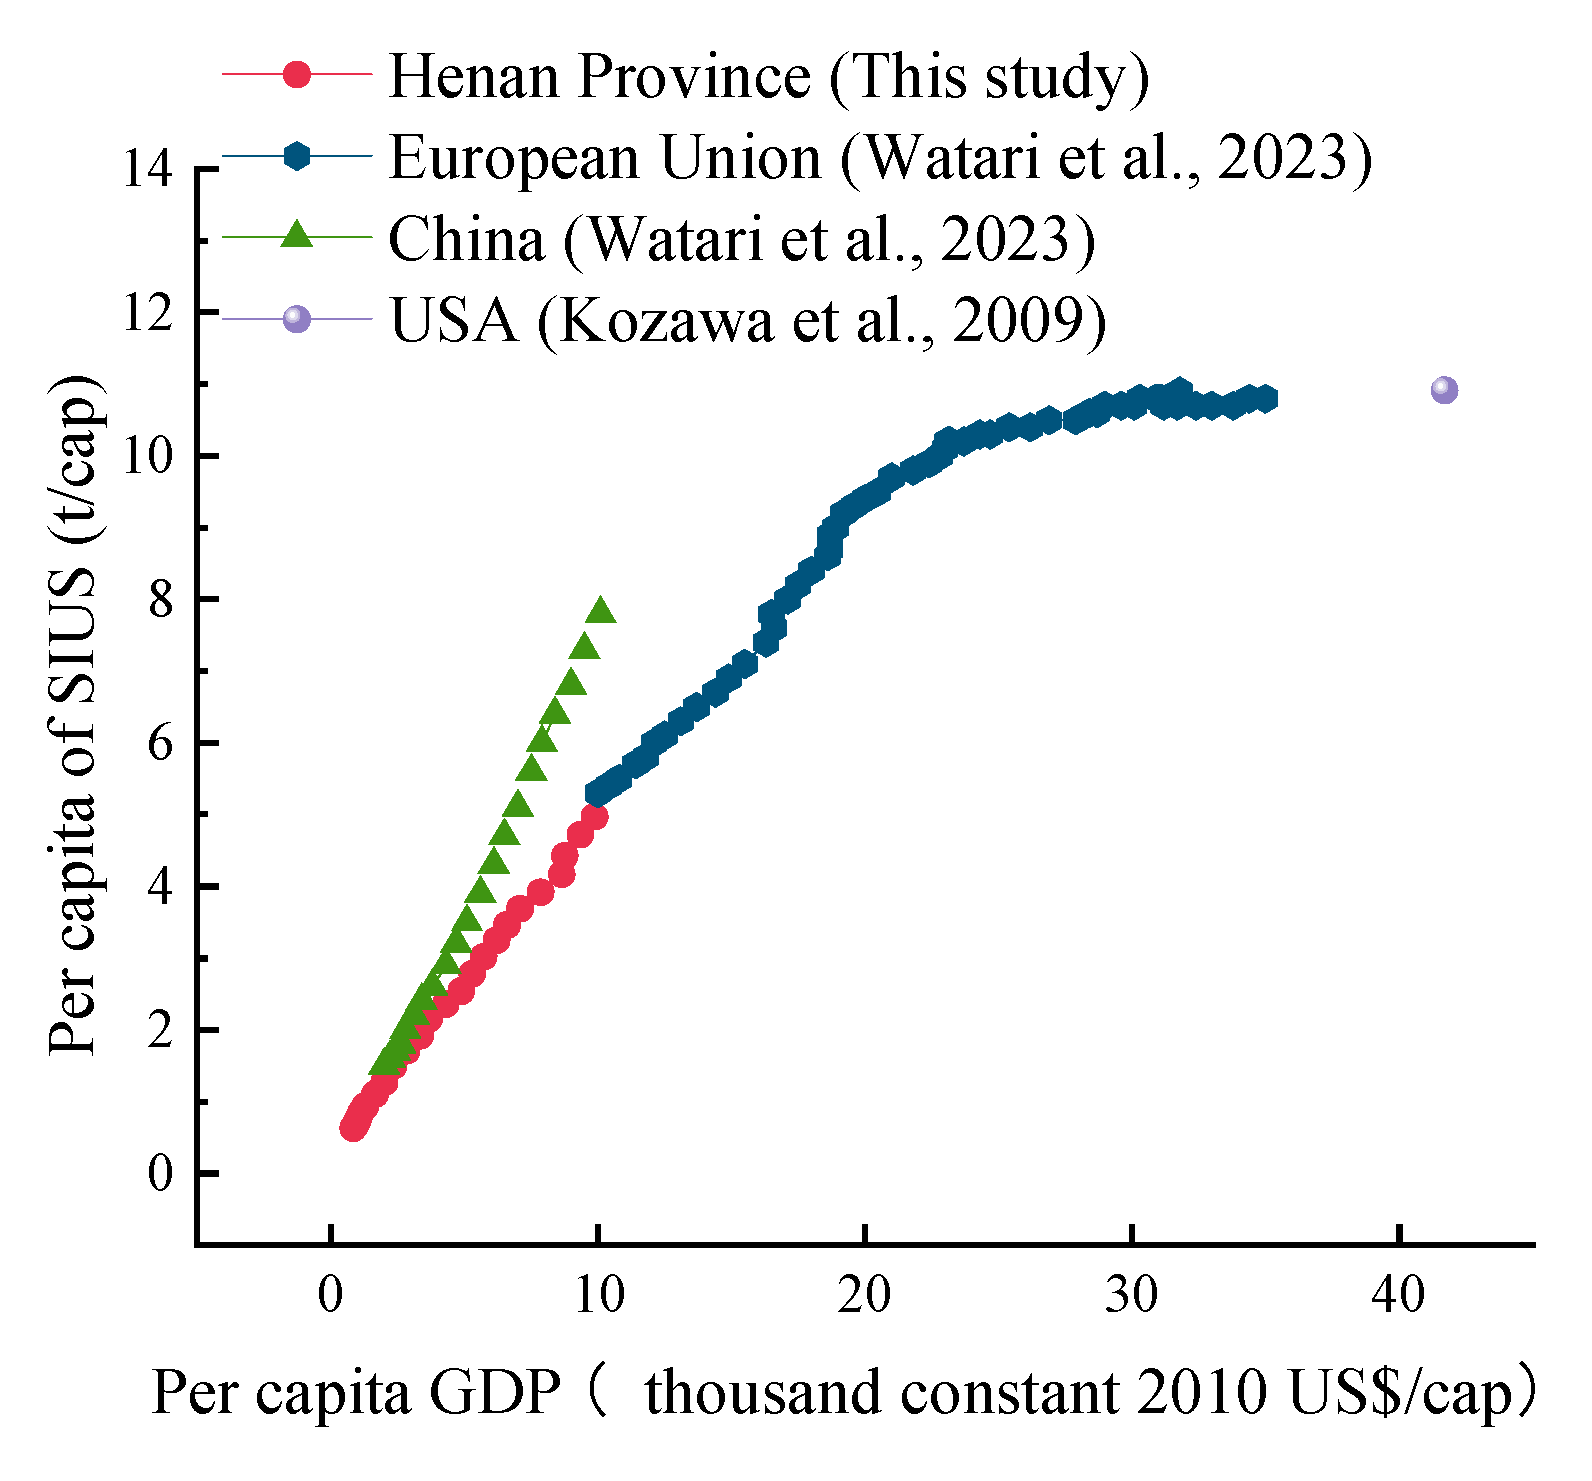
In Henan Province, the per capita SIUS grew from 0.56 t/cap in 2000 to 5.09 t/cap in 2023, reflecting an annual growth rate of 10%. As shown in Figure 4, the growth in per capita SIUS is positively correlated with the growth in per capita GDP. Currently, per capita SIUS in China is experiencing rapid growth. However, the per capita GDP of Henan Province is lower than China, its growth rate is slower than China.
Compared to developed countries, the EU’s per capita SIUS has gradually reached a saturation state, exceeding 10 t/cap [13]. This means that despite continued growth in per capita GDP, per capita SIUS remains stable. The USA reached saturation in 2004, approaching 11 t/cap [42], and its per capita GDP is much higher than China’s. China’s per capita GDP and SIUS lag behind those of developed countries. Similarly, Henan Province lags behind China as a whole. This gap indicates significant potential for future growth in per capita SIUS in Henan Province as the economy develops.

3.2. The Spatial Characteristic of SIUS

3.2.1. The Spatial Distribution of SIUS for 18 Prefecture-Level Cities in Henan

Henan Province comprises 18 prefecture-level administrative divisions. There are differences in the total amount and sectoral composition of SIUS in prefecture-level cities (See Figure S1). ZZ, the capital city of Henan Province, has the largest GDP, accounting for 21% of the province’s GDP. Therefore, its SIUS is the largest, accounting for 15% of the province. In addition to ZZ, the SIUS of XX, NY, ZMD and LY also have a high share of SIUS in the province, with 8.3%, 8%, 7.5% and 7%, respectively. Including ZZ, the top five regions account for 45% of the total stock in the province. In addition, the prefecture-level city with the lowest SIUS is JY, accounting for only 1% of the province, followed by LH, with 8.85 Mt.
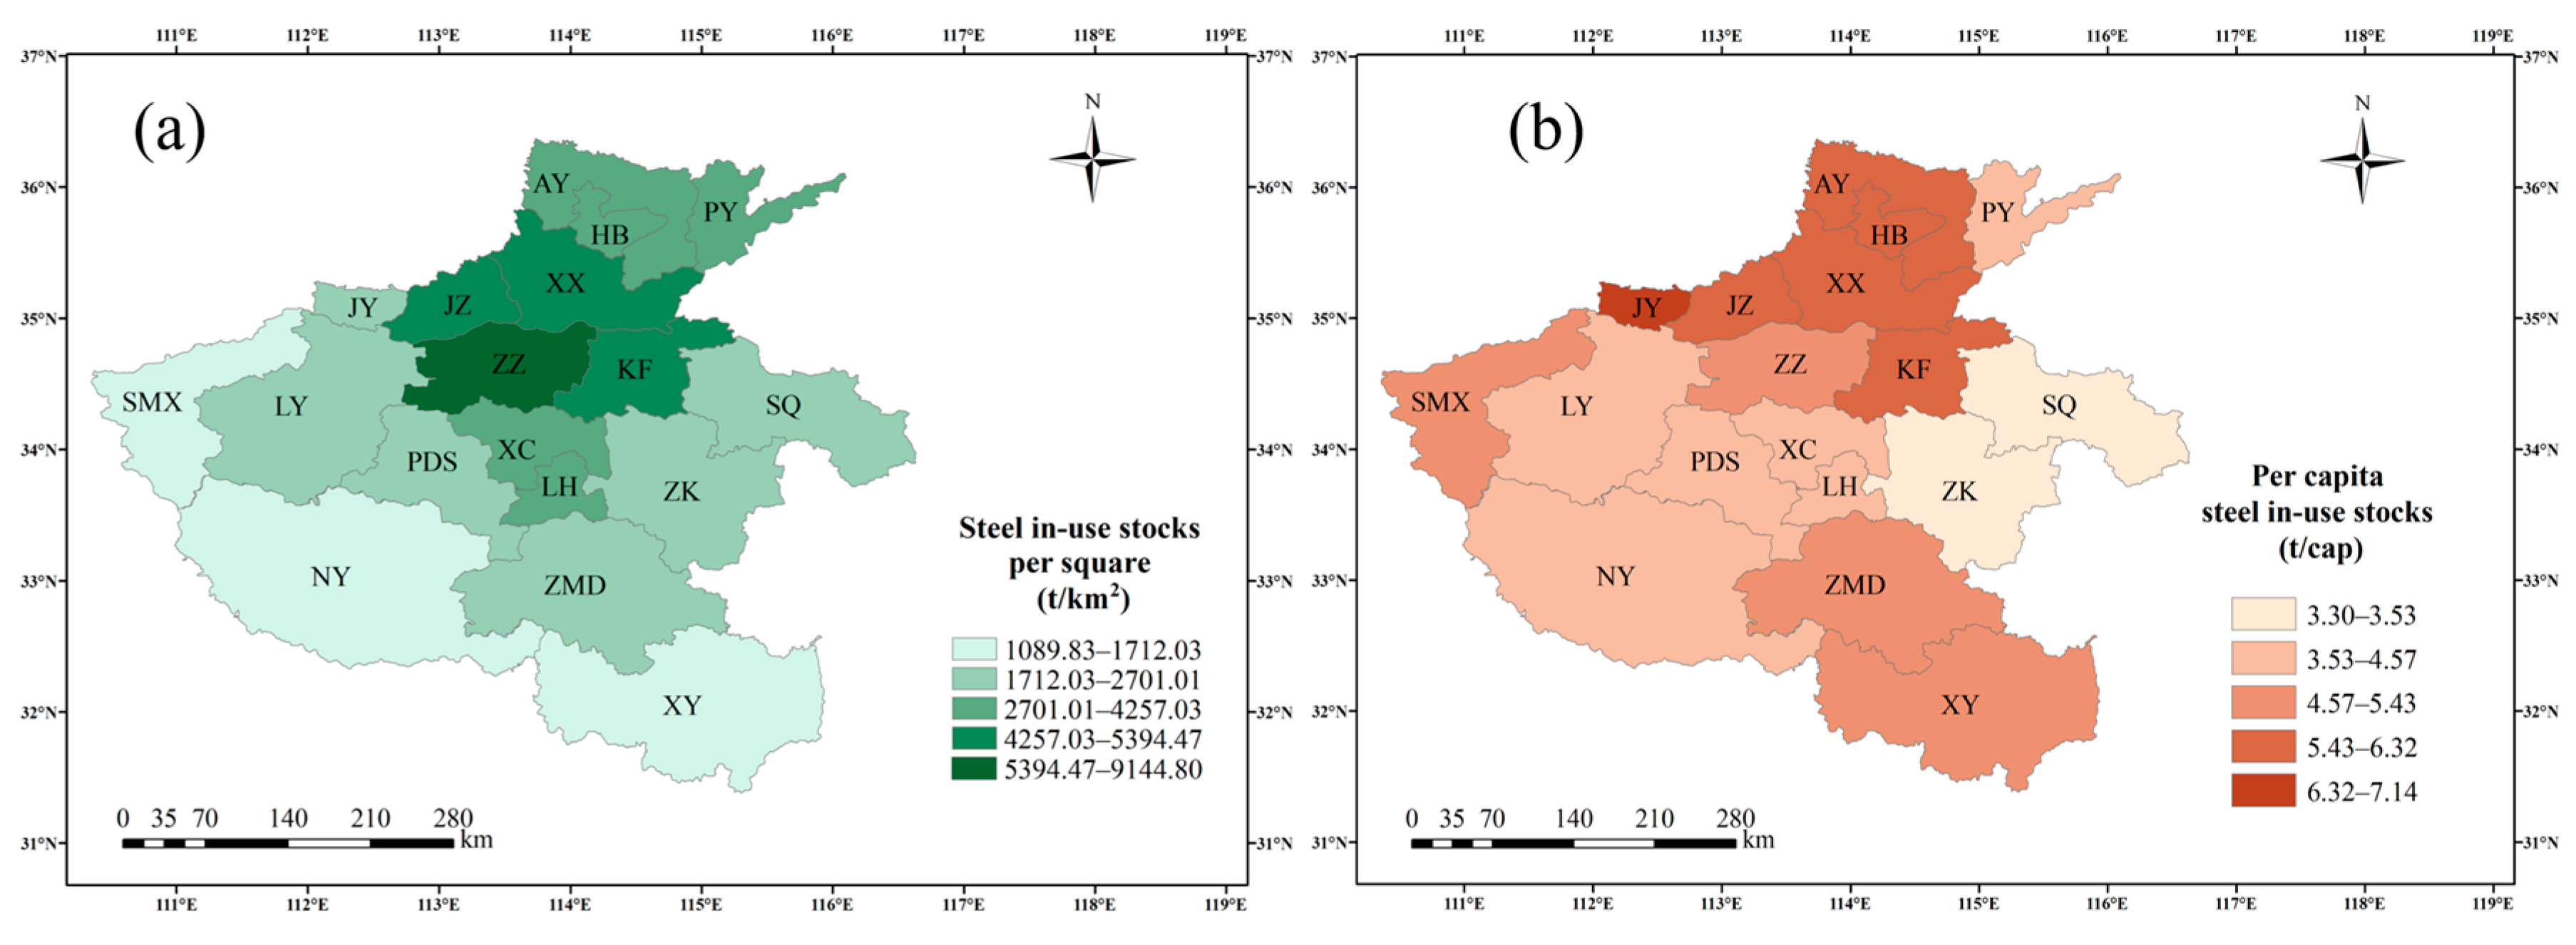
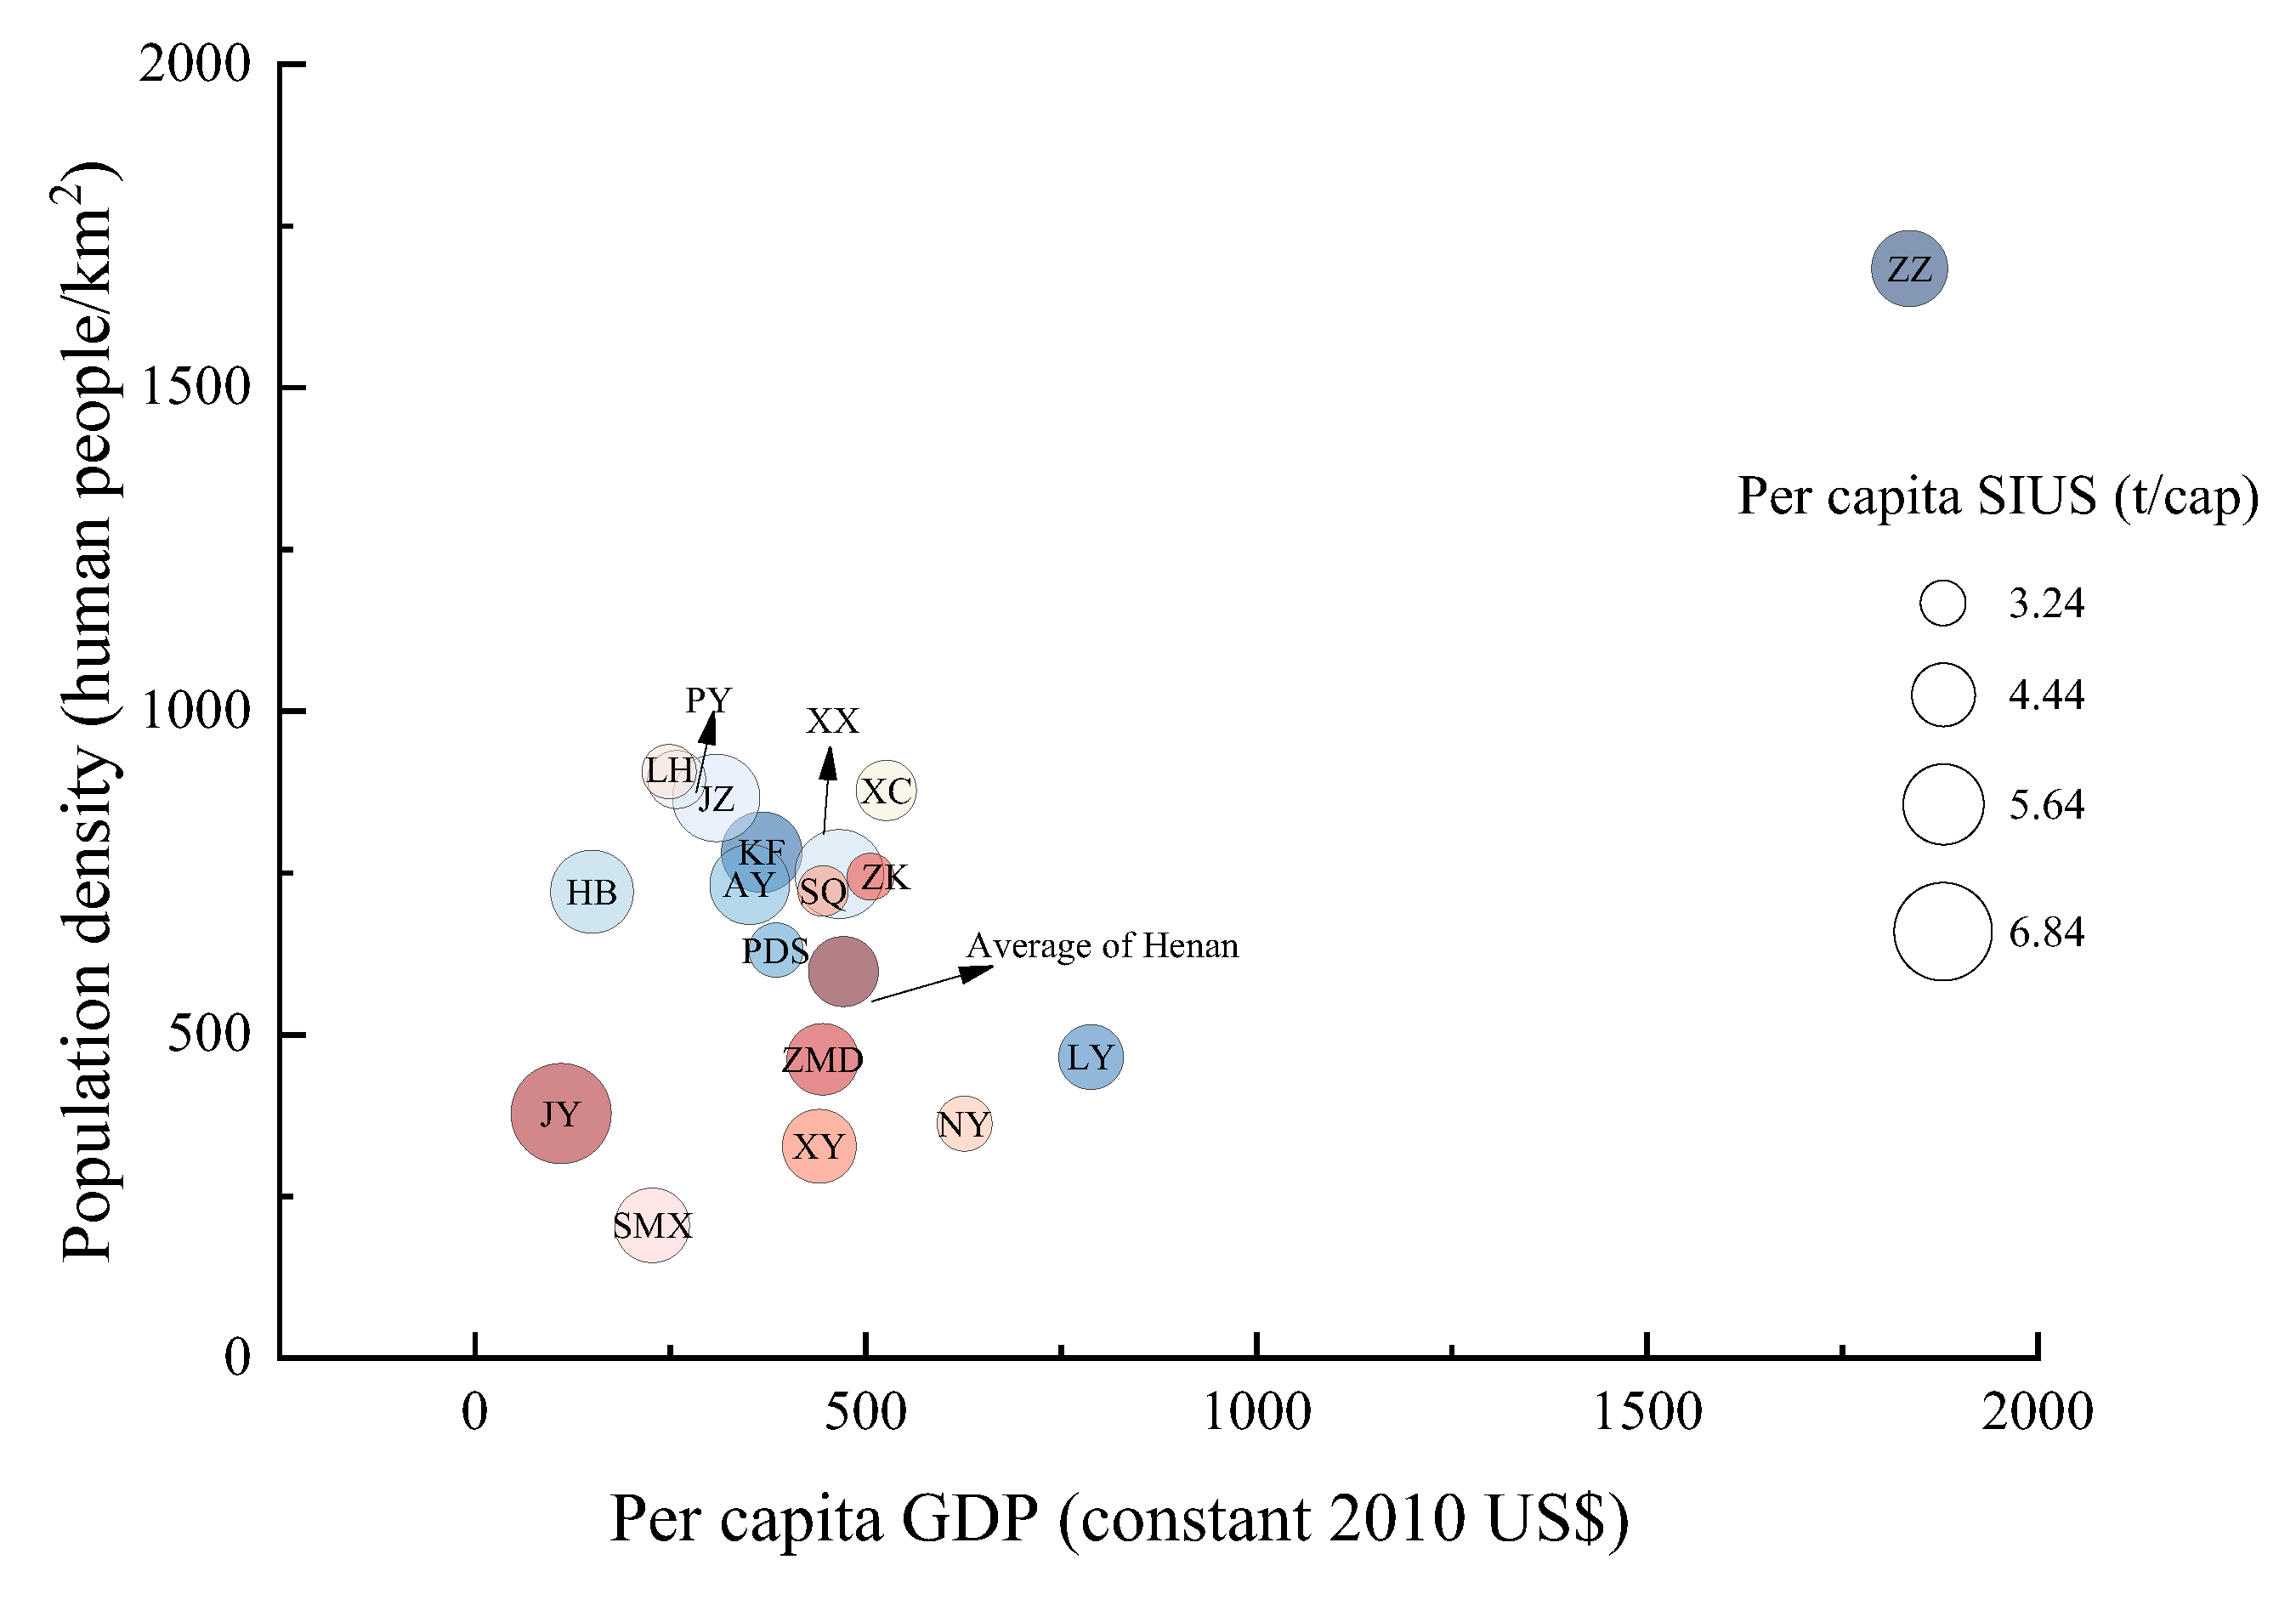
The spatial distribution pattern of SIUS in prefecture-level cities across Henan Province is depicted in Figure 5. From the spatial distribution pattern, it is evident that regions with high SIUS density correlate strongly with large populations and a high per capita GDP (Figure 6). For steel stock density, the SIUS density in Henan Province is 2723.68 t/km2. Among all cities, ZZ ranks first in the province in GDP, making it the city with the highest SIUS density, which is 8855.35 t/km2. The SIUS density of ZZ is 8.39 times that of SMX, which is the least dense city. For steel stock per capita, the per capita SIUS in Henan Province is 4.56 t/cap. Among the cities, the city with the largest per capita SIUS is JY, reaching 6.92 t/cap, mainly because JY has the smallest population in Henan Province. The city with the lowest per capita SIUS is ZK (3.24 t/cap), mainly because ZK has the lowest per capita GDP in the province. Comparing the coefficient of variation (CV) between these two data sets, the data for per capita SIUS present a CV of 22%, and the density of SIUS presents a CV of 54%. This finding indicates the spatial heterogeneity within the prefecture-level cities of Henan in terms of steel stocks’ density.
In-use stocks not only satisfy societal needs but also serve as a driving force for material recycling [40]. China’s Recycling of Waste Materials policy [6] emphasizes the need to optimize the industrial layout of resource recycling based on resource endowment, industrial distribution and waste characteristics. Differences in the quantity and types of scrap steel in prefecture-level cities in Henan Province are closely related to the variability in the distribution pattern of SIUS. Consequently, it is essential to consider the spatial distribution of SIUS in order to optimize the recycling layout of scrap steel resources. Both SIUS density and per capita SIUS in prefecture-level cities provide critical indicators for optimizing the future layout of scrap resources.

3.2.2. Spatial Autocorrelation Analysis of SIUS

In this paper, Moran’s index was employed to test the spatial correlation of per capita SIUS. Initially, a global Moran’s index analysis was conducted on per capita SIUS in Henan Province in 2023, based on prefecture-level cities. The results indicated that Moran’s index was 0.47 and the Z-value was 2.75 (p < 0.001), suggesting a significant spatial positive correlation of per capita SIUS among prefecture-level cities. The overall distribution was clustered, with high- and low-growth areas neighboring other cities with high and low growth levels, respectively.
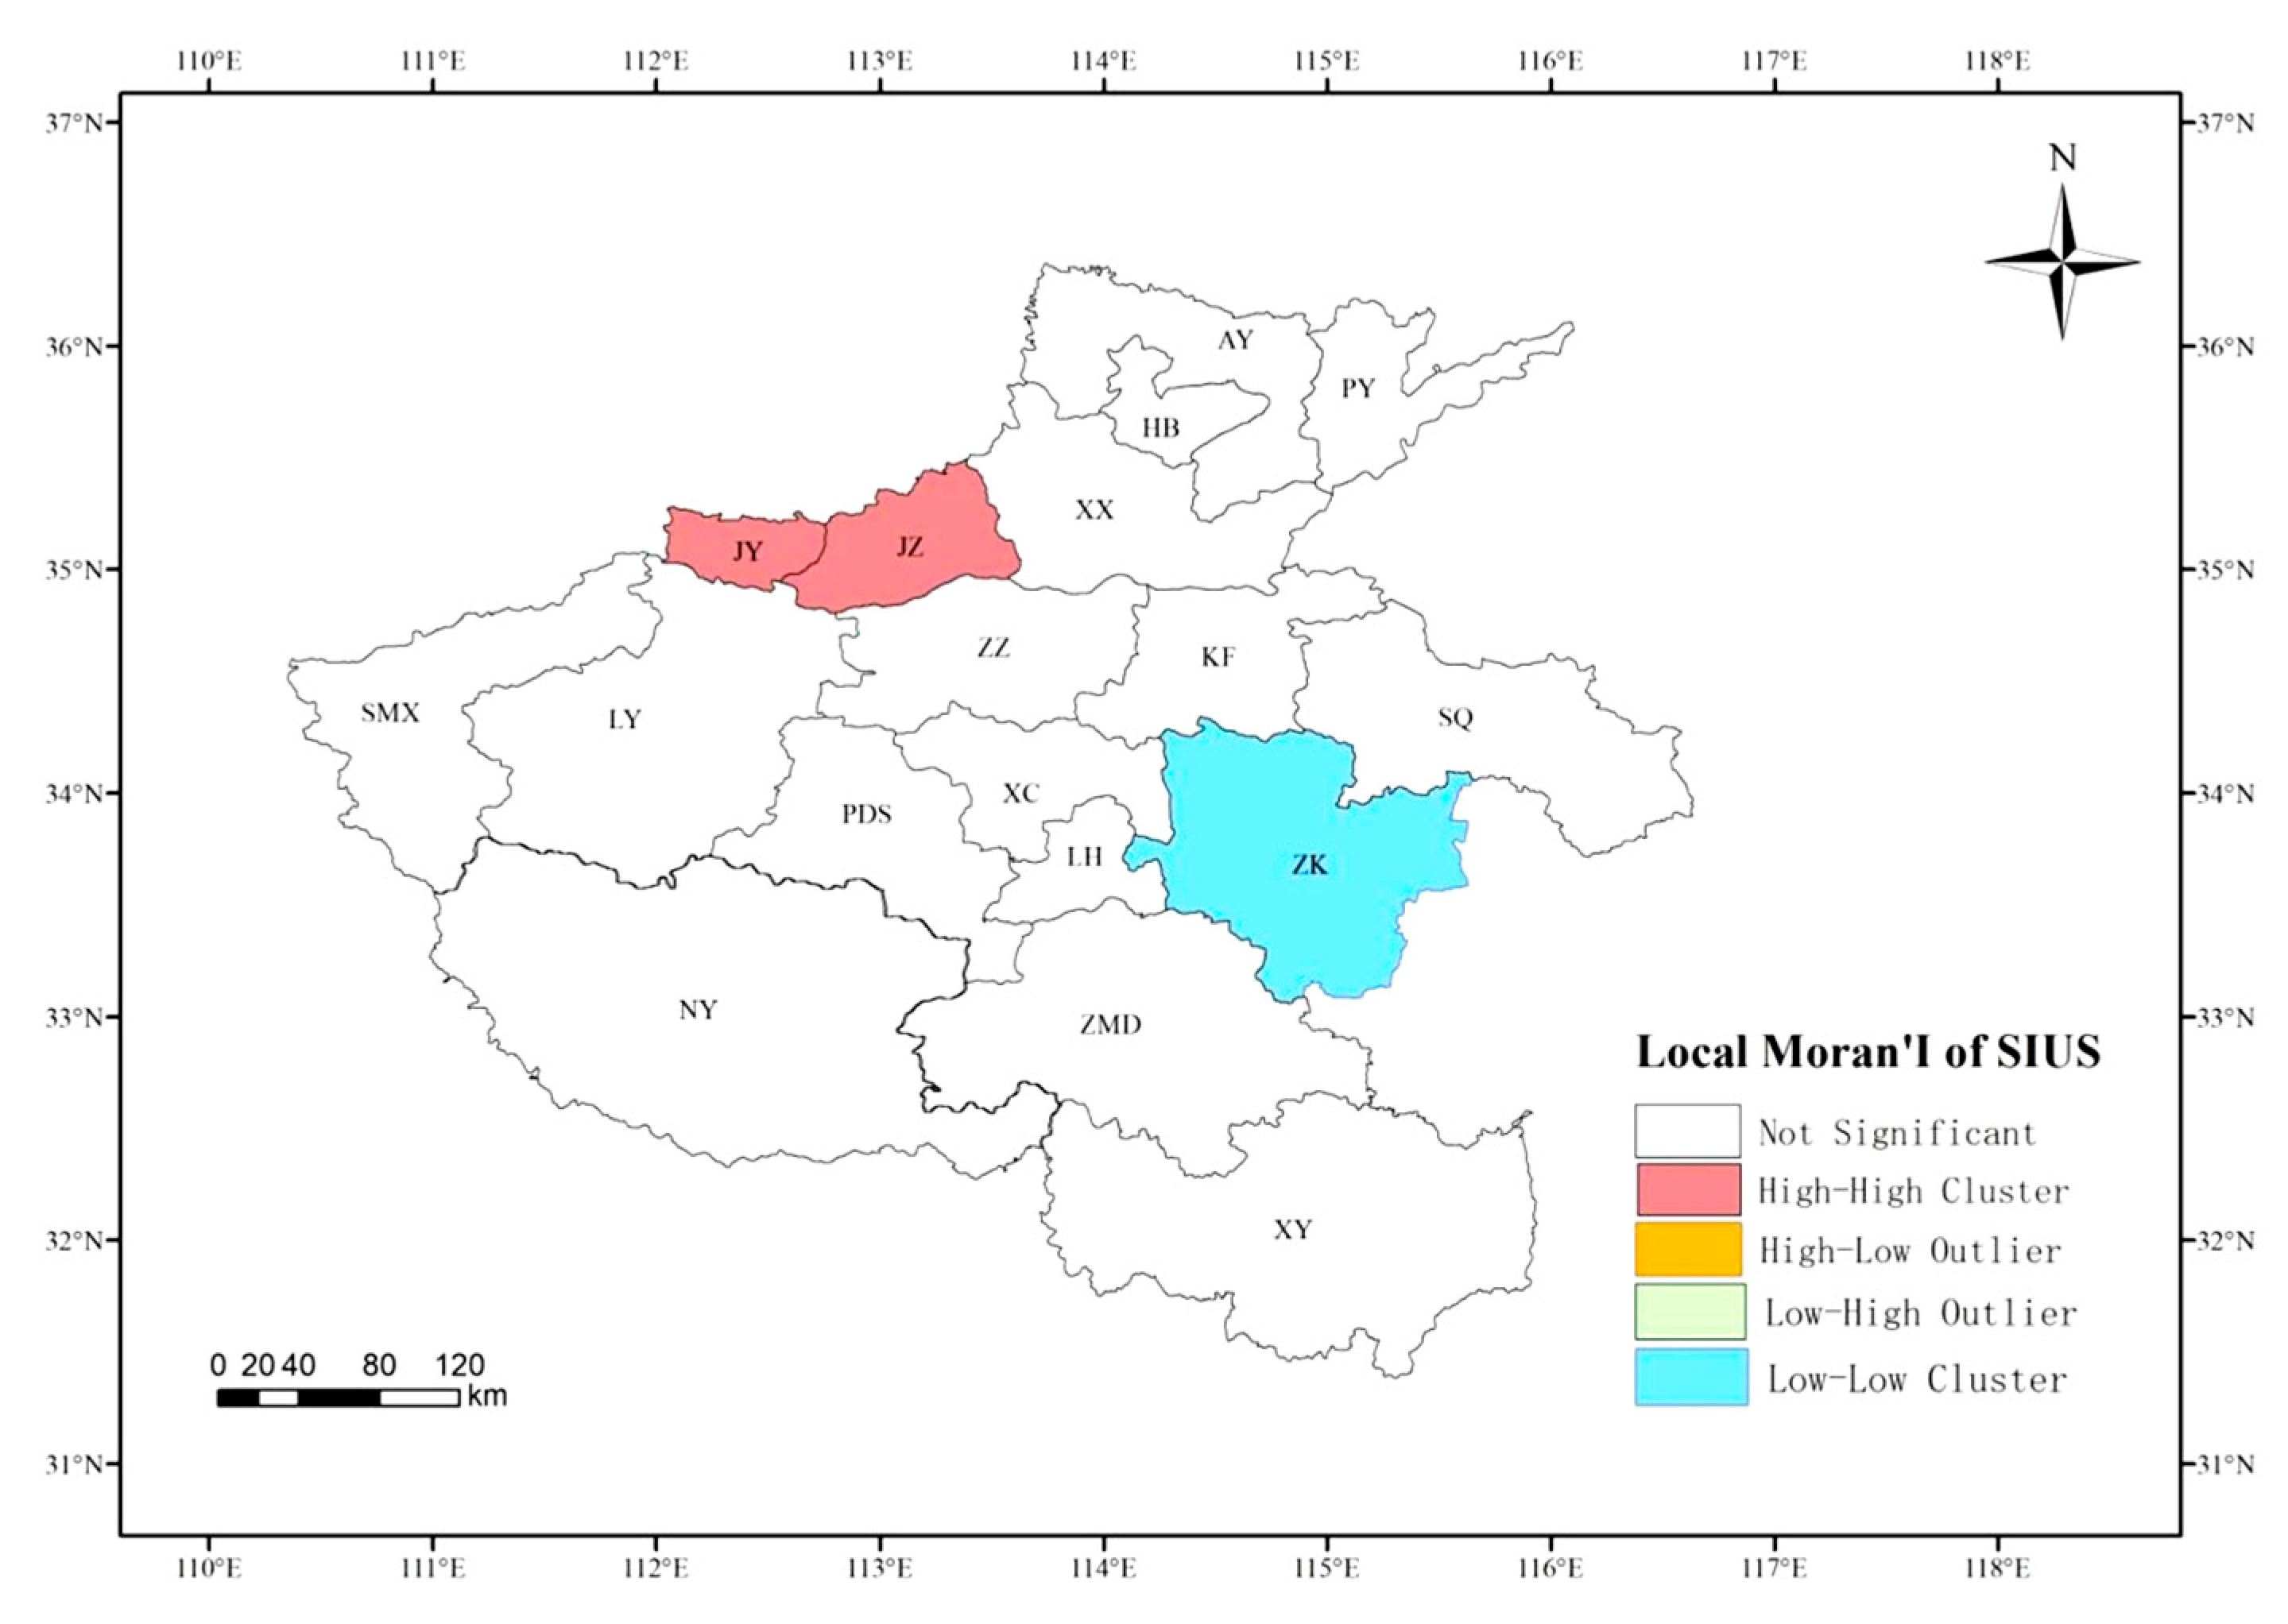
Next, local spatial autocorrelation of per capita SIUS was tested. As shown in Figure 7, the high–high agglomeration pattern of per capita SIUS was clear: regions with large per capita SIUS were surrounded by other regions with similarly high per capita SIUS. High–high agglomeration areas were primarily clustered in JZ and JY, while low–low agglomeration areas were mainly found in ZK.

3.3. Decoupling Analysis

Based on the five-year plan, Henan’s SIUS were decoupled in five phases. Table 1 shows the decoupling index between Henan’s SIUS and the economy. From 2000 to 2023, both GDP and SIUS maintained a growth trend (i.e., ΔGDP/GDP > 0; ΔMS/MS > 0). The decoupling index continued to increase to 0.65, but it showed a downward trend after the 11th Five-Year Plan. This result indicates that SIUS and economic growth are in a state of weak decoupling, with the correlation between economic growth and SIUS gradually weakening. This means that during this phase, while economic growth continued, the growth rate of SIUS slowed in comparison to GDP growth. Since the 21st century, China’s rapid industrialization and urbanization have stimulated both economic and SIUS growth. However, with technological advancements, progress in the circular economy, and adjustments in industrial structure, the close relationship between economic growth and SIUS has weakened, thereby mitigating environmental pressures.
In order to further clarify the internal factor of the change in the decoupling index, the Tapio–LMDI model was used to decompose the decoupling index. And the decoupling index can be divided into three factors (See Figure 8):
(1)
The affluence factor is the most significant disincentive to decoupling. Its contribution to the decoupling index reached 0.51 during the 10th Five-Year Plan period but sharply dropped to just 0.008 in the early 14th Five-Year Plan period. According to the Outline of China’s 14th Five-Year Plan, China’s economy should maintain an average annual growth rate of above 5% in the second half, while Henan’s 14th Five-Year Plan has set a target of 6%. This suggests that the driving role of affluence will be weakened. Although the affluence factor is declining, it remains an important factor influencing decoupling.
(2)
The population scale factor exerts a noticeable inhibitory effect on the decoupling state, although its influence on the decoupling elasticity index is relatively weak. Overall, this effect has demonstrated a downward trend over time. The effect of the population scale factor is predominantly demonstrated through rural–urban migration. With the aim of accommodating more people, the government needs to build large quantities of buildings and infrastructure, thereby increasing resource consumption. Henan’s population has been on an upward trend, growing from 94.66 million in 2000 to 99.41 million in 2020, and then declining to 98.15 million in 2023. Notably, during the transition from the 13th to the early 14th Five-Year Plan periods, a population decrease of 1.66 million occurred. This decline in population scale alleviated the pressure on resource consumption, effectively promoting the decoupling process. Consequently, the population scale factor might contribute to achieving decoupling in the future.
(3)
The technological factor positively drives the decoupling process, despite its contribution rate being −5%. As Dai et al. (2023) noted, the decrease in the utilization intensity of SIUS is quantified as a negative value in the model [43]. This seemingly contradictory negative value actually reflects improved efficiency in steel resource utilization. As illustrated in Figure S2, the utilization intensity of SIUS has been on a downward trend, decreasing by 24% annually. This decline evidently shows that technological advancements have facilitated more efficient utilization of SIUS, thereby reducing the steel requirement per unit of economic output. The negative contribution rate, rather than indicating ineffectiveness, precisely underscores the pivotal role of technological progress in offsetting the growth in steel consumption induced by other factors, thereby accelerating the decoupling process. To further strengthen the positive influence of the technological factor on decoupling and promote more sustainable utilization of steel resources, continuous innovation and the adoption of advanced production techniques are essential.
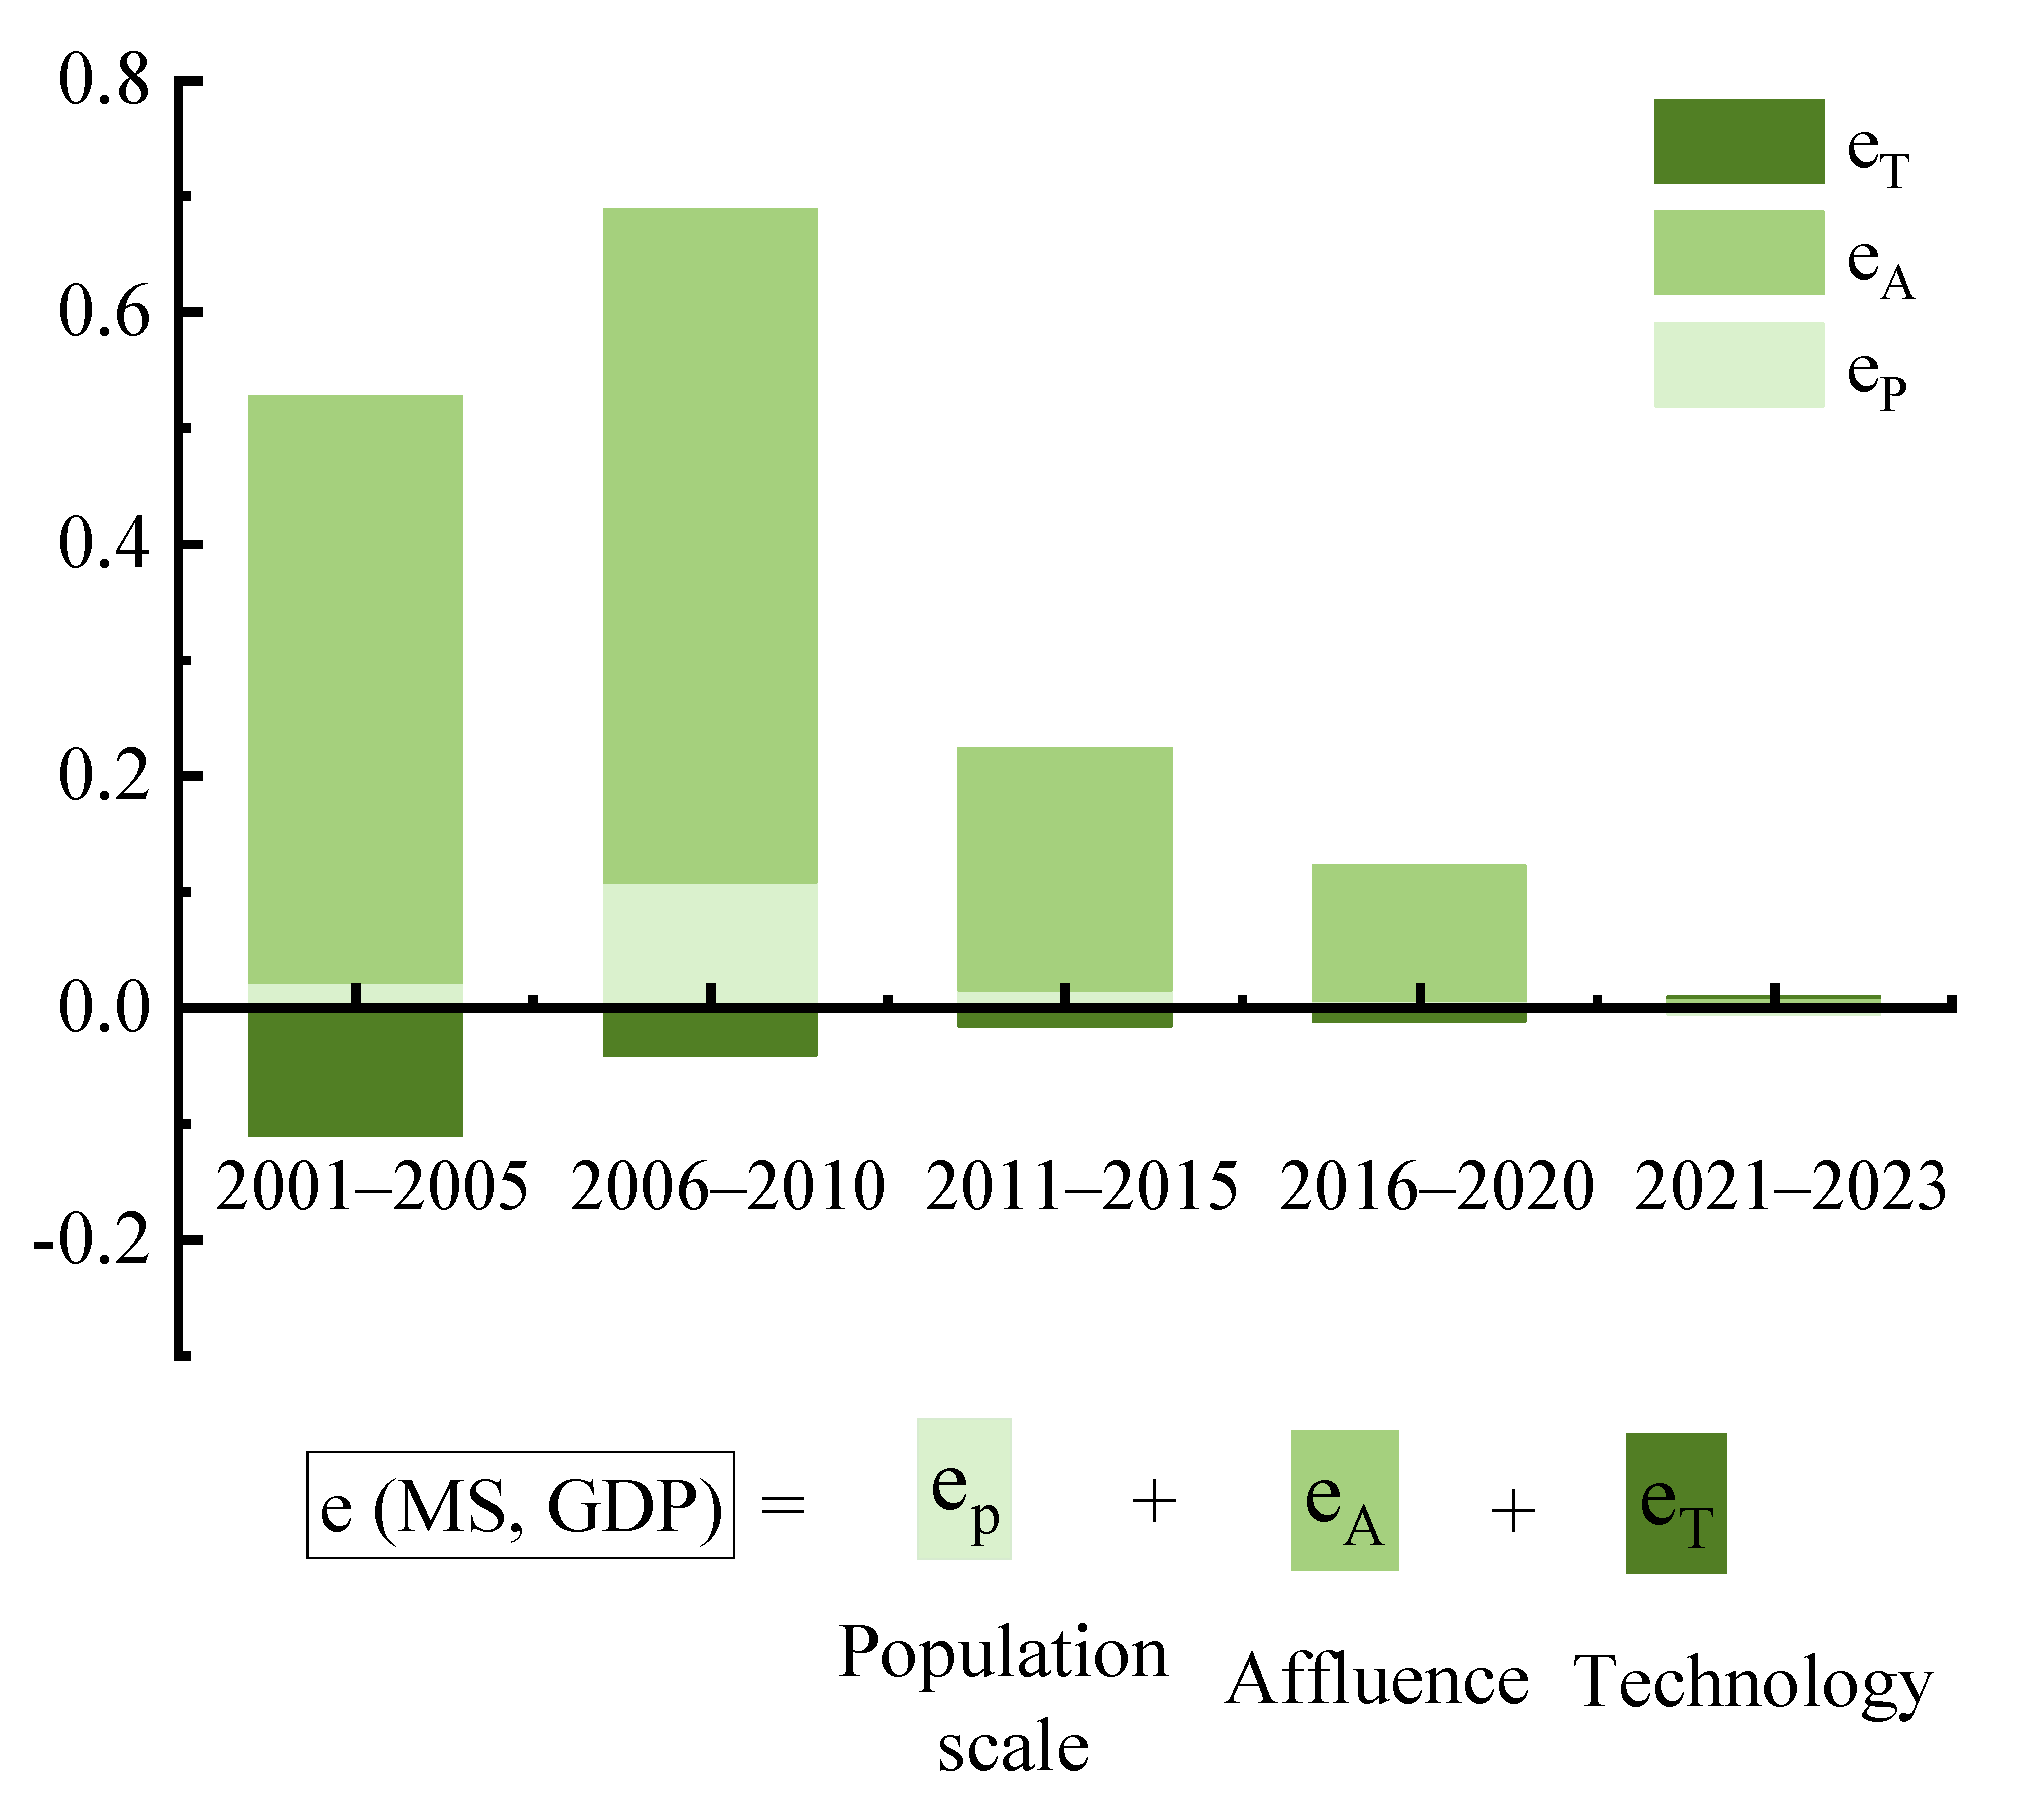
Figure 8. Decomposition of e (MS, GDP).
Applsci 15 06506 g008

3.4. Forecast of SIUS and Scrap

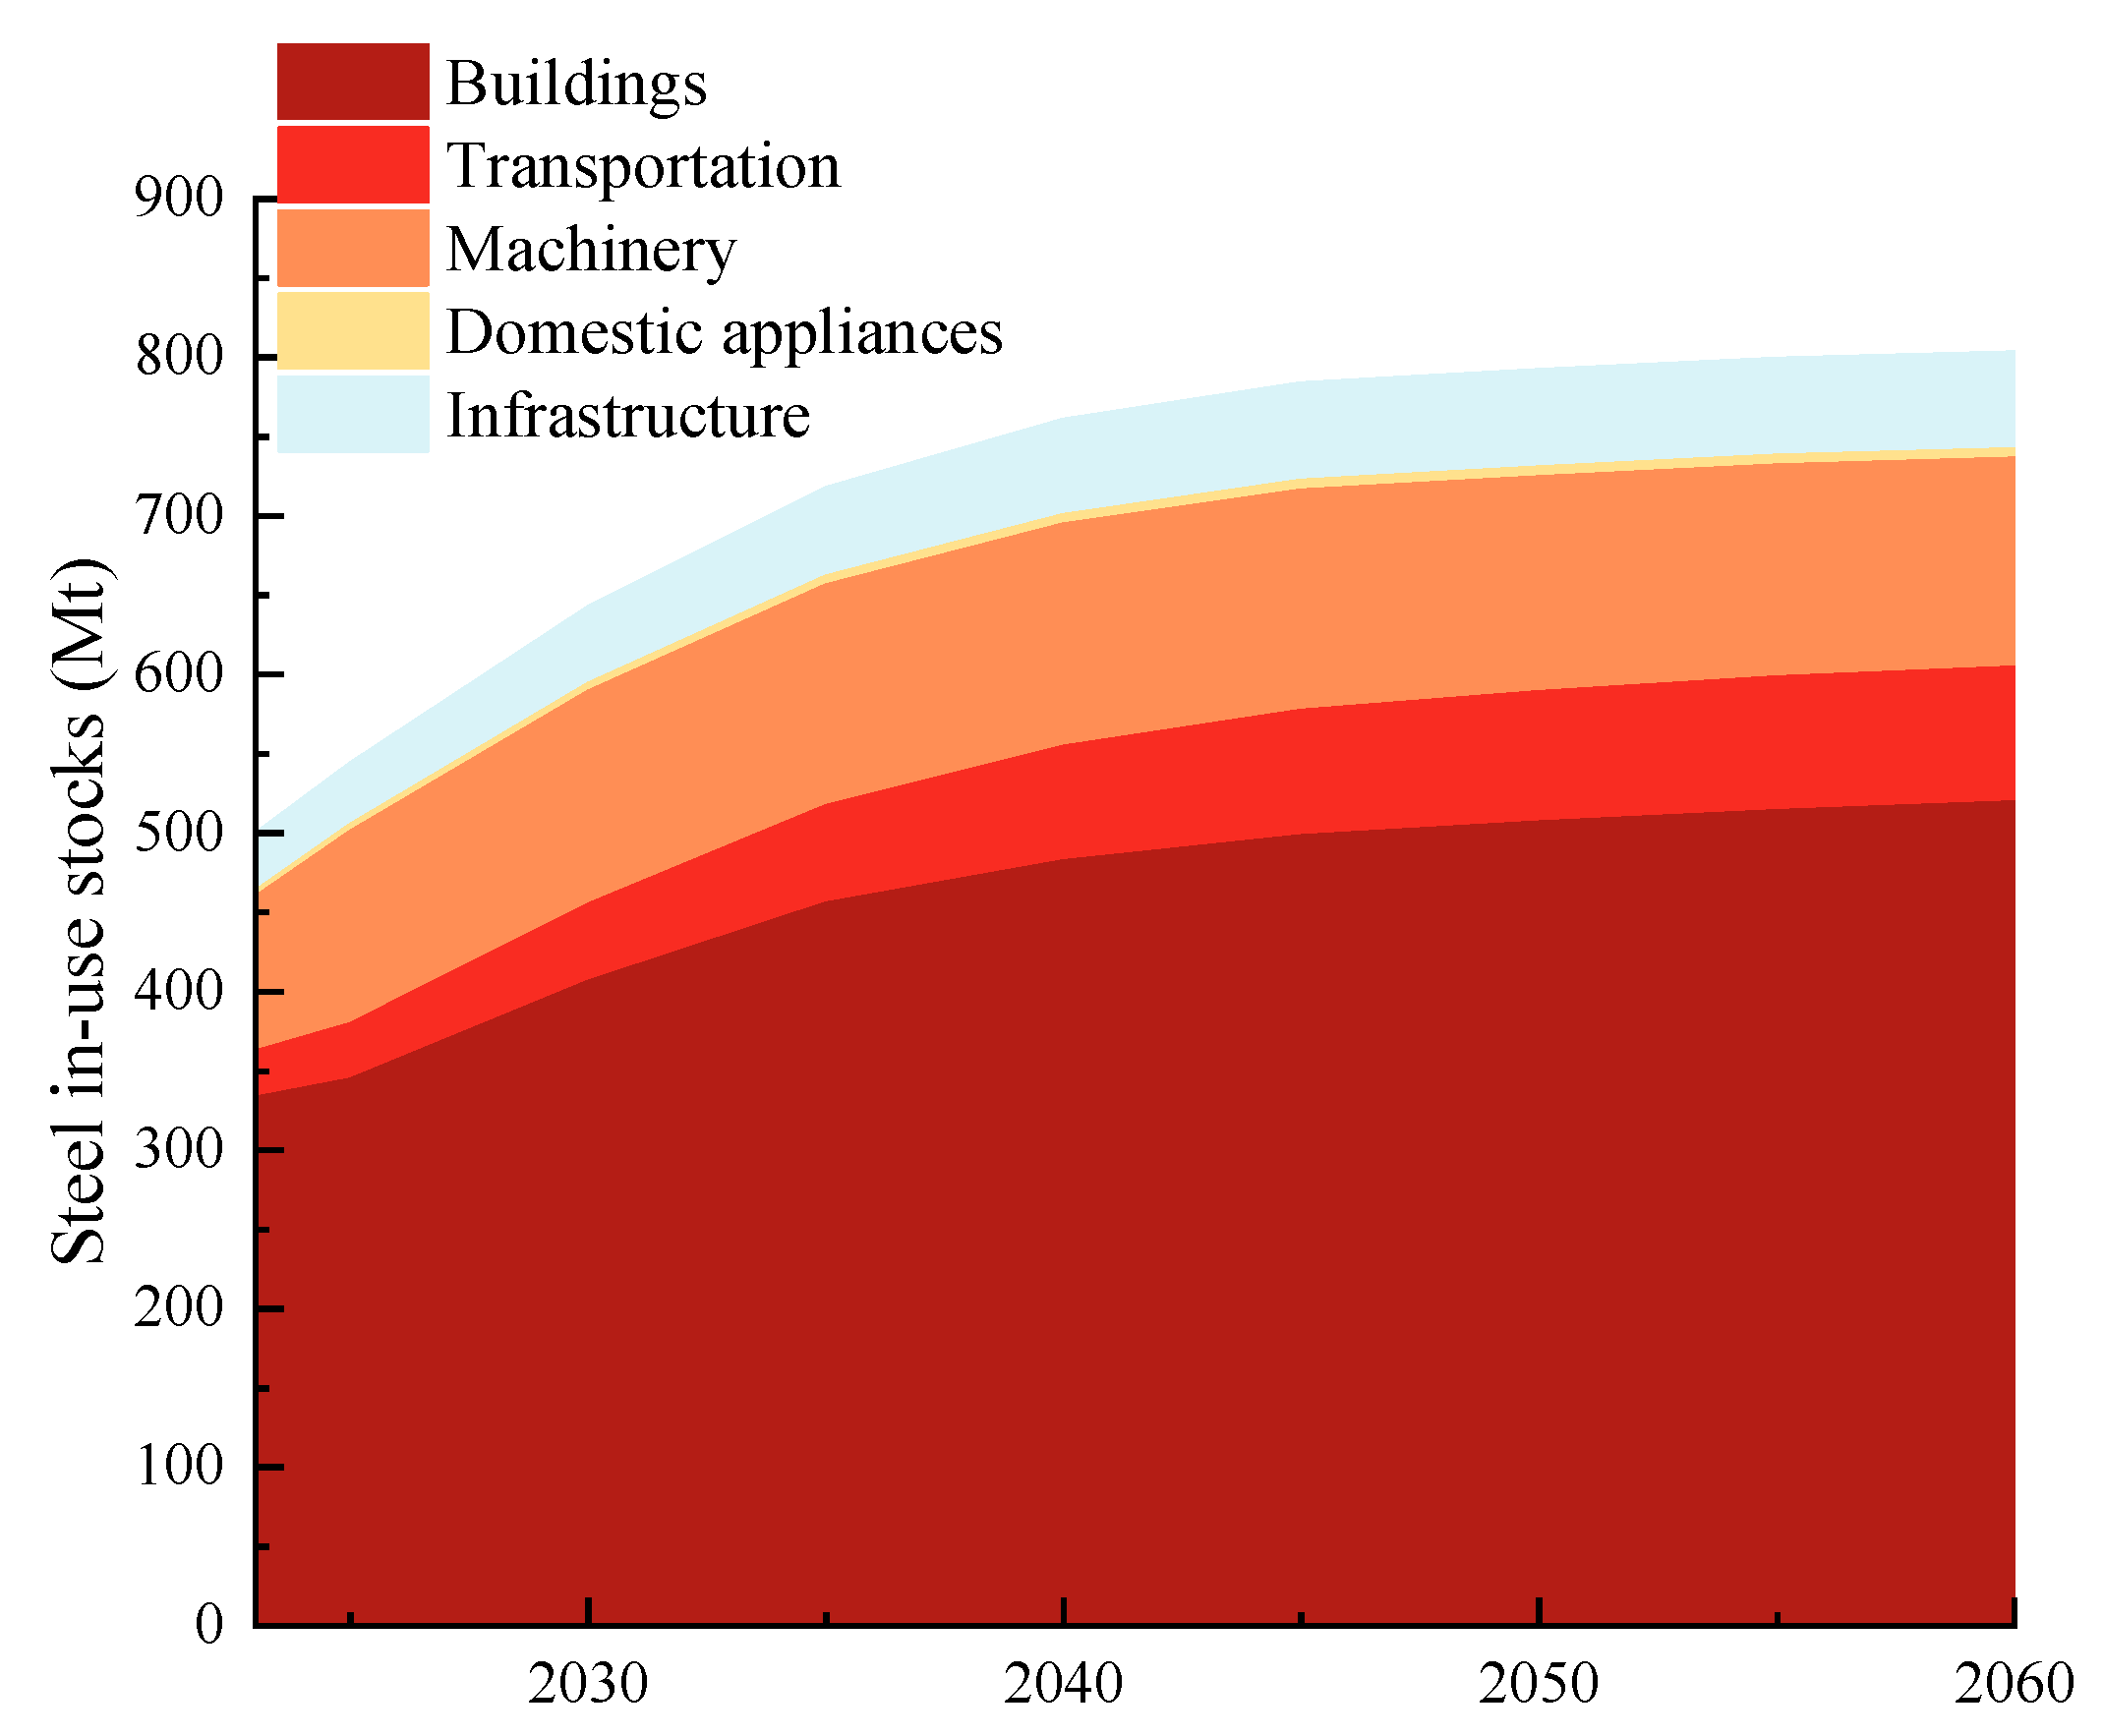
SIUS have exhibited a continuous growth trend, as shown in Figure 9. The total SIUS in Henan Province reached 642.42 Mt in 2030 and are projected to reach 802.99 Mt by 2060, with the average annual growth rate declining from 10% in 2023 to 5% in 2060, indicating a gradual saturation trend. Among the five downstream sectors, the building sector remains the most significant source of SIUS. The SIUS of the building sector increased from 332.62 Mt in 2023 to 519.25 Mt in 2060, accounting for 65% of the total SIUS. The machinery sector is the second-largest source of SIUS. It has increased from 97.37 Mt in 2023 to 131.61 Mt in 2060. The other three sectors (infrastructure, transportation, and domestic appliances) account for a small proportion of the total SIUS and together are projected to account for 19% of the total by 2060.
Henan Province will have mature steel stocks because the decline in population will cause the supply of end-of-life scrap and steel consumption to be at a similar level. In quantitative terms, the shift toward a circular economy featuring a closed-loop steel system will be attainable by that time [44].
Scrap steel currently boasts the highest recycling rate among metal products [45] and is the only renewable resource capable of replacing iron ore. It is also a crucial raw material in the Scrap-EAF (Electric Arc Furnace) route in the iron and steel industry. Recycling scrap steel not only reduces energy consumption [46,47,48] and pollutant emissions [49,50] but also contributes to the green development of the whole industry.
Figure 10a illustrates the total available recyclable scrap steel in Henan Province from 2023 to 2060. Over this period, the total available scrap steel resources are projected to increase from 11.05 Mt to 19.48 Mt. The respective proportions of HS and PS in the total recyclable scrap resources will drop from 15% in 2023 to 5% in 2060 and from 19% to 6%. This trend reflects technological advancements that have reduced waste during steel manufacturing. Depreciated scrap steel has always been a key source of recyclable scrap steel resources. By 2060, the amount of depreciated scrap steel is anticipated to reach 17.96 Mt, representing 88% of the total recyclable scrap steel. Adequate scrap resources are the key prerequisite for the steel industry to realize green and low-carbon transformation.
Figure 10b shows the distribution of depreciated scrap steel in the main downstream sectors of the iron and steel industry. In the composition of depreciated scrap steel sources, the building sector has consistently been the dominant contributor, significantly influencing the overall trend of depreciated scrap steel. The proportion of depreciated scrap steel is projected to rise from 61% in 2023 to 67% in 2060. The machinery sector is the second-largest contributor, with the amount of depreciated scrap steel reaching 2.42 Mt by 2060, accounting for 14% of the total. The transportation sector s experiencing the fastest growth in depreciated scrap steel, with an average annual increase of 5%. This indicates that the transportation sector is undergoing rapid development, which requires frequent maintenance, upgrades, or reconstruction, thereby generating more scrap steel.
The sustainable development policy encourages industries to substitute environmentally friendly materials. Adequate secondary steel resources, which are renewable and environmentally friendly, are essential for the steel industry to realize its green and low-carbon transformation.

4. Discussion

4.1. Comparison with Other Regions

The degree of SIUS can reflect the technological and economic development level of a region. Table 2 presents the results of SIUS studies in other areas, which can serve as benchmarks for comparative analysis. In 2016, Henan Province had a per capita SIUS of 3.31 t/cap, which is lower than that of Zhejiang and Fujian Provinces [10]. Based on previous analyses, the per capita stock is positively correlated with per capita GDP. This discrepancy may stem from differences in the economic development levels between the regions, as well as their varying population sizes. In 2016, Henan Province’s GDP was 40,160.01 billion yuan, ranking 4th in China; however, its per capita GDP ranked only 20th, well below that of Zhejiang and Fujian.
This disparity in per capita SIUS reflects common features in the industrialization processes across different countries or regions. In developed countries, the extensive use of steel is typically driven by advanced ironmaking technologies and strong economic support. As such, the quantity of SIUS becomes an important indicator of a nation’s industrialization and development level. Once the per capita SIUS reaches the 2 t threshold, a region enters the core stage of industrialization [3]. Henan Province officially reached this threshold in 2014, marking its transition into a phase of rapid industrial development.
Furthermore, Pauliuk et al. (2013) calculated the per capita SIUS for 200 countries worldwide and found that the saturation point for all countries ranges from 10–16 t/cap [38]. This saturation point is approximately 2–3 times higher than of Henan Province. Based on the saturation patterns observed in industrialized countries, it is anticipated that SIUS in Henan Province will continue to increase, particularly in end-use sectors with a large proportion of SIUS.

4.2. Uncertainty Analysis

In the bottom-up approach, the estimation of SIUS was derived from multiple data resources, making it essential to conduct an analysis of uncertainty. This study employed a semi-quantitative evaluation method for uncertainty analysis [55,56]. Data sourced from statistical and survey reports are considered more reliable than estimates or data from other literature sources. Additionally, in calculations that incorporate multiple estimation factors, this study assumes that the more estimation factors used, the higher the degree of uncertainty in the resulting data. Based on this assumption, various data sources were categorized into distinct levels of uncertainty (Table 3). “Low” denotes an uncertainty of ±10%, “Medium” denotes an uncertainty of ±20%, and “High” denotes an uncertainty of ±30%.
Due to the complexity of equipment in the machinery sector, the uncertainty of the result is classified as medium, and the sectors account for 19.5% of the total SIUS. Compared to previous studies, the machinery sector’s share of SIUS in Sichuan Province was 21% in 2018 [1] and 19.5% in Henan Province. As the GDP of these two provinces was similar in 2018, it can be seen that the ratio of the machinery sector’s SIUS in this study aligns closely with previous research. Furthermore, due to limited data on per capita non-residential floor area in urban and rural areas, the SIUS of non-residential buildings was calculated using the method provided by Zhang et al. (2015) [57], resulting in medium uncertainty. These two sectors account for 32.8% of the total SIUS. The data for the electricity infrastructures sector comes from the statistical yearbook, but detailed data are not disclosed in 2020–2023, leading to medium uncertainty. The uncertainty in the domestic appliances sector arises from the incomplete accounting of all communication appliances, as well as video and automotive appliances, resulting in medium uncertainty. Overall, the uncertainty in the estimated results of this study is considered acceptable.

4.3. Policy Implications

The steel industry is confronted with the issue of decreasing production capacity, and this research presents a scientific basis for prospective steel demand forecasting and scrap recycling by accounting for SIUS. Specific recommendations are given below:
(1)
Completing the scrap steel recycling chain from the perspective of industrial distribution. In the downstream sectors, SIUS in the building sector continues to grow and remains the primary source of SIUS, reaching 67% of the total SIUS in 2023. The lifetime of a building is typically around 30–50 years [58], meaning that a large amount of SIUS will be phased out at the end of their lifespan in the future. However, Guo et al. (2019) found that the utilization rate of building waste in China is less than 10% [50]. To achieve more efficient utilization of iron and steel resources, steel recyclers must enhance their integration capabilities, particularly for professional dismantling and fine sorting. Additionally, it is essential to continuously optimize the overall development of scrap steel recycling, dismantling, processing, and distribution and to improve the scrap steel resource recycling network.
(2)
Optimizing the recycling layout of scrap resources based on the SIUS at the prefecture-level cities. Building on the findings of this research and considering the distribution of the steel industry in Henan Province, this study prioritizes the establishment of scrap steel recycling bases around Jiaozuo and Jiyuan. This approach aims to improve the utilization efficiency of steel resources, promote the agglomeration and large-scale green development of recycling enterprises, and cultivate leading enterprises. Meanwhile, it is recommended to establish scrap recycling outlets in Zhengzhou, Nanyang, and other cities with a significant concentration of SIUS to improve resource recycling efficiency.
(3)
Promoting the decoupling between SIUS and economic development through technology. Henan Province is currently in the industrialization stage, and SIUS will continue to grow with economic growth. According to the findings of this study, technology plays a crucial role in accelerating the decoupling between SIUS and economic growth. Therefore, it is essential to enhance technological innovation and appropriately substitute materials. At the same time, financial subsidies should be provided to support technological innovation in enterprises, alongside improvements to fiscal and tax preferential policies.

5. Conclusions

This study developed an integrated spatio-temporal characterization framework to provide a scientific basis for regional resource recycling strategies in Henan Province, combining the bottom-up method, the spatial autocorrelation model, Tapio–LMDI, and the stock-driven model. Several conclusions are as follows.
(1)
Henan Province’s SIUS increased from 53.41 Mt in 2000 to 499.35 Mt in 2023, with per capita SIUS rising from 0.56 t/cap to 5.09 t/cap, an increase of 9.04 times. Projections indicate that SIUS will reach 802.99 Mt by 2060, with the annual growth rate declining from 10% in 2023 to 5% by 2060, suggesting that SIUS is nearing saturation. This reflects a significant transformation in the iron and steel industry in Henan Province, marking a shift from primary steel production to scrap-based steelmaking. The buildings sector will remain the primary contributor, accounting for 65% of total SIUS by 2060, highlighting its dominant role in steel stock dynamics.
(2)
At prefecture-level cities, while category distribution patterns are relatively consistent across 18 cities, stock density varies significantly, between 1055.35 and 8855.35 t/km2, revealing signification spatial heterogeneity. Spatial autocorrelation analysis highlights significant clustering of per capita SIUS in Jiaozuo and Jiyuan, necessitating the establishment of regional scrap recycling hubs in these areas to optimize collection efficiency.
(3)
The Tapio model shows a persistent weak decoupling between SIUS and economic growth, with the correlation gradually weakening. Through the decomposition analysis of decoupling factors, this study finds that the technology factor and the population scale factor can promote decoupling in the future.
(4)
The total recyclable scrap steel resources will rise from 11.05 Mt to 19.48 Mt from 2023 to 2060. Depreciation scrap has always been the main source of recyclable scrap steel resources and will reach 17.96 Mt in 2060, accounting for 88% of the total recyclable scrap steel, underscoring its importance in the circular steel economy.
In summary, the findings of this research offer relevant information necessary for drafting scrap metal recycling and steel production policies. This information can help stakeholders make more informed decisions regarding recycling and steel- crap management within a region. Future research can expand the framework to compare stainless steel with other alloys, so as to further enhance its relevance to the global sustainable development strategy of materials, and evaluate the energy-saving and emission-reduction potential of the steel industry according to the analysis results [59].

Supplementary Materials

The following supporting information can be downloaded at: https://www.mdpi.com/article/10.3390/app15126506/s1, Text S1: Accounting of the five downstream sectors’ stocks; Text S2: Tapio-LMDI model; Text S3: Steel demand forecast; Table S1: Iron-containing products in Henan Province; Table S2: The steel contents of different products; Table S3: Criteria of the decoupling situation; Table S4: List of parameters; Figure S1: Amounts and composition of steel stocks in 18 prefecture-level cities in Henan; Figure S2: In-use stocks utilization intensity; Figure S3: Projections of steel demand. References [10,12,14,15,30,39,41,43,57,60,61] are cited in the supplementary materials.

Author Contributions

Conceptualization, Y.L. (Yilei Liu); methodology, Y.L. (Yilei Liu); validation, Y.L. (Yilei Liu) and S.W.; formal analysis, Y.L. (Yilei Liu) and S.W.; investigation, Y.L. (Yilei Liu), S.W., Y.L. (Yeke Li), H.S. and Y.Z.; resources, R.Z.; data curation, Y.L. (Yilei Liu) and S.W.; writing—original draft preparation, Y.L. (Yilei Liu); writing—review and editing, Y.L. (Yilei Liu), S.W., Y.L. (Yeke Li), H.S. and Y.Z.; visualization, Y.L. (Yilei Liu); supervision, S.W.; project administration, S.W.; funding acquisition, S.W. and R.Z. All authors have read and agreed to the published version of the manuscript.

Funding

This research was funded by National Key R&D Program of China (2024YFC3713700) and National Natural Science Foundation of China (No. 42001246).

Institutional Review Board Statement

Not applicable.

Informed Consent Statement

Not applicable.

Data Availability Statement

The raw data supporting the conclusions of this article will be made available by the authors on request.

Conflicts of Interest

The authors declare no conflict of interest.

Abbreviations

SIUSSteel in-used stocks
Tapio–LMDI modelTapio-Logarithmic Mean Divisia Index model
IPAT equationImpact-Population-Affluence-Technology equation
GDPGross Domestic Product
TSThe total recyclable scrap steel
HSHome Scrap
PSProcess Scrap
DSDepreciated Scrap
MtMillion tonnes
Scrap-EAFScrap-Electric Arc Furnace

References

  1. Yue, Q.; Wang, H.M.; Gao, C.K.; Du, T.; Li, M.J.; Lu, Z.W. Analysis of iron in-use stocks in China. Resour. Policy 2016, 49, 315–322. [Google Scholar] [CrossRef]
  2. WSA. Steel Statistical Yearbook. World Steel Association. 2023. Available online: https://worldsteel.org/media/press-releases/2023/2023-steel-statistical-yearbook-published/ (accessed on 1 April 2024).
  3. Müller, D.B.; Wang, T.; Duval, B. Patterns of iron use in societal evolution. Environ. Sci. Technol. 2011, 45, 182–188. [Google Scholar] [CrossRef] [PubMed]
  4. WSA. World Steel in Figures; World Steel Association: Brussels, Belgium, 2019. [Google Scholar]
  5. NDRCC. “The 14th Five-Year Plan” for the Development of Circular Economy. National Development and Reform Commission of China. 2021. Available online: https://www.gov.cn/zhengce/zhengceku/2021-07/07/content_5623077.htm (accessed on 13 September 2024).
  6. NDRCC. Guiding Opinions on Accelerating the Construction of Waste Material Recycling System. National Development and Reform Commission of China. 2022. Available online: https://www.gov.cn/zhengce/zhengceku/2022-01/22/content_5669857.htm (accessed on 13 September 2024).
  7. CAMR. China Recycling Industry Development Report; China Association for Material Recycling: Beijing, China, 2023. [Google Scholar]
  8. Müller, D.B.; Wang, T.; Duval, B.; Graedel, T.E. Exploring the engine of anthropogenic iron cycles. Proc. Natl. Acad. Sci. USA 2006, 103, 16111–16116. [Google Scholar] [CrossRef] [PubMed]
  9. Lou, Y.; Shi, L. Metal stock analysis at the city scale—An example of steel and aluminium stocks in Handan City in 2005. Resour. Sci. 2008, 30, 147–152. (In Chinese) [Google Scholar]
  10. Yu, B.Y.; An, R.Y.; Zhao, J.P. Spatial and temporal disparity of the in-use steel stock for China. Resour. Conserv. Recycl. 2020, 155, 104667. [Google Scholar] [CrossRef]
  11. Hao, M.; Song, L.L.; Dai, M.; Liu, Y.P.; Dai, T.; Chen, W.Q. Urban mining assessment of copper, iron and aluminum in Fujian province. Resour. Ind. 2020, 22, 66–74. (In Chinese) [Google Scholar] [CrossRef]
  12. Wang, P.; Li, W.; Kara, S. Cradle-to-cradle modeling of the future steel flow in China. Resour. Conserv. Recycl. 2017, 117, 45–57. [Google Scholar] [CrossRef]
  13. Watari, T.; Giurco, D.; Cullen, J. Scrap endowment and inequalities in global steel decarbonization. J. Clean. Prod. 2023, 425, 139041. [Google Scholar] [CrossRef]
  14. Song, L.L.; Wang, P.; Hao, M.; Dai, M.; Xiang, K.Y.; Li, N.; Chen, N.Q. Mapping provincial steel stocks and flows in China: 1978–2050. J. Clean. Prod. 2020, 262, 121393. [Google Scholar] [CrossRef]
  15. Liu, Q.; Cao, Z.; Liu, X.; Liu, L.; Dai, T.; Han, J.; Duan, H.; Wang, C.; Wang, H.; Liu, J.; et al. Product and metal stocks accumulation of China’s megacities: Patterns, drivers, and implications. Environ. Sci. Technol. 2019, 53, 4128–4139. [Google Scholar] [CrossRef]
  16. Duan, L.; Liu, Y.; Yang, Y.; Song, L.; Hao, M.; Li, J.; Dai, M.; Chen, W.Q. Spatiotemporal dynamics of in-use copper stocks in the Jing-Jin-Ji urban agglomeration, China. Resour. Conserv. Recycl. 2021, 175, 105848. [Google Scholar] [CrossRef]
  17. Shen, W.R.; Liang, H.W.; Dong, L.; Ren, J.Z.; Wang, G.J. Synergistic CO2 reduction effects in Chinese urban agglomerations: Perspectives from social network analysis. Sci. Total Environ. 2021, 798, 149352. [Google Scholar] [CrossRef] [PubMed]
  18. Zhao, D.D.; Lei, Y.; Zhang, Y.; Shi, X.R.; Liu, X.; Xu, Y.L.; Xue, W.B. Analysis of vehicular CO2 emission in the Central Plains of China and its driving forces. Sci. Total Environ. 2022, 814, 152758. [Google Scholar] [CrossRef] [PubMed]
  19. Wang, Y.F.; Lv, W.Y.; Wang, M.J.; Chen, X.; Li, Y. Application of improved Moran’s I in the evaluation of urban spatial development. Spat. Stat. 2023, 54, 100736. [Google Scholar] [CrossRef]
  20. Fishman, T.; Schandl, H.; Tanikawa, H. The socio-economic drivers of material stock accumulation in Japan’s prefectures. Ecol. Econ. 2015, 113, 76–84. [Google Scholar] [CrossRef]
  21. Krausmann, F.; Wiedenhofer, D.; Lauk, C.; Haas, W.; Tanikawa, H.; Fishman, T.; Miatto, A.; Schandl, H.; Haberl, H. Global socioeconomic material stocks rise 23-fold over the 20th century and require half of annual resource use. Proc. Natl. Acad. Sci. USA 2017, 114, 1880–1885. [Google Scholar] [CrossRef]
  22. Song, L.L.; Wang, P.; Xiang, K.; Chen, W.Q. Regional disparities in decoupling economic growth and steel stocks: Forty years of provincial evidence in China. J. Environ. Manag. 2020, 271, 111035. [Google Scholar] [CrossRef]
  23. Zhang, C.; Wang, T.; Chen, W.Q.; Liu, G.; Du, H.Z. Simulation of China’s long-term steel demand and evaluation of the trend of overcapacity of steel industry. China J. Popul. Resour. 2018, 28, 169–176. (In Chinese) [Google Scholar]
  24. Zhao, F.; Yue, Q.; He, J.H.; Li, Y.; Wang, H.M. Quantifying China’s iron in-use stock and its driving factors analysis. J. Environ. Manag. 2020, 274, 111220. [Google Scholar] [CrossRef]
  25. Li, S.P.; Wang, Z.; Zhang, T.G.; Yue, Q. Quantification and spatial distribution of aluminum in-use stocks in Henan Province, China. Resour. Conserv. Recycl. 2022, 186, 1006540. [Google Scholar] [CrossRef]
  26. NBS. Statistical Yearbook of Urban Construction. National Bureau of Statistics of China. 2001–2023. Available online: https://www.mohurd.gov.cn/ (accessed on 5 April 2024).
  27. NBS. Urban and Rural Construction Statistical Yearbook. National Bureau of Statistics of China 2001–2023. Available online: https://www.mohurd.gov.cn/ (accessed on 5 April 2024).
  28. NBS. China Statistical Yearbook. National Bureau of Statistics of China. 2024. Available online: https://www.stats.gov.cn/ (accessed on 5 May 2025).
  29. HSB. Statistical Yearbook of Henan. Henan Statistical Bureau. 2001–2023. Available online: https://tjj.henan.gov.cn/ (accessed on 18 May 2024).
  30. Wang, T.; Müller, D.B.; Hashimoto, S. The ferrous find: Counting iron and steel stocks in China’s economy. J. Ind. Ecol. 2015, 19, 877–889. [Google Scholar] [CrossRef]
  31. Moran, P.A. Notes on continuous stochastic phenomena. Biome 1950, 37, 17–23. [Google Scholar] [CrossRef]
  32. Zhang, Y.; Teoh, B.K.; Zhang, L. Exploring driving force factors of building energy use and GHG emission using a spatio-temporal regression method. Energy 2023, 269, 126747. [Google Scholar] [CrossRef]
  33. Anselin, L. Local indicators of spatial association lisa. Geogr. Anal. 1995, 27, 93–115. [Google Scholar] [CrossRef]
  34. Xie, P.J.; Gao, S.S.; Sun, F.H. An analysis of the decoupling relationship between CO2 emission in power industry and GDP in China based on LMDI method. J. Clean. Prod. 2019, 211, 598–606. [Google Scholar] [CrossRef]
  35. Wang, X.F.; Shen, D.J.; Li, W. Research on the mechanism, model and application of decoupling between water resources utilization and economic growth. China Popul. Resour. Environ. 2019, 29, 139–147. (In Chinese) [Google Scholar] [CrossRef]
  36. Chen, Y.; Zhu, X.H.; Zeng, A.Q. Decoupling analysis between economic growth and aluminum cycle: From the perspective of aluminum use and carbon emissions. J. Environ. Manag. 2023, 344, 118461. [Google Scholar] [CrossRef]
  37. Kermeli, K.; Edelenbosch, O.Y.; Crijns-Graus, W.; Ruijven, B.J.; Vuuren, D.P.; Worrell, E. Improving material projections in Integrated Assessment Models: The use of a stock-based versus a flow-based approach for the iron and steel industry. Energy 2022, 239, 122434. [Google Scholar] [CrossRef]
  38. Pauliuk, S.; Wang, T.; Müller, D.B. Steel all over the world: Estimating in-use stocks of iron for 200 countries. Resour. Conserv. Recycl. 2013, 71, 22–30. [Google Scholar] [CrossRef]
  39. Lin, Y.C.; Ma, L.W.; Li, Z.; Ni, W.D. Coordinating energy and material efficiency strategies for decarbonizing China’s iron and steel sector. J. Clean. Prod. 2023, 425, 139038. [Google Scholar] [CrossRef]
  40. Zhang, Y.P.; Zhao, H.T.; Yu, Y.D.; Wang, T.; Zhou, W.J.; Jiang, J.; Chen, D.J.; Zhu, B. Copper in-use stocks accounting at the sub-national level in China. Resour. Conserv. Recycl. 2019, 147, 49–60. [Google Scholar] [CrossRef]
  41. Wang, P.; Jiang, Z.; Geng, X.Y.; Hao, S.Y.; Zhang, X.X. Quantification of Chinese steel cycle flow: Historical status and future options. Resour. Conserv. Recycl. 2014, 87, 191–199. [Google Scholar] [CrossRef]
  42. Kozawa, S.; Tsukihashi, F. Analysis of global demand for ironsource by estimation of in-use steel stock. Tetsu Hagane 2009, 95, A710–A719. (In Japanese) [Google Scholar] [CrossRef]
  43. Dai, T.J.; Yue, Z.C. The evolution and decoupling of in-use stocks in Beijing. Energ. Econ. 2023, 203, 107606. [Google Scholar] [CrossRef]
  44. Pauliuk, S.; Wang, T.; Müller, D.B. Moving Toward the Circular Economy: The Role of Stocks in the Chinese Steel Cycle. Environ. Sci. Technol. 2011, 46, 148–154. [Google Scholar] [CrossRef]
  45. Cui, Z.F.; Shangguan, F.Q.; Wang, F.J.; Zhou, J.C.; Xu, A.J. Analysis andprediction of scrap resources in China from 2022 to 2060. Iron Steel 2023, 58, 126–133. (In Chinese) [Google Scholar]
  46. Duan, W.P.; Yang, S.F.; Li, J.S.; Zhang, F.J.; Xi, X.J. Progress in Rapid Melting Technology of Steel Scrap in Modern EAF Steelmaking in China. Chin. Metall. 2021, 31, 78–84+109. (In Chinese) [Google Scholar]
  47. Zhang, C.X. Study on the Influence of Scrap Steel Resources on Energy Consumption in Steel Production. Master’s Thesis, University of Science and Technology Liaoning, Anshan, China, 2012. (In Chinese). [Google Scholar]
  48. Wu, Y.G.; Xiao, B.Q.; Zhu, L.G.; Wang, Y. Present situation analysis and prospect of steel raw materials for EAF steelmaking. Iron Steel 2021, 56, 55–62. [Google Scholar]
  49. Shangguan, F.Q.; Zhou, J.C.; Wang, H.F.; Li, X.P. Climate change and decarbonization development of steel industry. Iron 2021, 56, 1–6. (In Chinese) [Google Scholar]
  50. Guo, J.; Miatto, A.; Shi, F.; Tanikawa, H. Spatially explicit material stock analysis of buildings in Eastern China metropoles. Resour. Conserv. Recycl. 2019, 146, 45–54. [Google Scholar] [CrossRef]
  51. United States Geological Survey (USGS). Metal Stocks in Use in the United States. America. 2005. Available online: https://pubs.usgs.gov/fs//2005/3090/2005-3090.pdf (accessed on 5 May 2025).
  52. Drakonakis, K.; Rostkowski, K.; Rauch, J.; Graedel, T.E.; Gordon, R.B. Metal capital sustaining a north American city: Iron and copper in NewHaven CT. Resour. Conserv. Recycl. 2017, 49, 406–420. [Google Scholar] [CrossRef]
  53. Tanikawa, H.; Hashimoto, S. Urban stock over time: Spatial material stock analysis using 4d-GIS. Build. Res. Inf. 2019, 37, 483–502. [Google Scholar] [CrossRef]
  54. Schöller, G.; Oberleitner, C.; Fehringer, R.; Döberl, G.; Brunner, P.H. Verknüpfung, Rohstof–Flager–Anthropogene Lager–Letzte Senken im Bundesland Steiermark; Vienna University of Technology: Vienna, Austria, 2006. [Google Scholar]
  55. Salemdeeb, R.; Saint, R.; Clark, W.; Lenaghan, M.; Pratt, K.; Millar, F. A pragmatic and industry-oriented framework for data quality assessment of environmental footprint tools. Resour. Environ. Sustain. 2021, 3, 100019. [Google Scholar] [CrossRef]
  56. Zhang, L.; Yuan, Z.; Bi, J. Estimation of copper in-use stocks in Nanjing, China. J. Ind. Ecol. 2012, 16, 191–202. [Google Scholar] [CrossRef]
  57. Zhang, L.; Yang, J.M.; Cai, Z.J.; Yuan, Z.W. Understanding the spatial and temporal patterns of copper in-use stocks in China. Environ. Sci. Technol. 2015, 49, 6430–6437. [Google Scholar] [CrossRef]
  58. Hu, M.; Pauliuk, S.; Wang, T.; Huppes, G.; Voet, E.V.D.; Müller, D.B. Iron and steel in Chinese residential buildings: A dynamic analysis. Resour. Conserv. Recycl. 2010, 54, 591–600. [Google Scholar] [CrossRef]
  59. Sarfarazi, S.; Shamass, R.; Guarracino, F.; Mascolo, I.; Modano, M. Exploring the stainless-steel beam-to-column connections response: A hybrid explainable machine learning framework for characterization. Front. Struct. Civ. Eng. 2025, 19, 34–59. [Google Scholar] [CrossRef]
  60. Müller, E.; Hilty, M.L.; Widmer, R.; Schluep, M.; Faulstich, M. Modeling Metal Stocks and Flows: A Review of Dynamic Material Flow Analysis Methods. Environ. Sci. Technol. 2014, 48, 2102–2113. [Google Scholar] [CrossRef]
  61. Song, L.L.; Han, J.; Li, N.; Huang, Y.Y.; Hao, M.; Dai, M.; Chen, W.Q. China material stocks and fows account for 1978–2018. Sci. Data 2021, 8, 303. [Google Scholar] [CrossRef]
Figure 1. The model framework proposed in this study.
Applsci 15 06506 g001
Figure 2. SIUS from 2000 to 2023 in Henan Province.
Applsci 15 06506 g002
Figure 3. The evolution of in-use product stocks in buildings (a), domestic appliances (b), infrastructures (c), transportation (d), and machinery (e) (see Text S1 for details on data sources and methodology).
Applsci 15 06506 g003
Figure 4. Relationship between per capita SIUS and per capita GDP in Henan Provinces and other regions [13,42].
Applsci 15 06506 g004
Figure 5. Spatial structures of Henan’s prefecture-level cities: (a) steel-in-use stocks per sq. km, (b) per capita SIUS.
Applsci 15 06506 g005
Figure 6. Correlation of SIUS with per capita GDP and population density.
Applsci 15 06506 g006
Figure 7. Local spatial autocorrelation of per capita SIUS.
Applsci 15 06506 g007
Figure 9. SIUS from 2023 to 2060 in Henan Province.
Applsci 15 06506 g009
Figure 10. Total available scrap steel resources from 2023 to 2060: (a) Total available scrap steel, (b) Depreciated scrap steel.
Applsci 15 06506 g010
Table 1. Decoupling results of the in-use stocks and economic development in Henan Province.
YearsGDP%MS%Decoupling IndexDegree of Decoupling
2001–20050.750.560.42Weak decoupling
2006–20100.840.770.65Weak decoupling
2011–20150.480.440.21Weak decoupling
2016–20200.430.390.11Weak decoupling
2021–20230.050.110.0037Weak decoupling
Table 2. The comparative analysis of per capita SIUS in different regions.
RegionMethodTime EstimatedPer Capita SIUS (t/cap)References
USATop-down200214.3USGS (2005) [51]
USATop-down200411–12Müller et al. (2006) [8]
USATop-down200410.92Kozawa et al.(2009) [42]
New Haven (USA)Bottom-up20009.2Drakonakis et al. (2007) [52]
AustraliaTop-down200510±2Müller et al. (2011) [3]
CanadaTop-down200512±2Müller et al. (2011) [3]
Wakayama (Japan)Bottom-up20042.08Tanikawa and Hashimoto (2009) [53]
CIS and the Middle East and OthersBottom-up20198.2Watari (2023) [13]
Steiermark (Austria)Bottom-up200310Schöller et al. (2006) [54]
GlobalAverage use life method20132.8Yue et al. (2016) [1]
ChinaBottom-up20185.9Song et al. (2020) [14]
Handan (China)Bottom-up20051.33Lou et al. (2008) [9]
Zhejiang (China)Bottom-up20165.48Yu et al. (2020) [10]
Fujian (China)Bottom-up20167.6Hao et al. (2020) [11]
Nanjing (China)Bottom-up20166.2Liu et al. (2019) [15]
Shenzhen (China)Bottom-up20162.5Liu et al. (2019) [15]
Henan (China)Bottom-up20235.09This study
Table 3. Data uncertainty of different subcategories.
CategorySubcategoryUncertaintyPercentage of Total Iron in-Use Stocks (%)
BuildingsUrban and rural residential Low33.8
Urban and rural non-residentialMedium32.8
Infrastructure BridgeLow5.42
PipelinesLow1.01
Electricity InfrastructuresMedium0.44
HighwaysLow0.01
ExpresswaysLow0.32
Street LampsLow0.05
Transportation Low5.86
Domestic appliances Medium0.8
Machinery Medium19.5
Disclaimer/Publisher’s Note: The statements, opinions and data contained in all publications are solely those of the individual author(s) and contributor(s) and not of MDPI and/or the editor(s). MDPI and/or the editor(s) disclaim responsibility for any injury to people or property resulting from any ideas, methods, instructions or products referred to in the content.