Article

Towards Geodetic Datum Modernization: A Comparative Study of GNSS Solutions in KGD2002 Using GAMIT/GLOBK and Bernese

Geodesy Laboratory, Civil & Architectural and Environmental System Engineering, Sungkyunkwan University (SKKU), Suwon 16419, Gyeonggi-do, Republic of Korea
*
Author to whom correspondence should be addressed.
Appl. Sci. 2025, 15(12), 6460; https://doi.org/10.3390/app15126460
Submission received: 18 May 2025 / Revised: 29 May 2025 / Accepted: 6 June 2025 / Published: 8 June 2025
(This article belongs to the Section Earth Sciences)

Abstract

:
This study evaluates coordinate consistency in the static Korean Geodetic Datum 2002 (KGD2002) by comparing GNSS station positions derived independently from GAMIT/GLOBK and Bernese software. Using a nationwide network of approximately 3000 unified geodetic control points (UGCPs), we analyze horizontal coordinate differences (ΔN, ΔE) to identify regional patterns and potential systematic biases. The results indicate that both solutions are closely aligned with the official KGD2002 coordinates, generally within a few millimeters to sub-centimeter levels. However, small regional discrepancies are evident; for example, some provinces exhibit consistent mean northward or southward offsets on the order of 0.1–0.3 cm, and greater dispersions—up to 2 cm—are observed in peripheral regions such as Jeollanam. Notably, the Bernese solution demonstrates slightly tighter agreement, with lower standard deviations compared to GAMIT/GLOBK. The application of two distinct processing strategies within a unified static reference frame is a novel aspect of this study, revealing subtle differences attributable to network geometry, environmental factors, and software modeling approaches. The findings also underscore the limitations of KGD2002’s static nature, particularly its fixed epoch and lack of motion modeling. In response to these issues, this study discusses the rationale for transitioning to a dynamic geodetic reference frame, such as ITRF2020, to improve compatibility with international systems and account for ongoing crustal motions. Overall, the results provide a foundation for the future modernization of Korea’s spatial reference infrastructure and highlight the importance of adopting time-dependent datums in geodetic applications.

1. Introduction

Establishing and maintaining a consistent and accurate geodetic reference frame is essential for a wide range of geospatial and scientific applications, including satellite navigation, land surveying, infrastructure development, and the monitoring of crustal deformation. In recent decades, the growing adoption of GNSS technologies has necessitated national reference frames that are compatible with global geocentric systems such as the International Terrestrial Reference Frame (ITRF) [1,2,3,4,5]. As ITRF realizations have evolved to provide increasingly precise, dynamic models of the Earth’s geometry and motion, many countries have revised their national datums to ensure consistency with these global standards [5,6,7].
This modernization is particularly important in regions undergoing significant tectonic motion or where outdated, non-geocentric datums persist. Failure to align with contemporary reference systems can lead to inconsistencies between spatial datasets, reduced positioning accuracy, and difficulties in integrating regional geospatial infrastructures into global networks. Consequently, several countries—including the United States (NAD83), Japan (JGD2000, JGD2011), and Australia (GDA2020)—have undertaken substantial revisions of their national coordinate systems in recent decades [8,9,10].
In this context, the Republic of Korea transitioned from a legacy Tokyo-based datum to the Korean Geodetic Datum 2002 (KGD2002) in the early 2000s. KGD2002 is a static, geocentric horizontal datum aligned with ITRF2000 at epoch 2002.0, realized using GPS and VLBI observations and the GRS80 ellipsoid. Its establishment marked a significant milestone in Korea’s geospatial modernization efforts, enabling centimeter-level accuracy and interoperability with global systems.
Modernizing a national geodetic datum is crucial for ensuring consistency with global reference frames. The Republic of Korea addressed this by adopting the Korean Geodetic Datum 2002 (KGD2002) in the early 2000s, replacing its legacy Tokyo-based datum. KGD2002 is a geocentric horizontal datum aligned with the International Terrestrial Reference Frame 2000 (ITRF2000) at epoch 2002.0 [11]. It uses the GRS80 ellipsoid and was realized by fixing a new datum origin at the National Geographic Information Institute (NGII) and readjusting the national control network. The origin’s coordinates were determined via VLBI and GPS and are published as φ = 37°16′33.3659″ N, λ = 127°03′14.8913″ E, h = 91.253 m. KGD2002’s implementation ensured that the Republic of Korea’s geospatial data infrastructure became compatible with international standards, supporting modern GPS/GNSS positioning technologies [12].
The adoption of KGD2002 involved a comprehensive nationwide adjustment of geodetic control points. Fourteen first-order continuously operating GPS stations (CORSs) were used to define the datum, and tens of thousands of second- and third-order control points were re-surveyed and integrated into the new frame. Notably, from 1997 to 2007, over 11,000 geodetic points across the Republic of Korea were observed with GPS to densify KGD2002. This hierarchical adjustment process—first fixing the origin and CORSs, then adjusting second-order, then third-order points—gradually shifted the national network from the old datum to KGD2002 with ITRF2000. The result was a unified, high-accuracy coordinate system underpinning all mapping and surveying activities in the country. KGD2002 significantly improved national geodetic consistency: it eliminated the old datum’s distortions and ensured that coordinates are directly compatible with GPS-derived positions [12].
It is a static datum fixed at epoch 2002.0 (it does not account for ongoing crustal motion), which means coordinates remain reference-fixed to 2002—subsequent realizations (e.g., a 2010 update) were introduced to account for tectonic shifts. Overall, KGD2002’s establishment was a foundational step for the Republic of Korea’s geospatial infrastructure, enabling centimeter-level consistency nationwide and seamless integration with global coordinate systems. The aim of this study is to quantitatively compare coordinate solutions computed using GAMIT/GLOBK and Bernese software within the static KGD2002 reference frame (epoch 2002.0).
Since 2008, in response to the increasing use of global navigation satellite systems (GNSSs), triangulation points—especially those located in remote and mountainous areas—have been systematically relocated to urban regions. This nationwide relocation and modernization initiative is referred to as the unified geodetic control point.
Between 2008 and 2021, approximately 5500 unified geodetic control points (UGCPs) were established across the Republic of Korea. Traditionally, each UGCP was computed using observations from a set of four to five nearby satellite reference stations. However, due to inconsistencies in the selection of reference stations across regions, existing region-based adjustment strategies have proven insufficient in maintaining positional consistency on a national scale. To overcome this limitation, this study introduces a unified geodetic adjustment strategy that fixes 17 (strong constraints) consistent nationwide satellite reference stations as common control points [13,14].
Within the KGD2002 reference frame, various GNSS data processing software can be used to compute station coordinates. Among them, two widely used scientific packages are GAMIT/GLOBK, developed at MIT, and Bernese, developed at the University of Bern. These two software packages employ different strategies for baseline processing, network adjustment, and reference frame alignment [15,16,17,18,19].
It is essential to evaluate how closely independently processed coordinate solutions align with the official reference frame. In this study, we perform a detailed comparison between GAMIT/GLOBK-derived coordinates and KGD2002, as well as between Bernese-derived coordinates and KGD2002. The comparison is based on 3164 unified geodetic control points (UGCPs) officially published in the KGD2002 frame, which are treated as truth references in the analysis.

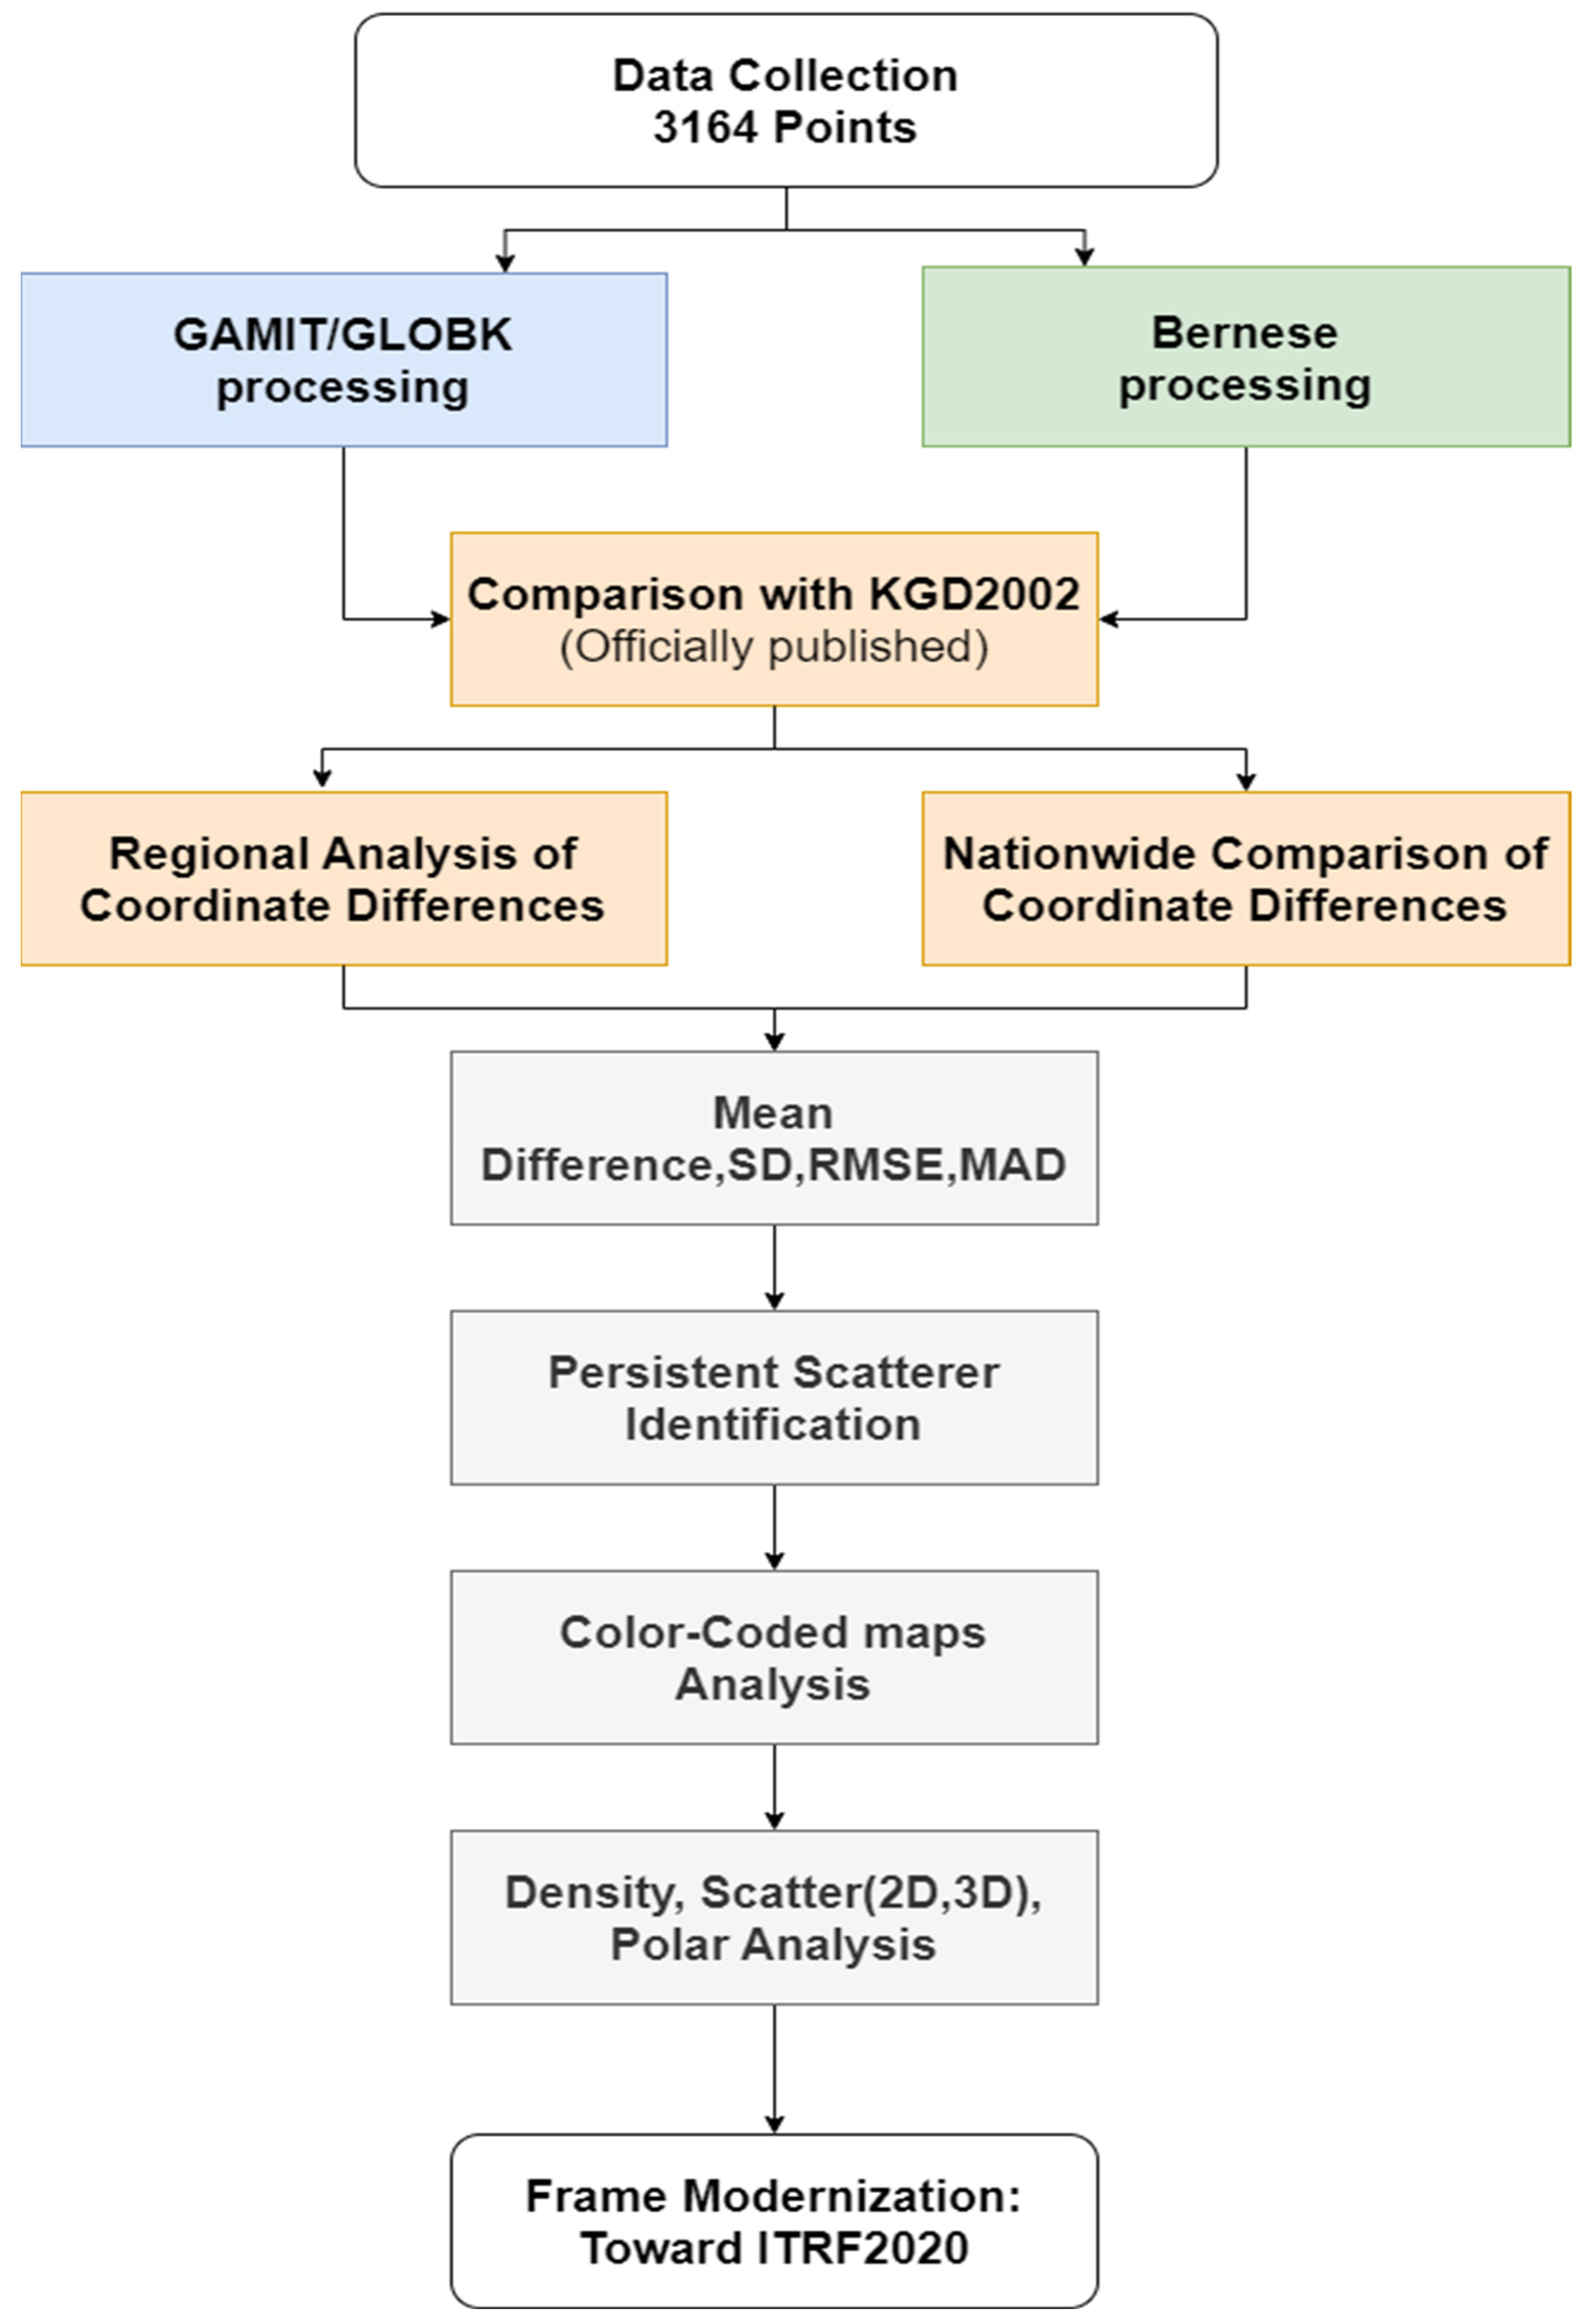
2. Materials and Methods

2.1. Study Areas

This study covers a nationwide set of geodetic control points distributed across the entire territory of the Republic of Korea. The approximately 1700 unified geodetic control points (UGCPs) used in the analysis are spatially well distributed, encompassing all major administrative regions, including the seven metropolitan cities and nine provinces, as well as Jeju Island.
The broad spatial coverage enables not only an assessment of overall coordinate consistency between GNSS processing software and the KGD2002 reference frame but also a region-by-region analysis of systematic or random discrepancies. Since local network geometry, observation density, and environmental conditions may vary geographically, evaluating spatial patterns in coordinate differences is essential for understanding the performance of each software in practical geodetic applications. Regional metrics such as mean offsets and RMSE values are therefore computed separately for each administrative unit to identify potential patterns of bias or distortion.
Figure 1 presents the spatial distribution of the unified geodetic control points (UGCPs) used in this study, totaling 3164 stations. These points represent the subset of nationwide geodetic control stations for which coordinates were successfully computed using both the GAMIT/GLOBK and BERNESE GNSS processing software. To ensure data quality and comparability, only stations with observation durations of eight hours or longer were included in the analysis. The selected UGCPs are evenly distributed across the entire territory of the Republic of Korea, encompassing all major administrative regions including the seven metropolitan cities, nine provinces, and Jeju Island.
The map clearly demonstrates the extensive spatial coverage of the dataset, which provides a solid foundation for both national-scale and regional analyses of coordinate consistency. The dense distribution of points allows for high-resolution assessment of regional discrepancies, which may result from differences in network geometry, satellite visibility, multipath effects, or localized environmental factors. To aid in regional interpretation, approximate administrative boundaries and area labels have been included on the map. The GNSS data quality and network stability of these control points have already been thoroughly evaluated in studies [13,14], thereby reinforcing the reliability of the dataset. This spatial visualization not only underscores the comprehensive nature of the dataset but also provides a geographic reference for interpreting the statistical results of coordinate differences—such as mean offsets and RMSE values—discussed in subsequent sections.

2.2. Comparison of GNSS Data Processing Strategies and Software

The analysis is based on coordinate comparison datasets provided for numerous geodetic control points distributed across the Republic of Korea. One dataset contains the coordinates obtained from a GAMIT/GLOBK-integrated network adjustment in the KGD2002 frame, and another contains coordinates from a Bernese software network adjustment in the same frame. Each dataset lists, for each control station, the official “published” northing (N) and easting (E) coordinates in KGD2002—often projected in the national Transverse Mercator (TM) grid—alongside the corresponding coordinates computed by the software.
We processed the dataset independently with two software packages: (1) GAMIT/GLOBK (version 10.71), developed at MIT [16,17], and (2) Bernese GNSS Software (version 5.2), developed at the University of Bern [19]. Both software were configured to use consistent processing strategies to the extent possible. The precise IGS orbits and Earth rotation parameters for all observation days were applied identically in both cases. We used double-differenced GPS L1+L2 observations for baseline processing, applying ionosphere-free linear combinations. Tropospheric delay was estimated with modern mapping functions (e.g., VMF1 in Bernese, GMF in GAMIT) at fixed intervals, and antenna phase center models (IGS14 ANTEX) were applied in both solutions. Integer ambiguities were resolved using the Quasi-Ionosphere-Free (QIF) method in Bernese [19] and the wide-lane then phase-update strategy in GAMIT [16,17]. The processing of daily baselines in GAMIT was followed by a network adjustment in GLOBK, whereas Bernese used a combined network least-squares adjustment (GPSEST) after baseline processing. The 17 CORS with known KGD2002 coordinates were held fixed, and a 7-parameter transformation was applied to convert all points into the KGD2002 reference frame [20]. This “fixed stations” approach yields station coordinates in the KGD2002 datum for all points [13].
Both GAMIT/GLOBK and Bernese GNSS software packages utilize precise orbit products to enhance the accuracy of satellite positioning. These precise orbits, provided by the International GNSS Service (IGS), are critical for high-precision GNSS processing. However, each software package handles these products differently according to its internal architecture and processing workflow.
GAMIT/GLOBK directly uses the IGS-provided SP3-format precise ephemerides. The SP3 files contain satellite position and clock information and are widely supported across GNSS software. GAMIT reads the SP3 files natively and integrates the orbital data during baseline and network adjustment processing.
In contrast, the Bernese GNSS Software requires the SP3 orbits to be converted into its own internal format, known as STD (Standard Orbit Format). This conversion is performed using Bernese’s ORBGEN module, which prepares the orbit data for use in subsequent processing steps such as baseline analysis and network adjustment.
Despite the differences in format and handling, both software packages rely on the same underlying IGS precise orbit data, ensuring consistency in satellite positioning and making the coordinate comparison between the two systems valid and robust.

2.3. Analysis of ΔN/ΔE and Regional Statistics

We focus on the horizontal components (N, E), since these define the planar position; ellipsoidal or orthometric heights are not analyzed in this comparison. For each station, the difference in northing (ΔN) and easting (ΔE) is computed as
Δ N = N official N software , Δ E = E official E software
A positive ΔN or ΔE indicates that the official KGD2002 coordinate lies to the north or east of the software-derived coordinate, respectively (i.e., the software solution is displaced slightly south or west of the official position), and vice versa for negative values. These differences reflect how closely the GAMIT or Bernese solutions reproduce the official KGD2002 coordinates for each location. In the ideal case of perfect alignment, both ΔN and ΔE would be zero. In practice, residual differences on the order of a few millimeters to centimeters are expected due to random observational errors, baseline processing differences, and slight systematic offsets in the network adjustment procedures.
We evaluated the coordinate differences using several statistical metrics applied separately to the northing (ΔN) and easting (ΔE) components. These metrics are as follows:
  • Mean difference (MD): The average of ΔN or ΔE across all stations, representing the overall bias or systematic offset of the solution relative to the official KGD2002 coordinates [21].
  • Standard deviation (SD): The dispersion of the differences around the mean, indicating the typical magnitude of random error in the coordinate estimates [22].
  • Root mean square error (RMSE): A combined measure of bias and scatter, calculated as RMSE = √(Mean2 + SD2). This metric represents the overall positional accuracy of the software-derived coordinates relative to the official KGD2002 values [23].
  • Mean absolute deviation (MAD): The mean of the absolute values of ΔN or ΔE, providing a robust measure of typical error magnitude that is less affected by outliers than SD or RMSE [24].
  • 95% confidence interval: The range between the 2.5th and 97.5th percentiles of the difference distribution, indicating the interval within which approximately 95% of the coordinate differences fall. Given that the distributions are generally centered near zero, this interval is approximately equivalent to ±1.96 standard deviations under the assumption of normality [25].
These metrics are computed separately for the GAMIT/GLOBK vs. KGD2002 differences and for the Bernese vs. KGD2002 differences, and separately for northings and eastings. We also performed a regional analysis by grouping stations by province or major city. For each region, we computed the mean and RMSE of ΔN and ΔE to see if certain areas have larger or systematic offsets. This can reveal any network distortions or regional biases in the adjustments (for example, poorer network fit in the peripheries vs. the center). We present both national-level statistics and region-by-region results, including tables and a figure for visualization.
In addition to quantifying coordinate differences, this study also considers the broader implications of using a national reference frame that is now over two decades old. Based on the comparative results obtained from GAMIT/GLOBK and Bernese processing, we assess whether the existing KGD2002 framework still provides a reliable foundation for high-precision GNSS applications. Furthermore, we discuss the potential need for adopting a more modern reference frame—such as ITRF2020—given the evolving demands of geodetic infrastructure, positioning services, and international compatibility.

2.4. Methodological Strategy for Comparative GNSS Processing

In this study, station coordinates were computed for approximately 3164 unified geodetic control points (UGCPs) distributed across the Republic of Korea using both the GAMIT/GLOBK and Bernese GNSS software. To ensure comparability, both software packages were configured to follow a consistent processing strategy. For all observations, the same precise satellite orbits and Earth rotation parameters provided by the International GNSS Service (IGS) were applied. GPS L1/L2 observations were processed using a double-differencing technique, and ionospheric delay was removed through ionosphere-free linear combinations.
Tropospheric delay estimation was also harmonized between the two software. The Bernese software used Vienna Mapping Function 1 (VMF1), while GAMIT/GLOBK used the Global Mapping Function (GMF), both applied at fixed intervals. Antenna phase center corrections based on the IGS14 ANTEX model were uniformly applied in both solutions. Integer ambiguity resolution was handled using the Quasi-Ionosphere-Free (QIF) method in Bernese [19] and the wide-lane followed by phase-update strategy in GAMIT/GLOBK [16,17].
While the baseline processing and network adjustment approaches differ—Bernese uses GPSEST for combined least-squares estimation and GAMIT uses a GLOBK-based adjustment—both solutions initially employed a minimally constrained network. Final station positions were realized in the KGD2002 reference frame (epoch 2002.0) through a 7-parameter Helmert transformation using a fixed set of 17 nationwide continuously operating reference stations (CORSs) as control points [26,27,28].
This approach ensures that coordinates from both software systems are directly comparable within the same static geodetic datum. Previous studies have shown that when such consistent processing parameters and frame realization strategies are applied, coordinate discrepancies between GAMIT/GLOBK and Bernese remain at the sub-centimeter or even millimeter level. The stepwise methodology of this study is summarized in Figure 2, including data processing, coordinate comparisons, residual analysis, and the proposed transition to ITRF2020.

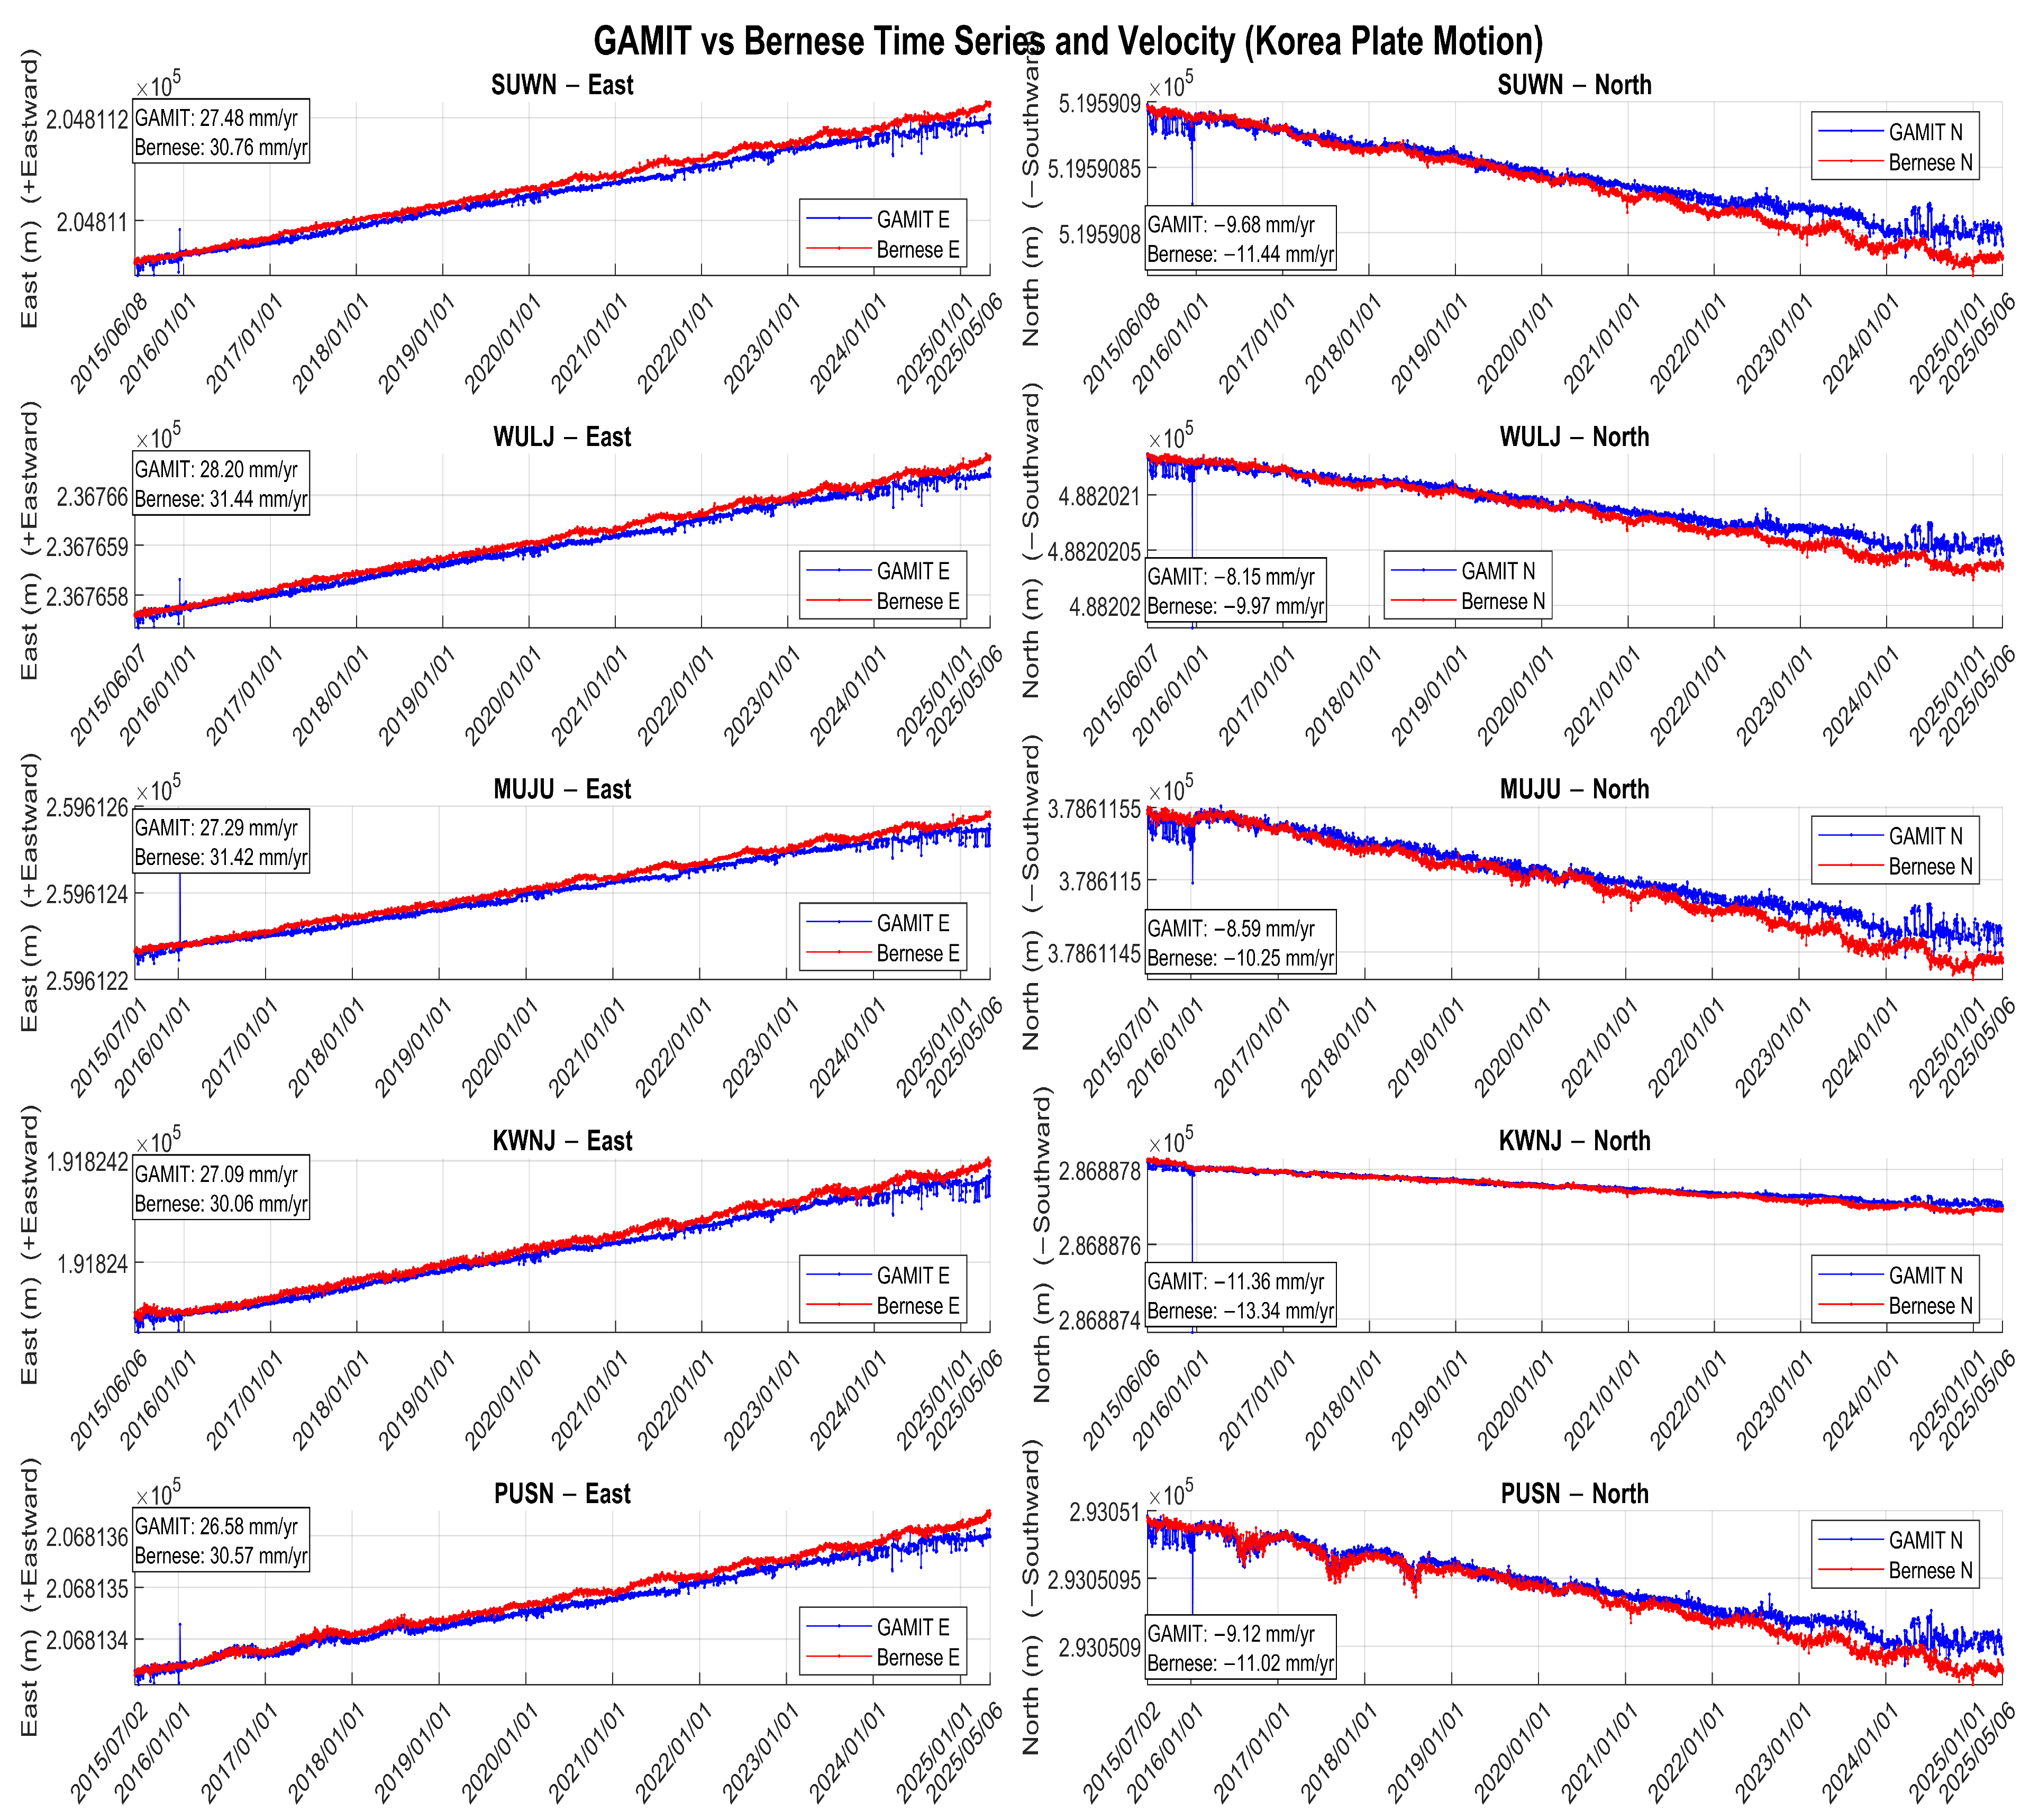
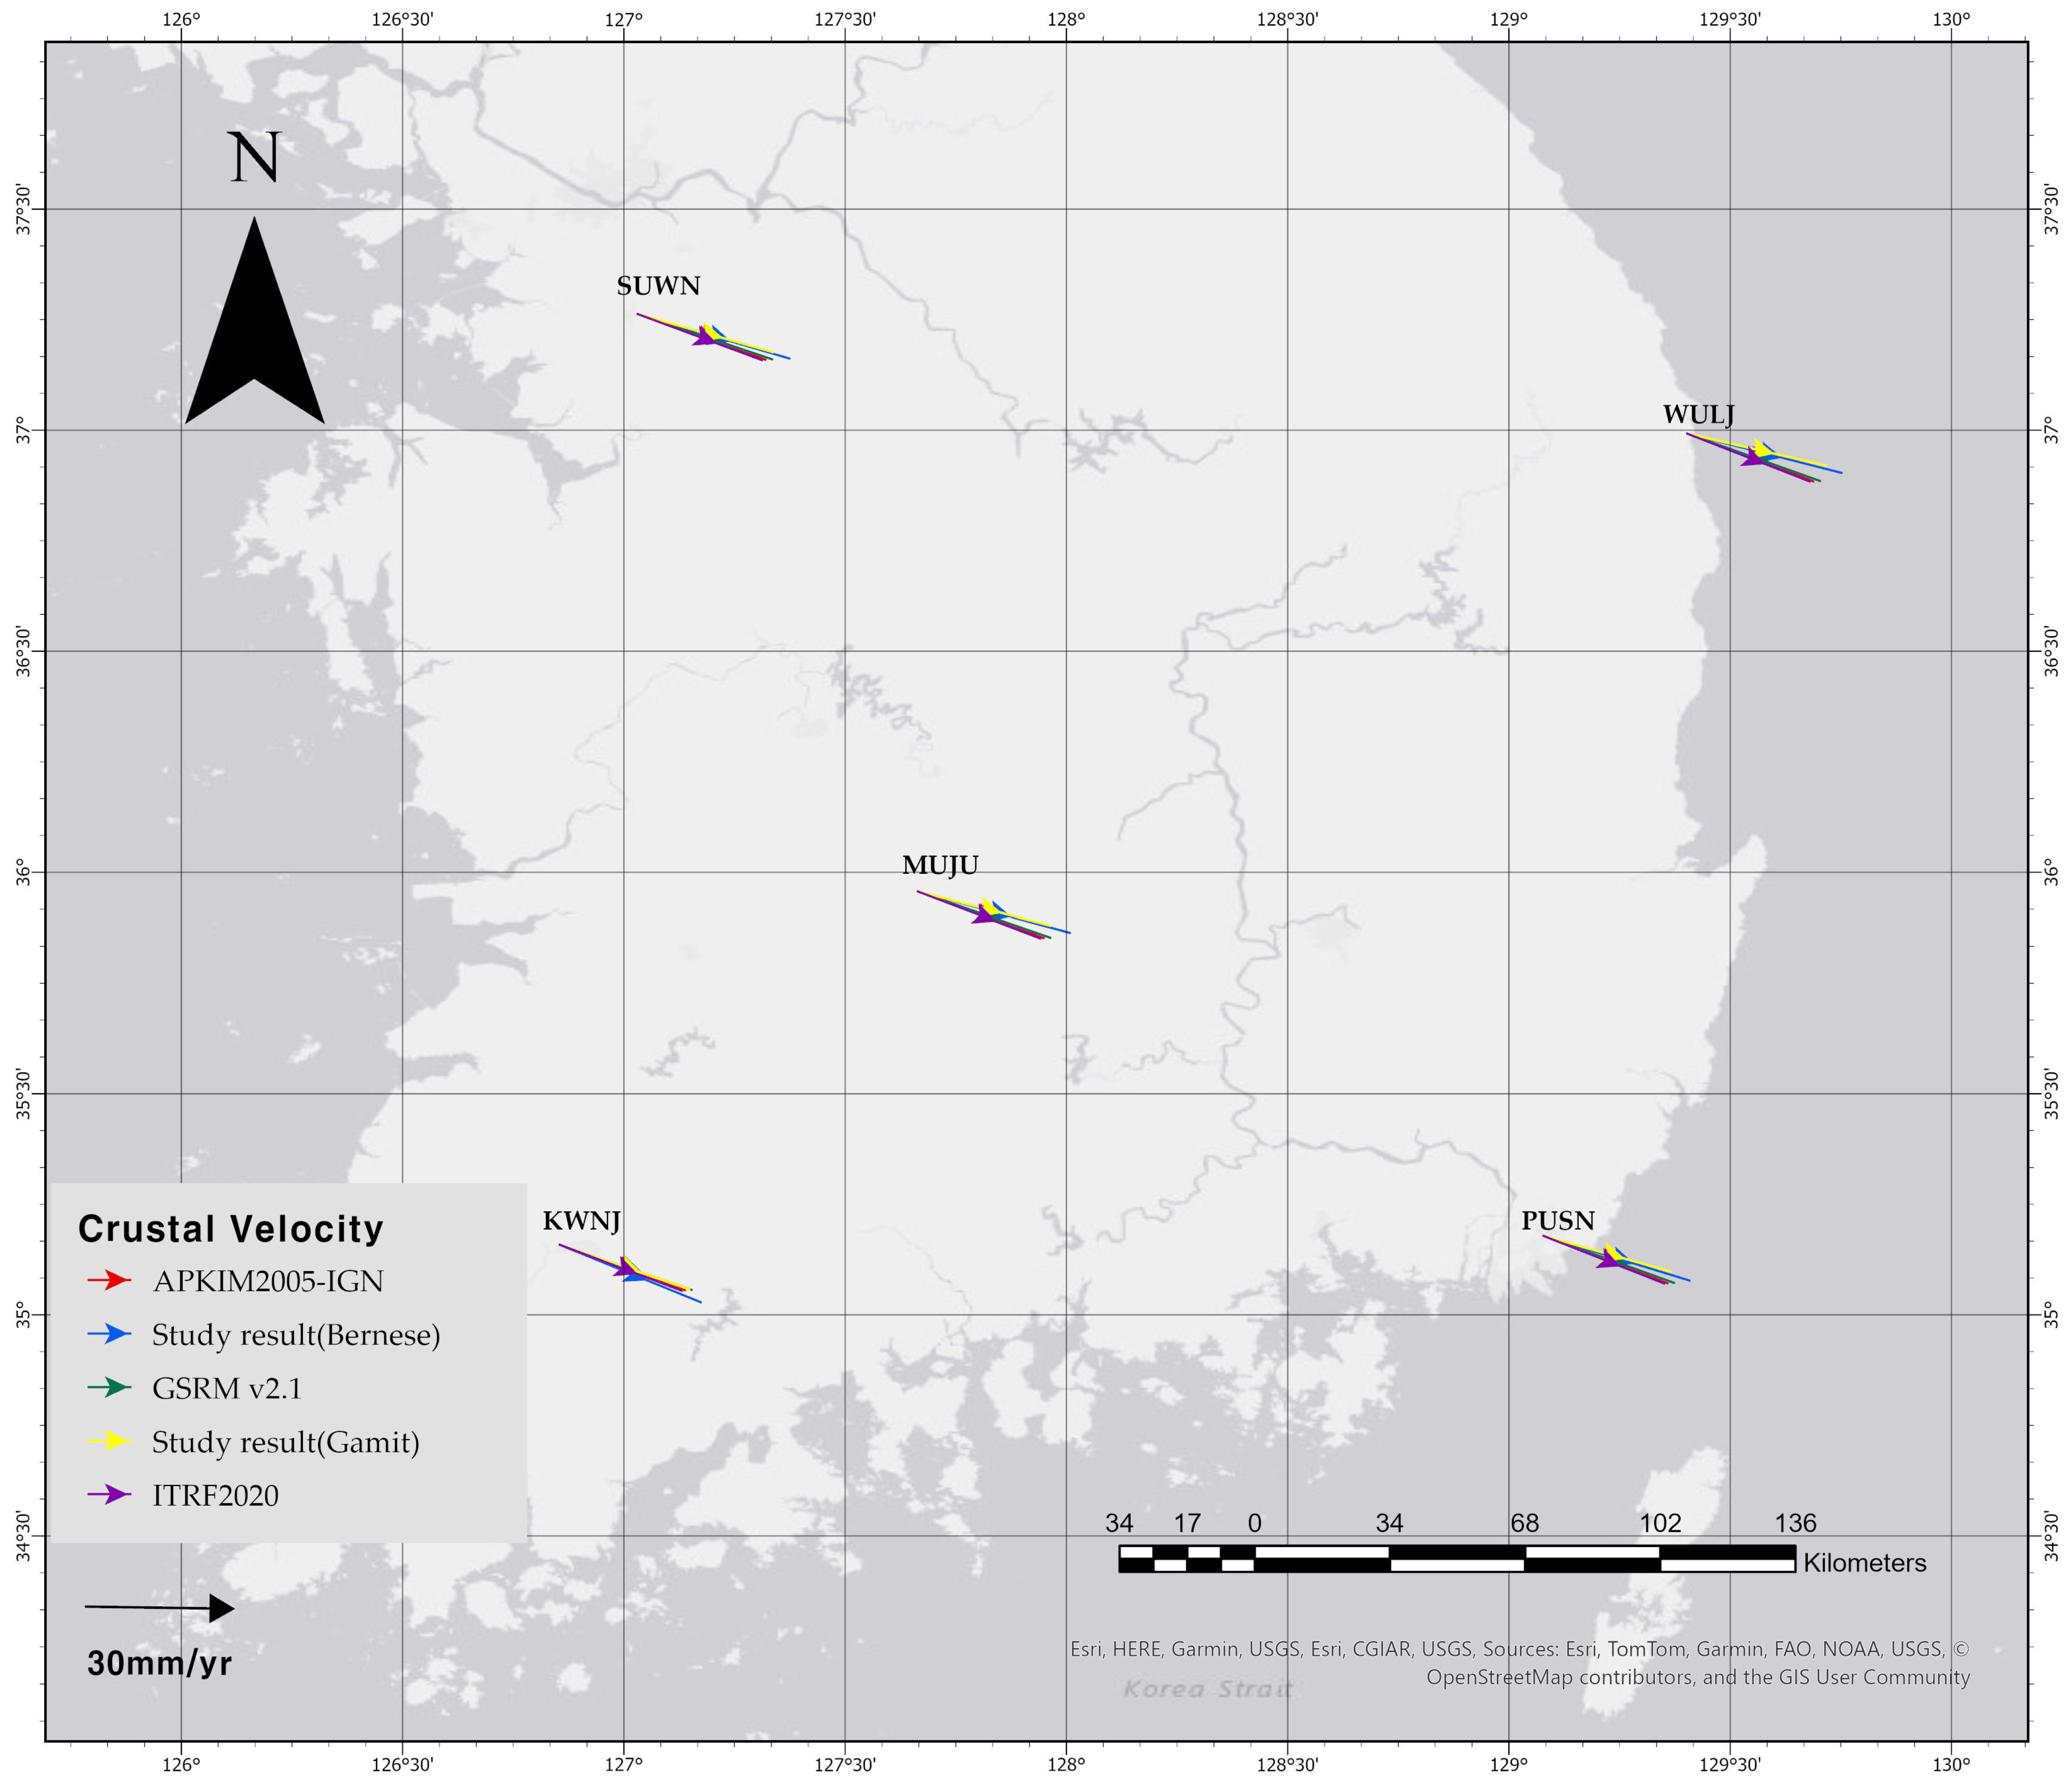
2.5. Long-Term Crustal Velocity Field of the Korean Peninsula: Impact on Static Datum Realization

Although the Korean Peninsula is generally regarded as a tectonically stable intraplate region, recent GNSS observations reveal consistent horizontal motions at the millimeter-per-year level. Figure 3 illustrates the horizontal crustal velocity field derived from approximately 10 years of CORS GNSS observations (2015–2025), expressed in a Eurasia-fixed reference frame. The velocity vectors indicate that the peninsula is undergoing coherent motion toward the east–southeast at an average rate of approximately 30–32 mm/year, with directional azimuths generally between 110° and 130°. This motion is broadly consistent across the region and reflects stable but measurable tectonic displacement.
While these velocities may appear small in a global context, they accumulate significantly over time. For example, 30 mm/year motion results in a 3 cm shift over just one year and nearly 30 cm over a decade. Such shifts are highly relevant when evaluating the adequacy of a static reference frame like KGD2002, which is fixed at epoch 2002.0 and does not account for ongoing crustal motion.
To mitigate the effects of these accumulated displacements, this study applied a strong-constraint adjustment strategy using 17 national continuously operating reference stations (CORSs) whose positions were computed in the KGD2002 frame. The velocities of these CORSs were rigorously analyzed and held fixed during the network realization, enabling a comparative analysis with the static reference frame KGD2002, which is fixed at a specific epoch (2002.0) and does not account for ongoing crustal motion [13].
Figure 4 presents a comparative visualization of horizontal crustal velocities at five selected GNSS sites across the Korean Peninsula: SUWN, WULJ, MUJU, KWNJ, and PUSN. The velocity vectors are derived from two empirical solutions—GAMIT/GLOBK and Bernese—based on 10-year time series analyses and were compared with three global tectonic models, ITRF2020, GSRM v2.1, and APKIM2005-IGN, computed using the UNAVCO GAGE Plate Motion Calculator [29,30,31,32].
Overall, the observed GNSS-derived velocities exhibit strong agreement with the global model predictions, particularly in terms of vector orientation and magnitude. Most sites show horizontal motions directed toward the east–southeast at rates of approximately 30 mm/yr. Minor variations in direction and length between the empirical and model vectors are evident, especially in coastal stations such as WULJ and PUSN. These differences are particularly evident at stations such as WULJ and PUSN. However, they are more likely attributed to the influence of the nearby Yangsan Fault system rather than the coastal location itself. The Yangsan Fault is one of the most seismically active fault zones in Korea. Notably, the 2016 Gyeongju earthquake (Mw 5.8) and the 2017 Pohang earthquake (Mw 5.4)—two of the strongest earthquakes ever recorded in Korea—occurred in this region, indicating that localized crustal deformation may affect velocity estimates near active fault structures.
This comparison provides important validation of the internal consistency of the processed GNSS solutions and supports their alignment with the broader tectonic framework of the region. In particular, localized fault activity—such as the 2016 Gyeongju (Mw 5.8) and 2017 Pohang (Mw 5.4) earthquakes—may introduce discontinuities in regional crustal deformation, affecting the long-term interpretation of velocity fields. Such episodic seismic events and associated nonlinear motions pose intrinsic limitations to the continued use of static datums and further underscore the necessity of evaluating and updating national reference frames like KGD2002.
Table 1 presents the numerical values of the horizontal crustal velocities and azimuths illustrated in Figure 3. The results from the Bernese and GAMIT processing are compared with estimates from three global plate motion models—ITRF2020, GSRM v2.1, and APKIM2005-IGN—at five GNSS stations in southern Korea. Across all models and processing methods, the horizontal velocities range between 27.86 and 33.05 mm/year, and the azimuths fall between 106.12° and 116.4°, indicating a general east–southeastward movement. The GAMIT-derived velocities tend to be slightly lower than those from Bernese and the models, especially at SUWN and KWNJ, where notable azimuthal deviations are also observed.

3. Results

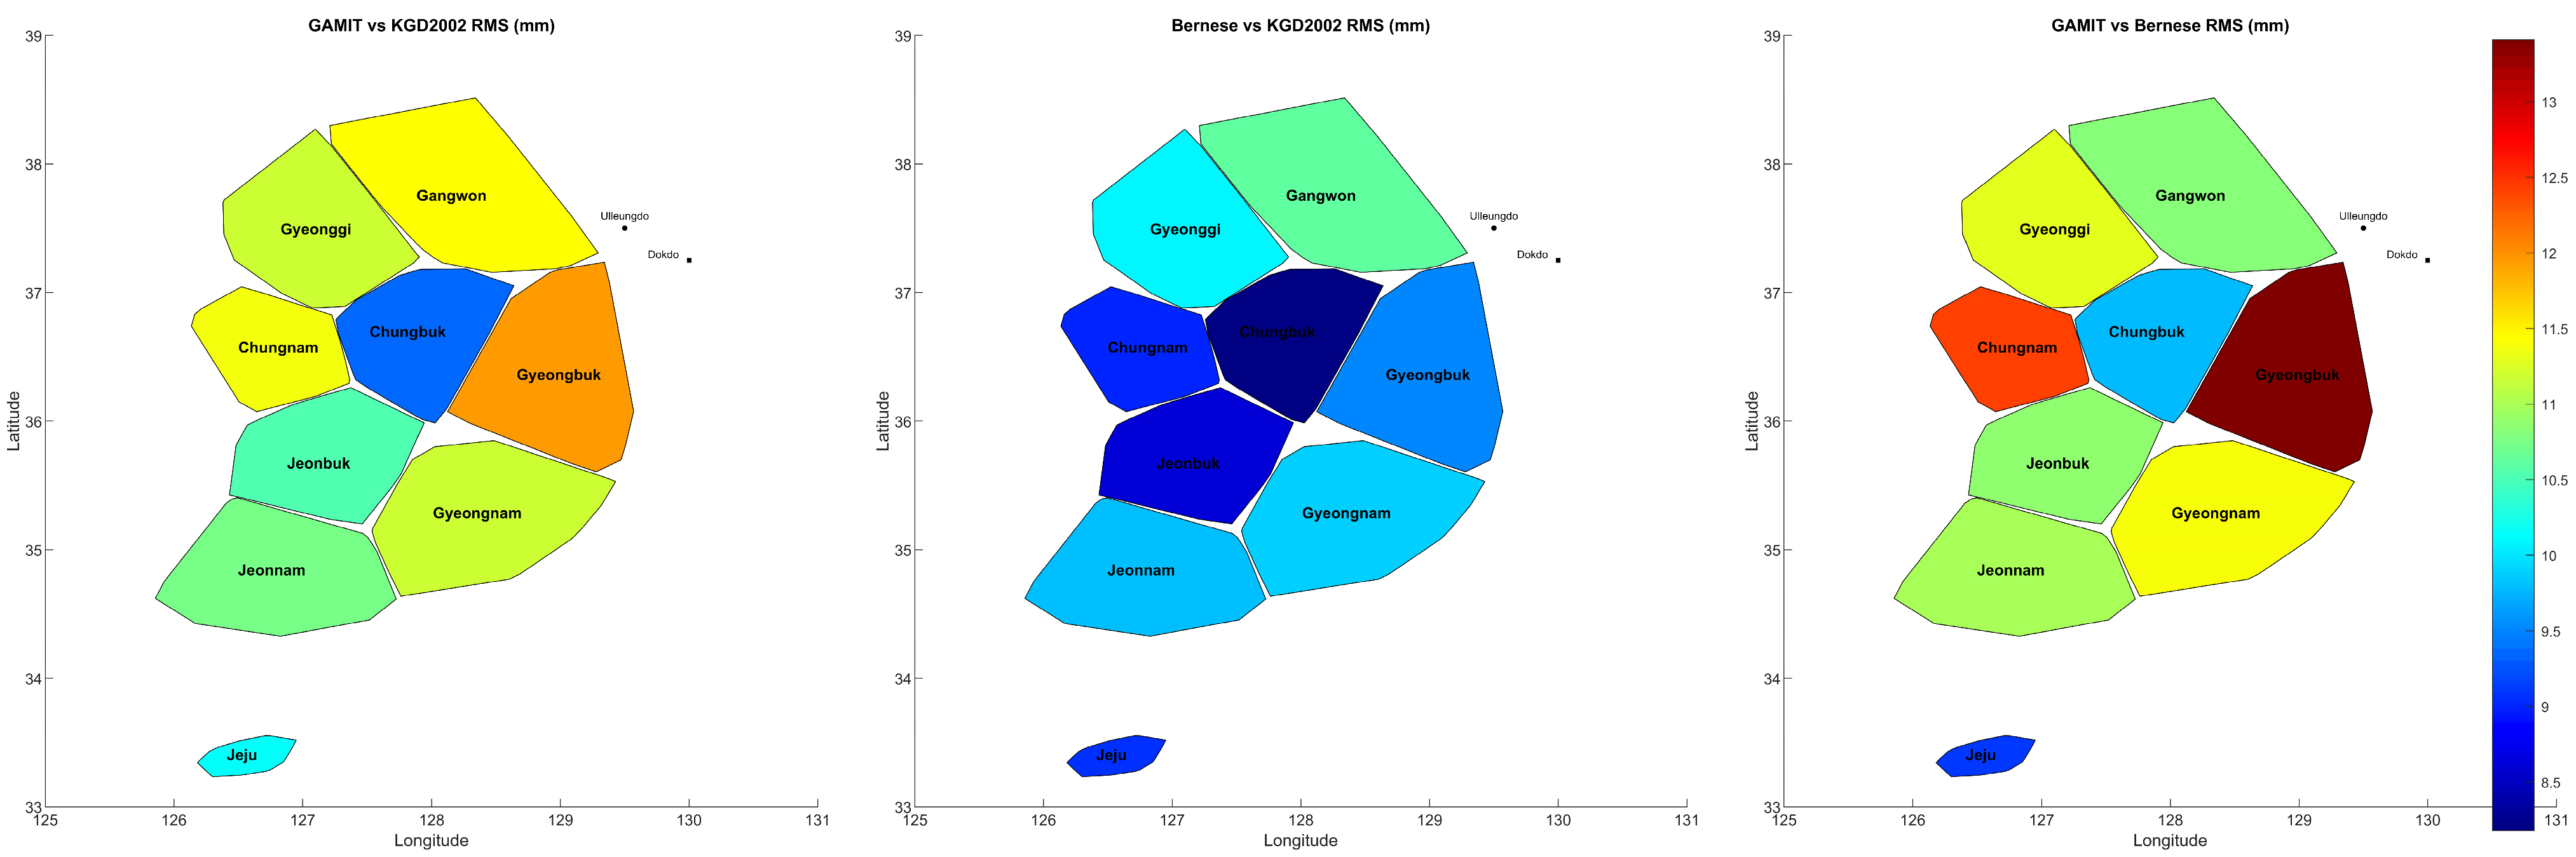
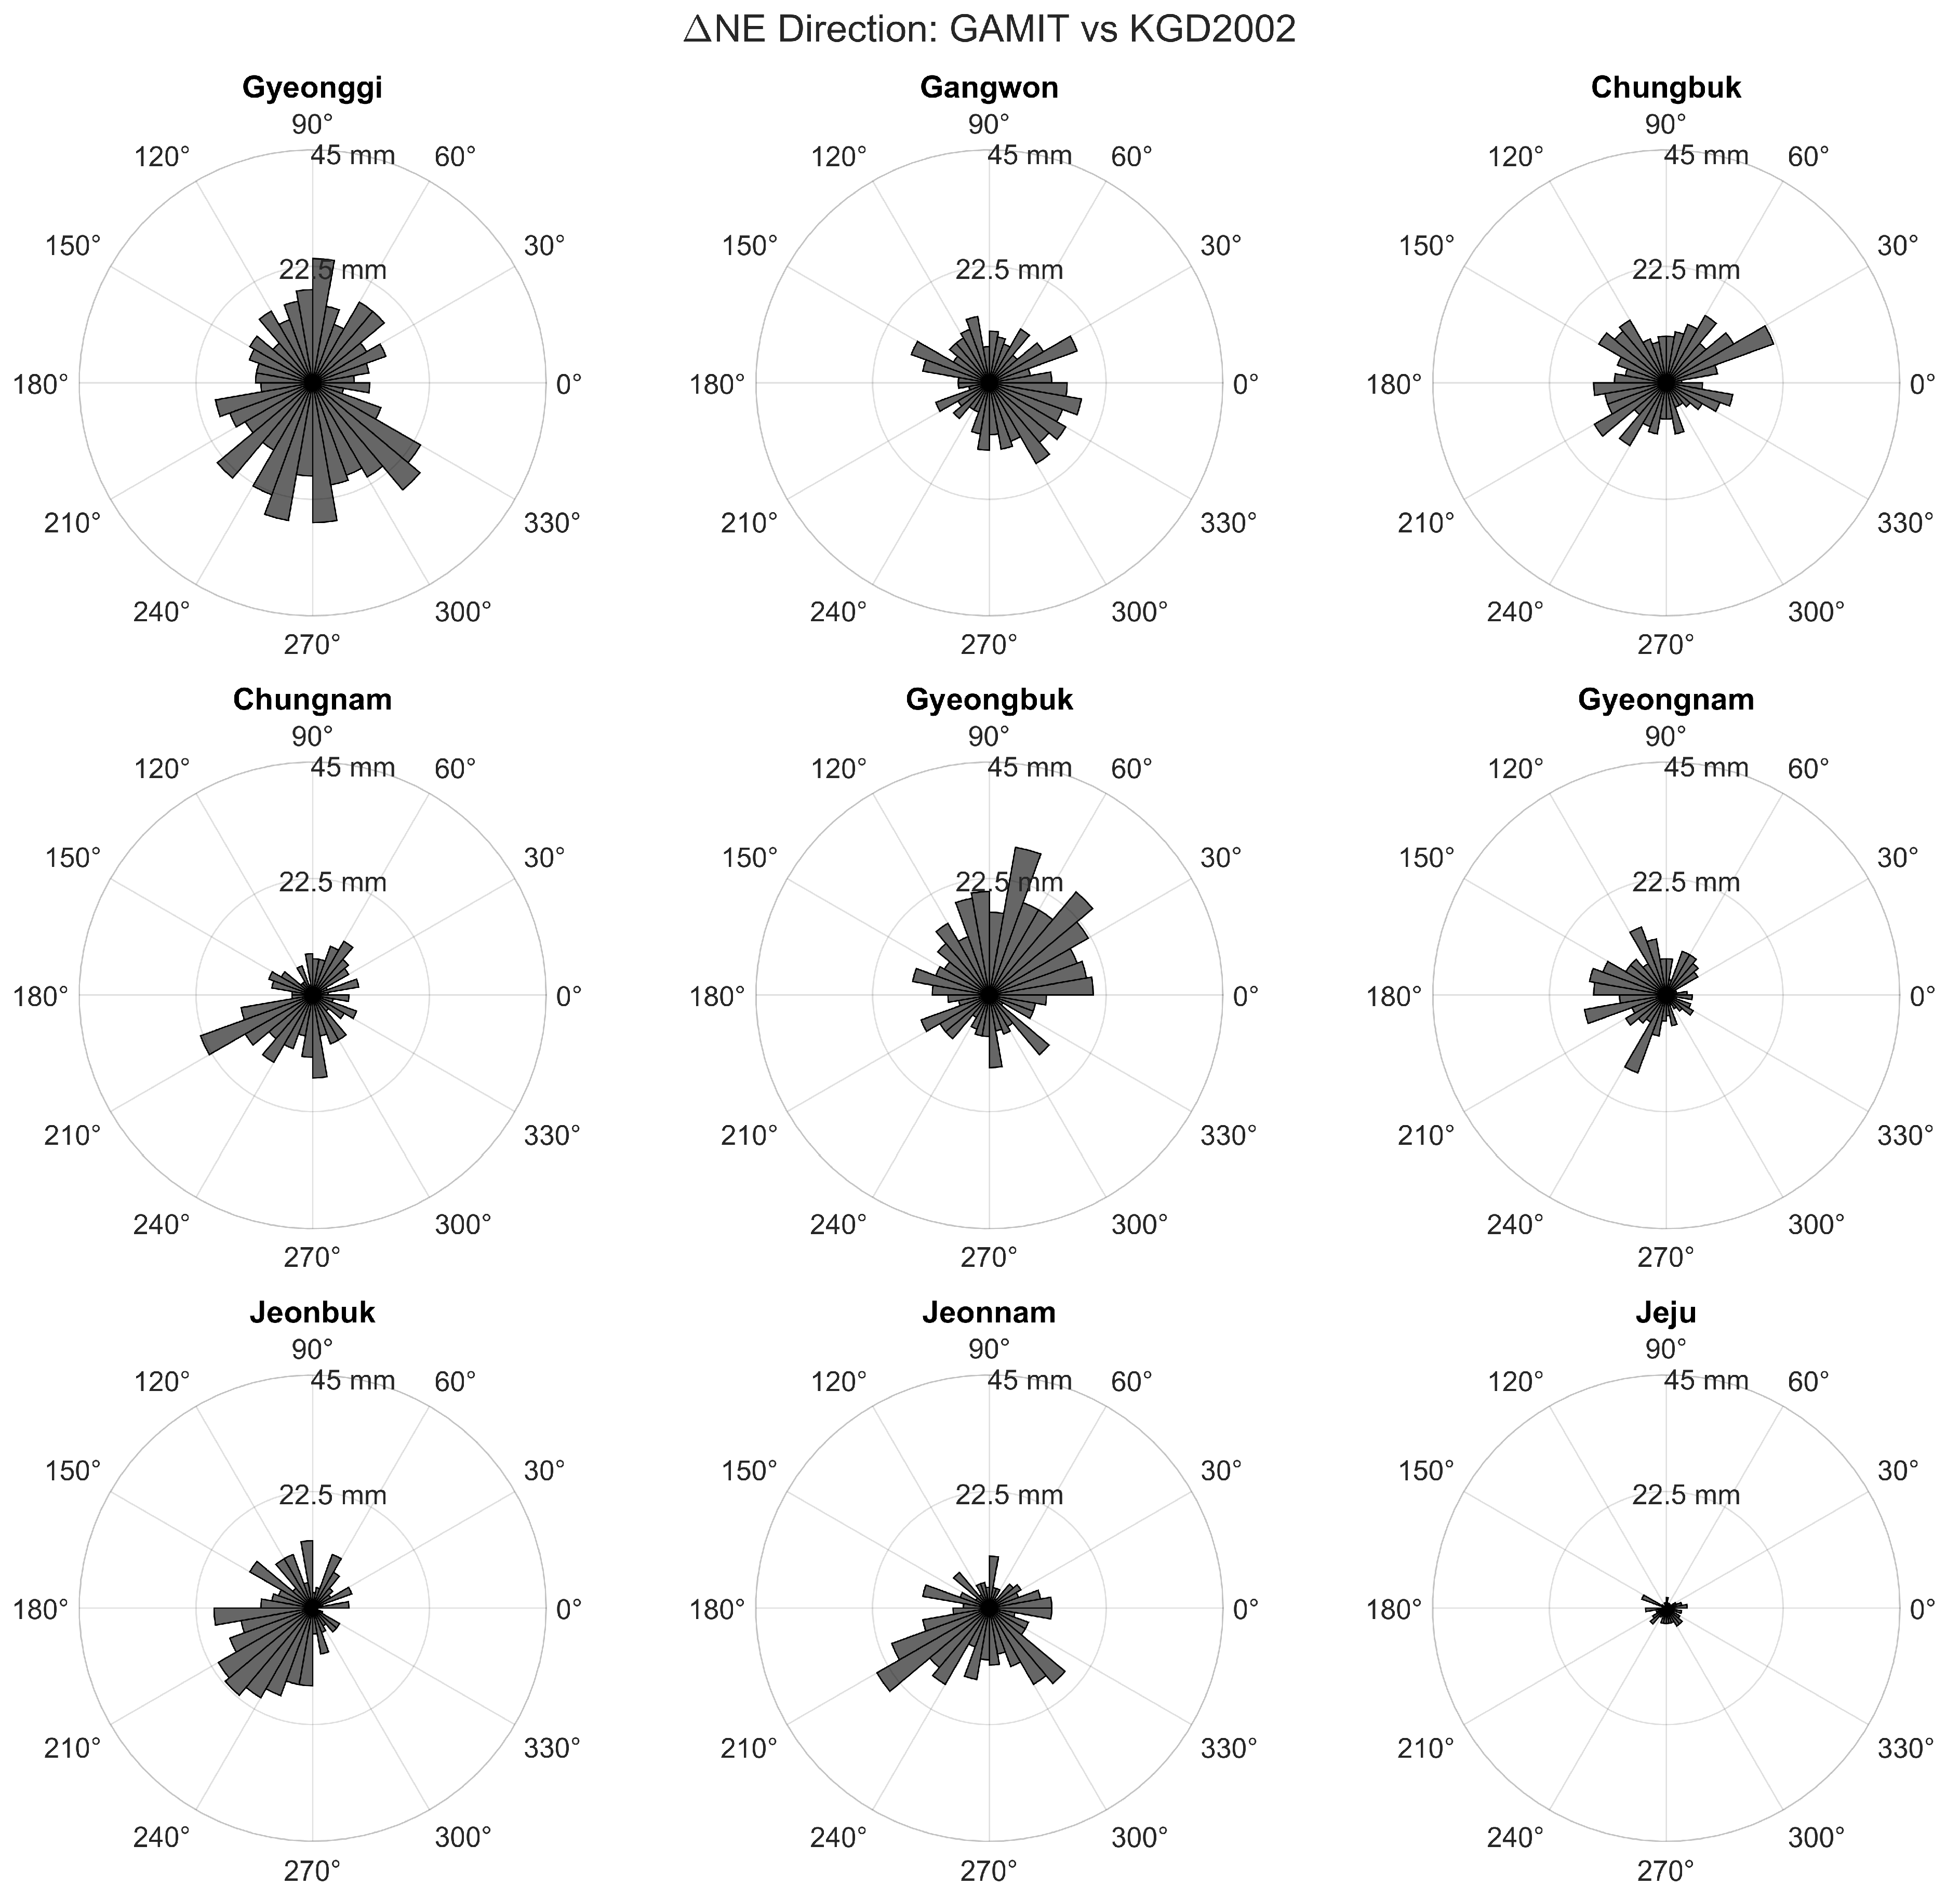
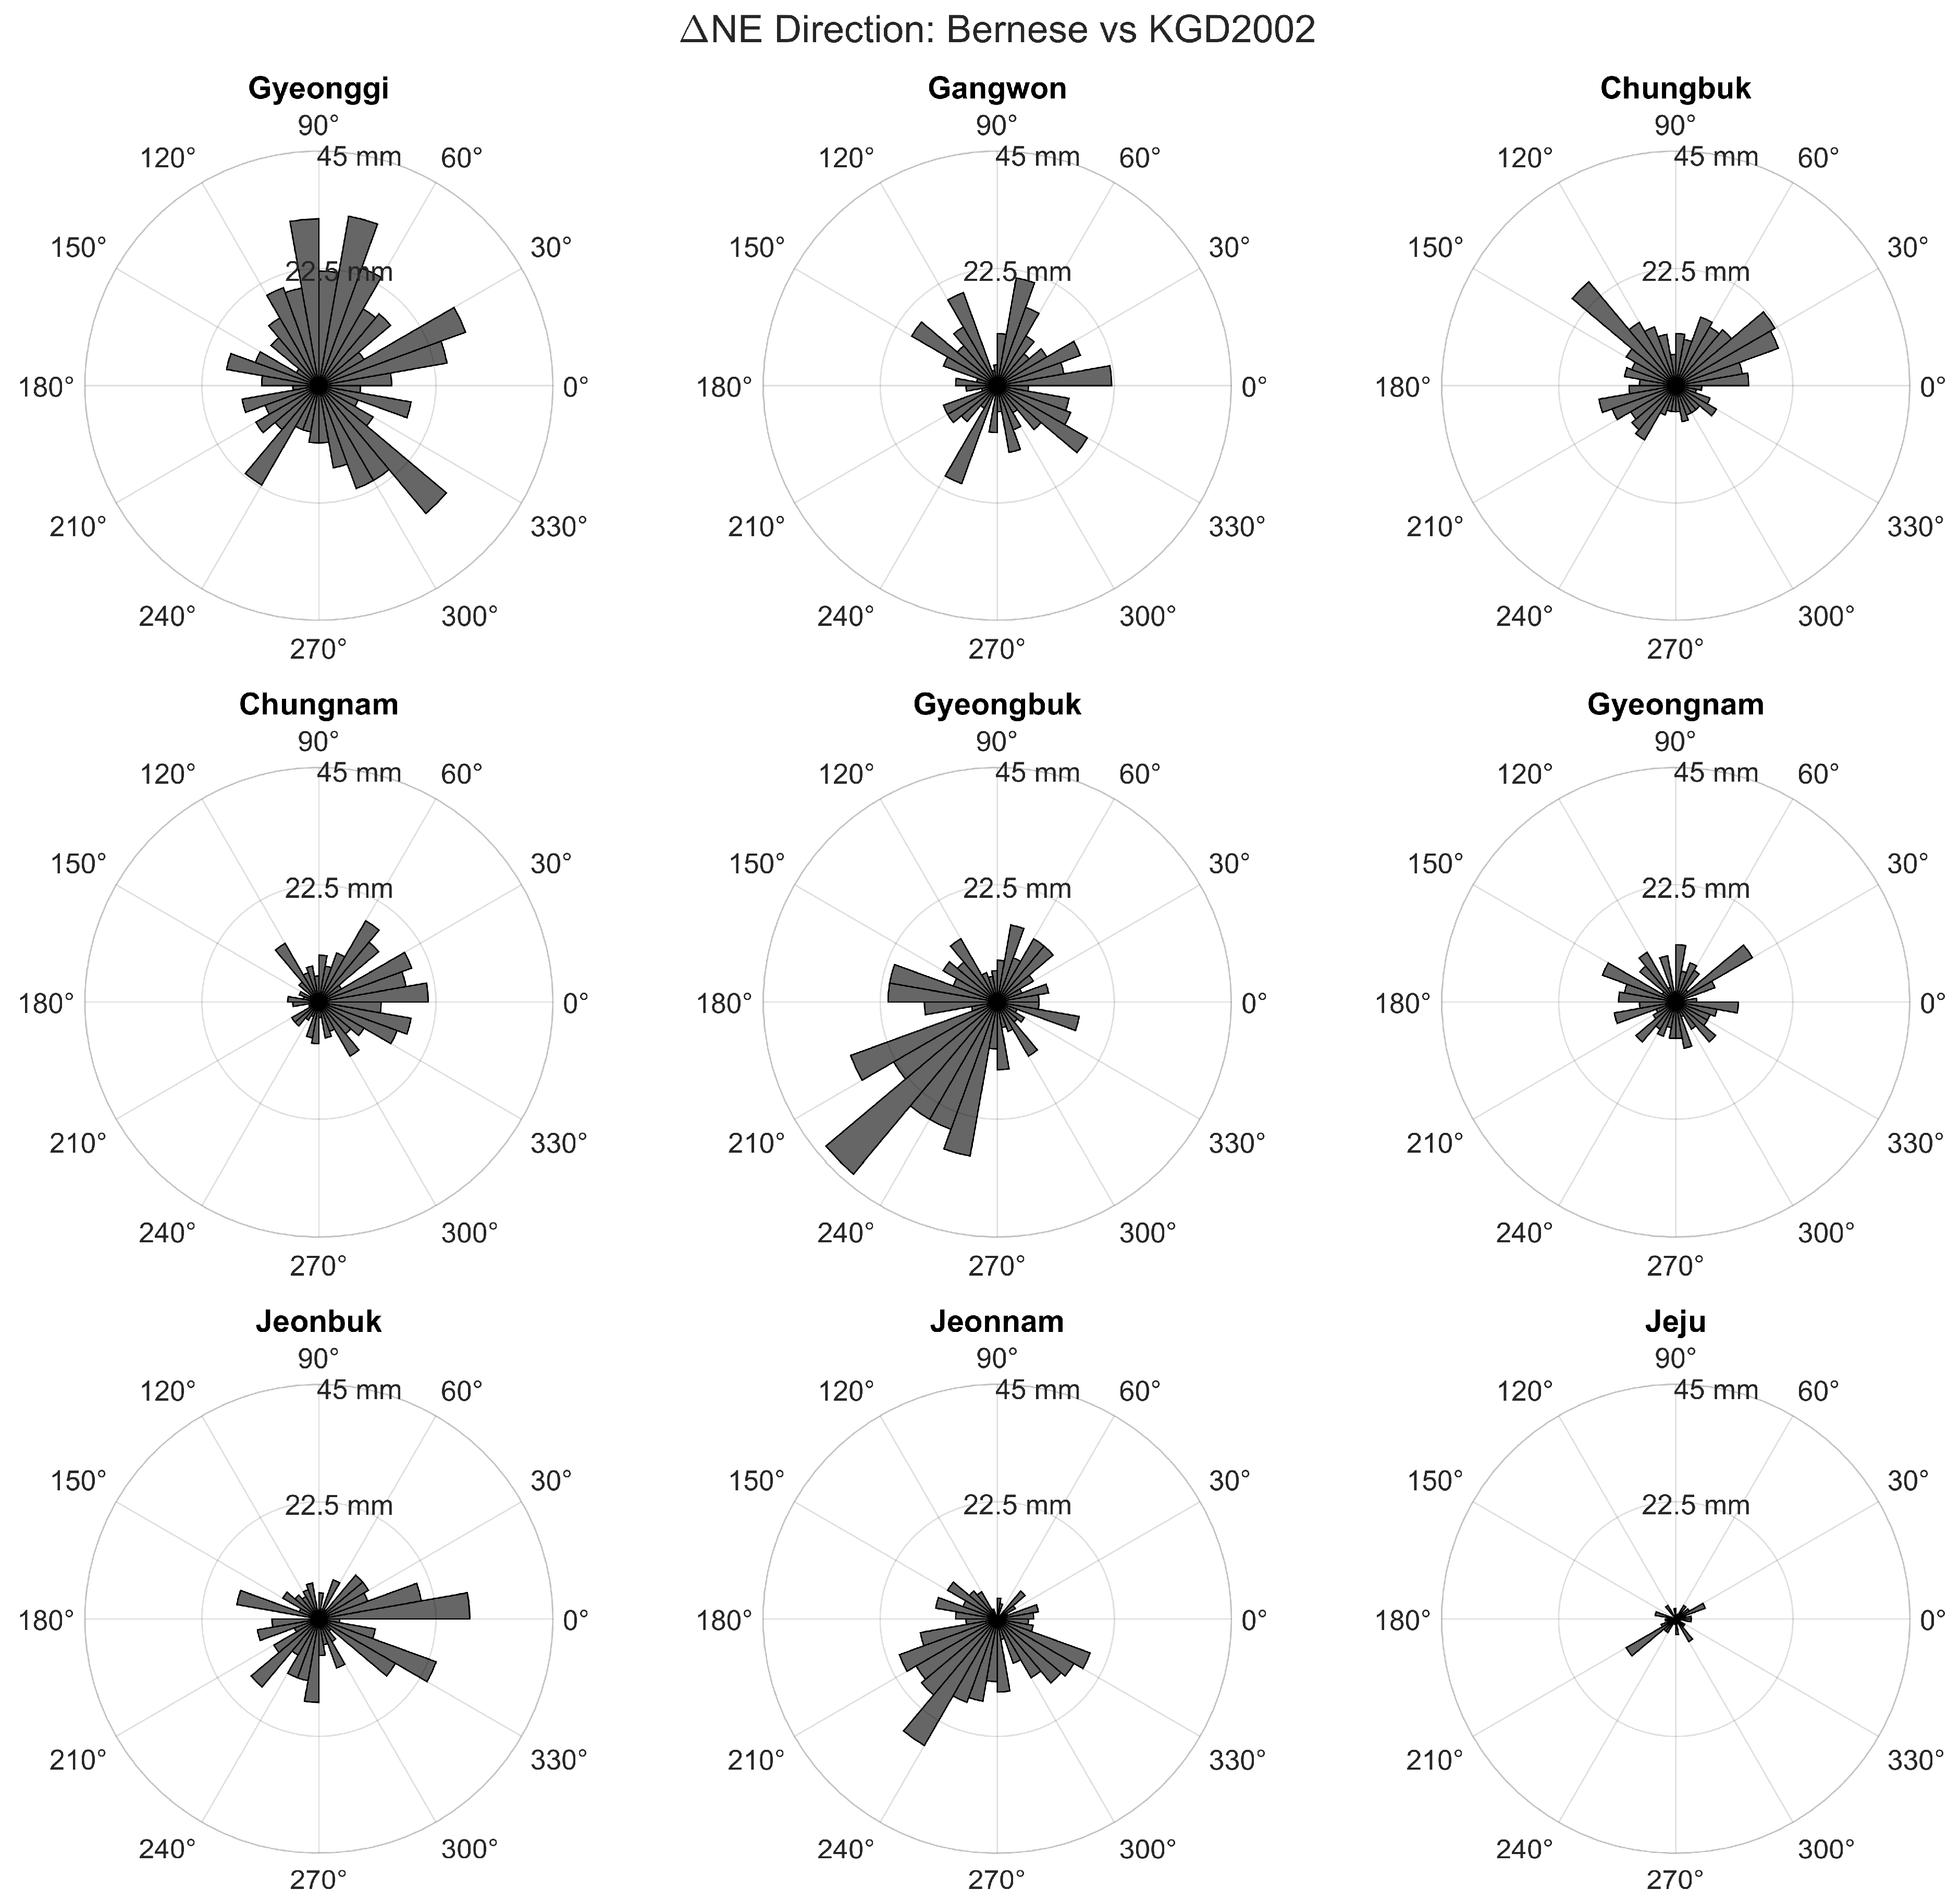
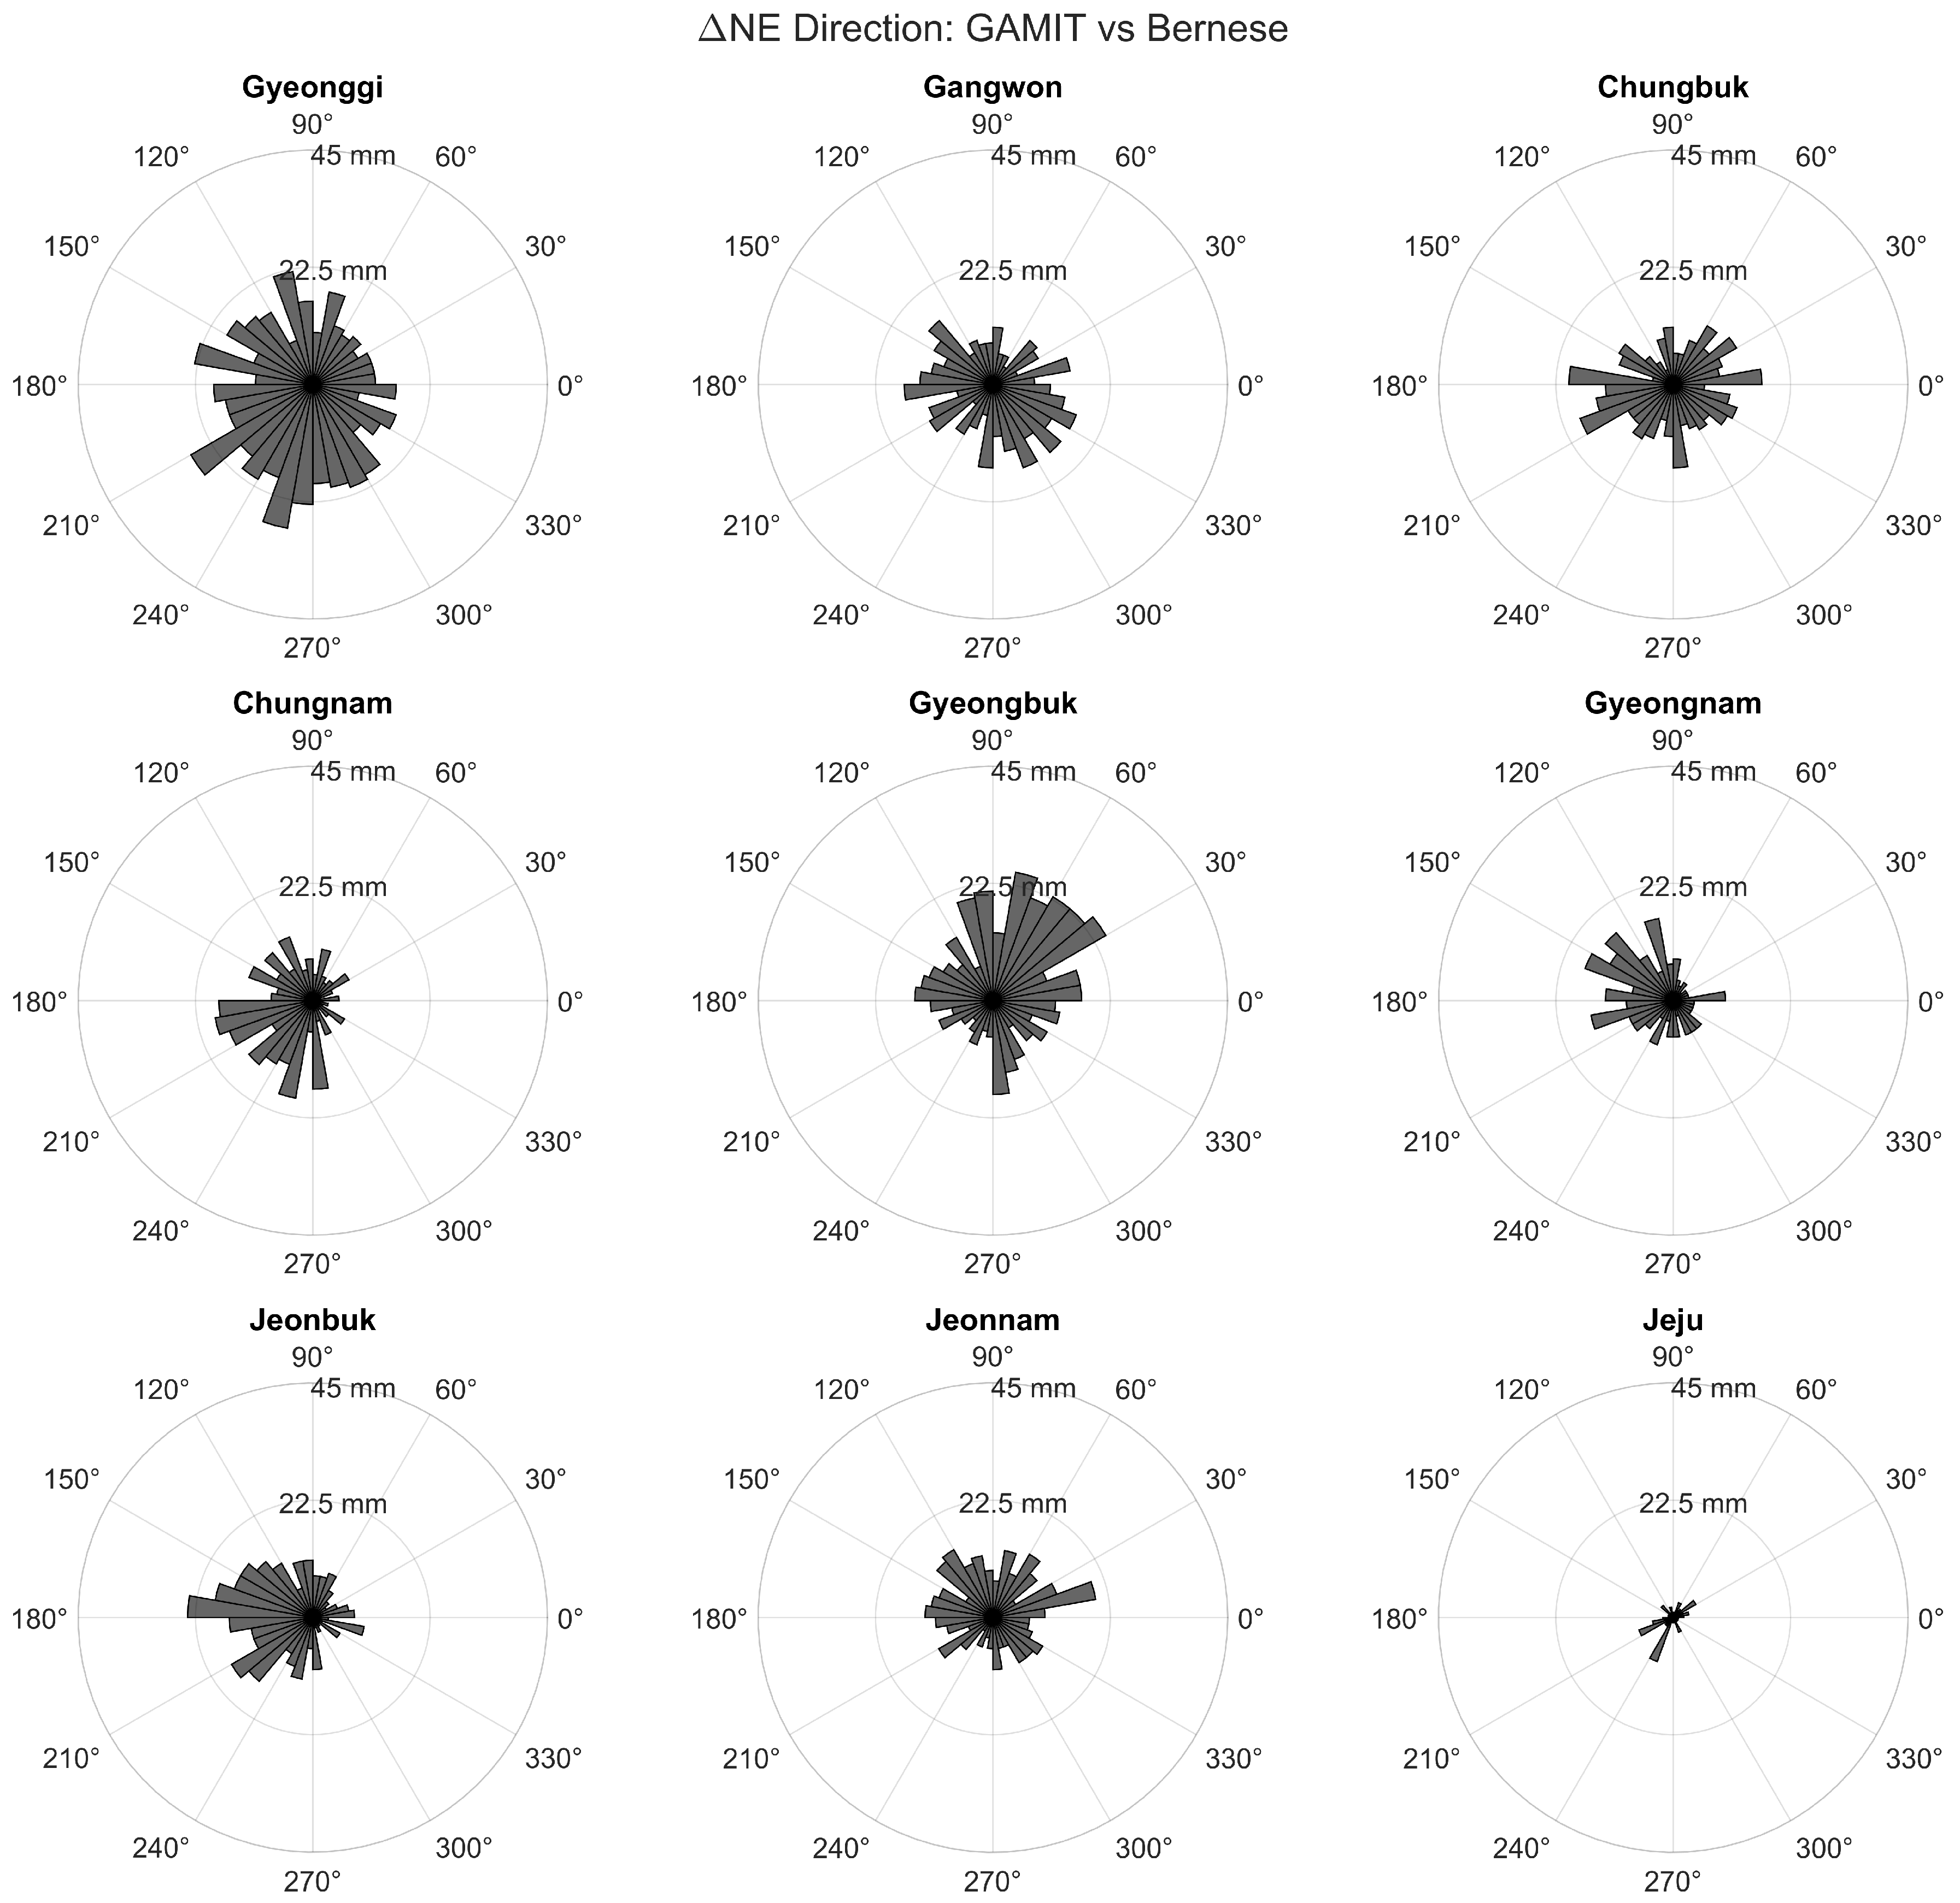
3.1. Regional Analysis of Coordinate Differences

Although the overall agreement in coordinates is excellent, analyzing the spatial distribution of differences can help identify whether systematic regional patterns exist. For instance, some provinces may consistently exhibit coordinate offsets of a few millimeters, which could stem from unmodeled regional effects or specific choices in network adjustment (e.g., peripheral areas with weaker constraints or regionally clustered processing). In this study, we grouped the stations by province—nine administrative provinces of the Republic of Korea including Jeju—and computed the mean and root mean square error (RMSE) of ΔN and ΔE for each region.
Table 2 presents the statistics for the differences between the GAMIT/GLOBK-derived coordinates and the official KGD2002 values, Table 3 shows the Bernese–KGD2002 differences, and Table 4 displays the differences between the GAMIT and Bernese solutions. A positive mean value indicates that the official (or comparative) coordinates lie north or east of the evaluated solution on average, while a negative value means they lie to the south or west. The RMSE combines both the regional bias and variability, offering a representative measure of the typical magnitude of coordinate differences within each province.
The regional statistics for coordinate differences are summarized in Table 1, Table 2 and Table 3, offering a quantitative perspective on the agreement between GNSS-derived solutions and the official KGD2002 reference frame. These tables provide insight into both the magnitude and directionality of regional biases as well as the spatial consistency of the different processing strategies.
Table 2 presents the comparison between the GAMIT/GLOBK-derived coordinates and KGD2002. While overall agreement is high, several provinces display small yet consistent systematic offsets. Notably, Gyeongbuk and Gyeongnam show positive mean values in the north component (ΔN: +0.30 cm and +0.12 cm, respectively), suggesting that the official static coordinates are slightly north of those derived from GAMIT processing. Conversely, southwestern provinces such as Jeonbuk and Jeonnam exhibit negative ΔN means (−0.24 cm and −0.37 cm, respectively), implying the opposite spatial relationship. These patterns hint at a subtle north–south gradient in residuals that may reflect either regional network geometry or processing-related modeling differences. More significantly, the largest root mean square errors (RMSEs) are observed in Jeonnam, with ΔN RMSE reaching 2.52 cm. This elevated scatter suggests reduced spatial coherence in that region, possibly due to weaker geometric constraints from adjacent stations, long baselines, or unmodeled local geophysical phenomena (e.g., ground subsidence or ocean loading along the coast).
Table 3 summarizes the Bernese–KGD2002 comparison. In general, this solution exhibits slightly smaller mean offsets and lower RMSE values than the GAMIT-derived solution. Most provinces show mean ΔN and ΔE values that are statistically close to zero, indicating a high level of consistency with the official KGD2002 coordinates. This may reflect the internal adjustment strategy of Bernese, which emphasizes rigorous network least squares processing with globally consistent constraints. Nevertheless, Jeonnam again stands out with relatively high variability (RMSE ≈ 0.70 cm), although the scatter is notably reduced compared to the GAMIT-based result. This difference highlights that processing methodology can influence not only the absolute positions but also the dispersion of results, particularly in edge regions. Additionally, Chungnam province shows a modest but clear eastward bias in the Bernese solution (mean ΔE: +0.28 cm). Such a bias could originate from regional asymmetries in the station distribution or differing treatments of atmospheric delay, antenna phase center variations, or mapping functions.
Table 4 directly compares the GAMIT/GLOBK and Bernese solutions to assess their internal consistency. Overall, differences between the two processing approaches remain well within the sub-centimeter level for most provinces, indicating a strong degree of methodological convergence. However, systematic discrepancies are still present in specific areas. For instance, Gyeongbuk shows a noticeable northward bias (mean ΔN: +0.35 cm), while Chungnam exhibits a westward bias relative to Bernese (mean ΔE: −0.37 cm). These offsets, though modest, could signal underlying differences in reference frame realization or baseline weighting strategies between the two software packages. Once again, Jeonnam shows the highest level of variability, with the north component RMS reaching 2.55 cm. This is consistent with the patterns observed in both Table 1 and Table 2, reinforcing the notion that this region is particularly sensitive to network design, processing assumptions, or possibly local instabilities.
Taken together, the results from all three tables highlight a few key observations. First, both GNSS solutions reproduce the KGD2002 frame with high accuracy at the national scale. Second, regional discrepancies do exist—typically on the order of 1–3 mm but occasionally exceeding 2 cm in terms of RMS. These discrepancies are most pronounced in provinces with challenging network geometry or known environmental complexity. Finally, the repeatability and divergence across processing strategies provide useful diagnostic information. They not only indicate areas that may require closer geodetic control or reprocessing but also suggest that future adjustments or frame transitions should account for such regional sensitivities.
These numerical differences provide a statistical overview of regional discrepancies in coordinate estimates. To better visualize the spatial characteristics and relative magnitude of these differences, a graphical comparison of horizontal RMS errors by province is presented. Figure 5 summarizes these regional RMS values, offering an intuitive assessment of consistency between solutions and highlighting areas of elevated scatter.
Figure 5 presents a regional analysis of horizontal root mean square (RMS) differences among coordinate estimates derived from GAMIT/GLOBK, Bernese, and the KGD2002 reference frame. Each bar represents the horizontal RMS value (in mm) calculated from the ΔN and ΔE components for each province. Blue bars correspond to the RMS of differences between GAMIT and Bernese solutions, red bars represent the differences between GAMIT and KGD2002, and yellow bars show the differences between Bernese and KGD2002.
Figure 5 presents the horizontal RMS differences per province in bar chart form, highlighting that Jeonnam and Gyeongbuk tend to show relatively larger discrepancies regardless of the comparison pair. To further visualize the spatial distribution of these differences, Figure 6 illustrates the regional RMS values for each comparison—GAMIT vs. KGD2002, Bernese vs. KGD2002, and GAMIT vs. Bernese—using color-coded maps.
In the left panel (GAMIT–KGD2002), the largest RMS differences appear in Gyeongbuk (orange) and Jeonnam (green-yellow), suggesting greater variability in those areas. The middle panel (Bernese–KGD2002) shows a generally lower and more uniform distribution of RMS values, with most regions shaded in blue, indicating values under 10 mm. In contrast, the right panel (GAMIT–Bernese) reveals distinct regional differences between the two software solutions, with Gyeongbuk again exhibiting the highest RMS difference (>13 mm), followed by Chungnam. Jeju consistently shows the lowest RMS values across all comparisons, suggesting stable and consistent positioning at that site.
These spatial patterns corroborate the statistical findings and highlight regions where either geophysical complexity or weaker network geometry may be contributing to increased positioning variation.
To further investigate the directional patterns of coordinate discrepancies, we analyzed the azimuthal distribution of the ΔN, ΔE horizontal residuals across the nine administrative regions. The polar histograms presented in Figure 7, Figure 8 and Figure 9 provide insight into whether these differences are randomly oriented or exhibit systematic directional tendencies.
Each residual vector was projected in the local NE plane, and its azimuth angle was computed using atan2(ΔN, ΔE). The histograms in Figure 7 (GAMIT vs. KGD2002) demonstrate that most regions exhibit near-isotropic distributions, with residual vectors broadly dispersed around the circle. However, subtle directional trends are visible in certain regions. In Gyeongnam, for example, the vectors show a mild concentration toward the northeast (mean azimuth ≈ 52.3°, directional concentration ≈ 0.22), suggesting possible geometric bias related to the regional station layout. In Jeju, despite a small sample size, residuals are notably concentrated around the southeast quadrant (mean azimuth ≈ 124.6°, directional concentration ≈ 0.41), possibly due to its insular position and asymmetric baseline configuration.
Despite the extensive number of control points analyzed in this study, notable directional anomalies remain evident in certain regions—particularly in Gyeongbuk and Gyeongnam. These deviations are likely influenced by localized tectonic activity associated with the Yangsan Fault, as well as seismic events such as the 2016 Gyeongju earthquake (Mw 5.8) and the 2017 Pohang earthquake (Mw 5.4), which were among the most damaging earthquakes recorded in Korea. These findings suggest that long-term reliance on a static reference frame based on ITRF2000 may no longer be sufficient to represent the current geokinematic reality of the Korean Peninsula. Over time, the accumulation of unmodeled crustal motion can lead to spatial inconsistencies between observed GNSS positions and the original reference realization—a phenomenon known as datum deformation [31,32]. Furthermore, this reflects the broader issue of c, wherein a static frame is maintained without adjustment despite ongoing geophysical change, resulting in increased misalignments with the actual crustal dynamics [33]. These results underscore the necessity of periodically evaluating and updating national geodetic datums. In this regard, the Republic of Korea is currently preparing for a national transition to the ITRF2020 reference frame [34].
In contrast, the Bernese vs. KGD2002 comparison shown in Figure 8 reveals higher variability in directional spread. Notably, Chungnam displays a strong bias toward the east–southeast (mean azimuth ≈ 103.8°, concentration ≈ 0.36), while Gangwon shows a wider azimuth range with less concentration (≈0.14), indicating locally differing influences in station geometry or processing constraints.
This directional discrepancy may partially stem from the fact that the KGD2002 frame itself was originally realized using solutions from the GAMIT/GLOBK software. As demonstrated in Section 2.5, comparisons between 10-year velocity fields independently computed using GAMIT and Bernese reveal regional differences in estimated crustal motion of up to ~30 mm/year. These differences can likely be attributed to variations in satellite orbit modeling, geophysical parameter selection, and stochastic strategies applied in each processing software. However, consistent directional biases observed in regions such as Gyeongbuk cannot be fully explained by software-induced variations alone. Rather, these patterns are more plausibly linked to the cumulative effects of datum deformation and datum holding, whereby the static KGD2002 frame—fixed to an early epoch—fails to accommodate present-day geodynamic conditions. This interpretation is further supported by significant seismic activity concentrated in the Gyeongbuk area, including the 2016 Gyeongju earthquake (Mw 5.8) and the 2017 Pohang earthquake (Mw 5.4), which provide independent geophysical evidence for ongoing crustal deformation in the region.
The GAMIT vs. Bernese residuals (Figure 9) show more pronounced directional clustering in some regions, particularly along Korea’s eastern coastal provinces such as Gyeongbuk and Gangwon. These areas display mean azimuths of 85.1° and 91.2°, respectively, with moderate concentration indices (≈0.27–0.31). Such alignment may reflect systematic biases related to model differences or reference frame realization inconsistencies between the two processing strategies.
Overall, the polar histogram analysis reinforces and refines the magnitude-based interpretations. While most regions exhibit broadly dispersed residual vectors, certain areas—particularly those affected by tectonic activity—show recurring azimuthal patterns. These directional biases may be partially attributed to the continued use of the outdated KGD2002 reference frame, which no longer reflects the current geodynamic conditions. Over time, the accumulation of datum deformation within a static frame can lead to systematic discrepancies in GNSS-derived velocities.

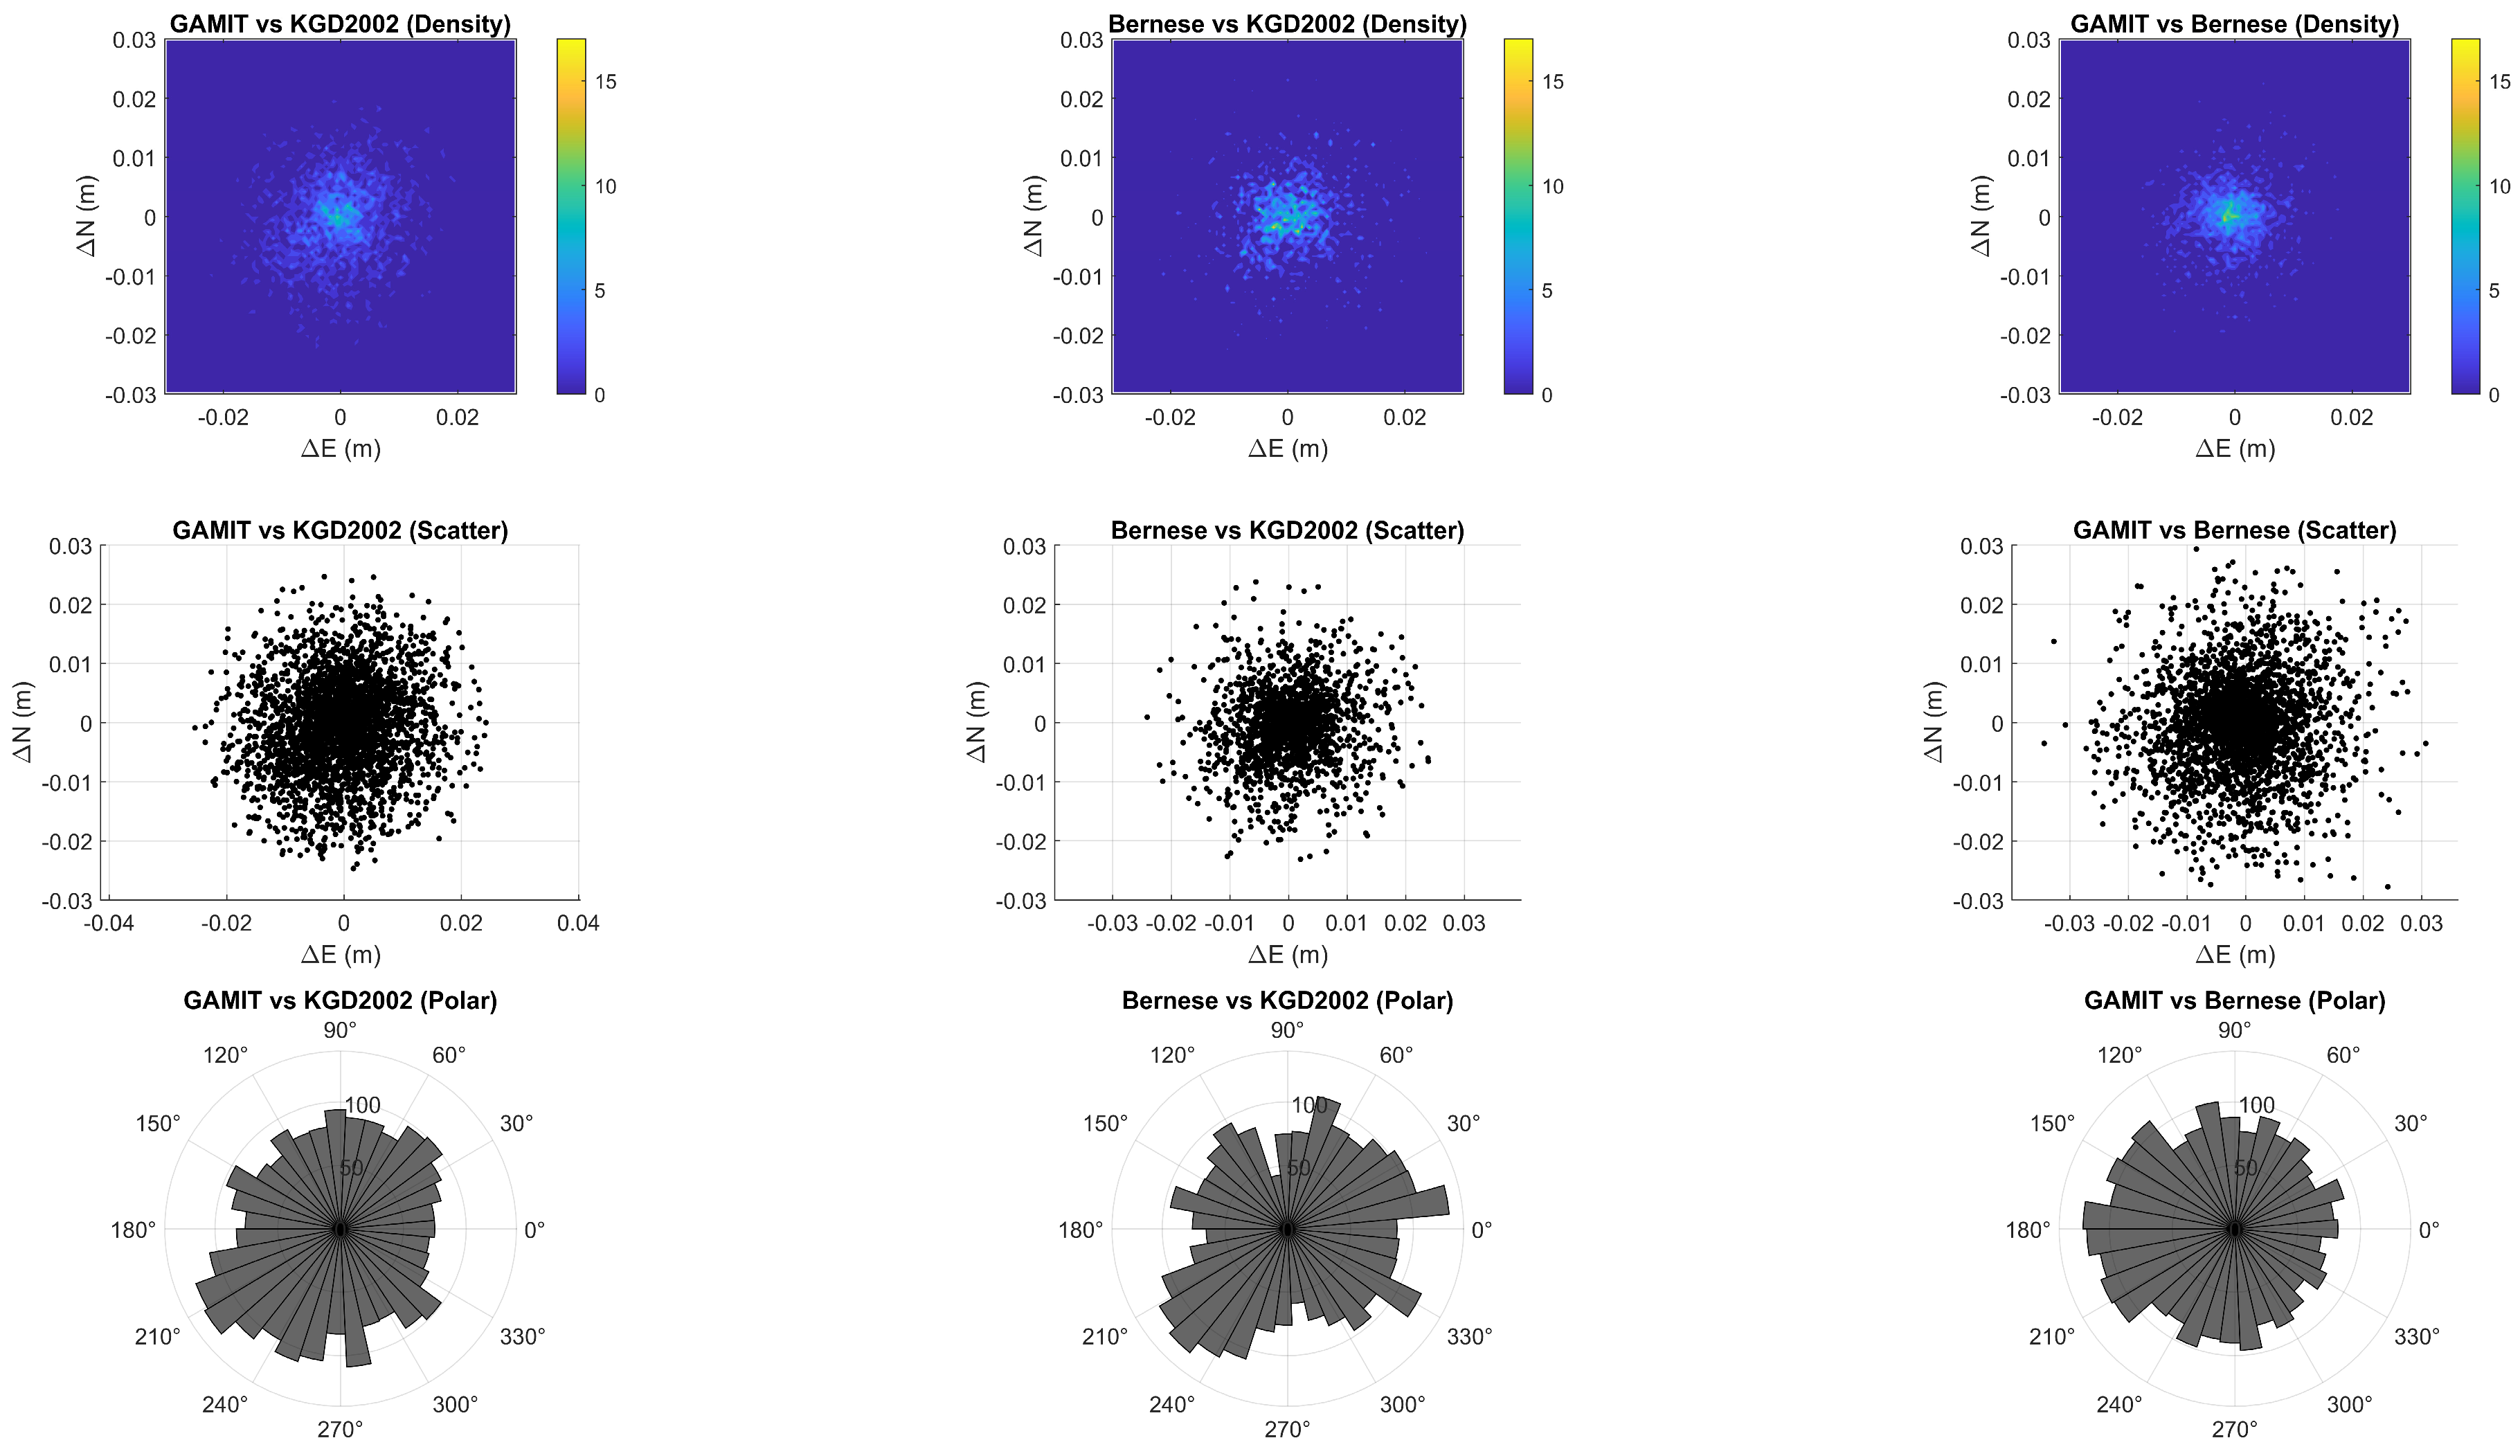
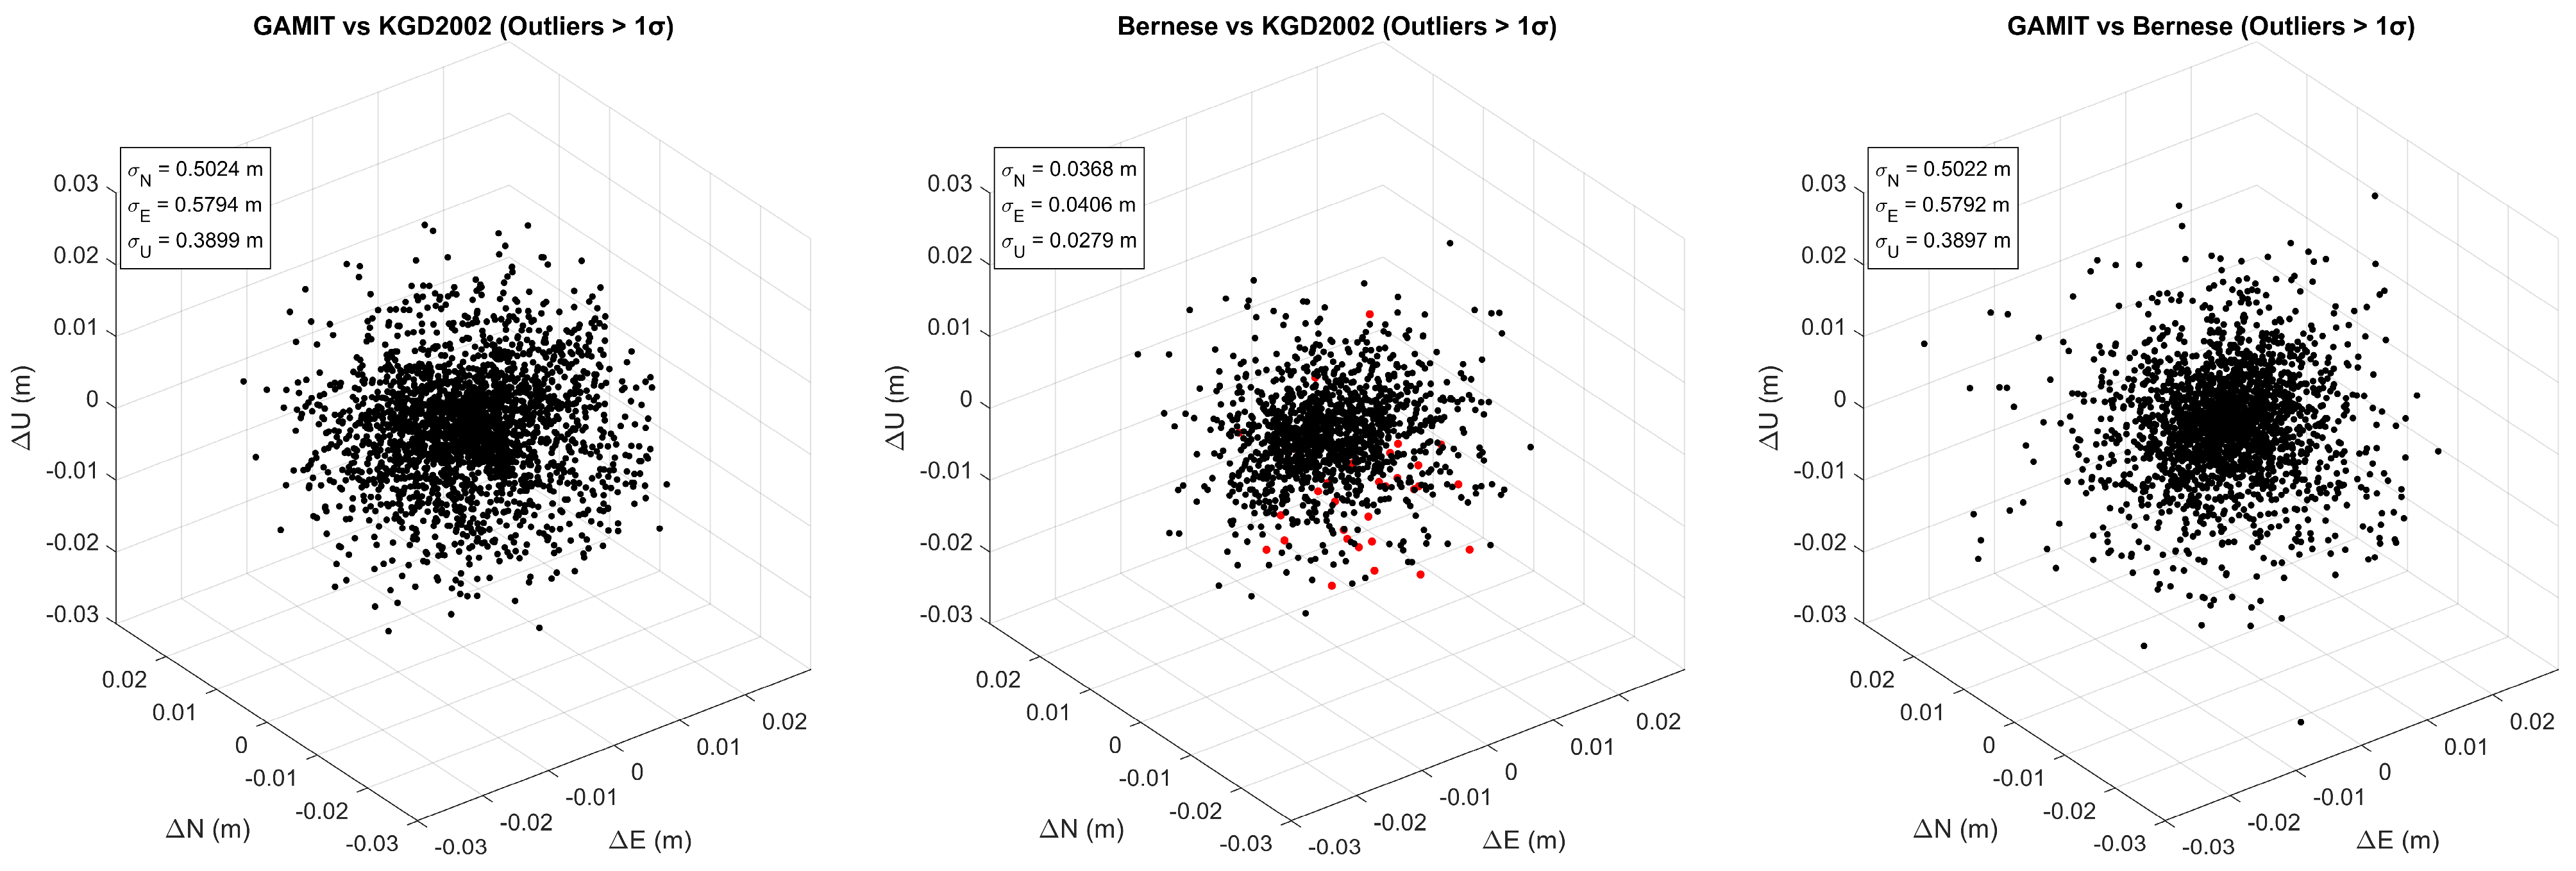
3.2. Analysis of Coordinate Differences

To evaluate the detailed differences among the estimated horizontal coordinates, we performed a comparative analysis of the residuals between the GAMIT/GLOBK and Bernese solutions with respect to the official KGD2002 positions. These residuals—expressed in the local topocentric North–East–Up (NEU) system—reveal subtle but meaningful patterns that help assess the internal consistency and potential biases of each processing approach.
This section aims to provide a comprehensive visual and statistical exploration of these differences using multiple complementary representations:
(1)
Two-dimensional density maps to show the spatial distribution of the residuals;
(2)
Scatter plots to illustrate the spread and concentration of points;
(3)
Polar histograms to examine directional tendencies in the horizontal residual vectors.
Each method serves a specific interpretive purpose. Density maps highlight where most of the coordinate differences are concentrated, offering insight into central tendencies and outlier structures. Scatter plots help reveal the dispersion and clustering behavior, while polar histograms provide information on azimuthal directionality that may be related to network geometry, processing strategy, or localized effects.
We applied these visualizations consistently to three key comparison groups:
  • GAMIT/GLOBK vs. KGD2002;
  • Bernese vs. KGD2002;
  • GAMIT/GLOBK vs. Bernese.
The goal is not only to assess how each solution agrees with the national reference frame but also to compare the internal coherence between the two software outcomes. By representing residuals in the ΔE–ΔN plane and examining directional patterns, we gain a multi-perspective view of the solution space that complements basic RMS statistics.
These results are illustrated in Figure 10, which displays side-by-side comparisons for each group across the three visualization modalities.
Figure 10 presents a side-by-side visual comparison of horizontal residuals among the three coordinate solutions. Each column corresponds to a solution pair and includes a 2D density map, a scatter plot, and a polar histogram of azimuthal directions in the ΔE–ΔN plane.
In all three cases, the residual distributions are generally centered around the origin, suggesting no large systematic offset in either the east or north direction. However, distinct patterns are visible across the three comparison groups.
In the GAMIT vs. KGD2002 column (left), the density map and scatter plot indicate a compact, symmetric distribution, with most residuals falling within ±10 mm. The polar histogram shows a fairly uniform spread, indicating that the directions of horizontal residuals are azimuthally random and not significantly biased toward any specific direction.
The Bernese vs. KGD2002 residuals (middle column) appear slightly more dispersed than those from the GAMIT comparison. While still centrally concentrated, the scatter plot shows a broader cloud, and the polar histogram reveals a mild directional preference toward the southwest (around 240–270°). This suggests the possibility of small systematic effects or station-dependent factors in the Bernese adjustment relative to the national datum.
The GAMIT vs. Bernese comparison (right column) exhibits the widest spread among the three, with residuals extending beyond ±20 mm in several cases. The density peak remains near the origin, implying general agreement, but the scatter plot is noticeably more dispersed. The polar histogram remains relatively flat but shows a slight clustering in the east–west directions, possibly reflecting subtle differences in the network geometry handling or baseline weighting strategies between the two software packages.
Taken together, these visualizations indicate that both GAMIT and Bernese solutions are closely aligned with the KGD2002 reference, with GAMIT showing slightly tighter agreement. The direct comparison between GAMIT and Bernese reveals slightly more variability, underscoring the practical importance of consistent processing strategies in high-precision GNSS applications.
In both cases, the RMS values are nearly identical to the standard deviations, reflecting the fact that the mean differences are near zero and systematic biases are negligible. Notably, the Bernese solution exhibits a slightly lower SD in both components—by approximately 0.001 m (1 mm)—compared to the GAMIT/GLOBK solution. This suggests that the Bernese-derived coordinates are marginally more internally consistent, with a slightly tighter distribution around the official KGD2002 values. While the difference in scatter is small, it is discernible given the large sample size and the precision of the data.
To further assess the spatial agreement among the coordinate solutions in a fully three-dimensional context, we constructed 3D scatter plots of the residuals in local East–North–Up (ENU) coordinates, as shown in Figure 11. This representation complements the previous 2D horizontal analyses by incorporating the vertical component (ΔU), thereby enabling a more comprehensive evaluation of the geometric consistency of the solutions. Points exceeding ±1σ in any dimension are highlighted in red to emphasize potential outliers and to better visualize the volumetric distribution of residuals.
In the GAMIT vs. KGD2002 comparison, the residual distribution appears generally more isotropic and concentrated, with noticeably fewer outliers than in the other cases. This suggests not only that the GAMIT/GLOBK solution is highly consistent with the official KGD2002 coordinates but also that it maintains a well-balanced internal precision across all three components—ΔN, ΔE, and ΔU. The uniformity in the spread of the residuals across spatial axes implies that errors are not directionally biased, and that the coordinate differences are spatially symmetric. This behavior may reflect effective network-scale adjustment, the use of distance-dependent weighting schemes, or error-canceling mechanisms related to the observation geometry and processing configuration.
In contrast, the GAMIT vs. Bernese residuals, while still showing good overall agreement, exhibit noticeably greater spread in the vertical (Up) direction. This indicates that although horizontal components are well-aligned, vertical discrepancies are more prominent, with several residuals extending away from the center in the ΔU dimension. The broader distribution in height differences likely reflects differences in how the two software packages handle vertical positioning. Such discrepancies may arise from distinct definitions of local reference frames, ellipsoidal height modeling strategies, or tropospheric correction methods. For instance, Bernese might be more sensitive to baseline geometry in vertical estimation due to its processing approach, while GAMIT/GLOBK may apply more conservative weighting to the Up component. Even subtle differences in vertical constraints, elevation weighting, or height-dependent error mitigation techniques can result in the kinds of residual asymmetry observed here.
Ultimately, the elevated dispersion in the vertical direction in the GAMIT vs. Bernese comparison suggests that the differences go beyond simple alignment errors and may reflect underlying algorithmic and modeling distinctions in how the two processing systems optimize and distribute positional uncertainties. These observations emphasize the importance of incorporating vertical information in coordinate evaluations and caution against relying solely on horizontal metrics such as planar RMS when comparing high-precision GNSS solutions.

4. Discussion

The regional coordinate differences identified in this study reveal consistent spatial patterns in both magnitude and direction, despite the overall high agreement between the GNSS solutions and the KGD2002 reference frame. The residuals in the horizontal components (ΔN, ΔE) are generally centered near zero with standard deviations of 5–9 mm, underscoring the robustness and internal consistency of both GAMIT/GLOBK and Bernese processing outcomes. These sub-centimeter discrepancies indicate that both solutions are well-aligned with the national static datum.
Nonetheless, systematic regional biases are discernible. For example, in the GAMIT–KGD2002 comparison, northeastern and southeastern provinces such as Gyeongbuk and Gyeongnam show slightly positive mean ΔN values (up to +0.30 cm), while southwestern provinces (Jeonbuk, Jeonnam) exhibit negative ΔN values (−0.24 to −0.37 cm). These small yet consistent offsets suggest a subtle north–south directional tendency, likely reflecting regional effects in the network geometry or processing model implementation.
The east–west residuals are similarly small, with some regions such as Chungnam showing a modest eastward bias (+0.28 cm in the Bernese–KGD2002 comparison). The largest residual dispersions are observed in Jeonnam province, located at the southwestern edge of the network, where GAMIT vs. KGD2002 RMS differences reach ~2.5 cm. This localized degradation in solution quality is likely associated with edge effects due to sparse geometric control, long baselines, or potential station-specific issues. Notably, the Bernese solution exhibits lower scatter in this region (≈0.7 cm RMS), highlighting the sensitivity of peripheral network performance to software-specific adjustment strategies.
The spatial consistency of residuals also varies between software packages. The GAMIT–Bernese comparison shows a slight east–west clustering in residual vector orientations, which may stem from differences in baseline weighting or frame alignment. Local environmental effects—such as tropospheric delay variations in mountainous or coastal provinces—could also contribute to directional biases. For instance, clustered azimuths in Gangwon and Gyeongbuk suggest region-specific modeling differences, potentially linked to variations in tropospheric mapping functions or ocean loading corrections.
Moreover, a subtle southwest directional bias in the Bernese–KGD2002 residuals (azimuth ~240–270°) raises the possibility of a small reference frame misalignment or common-mode error. Such effects may arise from differences in frame realization (e.g., the selection or weighting of reference stations), particularly when fitting modern GNSS data to a static datum fixed at epoch 2002.0.
The limitations inherent to the KGD2002 datum likely contribute to the observed residual patterns. As a static reference frame aligned with ITRF2000 at epoch 2002.0, KGD2002 does not incorporate ongoing crustal deformation or post-seismic adjustments. Although the Korean Peninsula is considered relatively tectonically stable, minor intra-plate motions, localized subsidence, and post-seismic relaxation following moderate seismic events—such as the 2016 Gyeongju and 2017 Pohang earthquakes—can lead to discrepancies on the order of several millimeters to centimeters. These geophysical processes are not captured within the static coordinates of KGD2002 and may partially account for the regional variations observed.
Overall, the results of this study demonstrate that coordinate solutions derived from two independent GNSS processing software packages—GAMIT/GLOBK and Bernese—are highly consistent and reliable within the current national geodetic reference frame, KGD2002. Most stations show horizontal residuals on the order of a few millimeters, indicating that both solutions are well-aligned with the existing static datum.
However, small systematic biases and increased dispersion at network peripheries are observed in certain regions, suggesting the need to update the KGD2002 frame, which has now remained unchanged for over 15 years since its adoption.
These issues can be mitigated to a significant extent by transitioning to a time-dependent (dynamic) reference frame such as ITRF2020. A dynamic frame models not only linear station velocities but also nonlinear motions—including seasonal signals and post-seismic deformation—thereby ensuring that coordinates remain consistent over time with geophysical reality. Furthermore, ITRF2020 is closely aligned with global GNSS frameworks (e.g., PPP, WGS84), offering enhanced interoperability for geodetic and geospatial applications that demand international-level precision [3,34].
This approach has already been adopted in several countries. For instance, Malaysia implemented a semi-kinematic geodetic reference frame based on ITRF2014, in which national control point coordinates are defined not only by their epoch positions but also by associated velocity vectors. This system enables the temporal propagation of coordinates without requiring repeated field surveys and provides a stable foundation for high-precision surveying, land administration, and long-term spatial data infrastructure [35].
Considering these international developments, the findings of this study support the growing domestic and global consensus on the need for adopting a time-aware, globally consistent reference frame to support the evolving demands of high-accuracy geodetic applications.

5. Conclusions

This comparative analysis of GAMIT/GLOBK and Bernese GNSS solutions in the KGD2002 frame leads to several important conclusions. First, the coordinate solutions from the two different software packages are highly consistent with each other and with the official datum. Across ~3000 control points, horizontal coordinate discrepancies are mostly at the few-millimeter level, with no significant systematic offset in either the north or east component. This indicates that the KGD2002 realization is fundamentally sound and that independent processing strategies can reproduce the reference frame to a high degree of fidelity. Such consistency is a reassuring finding for the geodetic quality of the network and suggests that day-to-day GNSS processing (whether with GAMIT, Bernese, or similar tools) will yield virtually interchangeable results in the current static datum.
Second, despite the overall agreement, we identified small but significant discrepancies with clear spatial patterns. Certain regions—most notably in the southwest periphery—exhibit higher dispersion and slight biases on the order of 1–3 mm, pointing to the influence of network geometry and possibly unmodeled environmental or processing effects. These discrepancies, though minor for most practical surveying purposes, have scientific implications: they hint at underlying issues such as minor frame misalignments or localized deformation. For high-precision applications (e.g., deformation monitoring or combining solutions from different software), even a few millimeters of bias can be consequential. Thus, the results emphasize the need for consistent processing strategies and careful datum realization. In particular, the fact that one solution showed a southwest-directed bias relative to the datum suggests that further investigation into reference frame alignment procedures—such as the weighting of reference stations or the regional handling of atmospheric models—could further improve national adjustment strategies.
Third, this study highlights the limitations of maintaining a static datum like KGD2002 in the long term. The observed regional offsets are likely symptoms of the datum’s aging; as time progresses; such distortions will inevitably accumulate unless the datum is periodically updated or replaced. The practical implication is that users of KGD2002 must be cautious when integrating data from different epochs, as unmodeled plate motion may introduce errors exceeding the centimeter level over multiple decades. While such errors may be negligible for general mapping, they become increasingly significant for geodetic and engineering-grade precision. From a scientific perspective, the implication is clear: to support emerging geoscience needs—such as tracking subtle ground motion or monitoring sea-level change—the reference frame must be as temporally dynamic and precise as the phenomena being measured.
Finally, looking ahead, the findings strongly support modernizing the national reference frame. Adopting a dynamic or semi-dynamic datum tied to ITRF2020 would resolve the slowly accumulating inconsistencies and align the Republic of Korea with international geodetic standards. Recent studies on modern dynamic reference frames have demonstrated substantial improvements in accuracy and internal consistency when nonlinear station motions are properly modeled [3]. Countries such as Malaysia have already adopted semi-kinematic frameworks based on ITRF2014, which define both coordinates and station velocities to allow time-dependent positioning without frequent re-surveying [35].
Transitioning to ITRF2020—or its future successors—will play a crucial role in ensuring that Korea’s geodetic infrastructure remains interoperable with international systems and aligned with the latest scientific standards. In particular, to support this transition, it is essential to develop a comprehensive transformation framework from KGD2002 to ITRF2020. This framework should go beyond simple seven-parameter Helmert transformations and incorporate region-specific parameters and deformation models to account for local crustal instabilities.
Recent research by [36] demonstrated that ITRF2020 offers clear improvements in the observational precision of GNSS, SLR, VLBI, and DORIS inputs compared to ITRF2014, using Terrestrial Reference Frame (TRF) stacking methods. These results underscore the reliability of ITRF2020 as a reference frame for future coordinate transformations. Complementing this, ref. [34] analyzed the contribution of the International GNSS Service (IGS) to ITRF2020 and confirmed significant enhancements in frame consistency and coordinate integrity throughout the global GNSS network. This finding reinforces the compatibility between ITRF2020 and Korea’s national GNSS infrastructure.
Furthermore, static reference frames, such as KGD2002, are inherently limited in their ability to model long-term crustal motion and are particularly inadequate for capturing abrupt tectonic events like earthquakes. Consequently, discrepancies between the reference frame and actual ground positions can accumulate over time, a phenomenon known as datum deformation [36]. This issue is further exacerbated by the practice of datum holding, where a reference frame is maintained without periodic updates, despite ongoing geophysical changes [32]. These limitations underscore the necessity of transitioning toward semi-dynamic or fully dynamic reference frames to ensure long-term positional consistency.
A semi-dynamic reference frame corrects for site motions using long-term average velocities, providing epoch-adjusted coordinates. In contrast, a dynamic reference frame incorporates time-dependent 4D positioning (3D + time), allowing real-time or epoch-specific representations of crustal displacements. These frameworks are increasingly critical in geodetic and geospatial applications that demand millimeter-level accuracy, particularly in tectonically active regions [37].
In summary, the transition to an ITRF2020-based dynamic reference frame represents more than a technical update—it serves as a foundational upgrade that will enhance positional accuracy, improve consistency with international services, and better support both scientific research and high-precision applications. Future efforts should focus on developing a regionally adapted 4D transformation model, conducting a national re-adjustment of control points, and reviewing any identified outlier stations (e.g., in Jeonnam province) to ensure a smooth and robust adoption of the new geodetic standard. Furthermore, practical implementation of a time-dependent reference frame should consider user accessibility. Providing user software with built-in epoch-aware coordinate updates or simple epoch conversion tools could ease the transition for field users and surveyors.
In conclusion, this study not only quantifies the present internal consistency of GNSS solutions in Korea’s national datum but also offers a clear direction toward future modernization. Embracing a dynamic geodetic datum, aligned with ITRF2020 and its principles, will enhance positional accuracy, ensure long-term consistency, and support both everyday surveying and advanced scientific research. These steps are essential to secure a future-proof geodetic foundation for the Republic of Korea.

Author Contributions

Conceptualization, S.-J.L. and H.-S.Y.; methodology, S.-J.L.; software, S.-J.L.; validation, S.-J.L. and H.-S.Y.; formal analysis, S.-J.L.; investigation, S.-J.L.; resources, S.-J.L.; data curation, S.-J.L.; writing—original draft preparation, S.-J.L.; writing—review and editing, H.-S.Y.; visualization, S.-J.L.; supervision, H.-S.Y.; project administration, H.-S.Y.; funding acquisition, H.-S.Y. All authors have read and agreed to the published version of the manuscript.

Funding

This work was supported by a National Research Foundation of Korea (NRF) grant funded by the Korea government (MSIT) (RS-2021-NR059478).

Institutional Review Board Statement

Not applicable.

Informed Consent Statement

Not applicable.

Data Availability Statement

The original contributions presented in the study are included in the article; further inquiries can be directed to the corresponding authors.

Acknowledgments

Not applicable.

Conflicts of Interest

The authors declare no conflicts of interest.

References

  1. Altamimi, Z.; Rebischung, P.; Métivier, L.; Collilieux, X. ITRF2014: A New Release of the International Terrestrial Reference Frame Modeling Nonlinear Station Motions. J. Geophys. Res. Solid Earth 2016, 121, 6109–6131. [Google Scholar] [CrossRef]
  2. Chen, G.; Wei, N.; Wang, H.; Li, T.; Li, M.; Zhao, Q. Impacts of Non-Linear ITRF2020 on Reference Frame Alignment. Adv. Space Res. 2024, 74, 2569–2582. [Google Scholar] [CrossRef]
  3. Altamimi, Z.; Rebischung, P.; Collilieux, X.; Métivier, L.; Chanard, K. ITRF2020: An Augmented Reference Frame Refining the Modeling of Nonlinear Station Motions. J. Geod. 2023, 97, 47. [Google Scholar] [CrossRef]
  4. Zhang, J.; Huang, C.; Lian, L.; Zhang, S. Assessment of the Improvement in Observation Precision of GNSS, SLR, VLBI, and DORIS Inputs from ITRF2014 to ITRF2020 Using TRF Stacking Methods. Remote Sens. 2024, 16, 1240. [Google Scholar] [CrossRef]
  5. Rudenko, S.; Esselborn, S.; Schöne, T.; Dettmering, D. Impact of Terrestrial Reference Frame Realizations on Altimetry Satellite Orbit Quality and Global and Regional Sea Level Trends: A Switch from ITRF2008 to ITRF2014. Solid Earth 2019, 10, 293–305. [Google Scholar] [CrossRef]
  6. Blewitt, G. Terrestrial Reference Frame Requirements for Studies of Geodynamics and Climate Change. In International Association of Geodesy Symposia; Springer: Cham, Switzerland, 2015. [Google Scholar] [CrossRef]
  7. Delva, P.; Altamimi, Z.; Blazquez, A.; Bonnor, J.; Bouquillon, S.; Capitaine, N.; Cécile, L.; Sośnica, K.; Wolf, P. GENESIS: Co-Location of Geodetic Techniques in Space. arXiv 2022, arXiv:2209.15298. [Google Scholar] [CrossRef]
  8. Snay, R.A.; Soler, T. Evolution of NAD 83 in the United States: Journey from 2D toward 4D. J. Surv. Eng. 2012, 138, 161–171. [Google Scholar] [CrossRef]
  9. Imakiire, T.; Murakami, M. Establishment of the New Geodetic Reference Frame of Japan (JGD2000). In Proceedings of the IVS 2002 General Meeting, Tsukuba, Japan, 4–7 February 2002; pp. 304–308. Available online: https://ivscc.gsfc.nasa.gov/publications/gm2002/imakiire.pdf (accessed on 17 May 2025).
  10. Harrison, C.; Brown, N.; Dawson, J.; Fraser, R. Geocentric Datum of Australia 2020: The First Australian Datum Developed from a Rigorous Continental-Scale Adjustment. J. Spat. Sci. 2023, 69, 167–179. [Google Scholar] [CrossRef]
  11. Altamimi, Z.; Sillard, P.; Boucher, C. ITRF2000: A New Release of the International Terrestrial Reference Frame for Earth Science Applications. J. Geophys. Res. 2002, 107, 2214. [Google Scholar] [CrossRef]
  12. Lee, Y.-J.; Lee, H.-K.; Jeong, K.-H.; Cha, S.-H. Korean Geodetic Datum 2002 (KGD2002): Nationwide GPS Network Densification. In Proceedings of the FIG Working Week 2008, Stockholm, Sweden, 14–19 June 2008; pp. 1–12. Available online: https://fig.net/resources/proceedings/fig_proceedings/fig2008/papers/ts03a/ts03a_02_lee_etal_2891.pdf (accessed on 17 May 2025).
  13. Lee, S.-J.; Yun, H.-S. Nationwide Adjustment of Unified Geodetic Control Points for the Modernization of South Korea’s Spatial Reference Frame. Appl. Sci. 2025, 15, 5500. [Google Scholar] [CrossRef]
  14. Han, J.; Lee, S.J.; Yun, H.S.; Kim, K.B.; Bae, S.W. PyRINEX: A New Multi-Purpose Python Package for GNSS RINEX Data. PeerJ Comput. Sci. 2024, 10, e1800. [Google Scholar] [CrossRef] [PubMed]
  15. Herring, T.A.; King, R.W.; McClusky, S.C. Introduction to GAMIT/GLOBK; Massachusetts Institute of Technology: Cambridge, MA, USA, 2010; Available online: http://www-gpsg.mit.edu/gg/docs/Intro_GG.pdf (accessed on 15 April 2025).
  16. Herring, T.A.; King, R.W.; Floyd, M.A.; McClusky, S.C. GAMIT Reference Manual, GPS Analysis at MIT, Release 10.7; Massachusetts Institute of Technology: Cambridge, MA, USA, 2018; Available online: http://www-gpsg.mit.edu/gg/docs/GAMIT_Ref.pdf (accessed on 15 April 2025).
  17. Herring, T.A.; King, R.W.; McClusky, S.C. GLOBK Reference Manual, Global Kalman Filter VLBI and GPS Analysis Program, Release 10.7; Massachusetts Institute of Technology: Cambridge, MA, USA, 2018; Available online: http://www-gpsg.mit.edu/gg/docs/GLOBK_Ref.pdf (accessed on 15 April 2025).
  18. King, R.W.; Bock, Y. Documentation for the GAMIT GPS Analysis Software; Massachusetts Institute of Technology: Cambridge, MA, USA, 2003. [Google Scholar]
  19. Dach, R.; Lutz, S.; Walser, P.; Fridez, P. (Eds.) Bernese GNSS Software Version 5.2—Documentation; Astronomical Institute, University of Bern: Bern, Switzerland, 2015; Available online: https://www.bernese.unibe.ch/docs/DOCU52.pdf (accessed on 13 April 2025).
  20. Leick, A.; Rapoport, L.; Tatarnikov, D. GPS Satellite Surveying, 4th ed.; John Wiley & Sons: Hoboken, NJ, USA, 2015. [Google Scholar]
  21. Ranacher, P.; Brunauer, R.; Trutschnig, W.; Van der Spek, S.C.; Reich, S. Why GPS Makes Distances Bigger Than They Are. J. Transp. Geogr. 2016, 52, 20–27. [Google Scholar] [CrossRef]
  22. Qiu, X.; Sun, B.; Li, Y.; Ding, X.; Wang, L. Experimental Study of Accuracy of High-Rate GNSS in Context of Structural Health Monitoring. Remote Sens. 2022, 14, 4989. [Google Scholar] [CrossRef]
  23. Gillins, D.; Heck, J.; Scott, G.; Jordan, K.; Hippenstiel, R. Accuracy of GNSS Observations from Three Real-Time Networks in Maryland, USA. In Proceedings of the FIG Working Week 2019, Hanoi, Vietnam, 22–26 April 2019; Available online: https://www.fig.net/resources/proceedings/fig_proceedings/fig2019/papers/ts05e/TS05E_gillins_heck_et_al_10077.pdf (accessed on 17 May 2025).
  24. Mustafin, M.; Nasrullah, M.; Abboud, M. A Comparative Analysis of GNSS Processing Services for Static Measurements: Evaluating Accuracy and Stability at Different Observation Periods. Int. J. Geoinform. 2024, 20, 112–121. [Google Scholar] [CrossRef]
  25. Wang, G.; Shen, Z.; Wang, Y. The 95% Confidence Interval for GNSS-Derived Site Velocities. J. Surv. Eng. 2022, 148, 04021033. [Google Scholar] [CrossRef]
  26. Jivall, L.; Lidberg, M.; Johansson, J.M. Analysis of 20 Years of GPS Data from SWEREF Consolidation Points Using BERNESE and GAMIT-GLOBK Software. J. Geod. 2022, 96, 26. Available online: https://www.lantmateriet.se/globalassets/geodata/gps-och-geodetisk-matning/rapporter/lantmaterirapport-2022-1.pdf (accessed on 17 May 2025).
  27. Ampatzidis, D.; Rossikopoulos, D.; Papadopoulou, M.; Pikridas, C.; Fotiou, A. The Correlations of the Helmert Transformation Parameters as an Additional Auxiliary Diagnostic Tool for Terrestrial Reference Frames Quality Assessment. Surv. Rev. 2022, 54, 233–247. Available online: https://link.springer.com/chapter/10.1007/1345_2022_164 (accessed on 17 May 2025).
  28. Tran, T.K.; Dao, H.T.; Nguyen, M.D. Determination of Helmert Transformation Parameters for Continuous GNSS Networks. J. Geod. 2022, 96, 58. [Google Scholar] [CrossRef]
  29. UNAVCO. GAGE Plate Motion Calculator. Available online: https://www.unavco.org/software/geodetic-utilities/plate-motion-calculator/plate-motion-calculator.html (accessed on 17 May 2025).
  30. Kreemer, C.; Blewitt, G.; Klein, E.C. A geodetic plate motion and Global Strain Rate Model. Geochem. Geophys. Geosyst. 2014, 15, 3849–3889. [Google Scholar] [CrossRef]
  31. Drewes, H. The Actual Plate Kinematic and Crustal Deformation Model APKIM2005 as Basis for a Non-Rotating ITRF. In Geodetic Reference Frames, Proceedings of the IAG Symposium, Munich, Germany, 9–14 October 2006; Springer: Berlin/Heidelberg, Germany, 2009; pp. 95–99. [Google Scholar]
  32. Mitsakaki, C.; Agatza-Balodimou, A.M.; Papazissi, K. Geodetic reference frames transformations. Surv. Rev. 2006, 38, 608–618. [Google Scholar] [CrossRef]
  33. National Geodetic Survey (NGS). Improving the National Spatial Reference System (NSRS); White Paper from the 2010 Geospatial Summit; NOAA/NOS/NGS: Silver Spring, MD, USA, 2010. Available online: https://geodesy.noaa.gov/2010Summit/Improving_the_NSRS.pdf (accessed on 17 May 2025).
  34. Rebischung, P.; Altamimi, Z.; Métivier, L.; Collilieux, X.; Gobron, K.; Chanard, K. Analysis of the IGS Contribution to ITRF2020. J. Geod. 2024, 98, 49. [Google Scholar] [CrossRef]
  35. Azhari, M.; Altamimi, Z.; Azman, G.; Kadir, M.; Simons, W.J.F.; Sohaime, R.; Saiful, A. Semi-Kinematic Geodetic Reference Frame Based on the ITRF2014 for Malaysia. J. Geod. Sci. 2020, 10, 91–109. [Google Scholar] [CrossRef]
  36. Drewes, H.; Seitz, M.; Sánchez, L. Realisation of the Non-Rotating Terrestrial Reference Frame by an Actual Plate Kinematic and Crustal Deformation Model (APKIM2020). In International Association of Geodesy Symposia; Springer: Berlin/Heidelberg, Germany, 2024; pp. 1–9. Available online: https://link.springer.com/chapter/10.1007/1345_2024_276 (accessed on 17 May 2025).
  37. Donnelly, N. Deformation Models for Dynamic (and Semi-Dynamic) Datums. In Proceedings of theFIG/IAG/UNOOSA Reference Frame in Practice Technical Seminar, Rome, Italy, 4–5 May 2012; Available online: https://www.fig.net/resources/proceedings/2013/2013_reference_frame_in_practice_comm5/2.3_dynamic_datums_donnelly.pdf (accessed on 17 May 2025).
Figure 1. Spatial distribution of common GNSS observation points used in both GAMIT/GLOBK and Bernese solutions across the Republic of Korea. Each red dot represents a control station that was processed using both software packages and included in the comparative analysis. The dataset comprises approximately 3000 geodetic control points, ensuring dense coverage across the mainland, coastal areas, and Jeju Island. Major administrative boundaries and province names are labeled. This visualization highlights the extensive applicability and consistent performance of the two GNSS solutions across the national control network.
Applsci 15 06460 g001
Figure 2. Workflow diagram of the study.
Applsci 15 06460 g002
Figure 3. Time series of east (left) and north (right) coordinate components from five GNSS stations (SUWN, WULJ, MUJU, KWNJ, and PUSN) in the Korean Peninsula. Each subplot compares daily position estimates processed by GAMIT (blue) and Bernese (red) software packages. Linear trends represent horizontal crustal motion, with velocity estimates (in mm/year) annotated in each plot.
Applsci 15 06460 g003
Figure 4. Horizontal crustal velocity vectors at five GNSS stations (SUWN, WULJ, MUJU, KWNJ, and PUSN) in the southern Korean Peninsula. Vectors represent velocity estimates derived from Bernese (blue) and GAMIT (yellow) processing, as well as three plate motion models: ITRF2020 (purple), GSRM v2.1 (green), and APKIM2005-IGN (red). All vectors are referenced to a fixed Eurasian plate. The arrow in the lower left indicates a scale of 30 mm/year.
Applsci 15 06460 g004
Figure 5. Regional horizontal root mean square (RMS) differences in coordinate estimates between GAMIT/GLOBK, Bernese, and KGD2002 solutions. RMS values (in mm) are computed from ΔN and ΔE components for each of the nine provinces including Jeju. Blue bars represent RMS differences between GAMIT and Bernese solutions, red bars show differences between GAMIT and KGD2002, and yellow bars correspond to differences between Bernese and KGD2002.
Applsci 15 06460 g005
Figure 6. Spatial distribution of horizontal coordinate RMS differences by region. From left to right, the maps display RMS values (in mm) for GAMIT/GLOBK–KGD2002, Bernese–KGD2002, and GAMIT/GLOBK–Bernese comparisons. The color of each province represents the RMS computed from ΔN and ΔE components. The color bar indicates the magnitude of the RMS values, with warmer colors (yellow to red) denoting larger differences and cooler colors (blue) indicating smaller differences.
Applsci 15 06460 g006
Figure 7. Polar histograms showing the azimuthal distribution of ΔN, ΔE residuals between the GAMIT solution and the official KGD2002 coordinates, grouped by administrative region. Each subplot corresponds to one of nine provinces, illustrating the directional spread of horizontal discrepancies. Residual vectors were projected in the local NEU frame, and their azimuths were computed from atan2(ΔN, ΔE). Most regions exhibit near-isotropic patterns, while some (e.g., Jeju and Gyeongnam) show mild directional concentration.
Applsci 15 06460 g007
Figure 8. Polar histograms showing the azimuthal distribution of ΔN, ΔE residuals between the Bernese solution and the official KGD2002 coordinates, grouped by administrative region. Each subplot illustrates the directional distribution of horizontal discrepancies within a given province. In certain regions—particularly Chungnam and Gangwon—the residuals exhibit noticeable clustering toward specific directions (e.g., east–southeast), potentially reflecting local network geometry or processing-specific influences associated with the Bernese software.
Applsci 15 06460 g008
Figure 9. Polar histograms illustrating the azimuthal distribution of ΔN, ΔE horizontal coordinate differences between the GAMIT and Bernese solutions. Directional clustering is particularly evident in eastern coastal regions such as Gyeongbuk and Gangwon, which may suggest systematic differences in model implementation or reference frame realization between the two GNSS processing strategies. Each subplot corresponds to a regional group and represents the directional spread of ΔN, ΔE residuals.
Applsci 15 06460 g009
Figure 10. Comparison of horizontal coordinate differences in topocentric East–North–Up (ENU) components for three solution pairs: GAMIT/GLOBK vs. KGD2002 (left), Bernese vs. KGD2002 (center), and GAMIT/GLOBK vs. Bernese (right). Each column shows the following, from top to bottom: a 2D density contour map of ΔE vs. ΔN residuals, a corresponding scatter plot, and a polar histogram of the horizontal residual directions. All panels share the same axis scaling for consistent visual comparison.
Applsci 15 06460 g010
Figure 11. Three-dimensional scatter plots of local ENU (East–North–Up) residuals for three solution pairs: GAMIT/GLOBK vs. KGD2002 (left), Bernese vs. KGD2002 (center), and GAMIT/GLOBK vs. Bernese (right). Each point represents the coordinate difference at a station. Points exceeding ±1σ in any of the three components are highlighted in red to indicate potential outliers. Axis limits are fixed across all plots for consistent visual comparison.
Applsci 15 06460 g011
Table 1. Crustal velocity (mm/year) and azimuth (°) at five Korean GNSS stations from Bernese, GAMIT, ITRF2020, GSRM v2.1, and APKIM2005-IGN models.
RegionBerneseGamitITRF2020GSRM v2.1APKIM2005-IGN
Crustal
Velocity
AzimuthCrustal
Velocity
AzimuthCrustal
Velocity
AzimuthCrustal
Velocity
AzimuthCrustal
Velocity
Azimuth
SUWN32.82110.15°29.14109.41°27.91114.90°29.69112.86°28.53114.10°
WULJ32.98107.63°29.35106.12°27.86115.98°29.65113.98°28.5115.26°
MUJU33.05108.38°28.61107.47°27.99115.10°29.77113.09°28.6114.35°
KWNJ32.89116.4°29.38112.75°28.07114.67°29.85112.66°28.65113.91°
PUSN32.50110.47°28.10108.94°28.01115.69°29.79113.71°28.61115.00°
Table 2. Regional statistics for GAMIT/GLOBK vs. KGD2002 coordinate differences. (ΔN and ΔE are official minus GAMIT, in cm. Positive means official north/east of GAMIT. RMSE is in cm.)
RegionMean ΔN (cm)Mean ΔE (cm)RMSE ΔN (cm)RMSE ΔE (cm)
Gyeonggi−0.180.010.860.72
Gangwon−0.130.190.790.83
Chungbuk0.08−0.030.620.70
Chungnam−0.24−0.090.830.77
Gyeongbuk0.300.150.870.81
Gyeongnam0.12−0.310.770.81
Jeonbuk−0.24−0.330.760.73
Jeonnam−0.37−0.132.521.20
Jeju−0.28−0.140.700.73
Table 3. Regional statistics for Bernese vs. KGD2002 coordinate differences. (ΔN and ΔE are official minus Bernese, in cm. Positive means official north/east of Bernese. RMSE in cm.)
RegionMean ΔN (cm)Mean ΔE (cm)RMSE ΔN (cm)RMSE ΔE (cm)
Gyeonggi0.030.120.740.68
Gangwon0.040.100.730.77
Chungbuk0.150.010.540.62
Chungnam0.040.280.620.65
Gyeongbuk−0.04−0.060.640.70
Gyeongnam0.05−0.050.640.75
Jeonbuk−0.180.040.600.62
Jeonnam−0.35−0.140.690.70
Jeju−0.21−0.120.640.64
Table 4. Regional statistics for GAMIT/GLOBK vs. Bernese coordinate differences. (ΔN and ΔE are official minus Bernese, in cm. Positive means official north/east of Bernese. RMSE in cm.)
RegionMean ΔN (cm)Mean ΔE (cm)RMSE ΔN (cm)RMSE ΔE (cm)
Gyeonggi−0.21−0.110.860.73
Gangwon−0.170.090.750.77
Chungbuk−0.07−0.050.630.75
Chungnam−0.28−0.370.910.85
Gyeongbuk0.350.210.960.93
Gyeongnam0.07−0.260.800.81
Jeonbuk−0.06−0.370.700.83
Jeonnam−0.020.012.551.22
Jeju−0.07−0.010.640.65
Disclaimer/Publisher’s Note: The statements, opinions and data contained in all publications are solely those of the individual author(s) and contributor(s) and not of MDPI and/or the editor(s). MDPI and/or the editor(s) disclaim responsibility for any injury to people or property resulting from any ideas, methods, instructions or products referred to in the content.

