Article

EEMD Energy Spectrum Decoupling: An Efficient Hilbert–Huang Fusion Approach for Intelligent Bearing Fault Diagnosis

School of Ocean Information Engineering, Jimei University, Xiamen 361000, China
*
Author to whom correspondence should be addressed.
Appl. Sci. 2025, 15(12), 6458; https://doi.org/10.3390/app15126458
Submission received: 13 May 2025 / Revised: 3 June 2025 / Accepted: 6 June 2025 / Published: 8 June 2025

Abstract

As a critical component of rotating machinery, the operational status of rolling bearings is considered to directly determine the reliability of rail traffic systems. To address the complex modulation effects existing between multiple bearing components and the non-linear, non-stationary characteristics exhibited by vibration acceleration signals, an intelligent fault diagnosis method for bearings based on Hilbert envelope demodulation and Ensemble Empirical Mode Decomposition energy distribution features is proposed. First, the original vibration signal is subjected to envelope demodulation processing by the Hilbert transform, thereby effectively separating the envelope signal containing fault characteristics. Subsequently, the demodulated envelope signal is decomposed by EEMD to extract Intrinsic Mode Functions (IMFs), where each IMF component is calculated layer by layer using a normalization method based on the EEMD decomposition sequence. Finally, the proposed algorithm is validated by the standard bearing fault dataset from Case Western Reserve University. Experimental results show that the proposed method achieves 100% accuracy in fault identification, and its superiority is proven to exceed conventional diagnostic approaches significantly.

1. Introduction

As the backbone of the modern transportation system, rail vehicles serve an irreplaceable function in enhancing travel efficiency and cargo transportation capacity. However, with the rapid expansion of rail transit networks and the continuous increase in train operating speeds, the operational safety of rail vehicles (including high-speed electric multiple units (EMUs), intercity express trains, and subway systems) has been recognized as a critical research focus in this field [1,2]. Notably, the malfunction of key components, such as bogies, braking systems, and traction power supply equipment, can not only result in train delays and operational disruptions but also potentially cause severe safety accidents, thereby posing a direct threat to the lives and property of passengers [3]. Therefore, it is imperative to conduct research on fault detection for key components of rail transit systems.
Faults of rail vehicles can primarily be categorized into mechanical faults, electrical faults, and rail system faults. Among these categories, mechanical failures occur most frequently, comprising approximately 50% to 70% of all reported faults [4]. In particular, the bearings, as the core components of the mechanical system in rail vehicles, are exposed to complex dynamic loads under extreme operating conditions. On the one hand, bearings replace sliding friction with rolling contact, thereby significantly reducing operational energy consumption. On the other hand, in the traction system, the normal functioning of bearings is directly linked to the efficiency of power transmission. However, statistical data indicate that among the mechanical faults of rail trains, those associated with bearings account for as much as 28% to 35%, making them one of the primary mechanical causes of unplanned train suspensions [5,6]. Therefore, the development of advanced early fault detection and intelligent diagnosis methods for bearings is considered crucial for enhancing operational reliability, ensuring rail vehicles running safety, and preventing catastrophic accidents [7,8].
At present, the primary detection methods can be categorized into temperature monitoring, acoustic emission analysis, vibration-based diagnostics, and machine learning-driven fault detection. Among these, temperature monitoring utilizes infrared thermal imagers or embedded temperature sensors to track bearing temperature increases and triggers alerts upon detecting anomalies. Nevertheless, external heat sources, such as braking systems, may lead to false alarms. Acoustic emission technology identifies faults by detecting high-frequency stress waves generated during crack propagation or spalling within bearing materials, leveraging parameters like event counts and energy levels. However, advanced acoustic emission systems are costly and often necessitate offline inspections. Machine learning-based fault detection models extract time-frequency characteristics from vibration and temperature signals, enabling efficient fault classification. Nonetheless, this approach depends on acquiring expensive fault samples and faces challenges in deploying edge devices [9,10,11]. Notably, traditional vibration analysis employs accelerometers to collect bearing vibration signals and analyzes their time-domain and frequency-domain features to achieve cost-effective fault detection. Nonetheless, this method relies solely on single-frequency-domain analysis via Fast Fourier Transform (FFT), which struggles to adaptively decompose non-stationary signals, leading to a lower fault recognition rate.
To make up for the defect of modal aliasing, this paper proposes a bearing fault diagnosis method based on the energy distribution characteristics of the EEMD eigenfunction. Different from the literature [12], in this paper, the energy values of each EEMD eigenfunction are calculated successively and normalized. These values are used as feature vectors to diagnose whether there are faults in the bearings. The major contributions of this paper are summarized as follows:
  • This paper proposes an innovative hybrid approach combining Hilbert envelope demodulation with EEMD to address the limitations of conventional vibration analysis in detecting rolling bearing faults. The method effectively separates fault-related features from non-linear, non-stationary signals while overcoming mode-mixing issues inherent in traditional EMD.
  • A novel normalized energy distribution feature vector (ED) is introduced as a quantitative diagnostic indicator. By analyzing the energy distribution patterns of EEMD-derived IMFs, the method distinguishes faulty bearings (non-monotonic ED) from healthy ones (monotonic ED) with high interpretability and computational efficiency.
  • The proposed method is rigorously validated on the Case Western Reserve University bearing dataset, achieving 100% fault identification accuracy under varying operational conditions, including different sampling rates (12 kHz/48 kHz) and fault locations (drive end/fan end). This exceptional performance highlights the algorithm’s strong noise immunity and practical applicability.
The remaining sections of this article are organized as follows: Section 2 is the related work. Section 3 presents a theoretical foundation of bearing faults. In Section 4, the paper proposes the materials and methods about bearing faults. The experimental results are presented and analyzed in Section 5. We summarize this article in Section 6.

2. Related Work

Recently, vibration-based fault diagnosis methods have emerged as the predominant technology in the field of rolling bearing fault diagnosis, attributed to their advantages such as easy installation, excellent stability, and high sensitivity.

2.1. Bearing Diagnostic Methods

Some studies decompose and analyze vibration signals to extract fault characteristic frequencies, thereby enabling the identification and classification of fault signals [13,14,15]. For comprehensive feature extraction from vibration signals, a hybrid approach integrating Quadratic Wavelet Packet Energy Entropy (QWPEE) with t-distributed Stochastic Neighbor Embedding (t-SNE) was introduced in reference [13], effectively enhancing pattern recognition capabilities for bearing faults. To address the challenges brought by non-stationary signals, reference [14] employed Continuous Wavelet Transform (CWT) and Wavelet Packet Transform (WPT) to reconstruct signals exhibiting non-stationary characteristics, thereby enhancing the prominence of bearing fault-related frequencies and ultimately improving fault detection accuracy. Similarly, reference [15] adopted an approach combining envelope analysis with wavelet packet transform for feature extraction, followed by support vector machine (SVM)-based classification, where the SVM was primarily utilized to distinguish between normal and faulty signals or to classify different fault types. However, the selection of wavelet basis functions and the setting of parameters have a significant impact on the analysis results, and they have a large amount of calculation in the train-bearing scenario with high real-time requirements. In reference [16], a novel Maximum L-Kurtosis Deconvolution (MLKD) algorithm was proposed, accompanied by an iterative filter specifically designed to deconvolute unknown fault signals through L-kurtosis maximization. Reference [17] proposed a new method for diagnosing faults of rolling bearings, using wavelet packet decomposition for feature extraction and the chaotic sparrow search optimization algorithm to optimize the parameters of the deep belief network. In addition, some studies have adopted the back-propagation neural networks to diagnose bearing faults [18,19,20]. To avoid the problem of information loss of vibration signals during the feature extraction process, reference [18] proposed an intelligent fault diagnosis method for rolling bearings based on short-time Fourier transform and convolutional neural network (STFT-CNN). Aiming at the problem of poor ability of deep learning models in extracting comprehensive spatiotemporal features, reference [19] proposed a diagnostic method that integrates convolutional neural networks (CNNs), Long Short-Term memory (LSTM) networks, and gated recurrent unit (GRU) models. Reference [20] proposed a hybrid framework based on rolling bearing fault diagnosis by integrating variational mode decomposition—Discrete wavelet Transform (VMD-DWT) with depth-separable CNN-BiLSTM based on hybrid attention (HADS-CNN-BiLSTM). However, neural networks are relatively sensitive to the quality and noise of the training data, and it is difficult to achieve good generalization ability.

2.2. The EMD Method Based on IMF

The Empirical Mode Decomposition (EMD) method has been widely adopted in rail transit applications due to its adaptive capability in decomposing non-stationary and non-linear bearing vibration signals into multiple IMF components. Each IMF component represents distinct signal characteristics at different time scales, effectively capturing local variations and complex vibration patterns. Subsequent fault diagnosis is typically performed through envelope spectrum analysis [12,21,22] or energy spectrum examination [12], where the extracted IMF components are systematically analyzed to identify fault-related features. While Hilbert transform and EEMD are well-established techniques, their combination for energy distribution decoupling represents a novel diagnostic paradigm. To address the challenges of rolling bearing fault identification, diverse advanced methodologies have been developed in recent studies [23,24]. Furthermore, an information entropy-based methodology was established in reference [23], where a novel feature extraction and denoising framework was constructed. This approach incorporates an optimized wavelet threshold function to denoise Intrinsic Mode Function (IMF) components, thereby significantly improving diagnostic accuracy in fault detection. In reference [24], a distinctive feature extraction strategy combining Singular Value Decomposition (SVD) with Optimal Frequency Band Energy (OFBE) analysis was developed. This method enables precise fault characterization through comparative analysis with theoretical fault characteristic frequencies, facilitating the reliable determination of bearing fault types. In reference [25], the Advanced Complete Ensemble Empirical Mode Decomposition (ICEEMD) model was used to extract the fault features. However, calculating statistics merely describes certain characteristics of the vibration signal as a whole, ignoring the hidden information of complex signals. Reference [26] proposed a bearing fault diagnosis method that fully integrates Empirical Model Decomposition (CEEMDAN) and the Gray Wolf algorithm-optimized kernel Extreme Learning Machine (GWO-KELM) to improve the diagnosis success rate of bearing conditions. We carry out in a summary in Table 1.

3. Envelope Demodulation

During the operation of bearings, complex modulation effects arise from interactions among multiple moving components, including rollers, cages, inner rings, and outer rings [3]. The characteristic information of the fault is predominantly embedded within the envelope components of the modulation signal. Consequently, performing effective envelope demodulation on collected vibration signals to extract envelope signals that contain fault characteristics precisely constitutes a critical step in achieving accurate bearing fault diagnosis. The envelope information of the amplitude modulation signal can be effectively extracted through the Hilbert transform, thereby achieving envelope demodulation, which can be expressed as follows [21]:
d t = H c t = 1 π + c τ t τ d τ
Then, the complex functions can be expressed as
z t = c t + i d t = A t e i θ t
where the instantaneous amplitude can be expressed as A t = c 2 t + d 2 t and the instantaneous phase can be expressed as θ t = arctan d t c t . In addition, the instantaneous frequency can be obtained by differentiating the instantaneous phase and can be expressed as
f t = 1 2 π d θ t d t .

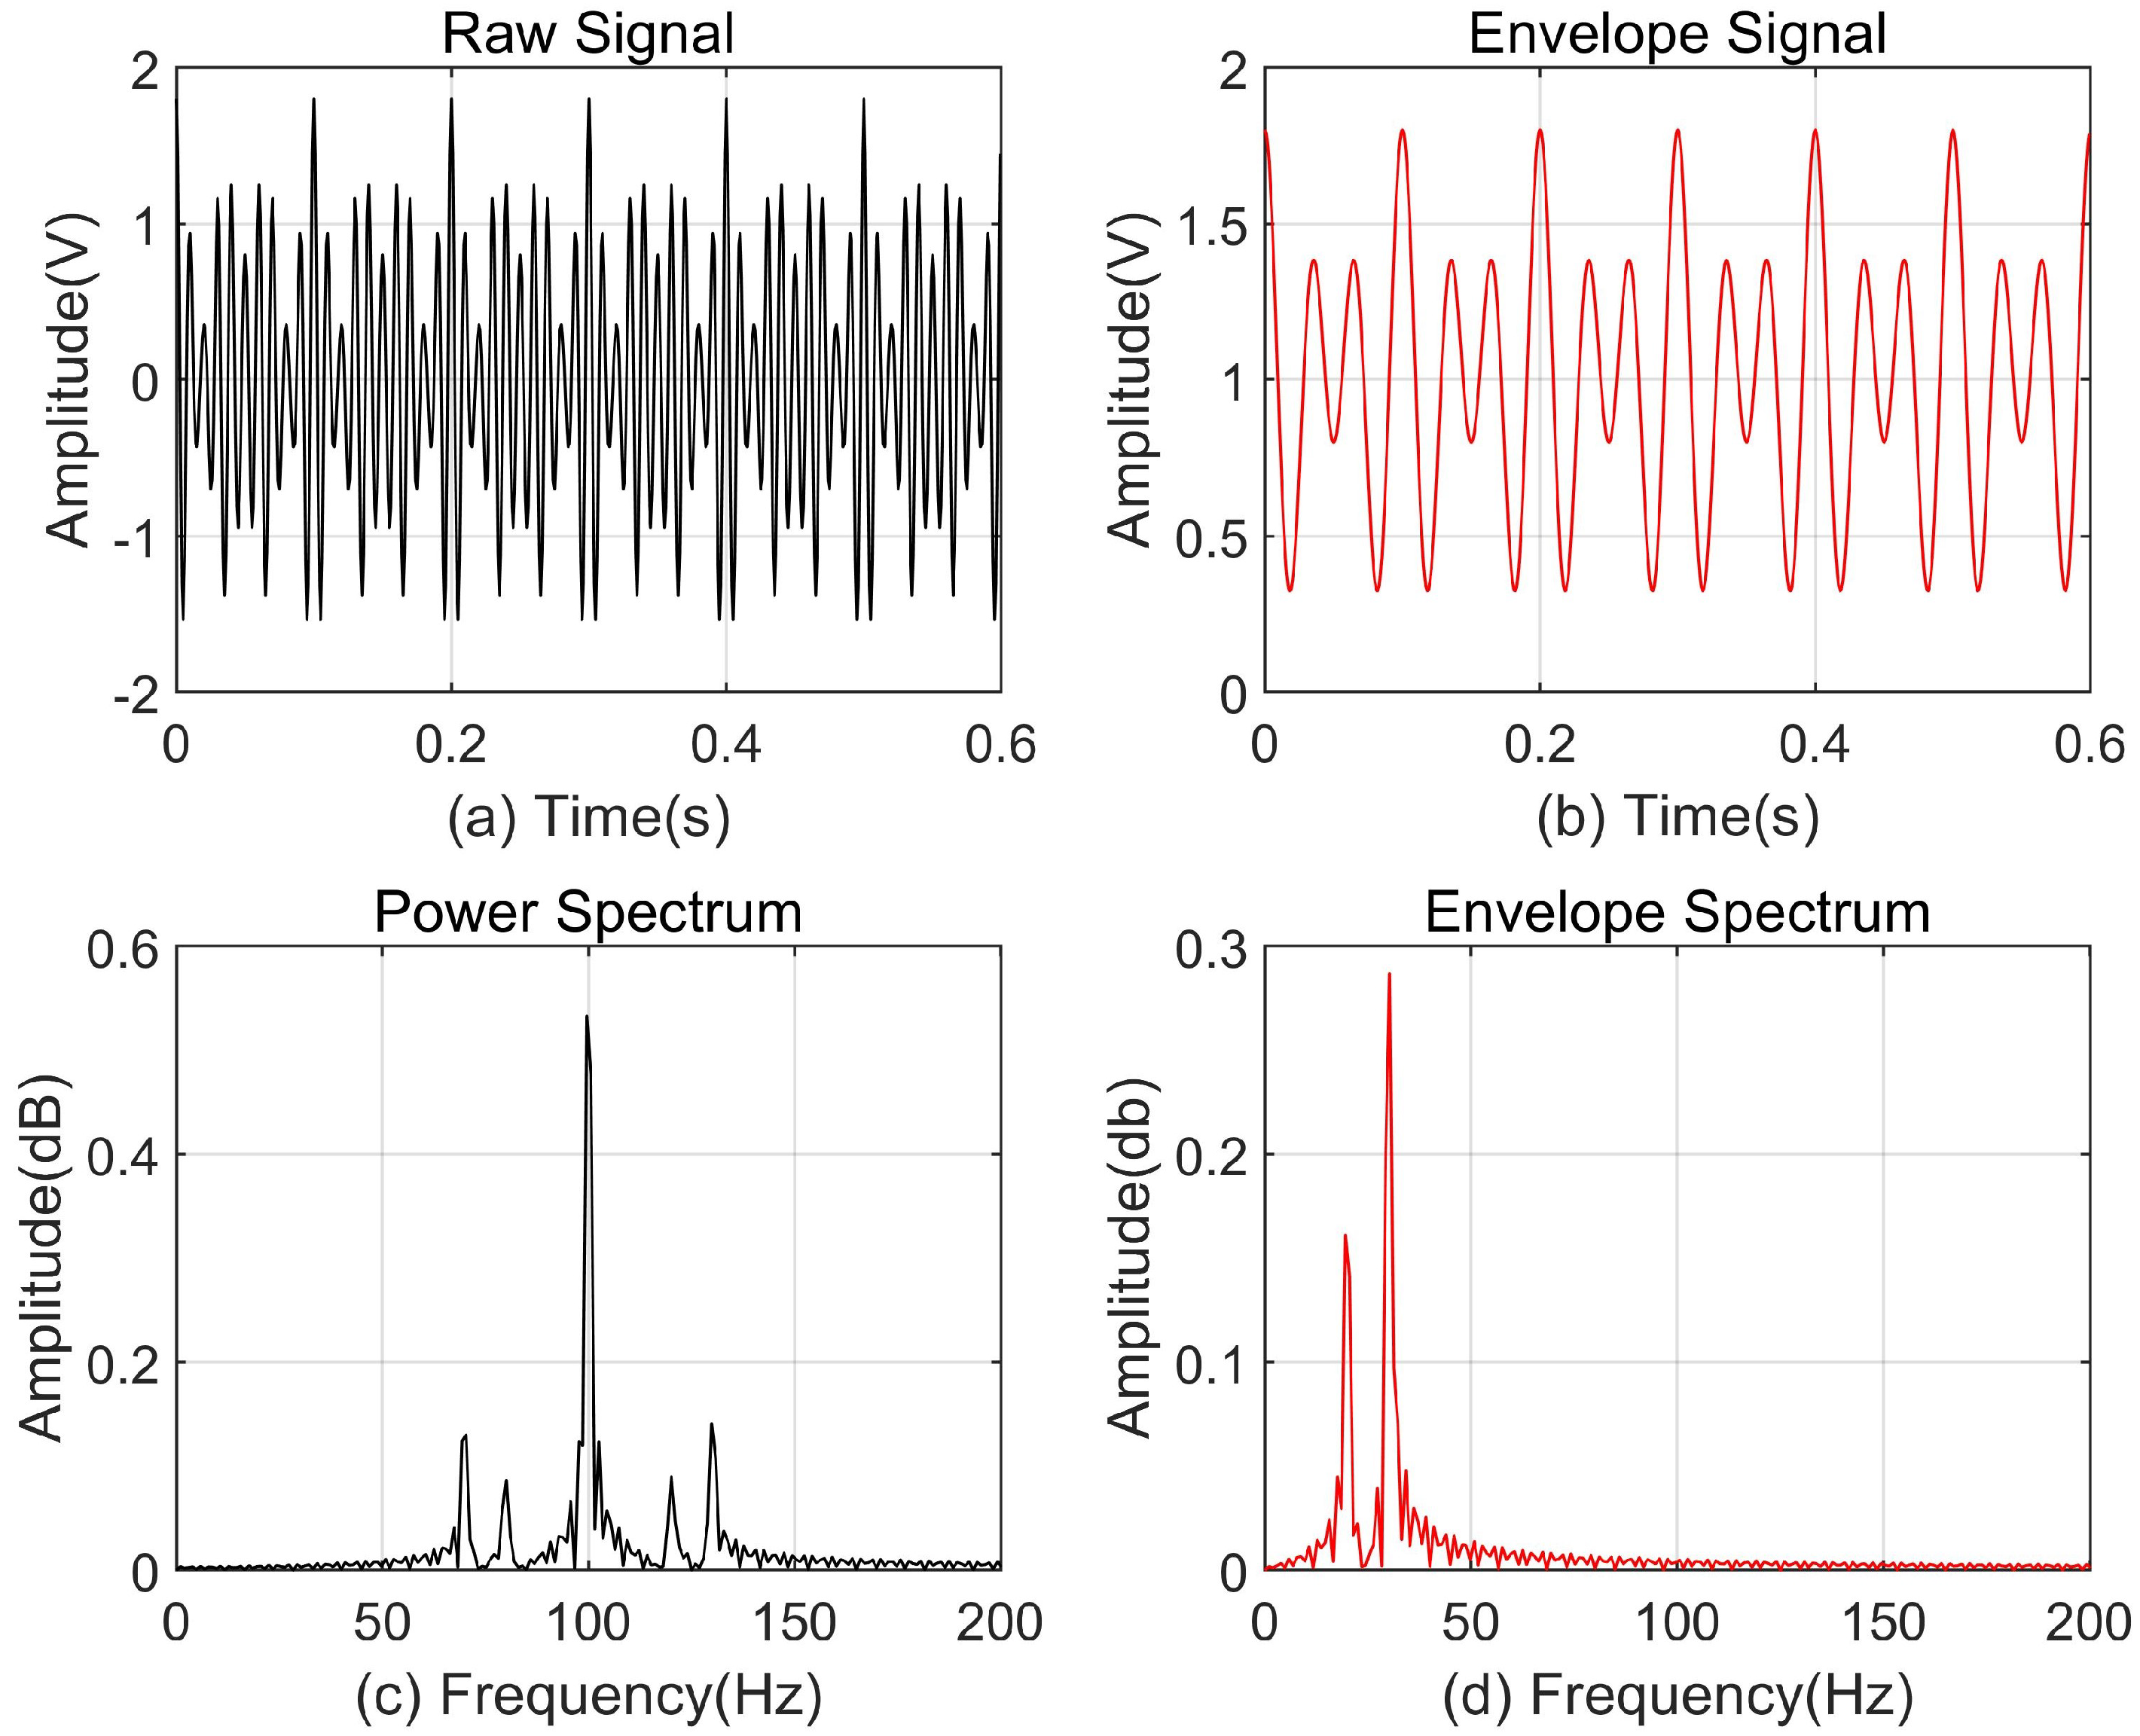
3.1. Verification of Envelope Demodulation

To verify the effectiveness of the envelope demodulation algorithm, this paper takes the two-tone amplitude modulation signal as the research object and represents its mathematical expression form as
y t = 1 + 0.3 cos 2 π · f 1 t + 0.5 cos 2 π · f 2 t · cos 2 π · f c t
where modulating signal f 1 = 20 , modulating signal f 2 = 30 , and carrier signal f c = 30 .
Figure 1 demonstrates the validation results of the envelope demodulation algorithm, which verifies the correctness of the envelope demodulation algorithm and indicates that the envelope demodulation algorithm can be used to separate the rotation signal of the bearing from the vibration signal of the bearing failure and correctly extract the vibration fault signal of the shaft failure. The spectrum in Figure 1b shows that 100 ± 20 Hz and 100 ± 30 Hz are the spectra of the modulated signal y t . The spectra of Figure 1d are 20 Hz and 30 Hz, which are the spectra of the modulated signal.

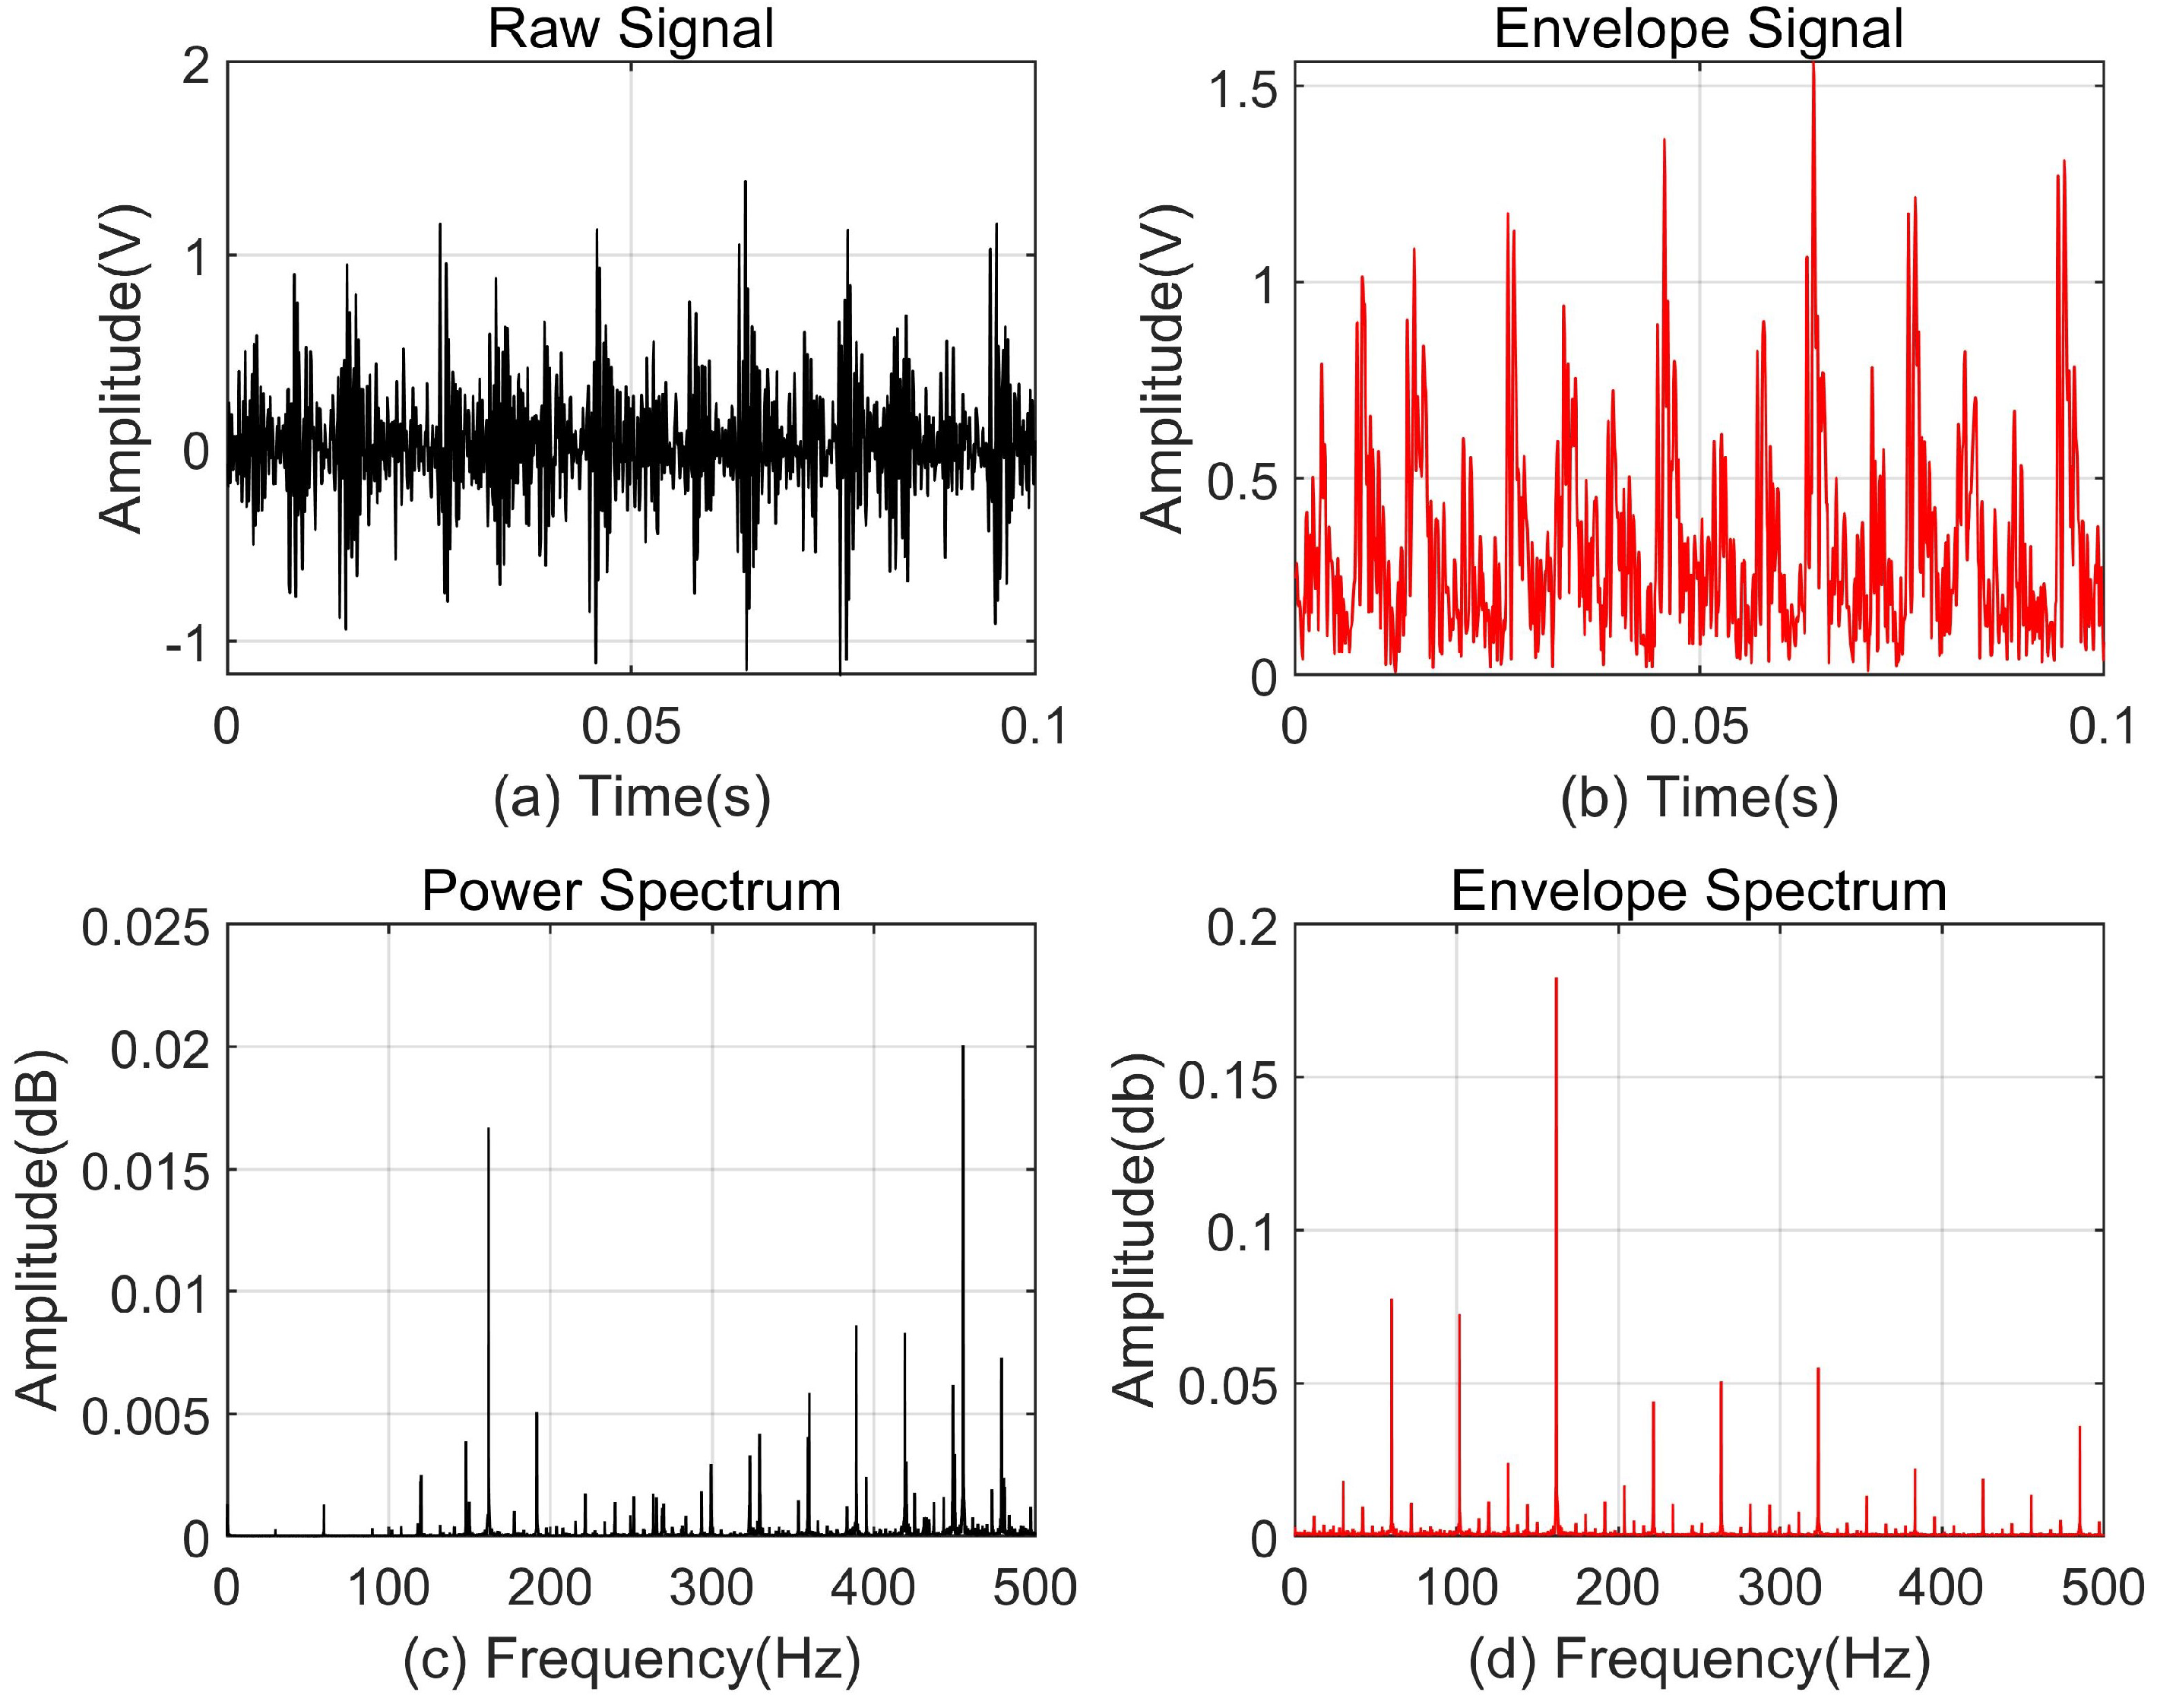
3.2. The Practical Application and Existing Problems of the Envelope Demodulation Algorithm

The envelope spectrum analysis of vibration signals typically involves two key steps: envelope demodulation and subsequent envelope spectrum analysis [26]. Taking practical application into account, this article uses the dataset from the Bearing Data Center at Western Reserve University (CWRU) as a case study.
In terms of extracting envelope signals, to verify the effectiveness of detecting faults in the inner ring of the bearing drive end, this article takes 105.mat in the dataset as an example at a sampling rate of 12 KHz. The waveform, spectrum, and envelope of the signal are shown in Figure 2. Figure 2a shows the waveform of the signal. Figure 2b shows the envelope waveform of the signal. Figure 2c shows the spectrum of the signal. It can be seen that the spectral components of the vibration signal are rather complex, and the intensity differences of each frequency component are relatively small, making it difficult to clearly and effectively reflect the characteristic frequencies of the fault. Therefore, accurate fault diagnosis cannot be carried out based on this spectrum. Figure 2b,d show that after envelope demodulation of the signal, its envelope spectrum presents a clear and identifiable pattern. Figure 2d reflects the characteristic frequency distribution law of the fault, providing a reliable basis for fault diagnosis.
In terms of the spectral transformation of envelope signals, under the condition that the bearings are normal and without faults, this article takes the 97.mat file in the dataset as an example. The waveform, spectrum, and envelope of the signal are shown in Figure 3. Figure 3a shows the waveform of the signal, Figure 3b presents the envelope waveform of the signal, while Figure 3c indicates that the spectral components of the vibration signal are rather complex and have small amplitude differences, making it difficult to reflect the characteristic frequency of the fault. Fault diagnosis cannot be directly based on this result. However, if fault diagnosis is carried out based on Figure 3d, misjudgment may occur.
A comprehensive analysis of Figure 2 and Figure 3 reveals that the spectrum of the vibration signal cannot effectively reflect the characteristic frequency of the fault, while the envelope spectrum of the vibration signal can more accurately represent the characteristic frequency of the fault. Envelope demodulation of the vibration signal is an indispensable step. However, relying solely on envelope spectra for fault diagnosis may have limitations and is prone to misjudgment, thereby affecting the reliability of the diagnosis results.

4. Materials and Methods

Considering that the time-domain waveform or spectrum of the vibration signal cannot effectively identify the characteristic frequencies of bearing faults, the envelope signals are further decomposed and analyzed using EEMD in this paper.

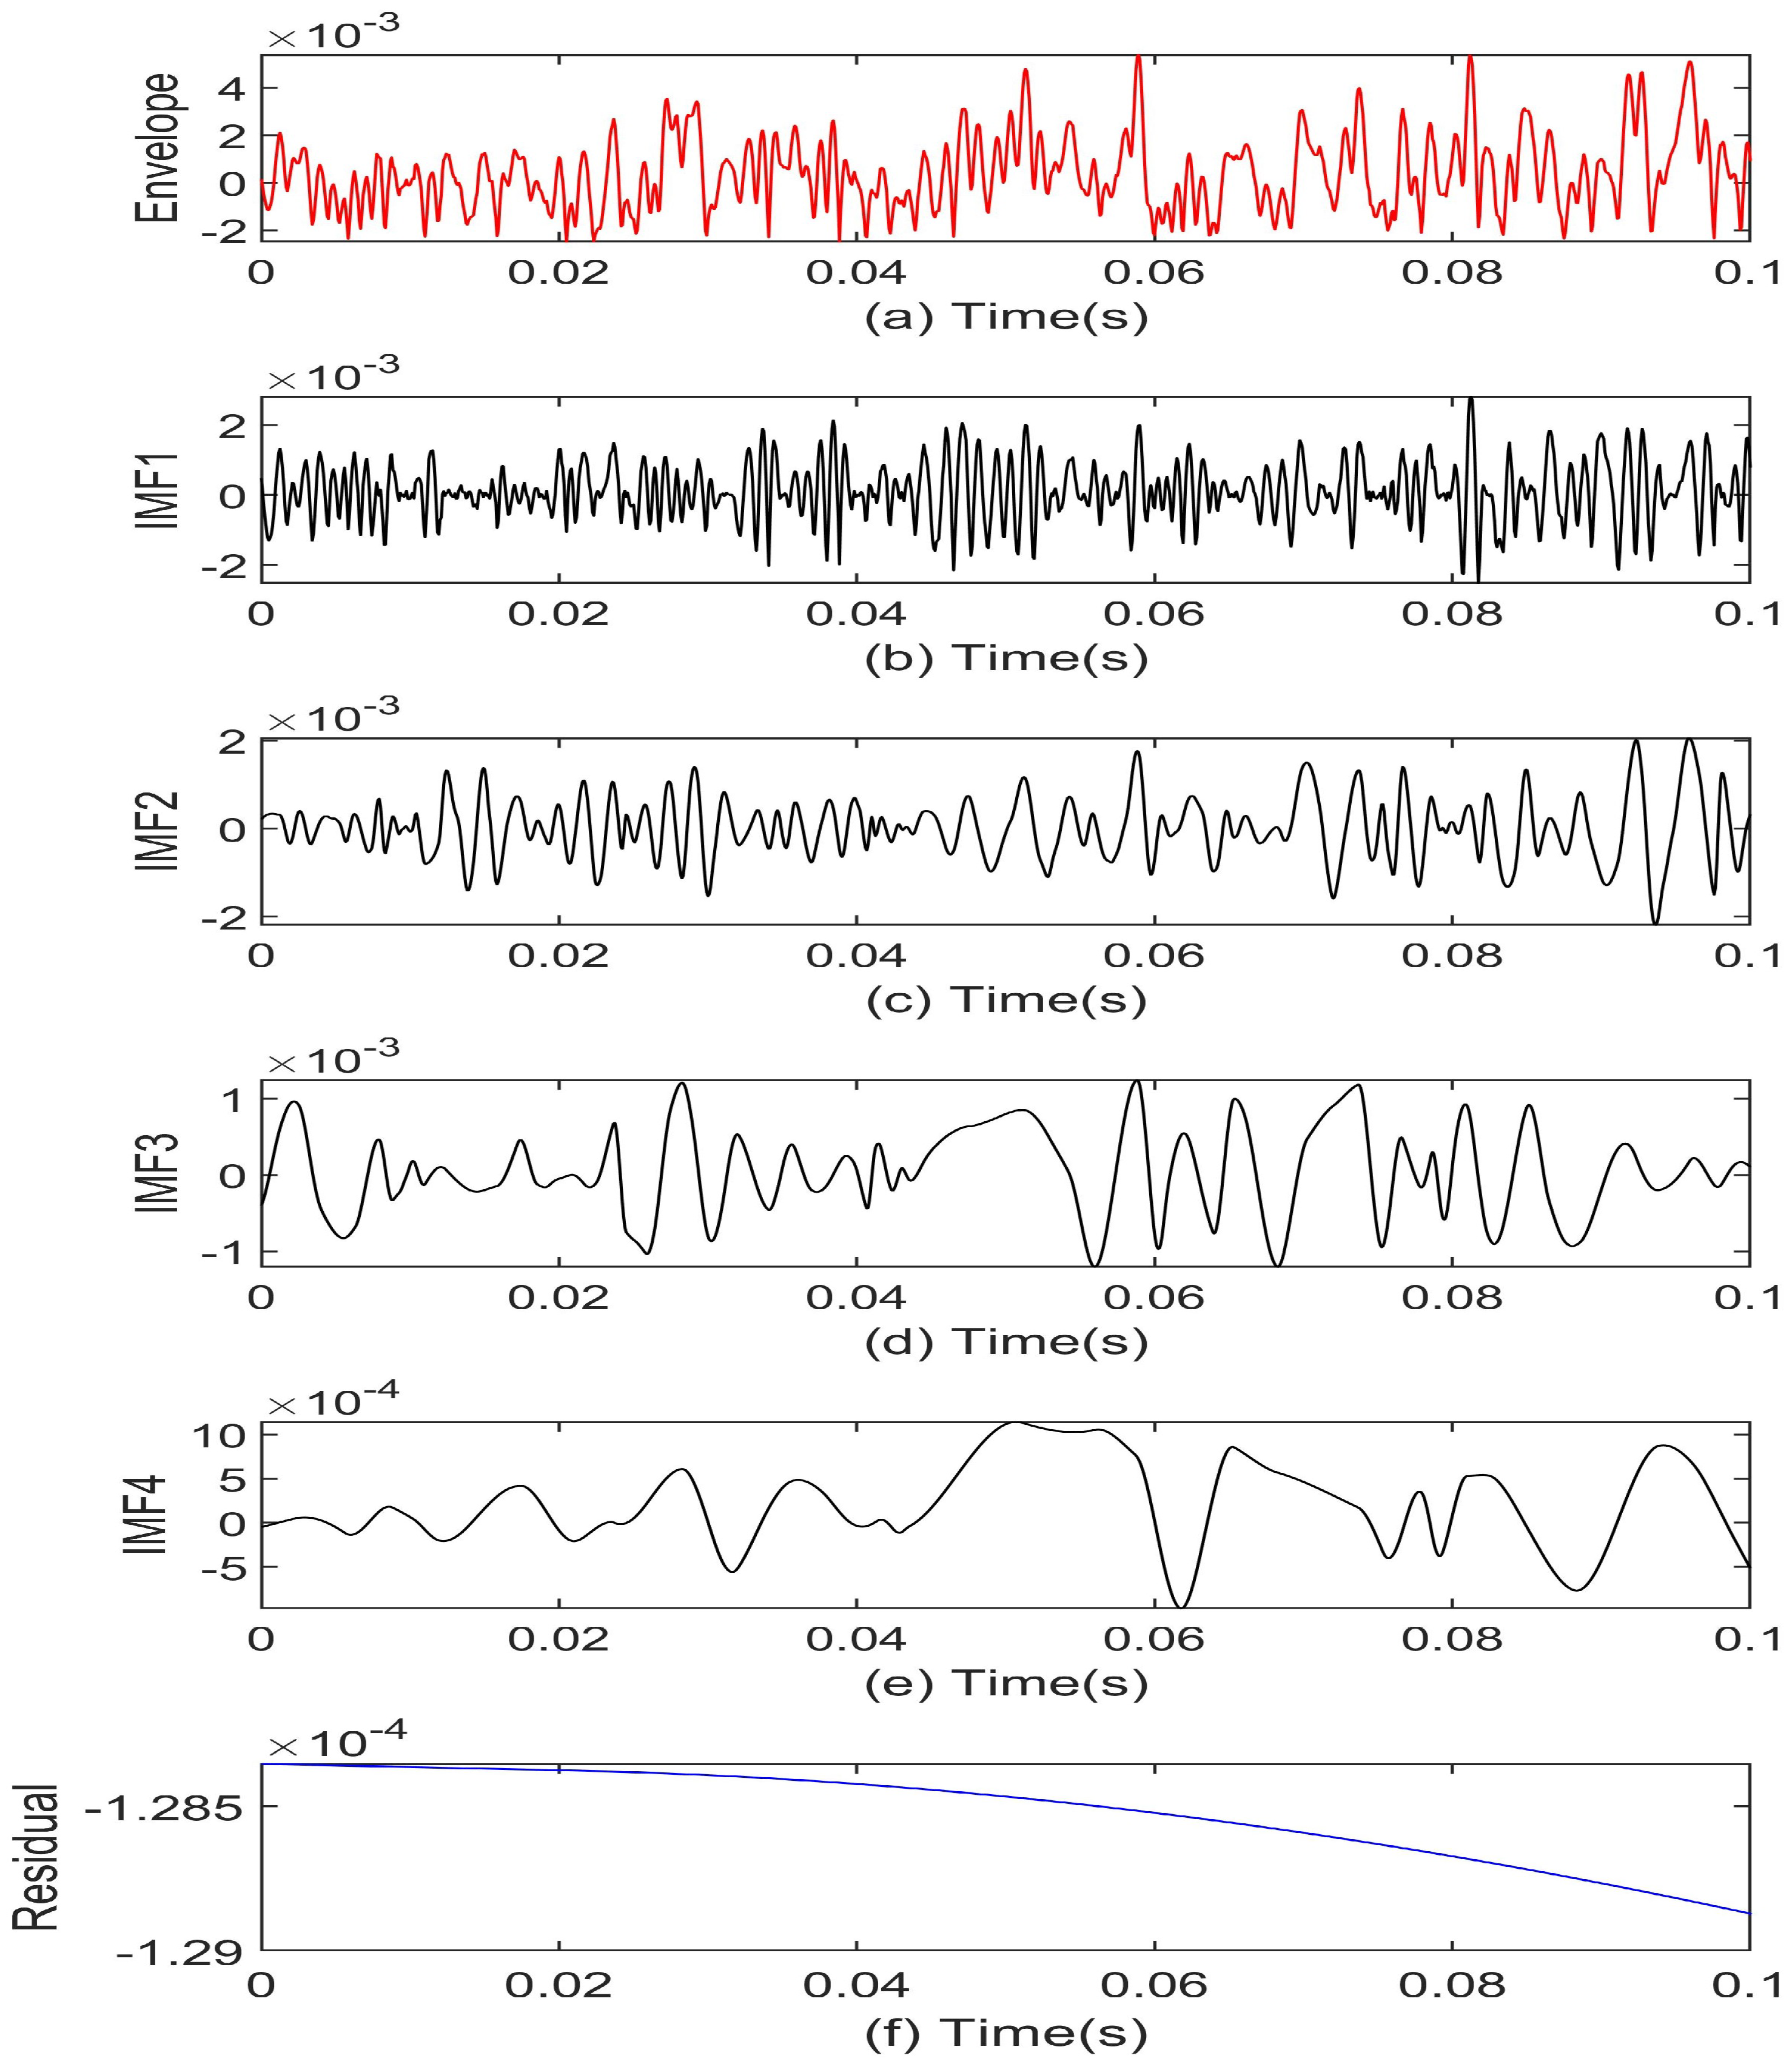
4.1. Signal Decomposition Based on EEMD

EMD decomposes the signal from high frequency to low frequency into a finite number of Intrinsic Mode Functions (IMFs) and the sum of the remaining terms. For the signal x t , the implementation process of the EMD method is as follows:
S t e p 1 : The acquisition of all local maxima and minima of the signal.
S t e p 2 : Interpolation operations are performed on all maximum and minimum points, respectively, based on cubic splines.
S t e p 3 : Fitting the upper and lower envelope and its average m 1 and then calculaion of h 1 = x t m 1 .
S t e p 4 : If h 1 is an IMF, h 1 is recorded as the first IMF component. If h 1 is not an IMF, it is taken as the original data and repeated the above three steps k times, and finally the following is obtained:
h 1 k = h 1 k 1 m 1 k .
Formula (5) meets the conditions of the IMF and can be regarded as the first-order IMF, denoted as c 1 . Among them, m 1 k refers to the average value of the upper and lower envelope lines of h 1 k 1 .
S t e p 5 : Subtraction of the component c 1 from the signal x t to obtain the residual signal r 1 = x t c 1 . Taking r 1 as the original data, Steps 1, 2, 3 are repeated to extract the second component c 2 of x t . By analogy, when r n is a monotonic function and the IMF can no longer be extracted, the loop ends, and the n IMF components are finally obtained. Therefore, the signal x t can be expressed as
x t = i = 1 n c i + r n
where r n is the residual function used to characterize the average trend of the signal.
However, in the presence of abnormal signals such as intermittent signals, pulse interference, and noise, the identification and distribution of extreme points are compromised. This leads to the obtained envelope line becoming a superposition of the local envelope line of the abnormal signal and the envelope line of the true signal. Moreover, the estimation error in the envelope line propagates continuously throughout the decomposition process. Consequently, the components of the decomposed IMFs not only capture the inherent patterns of the true signal but also incorporate the characteristics of the abnormal signal and its adjacent feature time scales, thereby causing modal aliasing. Wu and Huang proposed the EEMD method in 2009 [27]. Based on the characteristic of uniform spectral distribution in white noise, the EEMD method introduces white noise into the signal. This addition ensures the continuity of the signal across different time scales. Subsequently, multiple Empirical Mode Decompositions are performed to effectively address the issue of mode mixing.
Nevertheless, in practical applications, EEMD requires the setting of the amplitude coefficient k to add white noise and the overall average times M. If these parameters are improperly configured, it may result in an increased decomposition error for EEMD. Specifically, the amplitude coefficient k for adding white noise is inversely proportional to the accuracy of the EEMD decomposition result. However, if the amplitude of the added white noise is too small, the original signal may not be sufficiently enhanced, thereby failing to adequately address the issue of pattern confusion. Conversely, if the amplitude of the added white noise is excessively large, ensuring that the decomposition error satisfies the required accuracy necessitates a sufficiently high number of overall averaging iterations M. Nevertheless, as M increases, the computational cost rises linearly. To strike an optimal balance between decomposition accuracy and computational efficiency, it is essential to determine the appropriate white noise amplitude coefficient k and the number of overall averaging iterations M.

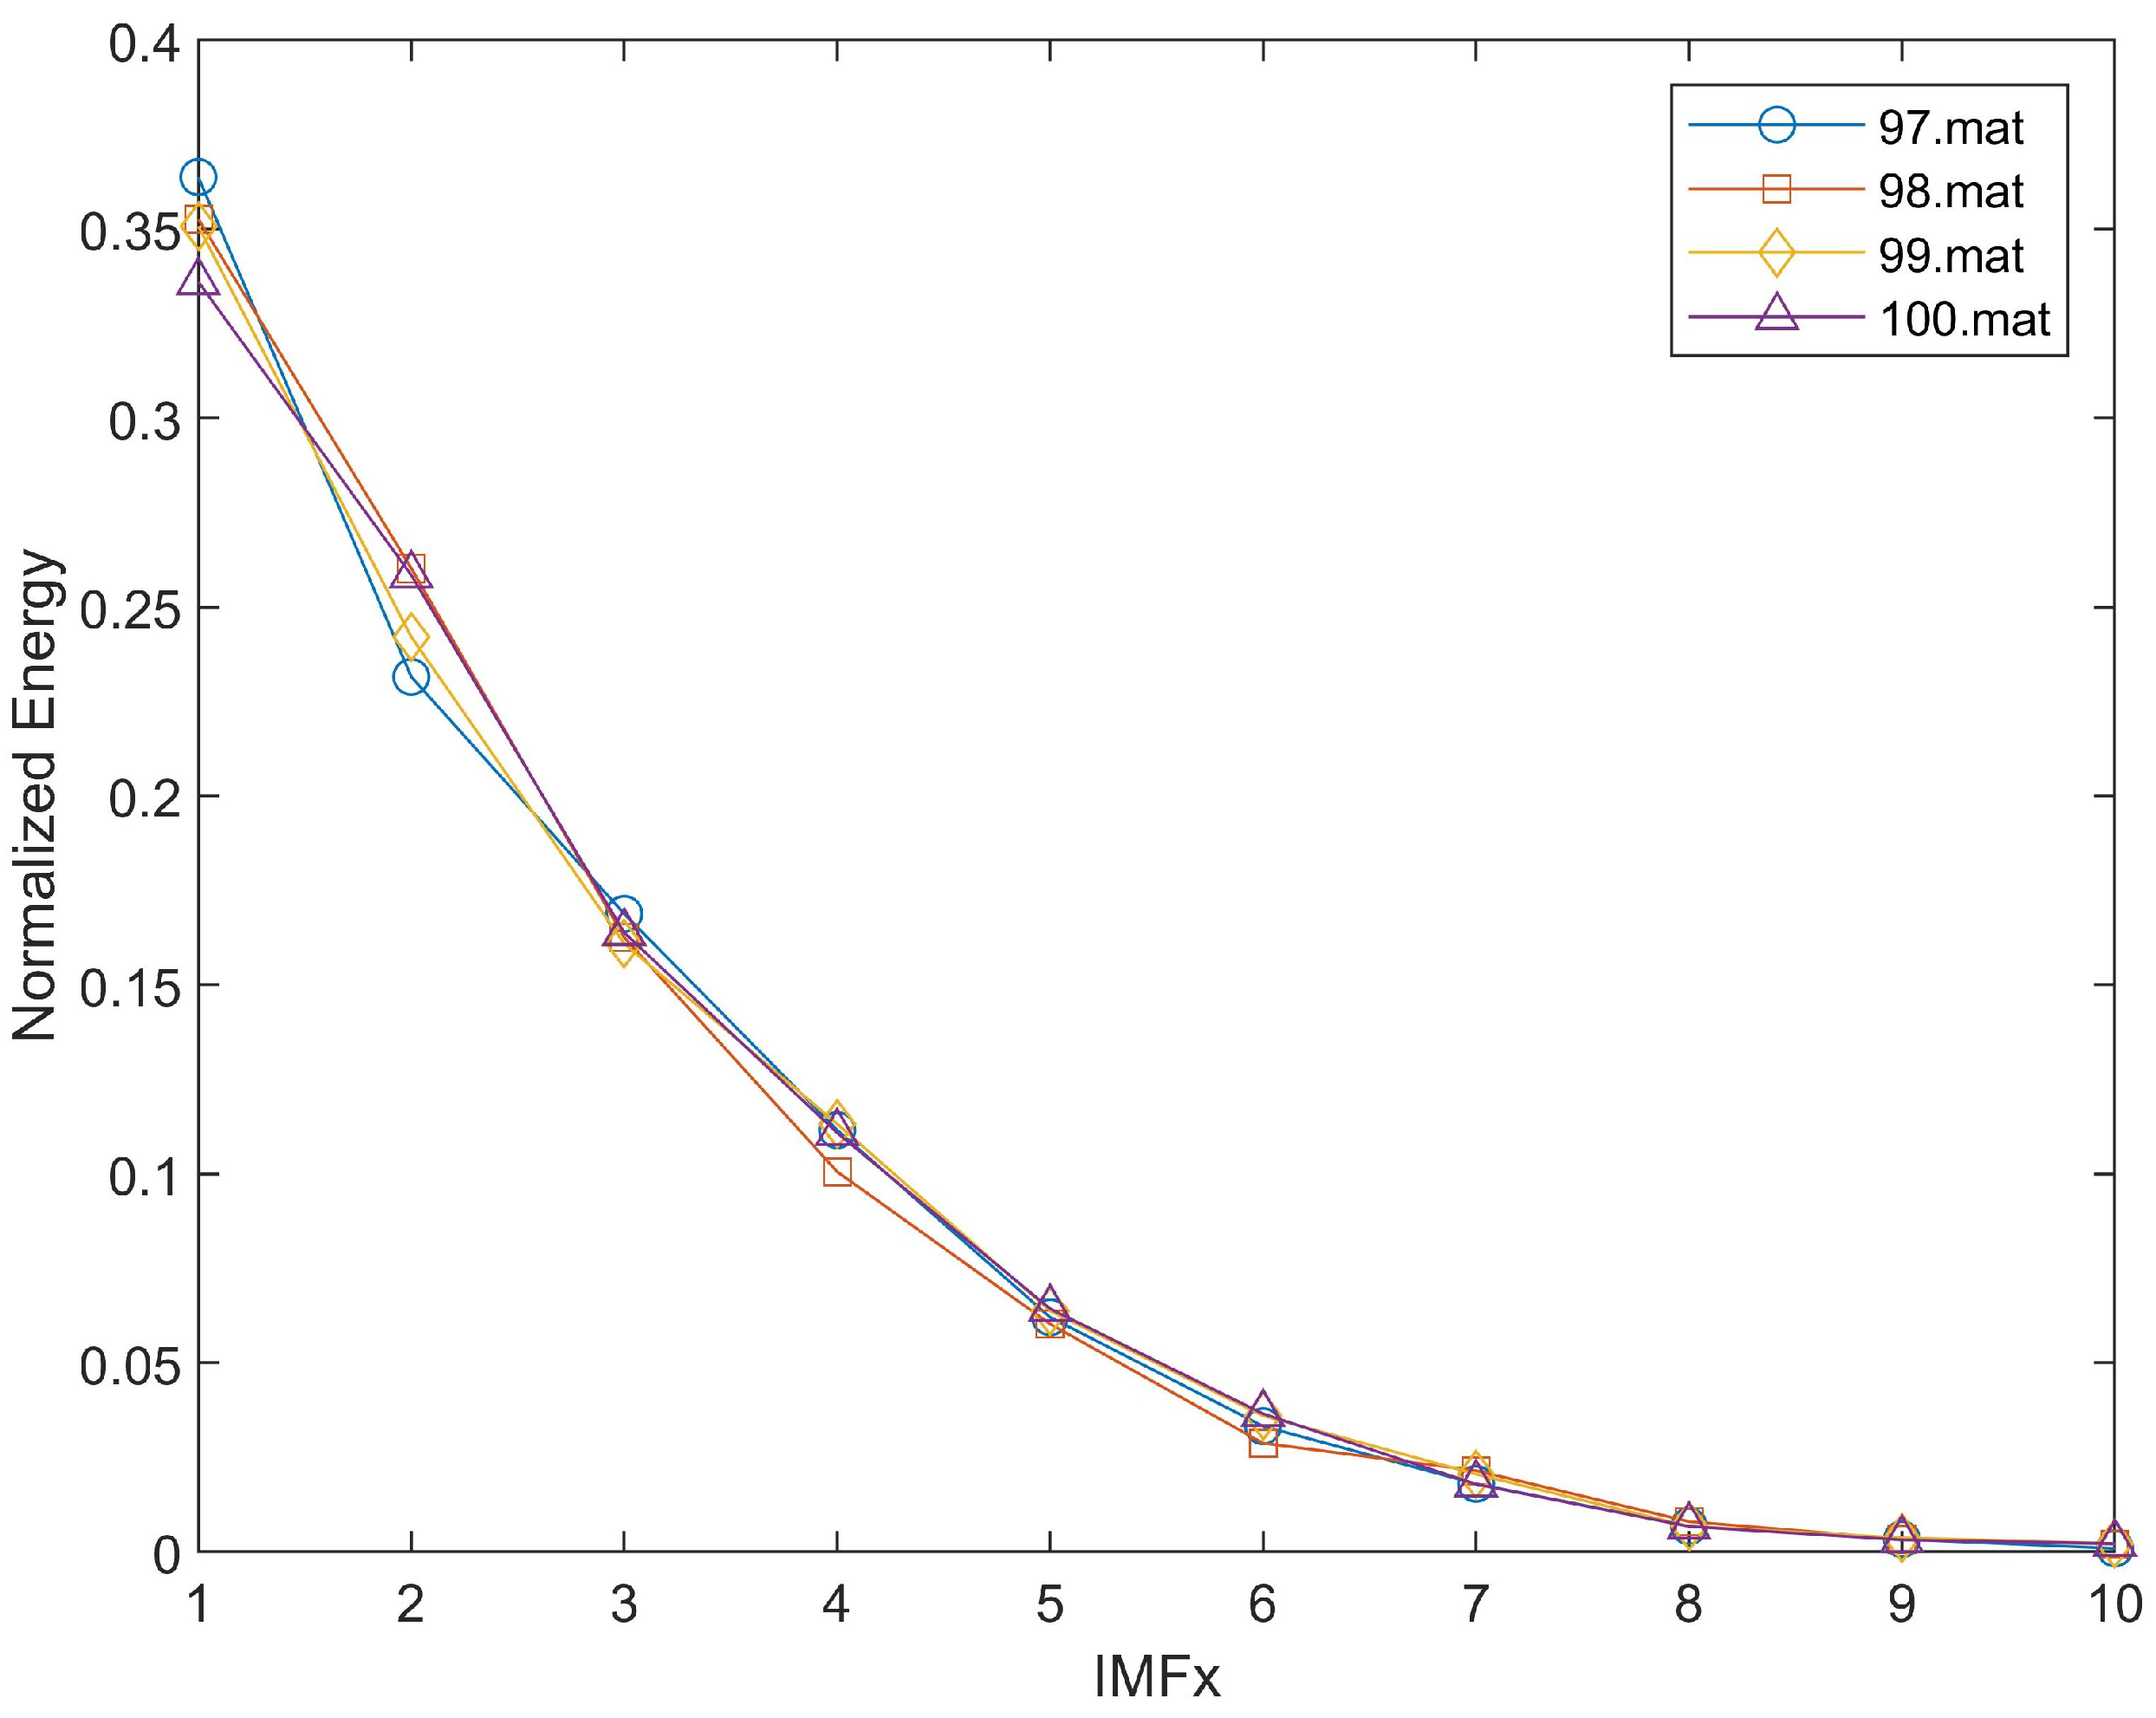
4.2. EEMD-Based Bearing Fault Diagnosis Using Energy Distribution Features of IMFs

After the signal is decomposed by EEMD, multiple IMF components and a residual quantity are obtained. Each IMF component contains the characteristic information of bearing faults. Fault diagnosis is carried out using the energy distribution of the IMF component as the feature vector, and its fault diagnosis method and process can be expressed as follows:
S t e p 1 : The envelope demodulation of the bearing vibration signal based on the Hilbert transform is carried out to obtain the envelope signal of the vibration signal.
S t e p 2 : The envelope signal is decomposed by EEMD to obtain the IMF component and the remainder.
S t e p 3 : The first 10 IMF components are selected and the total energy of each component is calculated as
E i = + c i t 2 d t = i = 1 n C i 2
where c i t is the i IMF component, C i is the amplitude of discrete points, and n is the number of sampling points.
Based on the energy of each IMF component, the normalized energy distribution characteristic vector ED can be expressed as
E i = + c i t 2 d t = i = 1 n C i 2 .
By using the energy of each IMF component, the normalized energy distribution characteristic vector can be constructed as
E D = E 1 E 2 E 3 / i = 1 10 E i
S t e p 4 : The ED values are arranged in sequence and fault diagnosis is performed by analyzing their distribution characteristics. The judgment criterion is defined as follows: If the ED values exhibit a strictly decreasing trend, the bearing condition is considered normal. Conversely, if the ED values deviate from a strictly decreasing order, it suggests the presence of a fault in the bearing.

5. Results and Discussion

5.1. Introduction to the Experimental Dataset

To verify the effectiveness of the proposed method, this paper employs the rolling bearing dataset provided by CWRU in the United States. This dataset encompasses data from normal operating conditions, as well as fault data for the bearing outer ring, inner ring, and rolling elements. Specifically, the drive end bearing experiment collected data at sampling rates of 12,000 samples per second and 48,000 samples per second, while all fan end bearing data were uniformly collected at a rate of 12,000 samples per second. Based on this dataset, this paper establishes a fault diagnosis classification task to demonstrate that the proposed model holds significant guiding value for rolling bearing fault diagnosis within the rail transit domain. It is worth noting that the dataset was constructed under conditions of constant rotational speed and fixed load, where the experimental environment involved short-term continuous monitoring of the bearing operating status using accelerometers. The data are available online: https://engineering.case.edu/bearingdatacenter/download-data-file/ (accessed on 2 March 2020).

5.2. Performance Analysis of the Proposed Algorithm

To verify the EEMD algorithm, this paper takes the signal composed of the superposition of three trigonometric functions as the research object and expresses its mathematical expression as
y = 5 sin 2 π f 1 t + 3 cos 2 π f 2 t + 2 cos 2 π f 3 t
where modulating signal f 1 = 4 , modulating signal f 2 = 20 , and modulating signal f 3 = 100 .
Figure 4 shows the waveform of the three-tone amplitude signal, the IMF after EMD, and the residual amount after EMD decomposition. Specifically, Figure 4a shows the waveform of the original signal; Figure 4b–e correspond, respectively, to the intrinsic modular functions IMF1 to IMF4 obtained after the decomposition of EMD; Figure 4f shows the remaining amount after the decomposition of EMD. The IMF4 component in Figure 4e and the residual quantity in Figure 4f can be regarded as errors caused by the endpoint effect of the EMD algorithm. Figure 4 verifies the effectiveness of the EEMD algorithm, indicating that by applying this algorithm, the separation of the bearing rotation signal and the bearing fault vibration signal can be achieved, and the vibration characteristic signal of the bearing fault can be accurately extracted.
Subsequently, we conduct an in-depth analysis of its energy distribution characteristics by using the EEMD method. The dataset provided by the Bearing Data Center of Western Reserve University in the United States is utilized to verify the effectiveness of the proposed algorithm. In the process of implementing the parameter settings for the EEMD algorithm, this paper addresses the modal aliasing issue effectively by introducing white noise into the signal. Specifically, the intensity of the added white noise, defined as the ratio of the standard deviation of the white noise to that of the original signal, is set to 0.2.

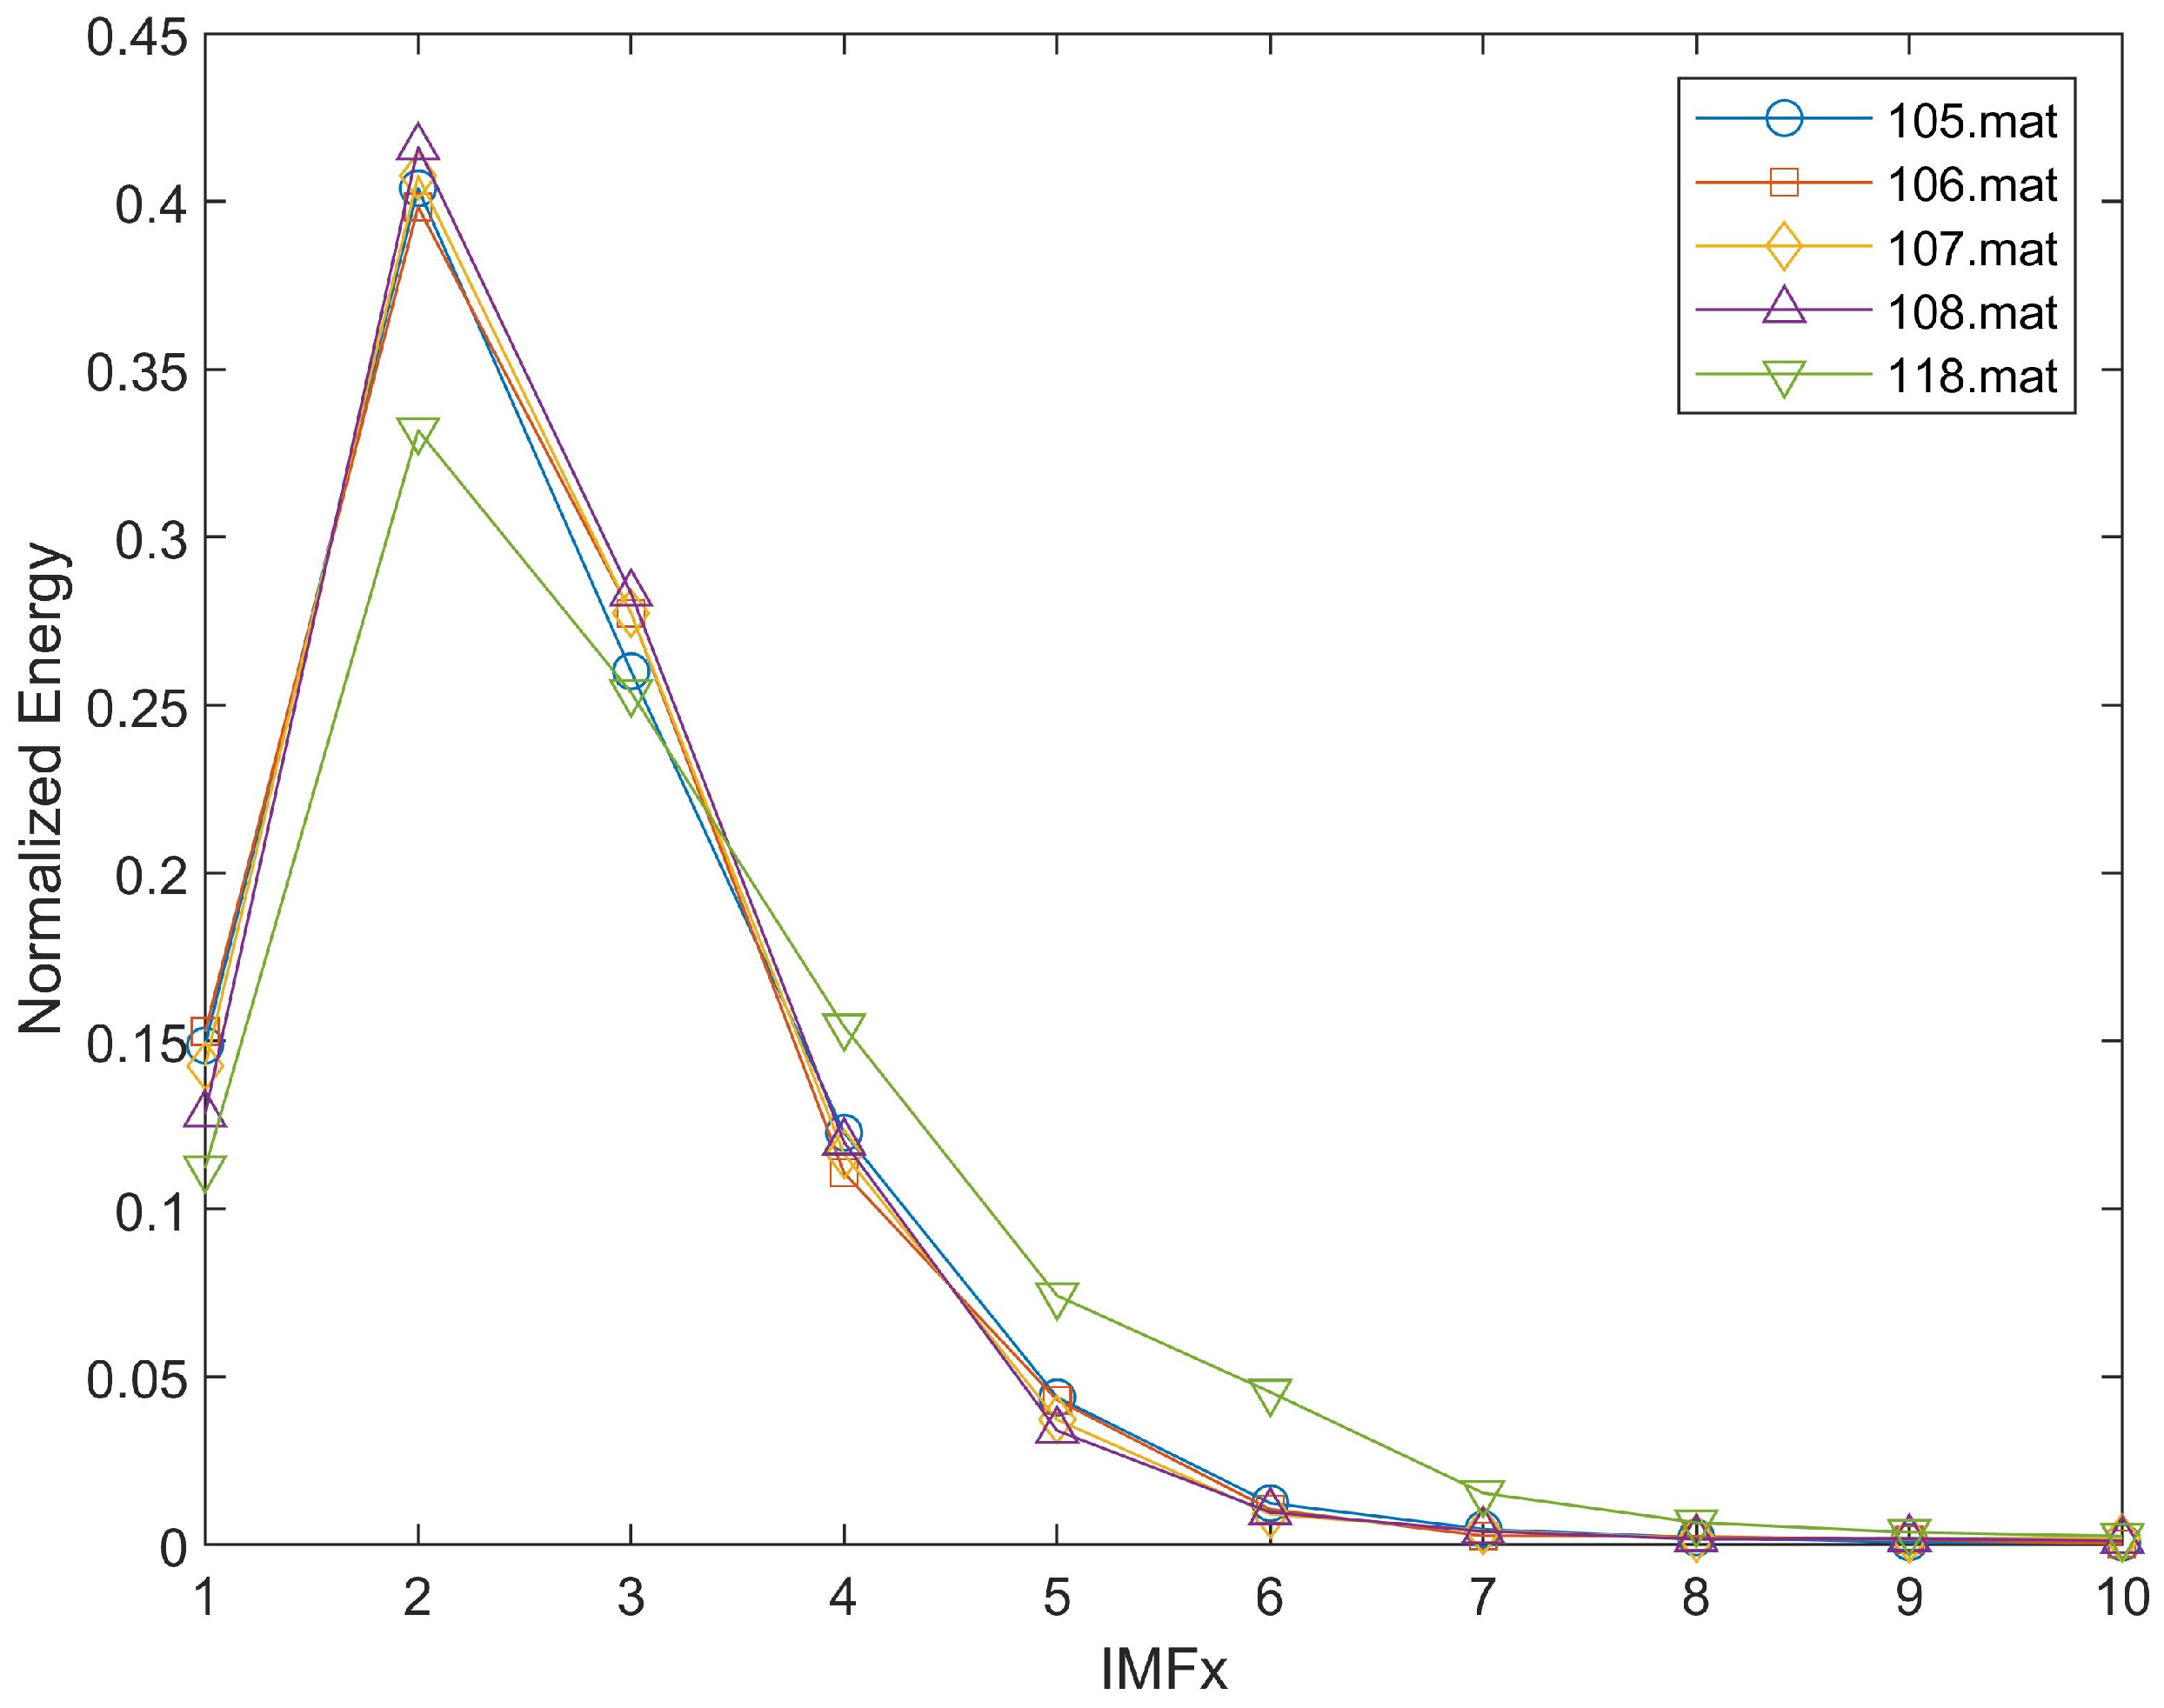
5.2.1. The Normal Condition of the Bearing Without Any Faults

During the process of decomposing IMFs using EEMD, EEMD prioritizes the decomposition of high-frequency signals. Specifically, the IMF components are decomposed sequentially from IMF1, IMF2, …, to IMFn, with the frequency of each component decreasing progressively from high to low. Consequently, the energy distribution characteristic vector represents the energy allocation across each frequency band, ordered from high frequency to low frequency within the signal. Figure 5 shows the energy characteristic vectors ED of the vibration signal waveform, the envelope signal waveform, IMF1-IMF4 after the envelope signal is decomposed by EEMD, and the normalized IMF.
Figure 6 shows the ED distribution of the vibration signal sample data at 97.mat, 98.mat, 99.mat, and 100.mat. Notably, these four datasets already contain data on all the normal bearings of CWRU. Then, we find that the energy intensity of its vibration signal gradually decreases from high frequency to low frequency, and all the normal data demonstrate intuitive monotonicity.

5.2.2. Fault Characteristics Analysis of Bearing

Under the condition of a sampling rate of 12 KHz, the effectiveness of the bearing fault diagnosis method based on the energy distribution characteristics of the EEMD eigenfunction is verified for the case of faults in the drive end. Figure 2 presents the waveforms, spectra, signal envelopes, and envelope spectra under the signals of this dataset. Furthermore, Figure 7 successively shows the vibration signal waveform, the envelope signal waveform, the IMF1 to IMF4 components obtained by the EEMD decomposition of the envelope signal, and the energy characteristic vector ED of the normalized IMF component. Figure 8 shows the ED distribution maps when the vibration signal is measured at the driving end with an acceleration vibration sensor at a sampling rate of 12 kHz, and the sample data are selected as 105.mat, 106.mat, 107.mat, 108.mat, and 118.mat. At a sampling rate of 12 kHz, the energy intensity of the vibration signal increases first and then decreases from high frequency to low frequency. When IMFx is within the range of 2.0 to 2.2, the normalized energy of the bearing drive end dataset reaches its maximum value and subsequently exhibits a monotonic trend.
Figure 9 illustrates the ED of the vibration signal measured at a 48 kHz sampling rate at the driving end using an acceleration vibration sensor. The sample datasets, including 109.mat, 110.mat, 111.mat, 112.mat, and 122.mat, are specifically selected for analysis. At a sampling rate of 48 kHz, the arrangement of ED is not monotonically decreasing. When IMFx is within the range of 2.1–2.3, the normalized energy of the bearing drive end dataset reaches its maximum value and subsequently exhibits a non-monotonic trend. Specifically, two peaks emerge when IMFx is within the range of 0–10. This distinctive feature can significantly improve the discriminability of such faults.
Figure 10 illustrates the measurement of vibration signals at the fan end using an acceleration vibration sensor with a sampling rate of 12 KHz. The selected sample data for ED analysis are stored in files 270.mat, 271.mat, 272.mat, 273.mat, and 274.mat. Similar to Figure 8 and Figure 9, for bearings at the fan end with faults as depicted in Figure 10, the energy intensity of the vibration signal does not gradually decrease from high frequency to low frequency due to the impact of vibration and shock caused by the faulty components. Instead, it exhibits relatively high values in one or more intermediate frequency bands. When IMFx is within the range of 3.0 to 4.5, the normalized energy of the fan end dataset reaches its maximum value and subsequently exhibits a monotonic trend. This is mainly because when the bearing malfunctions, the energy intensity distribution of the vibration signal changes due to the vibration impact on one or more frequency bands in the middle. Consequently, the presence of a fault in the bearing can be determined based on the ED characteristic vector. This diagnostic method is both straightforward and intuitive.
In addition, the difference in energy distribution (ED) mode between healthy bearings and faulty bearings primarily arises from the following physical mechanisms: (1) In healthy bearings, vibration energy is predominantly concentrated in the low-frequency band due to normal rolling contact and mechanical rigidity. Specifically, IMF1 corresponds to high-frequency large noise (the outermost layer of the envelope), IMF2 to medium-frequency medium noise, IMF3 to low-frequency small noise (the innermost layer of the envelope), and IMF4 to the DC component (approximately zero with a zero mean). (2) In faulty bearings, local damage such as pitting or cracks generates transient impacts during rolling, which significantly increases high-frequency energy and excites the inherent resonant frequency of the bearing structure. Moreover, the fault characteristic frequency may interact with the natural frequency, producing sidebands that further modify the ED mode.
After testing the bearing dataset from Western Reserve University, the fault identification accuracy of the proposed bearing fault diagnosis method, which is based on Hilbert envelope demodulation and the energy distribution characteristics of EEMD eigenfunctions, reached 100%. This demonstrates an outstanding performance.

5.3. Performance Comparison of Different Methods

In this subsection, we conducted a systematic comparison of the fault diagnosis performance of various methods on the CWRU dataset (for detailed results, see Table 2). The findings indicate that the WPD-CSSOA-DBN method proposed by Zhao et al. [17] achieved a fault diagnosis accuracy of 98.24%. The CNN-LSTM-GRU method introduced by Han et al. [19] further enhanced performance, achieving a diagnostic accuracy exceeding 99%. However, this approach necessitates a complex multi-parameter tuning process, which complicates practical applications. Additionally, studies by Luchuan et al. [20] and Zhang and Deng [18] demonstrated exceptional performance on the CWRU dataset. Nevertheless, CNN-based methods may face challenges such as difficulties in collecting sufficient training data and limited edge computing resources in industrial environments. In contrast, the CEEMDAN method proposed by Liu et al. [26] exhibits strong adaptability to different scenarios, with a fault diagnosis accuracy reaching 99.42%. This paper innovatively proposes an intelligent bearing fault diagnosis method that integrates Hilbert envelope demodulation with the energy distribution characteristics of Ensemble Empirical mode Decomposition (EEMD). By employing a normalization strategy based on the EEMD decomposition sequence to calculate the energy distribution characteristics of each IMF component layer by layer, this method ultimately achieved a fault diagnosis accuracy of 100%.
In addition, we showed that the computational time complexity (CTC) of EMD does not exceed n s · 41 · n · m , where n s represents the shifting time, n denotes the IMF dimension, and m corresponds to the signal length [28]. Furthermore, the CTC of EEMD is bounded by N E · n s · 41 · n · m , which scales with both the EMD CTC and the ensemble time n e .

6. Conclusions

Relying solely on the envelope spectrum of the vibration signal to determine whether a bearing has malfunctioned is not reliable. This paper first proposes an additional bearing fault diagnosis method based on the energy distribution characteristics of the EEMD eigenfunctions. Experimental results show that the proposed method is demonstrated to achieve 100% accuracy in fault identification based on the bearing failure dataset of Western Reserve University. In future research, we will focus on developing lightweight models based on the proposed method to satisfy the real-time monitoring requirements of edge devices. Additionally, by integrating multimodal sensor data, we aim to construct a more robust fault diagnosis system and further validate the generalization capability of this approach in real industrial scenarios.

Author Contributions

Conceptualization, L.L. and W.X.; methodology, L.L. and W.X.; software, Z.S.; validation, W.X.; formal analysis, Z.S. and W.X.; investigation, L.L. and W.X.; resources, L.L.; data curation, Z.S.; writing—original draft preparation, L.L.; writing—review and editing, Z.S.; visualization, L.L. All authors have read and agreed to the published version of the manuscript.

Funding

This work was supported by the Fujian Provincial Natural Science Foundation (Grant number 2023J01810), the Project of the Xiamen Science and Technology Bureau: 2024CXY0316 and 2024CXY0317.

Institutional Review Board Statement

Not applicable.

Informed Consent Statement

Not applicable.

Data Availability Statement

The data that support the findings of this study are available from the corresponding authors upon reasonable request.

Conflicts of Interest

The authors declare no conflicts of interest.

References

  1. Wang, Y.; Wang, H.; Bai, R.; Shi, Y.; Chen, X.; Xu, Q. Enhanced Rolling Bearing Fault Diagnosis Using Multimodal Deep Learning and Singular Spectrum Analysis. Appl. Sci. 2025, 15, 4828. [Google Scholar] [CrossRef]
  2. Siddique, M.F.; Saleem, F.; Umar, M.; Kim, C.H.; Kim, J.M. A Hybrid Deep Learning Approach for Bearing Fault Diagnosis Using Continuous Wavelet Transform and Attention-Enhanced Spatiotemporal Feature Extraction. Sensors 2025, 25, 2712. [Google Scholar] [CrossRef] [PubMed]
  3. Fernández-Bobadilla, H.A.; Martin, U. Modern tendencies in vehicle-based condition monitoring of the railway track. IEEE Trans. Instrum. Meas. 2023, 72, 3507344. [Google Scholar] [CrossRef]
  4. Amarouayache, I.I.E.; Saadi, M.N.; Guersi, N.; Boutasseta, N. Bearing fault diagnostics using EEMD processing and convolutional neural network methods. Int. J. Adv. Manuf. Technol. 2020, 107, 4077–4095. [Google Scholar] [CrossRef]
  5. Kiakojouri, A.; Wang, L. A Generalized Convolutional Neural Network Model Trained on Simulated Data for Fault Diagnosis in a Wide Range of Bearing Designs. Sensors 2025, 25, 2378. [Google Scholar] [CrossRef]
  6. Suhas, M.; Abisset-Chavanne, E.; Rey, P.A. Cooperative Hybrid Modelling and Dimensionality Reduction for a Failure Monitoring Application in Industrial Systems. Sensors 2025, 25, 1952. [Google Scholar] [CrossRef]
  7. Tiboni, M.; Remino, C.; Bussola, R.; Amici, C. A review on vibration-based condition monitoring of rotating machinery. Appl. Sci. 2022, 12, 972. [Google Scholar] [CrossRef]
  8. McInerny, S.A.; Dai, Y. Basic vibration signal processing for bearing fault detection. IEEE Trans. Educ. 2003, 46, 149–156. [Google Scholar] [CrossRef]
  9. Guo, Y.; Zhou, J.; Dong, Z.; She, H.; Xu, W. Research on bearing fault diagnosis based on novel MRSVD-CWT and improved CNN-LSTM. Meas. Sci. Technol. 2024, 35, 095003. [Google Scholar] [CrossRef]
  10. Mitra, S.; Koley, C. Real-time robust bearing fault detection using scattergram-driven hybrid CNN-SVM. Electr. Eng. 2024, 106, 3615–3625. [Google Scholar] [CrossRef]
  11. Yu, M.; Zhang, J.; Liu, L. Rub-impact fault identification based on EMD and stochastic resonance. Int. J. Ind. Syst. Eng. 2024, 46, 509–530. [Google Scholar] [CrossRef]
  12. Han, Z.; Jin, S.; Greaves, D.; Hann, M.; Shi, H. Study on the energy capture spectrum of a two-body hinged-raft wave energy converter. Energy 2024, 304, 132057. [Google Scholar] [CrossRef]
  13. Cao, J.; Zhang, X.; Yin, R.; Ma, Z. The feature extraction method based on quadratic wavelet packet energy entropy and t-SNE for bearing fault diagnosis. Proc. Inst. Mech. Eng. Part J. Mech. Eng. Sci. 2025, 239, 520–531. [Google Scholar] [CrossRef]
  14. Bouaissi, I.; Rezig, A.; Laib, A.; Djerdir, A.; Guellout, O.; Touati, S.; N’diaye, A. Real-time detection of bearing faults through a hybrid WTMP analysis of frequency-related states. Int. J. Dyn. Control 2024, 12, 3947–3962. [Google Scholar] [CrossRef]
  15. Santer, P.; Reinhard, J.; Schindler, A.; Graichen, K. Detection of localized bearing faults in PMSMs by means of envelope analysis and wavelet packet transform using motor speed and current signals. Mechatronics 2025, 106, 103294. [Google Scholar] [CrossRef]
  16. Xu, H.; Zhou, S. Maximum L-Kurtosis deconvolution and frequency-domain filtering algorithm for bearing fault diagnosis. Mech. Syst. Signal Process. 2025, 223, 111916. [Google Scholar] [CrossRef]
  17. Zhao, F.; Jiang, Y.; Cheng, C.; Wang, S. An improved fault diagnosis method for rolling bearings based on wavelet packet decomposition and network parameter optimization. Meas. Sci. Technol. 2023, 35, 025004. [Google Scholar] [CrossRef]
  18. Zhang, Q.; Deng, L. An intelligent fault diagnosis method of rolling bearings based on short-time Fourier transform and convolutional neural network. J. Fail. Anal. Prev. 2023, 23, 795–811. [Google Scholar] [CrossRef]
  19. Han, K.; Wang, W.; Guo, J. Research on a Bearing Fault Diagnosis Method Based on a CNN-LSTM-GRU Model. Machines 2024, 12, 927. [Google Scholar] [CrossRef]
  20. Luchuan, S.; Zhao, B.; Xutao, K. Rolling Bearing Fault Diagnosis Based on VMD-DWT and HADS-CNN-BiLSTM Hybrid Model. Machines 2025, 13, 423. [Google Scholar]
  21. Zhu, D.; Liu, Y.; Zhu, Q. Ensemble average of enhanced generalized envelope spectrum for fault detection of rolling element bearings. Int. J. Adapt. Control Signal Process. 2024, 38, 1386–1402. [Google Scholar] [CrossRef]
  22. Yang, X.; Yang, J.; Jin, Y.; Liu, Z. A New Method for Bearing Fault Diagnosis across Machines Based on Envelope Spectrum and Conditional Metric Learning. Sensors 2024, 24, 2674. [Google Scholar] [CrossRef]
  23. Li, M.; Li, X.; Liu, B.; Lv, S.; Liu, C. A rolling bearing fault signal denoising algorithm that combines a new adaptive information entropy with a new wavelet threshold function. Eng. Res. Express 2024, 6, 045536. [Google Scholar] [CrossRef]
  24. Alvarez-Ramirez, J.; Rodriguez, E.; Castro, L. Hurst exponent estimation for short-time series based on singular value decomposition entropy. Fractals 2023, 31, 2350132. [Google Scholar] [CrossRef]
  25. Ge, Q.; Wang, D.; Sun, K.; Wang, D. Fault Diagnosis of Wind Turbine Bolts based on ICEEMD-SSA-SVM Model. Recent Adv. Electr. Electron. Eng. (Former. Recent Patents Electr. Electron. Eng.) 2024, 17, 269–282. [Google Scholar] [CrossRef]
  26. Liu, L.; Wei, Y.; Song, X.; Zhang, L. Fault diagnosis of wind turbine bearings based on CEEMDAN-GWO-KELM. Energies 2023, 16, 48. [Google Scholar] [CrossRef]
  27. Wu, Z.; Huang, N.E. Ensemble empirical mode decomposition: A noise-assisted data analysis method. Adv. Adapt. Data Anal. 2009, 1, 1–41. [Google Scholar] [CrossRef]
  28. Fu, Y.; Jia, L.; Qin, Y.; Yang, J.; Fu, D. Fast EEMD based AM-correntropy matrix and its application on roller bearing fault diagnosis. Entropy 2016, 18, 242. [Google Scholar] [CrossRef]
Figure 1. Verification of envelope demodulation.
Applsci 15 06458 g001
Figure 2. Waveform, spectrum of the inner circle fault at the drive end, waveform and envelope spectrum of the envelope signal (105.mat file).
Applsci 15 06458 g002
Figure 3. Waveform, spectrum, waveform, and envelope spectrum of envelope signal when the bearing is normal without fault (97.mat file).
Applsci 15 06458 g003
Figure 4. Waveform, spectrum, waveform, and envelope spectrum of envelope signal when the bearing is normal without fault (97.mat file).
Applsci 15 06458 g004
Figure 5. Envelope signal EEMD decomposition result (97.mat).
Applsci 15 06458 g005
Figure 6. Normal, CWRU normal.
Applsci 15 06458 g006
Figure 7. Envelope signal EEMD decomposition result (105.mat).
Applsci 15 06458 g007
Figure 8. Bearing drive end under a sampling rate of 12 KHz (the monotony following the peak).
Applsci 15 06458 g008
Figure 9. Bearing drive end under a sampling rate of 48KHz (the non-monotony following the peak).
Applsci 15 06458 g009
Figure 10. Fault characteristics analysis of bearing fan end under a sampling rate of 12KHz (the monotony following the peak).
Applsci 15 06458 g010
Table 1. Synthesized key findings and arguments from the literature review.
ReferenceMethodologyAdvantageLimitation
Liu et al. (2023) [26]CEEMDAN + GWO-KELMHigher diagnosis success rate via optimized extreme learningLimited interpretability of GWO-KELM
Zhang et al. (2023) [18]STFT-CNN for direct time-frequency analysisAvoids feature extraction-induced information lossSensitive to noise and data quality
Zhao et al. (2023) [17]Wavelet packet decomposition + chaotic sparrow search-optimized DBNImproved fault diagnosis accuracy through parameter optimizationComplex implementation; risk of overfitting
Ge et al. (2024) [25]ICEEMDAN for fault feature extractionSuperior noise robustness compared to traditional EMDComputationally expensive
Li et al. (2024) [23]IMF denoising via optimized wavelet threshold + information entropyImproved diagnostic accuracy in noisy environmentsDependent on IMF quality
Han et al. (2024) [12]EMD-based envelope/energy spectrum analysisAdaptive decomposition for non-stationary signalsMode mixing issues in EMD
Han et al. (2024) [19]Hybrid CNN-LSTM-GRU modelEnhanced spatiotemporal feature extractionHigh computational complexity; requires large datasets
Bouaissi et al. (2024) [14]CWT and WPT for non-stationary signal reconstructionImproved fault frequency prominence and detection accuracyComputationally intensive for real-time applications
Lu et al. (2025) [20]VMD-DWT + HADS-CNN-BiLSTM with hybrid attentionRobust fault diagnosis under noisy conditionsComplex architecture; training inefficiency
Xu et al. (2025) [16]Maximum L-Kurtosis Deconvolution (MLKD) with iterative filteringEnhanced fault signal deconvolution via L-kurtosis maximizationRequires optimization of filter parameters
Santer et al. (2025) [15]Envelope analysis + WPT with SVM classificationEffective fault type discriminationSensitivity to wavelet basis selection; high computational load
Cao et al. (2025) [13]Hybrid QWPEE and t-SNE for feature extractionEnhanced pattern recognition for bearing faultsDependency on parameter tuning
Table 2. Comparison of fault diagnosis results of different algorithms on the CWRU dataset.
Author iMethodFault Diagnosis Rate (%)
Zhao et al. [17]WPD-CSSOA-DBN98.24
Han et al. [19]CNN-LSTM-GRU>99
Liu et al. [26]CEEMDAN99.42
Luchuan et al. [20]HADS-CNN-BiLSTM99.58
Zhang and Deng [18]STFT-CNN100
The propose methodHilbert-EEMD100
Disclaimer/Publisher’s Note: The statements, opinions and data contained in all publications are solely those of the individual author(s) and contributor(s) and not of MDPI and/or the editor(s). MDPI and/or the editor(s) disclaim responsibility for any injury to people or property resulting from any ideas, methods, instructions or products referred to in the content.

