Article

An Interpretable Machine Learning Framework for Athlete Motor Profiling Using Multi-Domain Field Assessments: A Proof-of-Concept Study

by
Bartosz Wilczyński
1,*,
Maciej Biały
2 and
Katarzyna Zorena
1
1
Department of Immunobiology and Environment Microbiology, Medical University of Gdansk, Dębinki 7, 80-211 Gdańsk, Poland
2
Department of Physiotherapy Institute of Physioterapy and Health Sciences, Academy of Physical Education, Mikołowska 72A, 40-065 Katowice, Poland
*
Author to whom correspondence should be addressed.
Appl. Sci. 2025, 15(12), 6436; https://doi.org/10.3390/app15126436 (registering DOI)
Submission received: 14 May 2025 / Revised: 5 June 2025 / Accepted: 6 June 2025 / Published: 7 June 2025

Abstract

:

Featured Application

This profiling system can be implemented by coaches, physiotherapists, or sports scientists in youth training academies, schools, or rehabilitation centers to screen athletes using standard field-based tests (FMS, Y-Balance, hand-held dynamometry). The open-source Athlete Functional Report Generator facilitates the uploading of a simple Excel sheet to instantly receive a radar-chart profile, deficit flags, and training suggestions for every youth athlete tested with these tools.

Abstract

Early detection of modifiable motor deficits is essential for safe, long-term athletic development, yet most field screens provide only binary risk scores. We therefore designed a practical and interpretable profiling system that classifies youth athletes into one of four functional categories—Functionally Weak, Strength-Deficient, Stability-Deficient, or No Clear Dysfunction—using three common assessments: Functional Movement Screen, hand-held dynamometry, and Y-Balance Test. A total of 46 youth athletes aged 11–16 years participated in the study, including 37 male soccer players (13.3 ± 1.6 y) in the development cohort and 9 handball players (5 male, 4 female; 12.8 ± 0.7 y) in the external validation group. Expert rules based on FMS quartiles and ≤−0.5 SD Z-scores for strength or balance generated the reference labels. The random forest model achieved 81% cross-validated accuracy (with balanced performance across classes) and 89% accuracy on the external handball group, exceeding the performance of the decision tree model. SHAP analysis confirmed that model predictions were driven by domain relevant variables rather than demographics. An accompanying web-based application automatically generates personalized reports, visualizations, and targeted training recommendations, making the system directly usable by coaches and clinicians. Rather than merely predicting injury, this field-ready framework delivers actionable, profile-based guidance to support informed decision making in athlete development. Further validation in larger, sport-diverse cohorts is needed to assess its generalizability and long-term value in practice.

1. Introduction

Unaddressed functional deficits in youth athletes may elevate injury risk and hinder performance development [1,2,3]. Long-term development programs therefore prioritize movement quality, balance, and strength [4,5,6,7]. Early detection of motor skills deficits in youth players is therefore of both preventive and performance importance, guiding individualized training to foster safer long-term athletic development [8]. Despite this, screening practices are often unstructured or rely on isolated tests that fail to capture the multidimensional nature of motor performance [1].
Common field tests include the Functional Movement Screen (FMS), which assess movement quality, and the Y-Balance Test (YBT), which quantifies dynamic balance [6,9]. Both have been used to flag “at-risk” athletes [1,10,11]. Hand-held dynamometry is also gaining support for strength screening [12,13]. Yet, evidence linking a low FMS score (≤14) to future injury is inconsistent [1,14]. A meta-analysis by Trinidad-Fernández et al. found no significant association between low FMS and injury risk in roughly half of the studied cohorts [14] Similarly, the proposed YBT cut-off points have shown limited predictive value for injury in meta-analyses [11]. This raises concern that using single cut-off values may oversimplify an athlete’s complex movement profile. More critically, binary cut-offs mask the complexity of athletes’ movement patterns—an individual may show a strength deficit but still score “normal” overall, leading to missed opportunities for targeted intervention [15].
Integrative systems such as Move2Perform attempt to combine FMS, YBT, injury history, and demographics into a single risk score [2,16], but are often proprietary and yield non-specific outputs with broad labels (e.g., “moderate risk”). Such labels do not indicate which domain of motor skills should be trained. For practical decision making, coaches and clinicians need tools that are both comprehensive and interpretable—capable of efficiently identifying which functional domains to target [17].
Machine learning (ML) offers promise, but most models remain opaque or impractical for daily use in real-world settings [18,19]. High-complexity ML can identify patterns (predict injury risk, improve performance, and capture talents) [20,21,22,23] but lacks interpretability and clinical relevance [18]. In youth sport, practical, transparent models are needed.
Our objectives were two-fold: (1) to develop an interpretable machine learning model that classifies youth athletes into one of four modifiable functional profiles based on common field tests (FMS, YBT, and hand-held dynamometry) and (2) to create an open-access digital tool that generates athlete-specific reports with visual explanations and targeted training suggestions. This proof-of-concept system aims to bridge the gap between complex analytics and everyday use in sport development settings.

2. Materials and Methods

2.1. Participants and Study Settings

This study involved a total of 46 youth athletes, including 37 male soccer players and 9 handball players (5 male, 4 female). The mean age of the soccer cohort was 13.3 ± 1.6 years; the handball cohort had a mean age of 12.8 ± 0.7 years. All participants were actively training in regional academy teams and engaged in regular sport-specific training for at least six months prior to testing.
Participants were eligible if they met the following inclusion criteria: (1) aged 8–17 years, (2) no current injury or musculoskeletal pain, (3) regular participation in organized sport, and (4) written informed consent obtained from a parent or legal guardian. Exclusion criteria were (1) pain or symptoms during the testing period, (2) any surgery to the lower extremity or trunk in the preceding six months, or (3) lack of medical clearance for sport participation. Demographic and anthropometric details for all participants are presented in Table S1.
This cross-sectional study was conducted as part of the Project Healthy Sport initiative (ClinicalTrials.gov ID: NCT06325228) and was approved by the Independent Bioethics Committee (NKBBN/241/2023). All testing was conducted in accordance with the Declaration of Helsinki. Written informed consent was obtained from all participants and their legal guardians.

2.2. Experimental Design and Study Period

The study included two cohorts: 37 male youth soccer players (primary model development group) and 9 youth handball players (external validation group). Players were tested between May and December 2024. Testing was conducted during pre- and mid-season periods to minimize fatigue and competitive load effects. The study was exploratory; no formal a priori sample size calculation was conducted. Instead, the sample size was determined based on feasibility and the goal of estimating effect sizes to inform future trials [24]. Effect size statistics (η2, Cohen’s d) are reported where appropriate.

2.3. Testing Procedures

All athletes underwent a standardized test battery assessing lower-limb strength, dynamic balance, and fundamental movement quality. Tests were administered by certified strength and conditioning specialists and licensed physiotherapists experienced in youth athletic assessment. All assessors completed a joint training session before data collection to harmonize protocols, including detailed instruction on test setup, execution, and scoring criteria. Athletes were familiarized with each test prior to measurement, and all assessments followed a fixed sequence with standardized instructions based on previous studies. Athletes missing single or entire test domains were excluded from the classification model.

2.3.1. Lower-Body Isometric Strength

Isometric peak force was measured for four movements on each leg: hip abduction (HAbd), knee extension (KE), knee flexion (KF), and ankle plantarflexion (AP). We used a calibrated hand-held dynamometer (Lafayette Instrument Company, Lafayette, IN, USA). The assessment procedures and positions were adapted from the methodology described by Mentiplay et al. [25], which emphasizes standardized participant positioning, dynamometer placement, tester bracing, and the use of verbal encouragement and consistent instructions to minimize measurement error. The protocol has demonstrated good to excellent intra-rater, inter-rater, and inter-device reliability (coefficients ≥ 0.70) [25]. All measurements were conducted by the same experienced rater. Raw isometric peak forces (in kg) were normalized to body weight (%BW) for comparability. This normalization assured that the measured values represented muscle strength independent of body mass [26]. Studies have shown that the procedure (using the Lafayette HHD device) has shown variable validity across contexts, with ICCs ranging from poor to excellent, depending on muscle group and protocol [25,26].

2.3.2. Dynamic Balance

Dynamic balance was assessed with the Lower Quarter YBT kit (Functional Movement Systems, Lynchburg, VA, USA) in three directions (anterior, posteromedial, and posterolateral) for both limbs. The procedure was performed according to previously described and standardized protocols [27,28,29]. To standardize the results, lower limb length was measured in the supine position from the anterior superior iliac spine to the medial malleolus maintaining pelvic alignment. YBT reach distances were then normalized to limb length and reported as a percentage (%LL) using the formula (reach distance/limb length) × 1. Previous research has confirmed that the YBT demonstrates strong reliability, with ICCs between 0.75 and 0.91 across repeated trials [30,31]. The standard error of measurement (SEM) ranged from 1.77% to 5.81%. Depending on the participant’s age group and the direction of reach, the minimal detectable change (MDC) necessary to identify a clinically meaningful difference across sessions ranged from 4.90% to 16.10% [30].

2.3.3. Functional Movement Screen

Trained assessors conducted and scored the FMS using standardized procedures and official equipment provided by Functional Movement Systems (Lynchburg, VA, USA). Players performed 7 tasks (deep squat, hurdle step, in-line lunge, shoulder mobility, active straight leg raise, trunk stability push-up, and rotary stability) scored on a 0–3 scale per task, yielding a composite FMS total score (0–21). This score evaluates fundamental movement quality (mobility, stability, and symmetry). As part of the FMS protocol, clearing tests for pain—such as active shoulder impingement and trunk flexion/extension assessments—were performed [32]. We also categorized FMS performance into an FMS category based on a within-sample percentile: “Low” for scores in the bottom 25% of the cohort, “Medium” for the middle 50%, and “High” for the top 25%. This percentile approach was chosen over the traditional ≤ 14 cut-off because (i) published injury-risk thresholds show inconsistent utility in youth cohorts [14,17], (ii) percentile binning adapts automatically to each squad’s normative level, providing coaches with a context-relevant reference, and (iii) balanced categories are required for unbiased model training. The FMS has shown moderate to good inter-rater and intra-rater reliability, with intraclass correlation coefficients (ICCs) reported of between 0.72 and 0.93 [33].

2.4. Data Preprocessing Feature Engineering

All raw data were reviewed and processed by the principal investigator (B.W.). To support classification, two composite metrics were computed: mean strength (average of eight bilateral strength tests: HAbd, KE, KF, and AP for both limbs) and mean YBT (average of six reach distances: ANT, PM, PL for both limbs). These were standardized using within-sample Z-scores for the soccer group and applied identically to the handball group to ensure consistent thresholds (≥0.5 SD below average). For machine learning, each athlete’s input vector included 8 normalized strength scores, 6 normalized YBT scores, a numerically coded FMS category (Low = 0, Medium = 1, High = 2), BMI, and age.

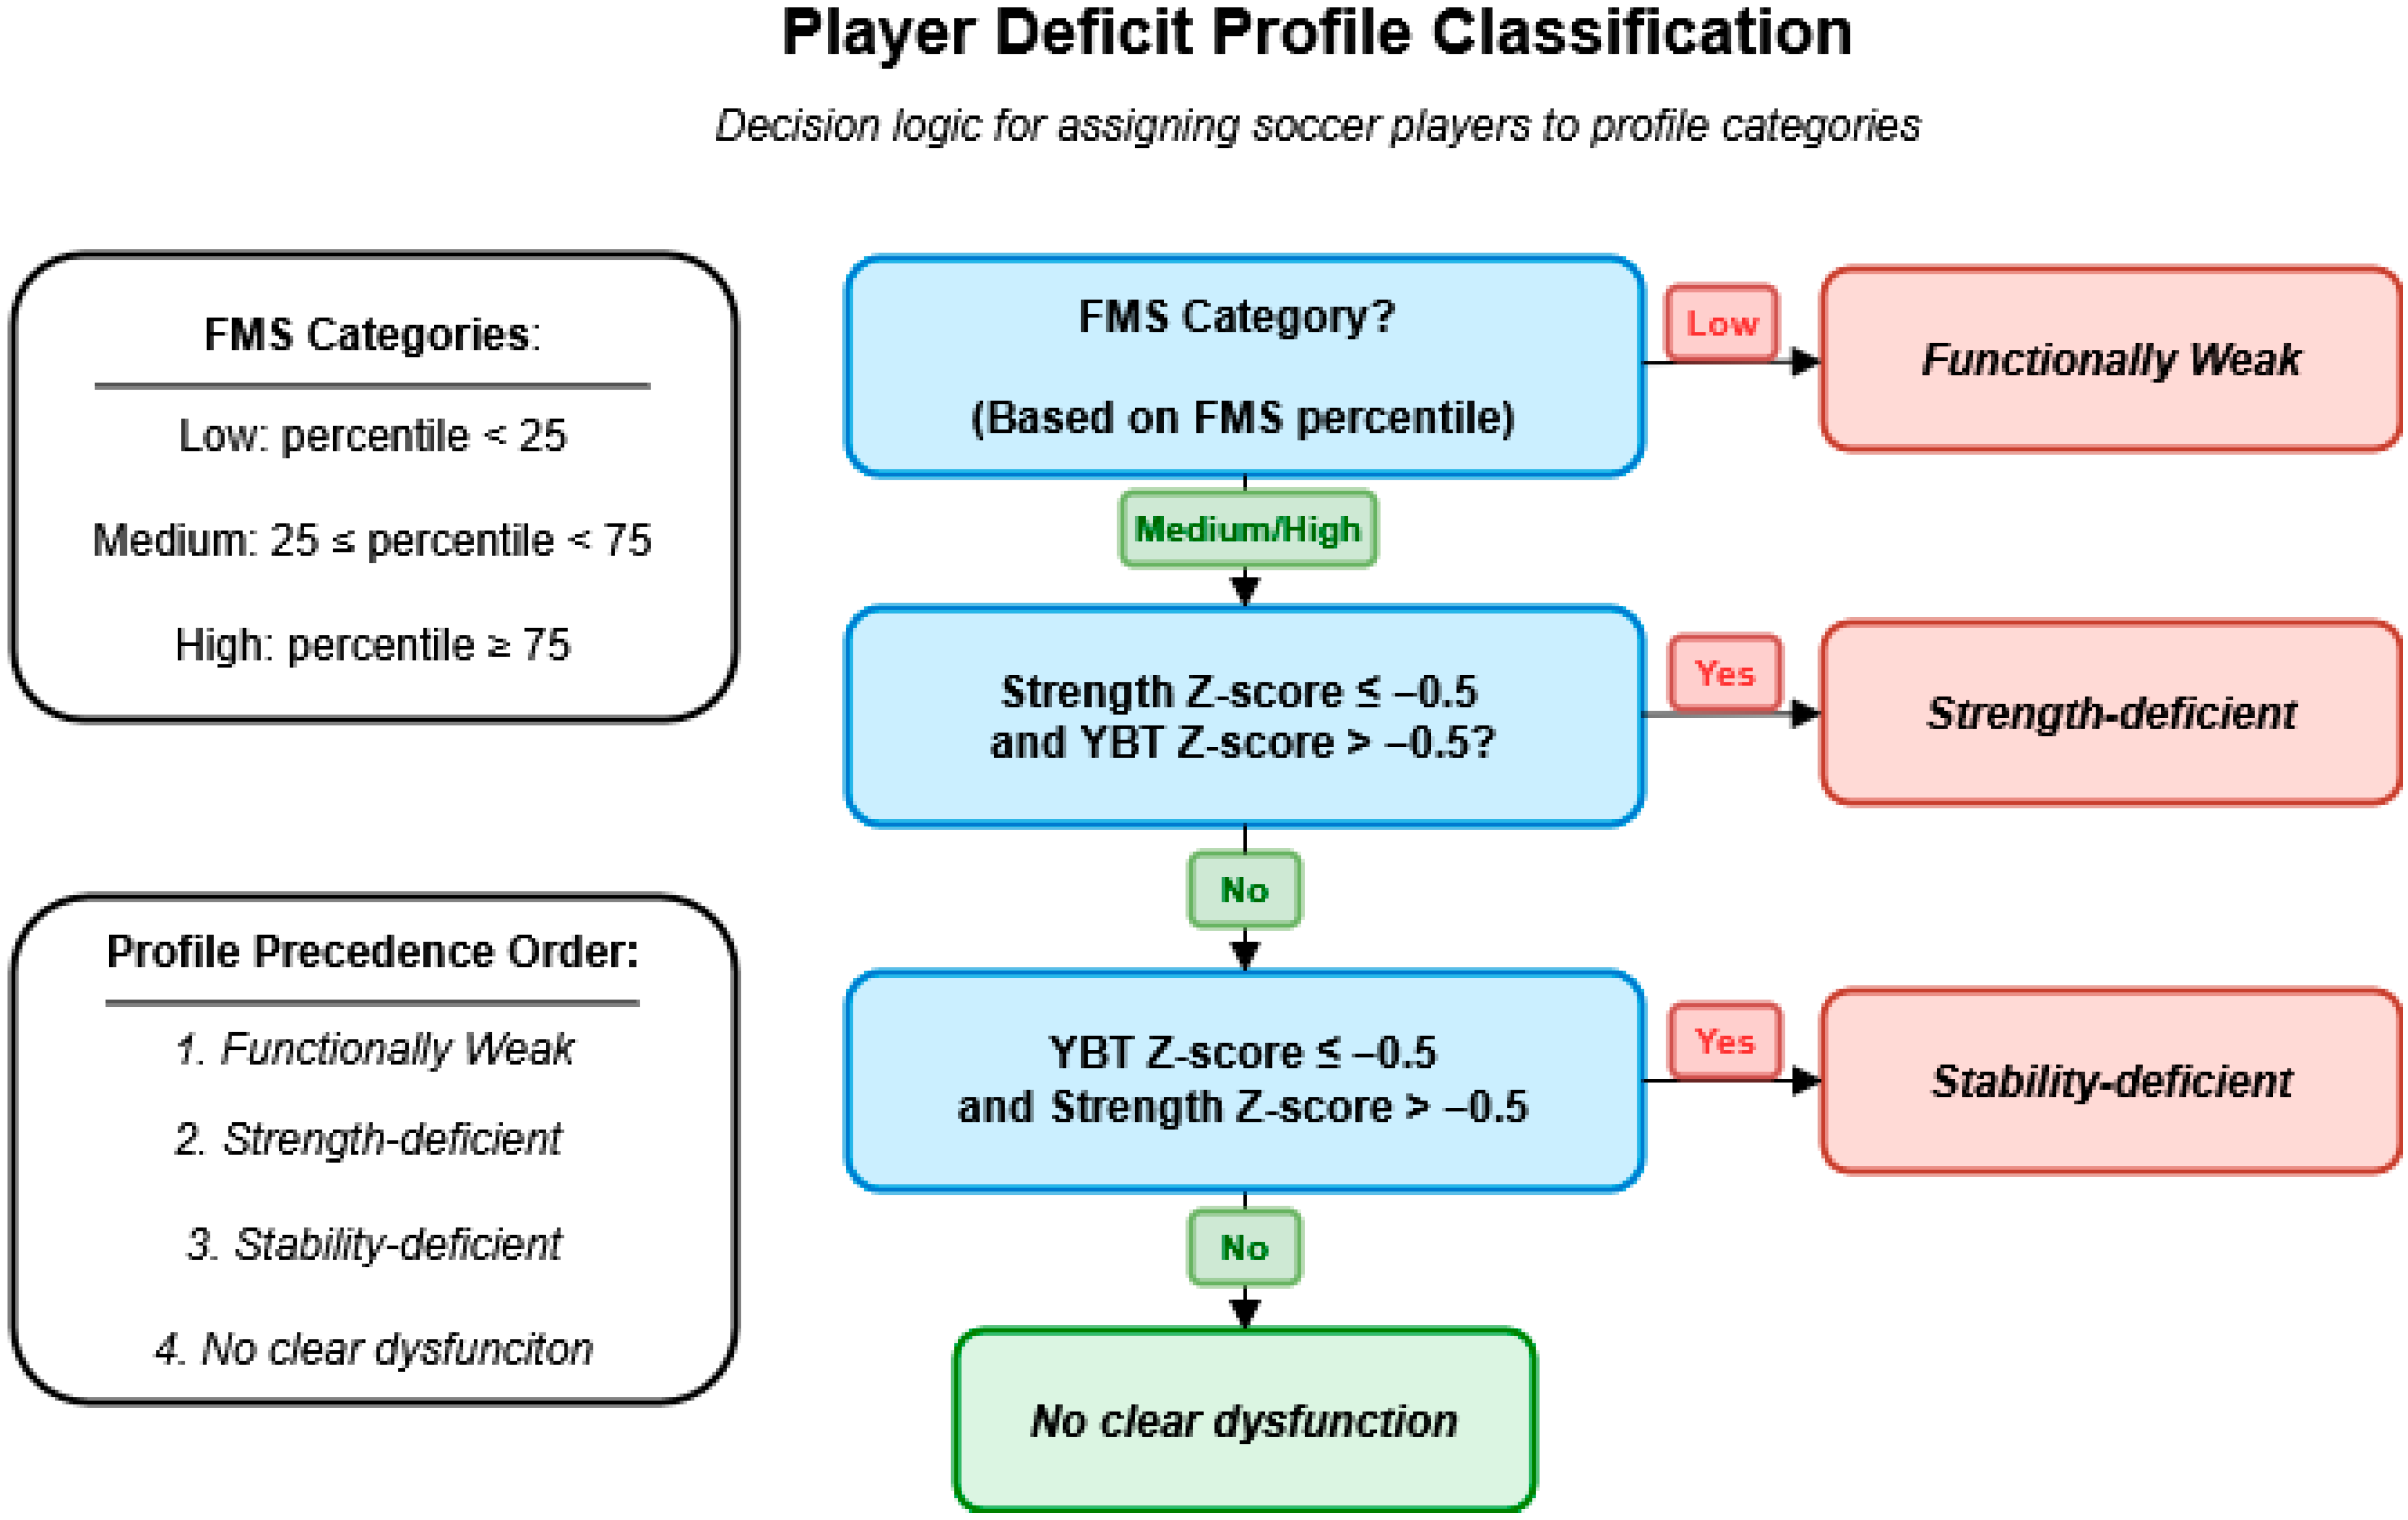
2.5. Expert Rule-Based Classification

Based on the test results, we defined an expert-driven scheme to categorize each athlete’s overall functional movement profile. The logic was developed a priori through structured expert consultation. Specifically, two strength and conditioning specialists and one sports physiotherapist with experience in testing and working with youth athletes were consulted in two rounds of meetings. In the first round, experts reviewed test definitions, thresholds, and operational criteria based on normative data and current evidence [1,11,14]. In the second round, the classification rules were finalized through consensus using example athlete profiles.
To operationalize strength and balance cut-offs, we applied a Z-score threshold of −0.5 (i.e., one-half the standard deviation below the sample mean) to flag moderate underperformance. This threshold was chosen based on expert agreement as a simple, interpretable, and team-friendly benchmark rather than an empirically optimized cut-off. It reflects a practical compromise—identifying athletes performing clearly below group norms while minimizing false positives.
In the next step, we implemented a set of hierarchical rules applied to the soccer data (later also to handball for validation). Each player was assigned to one of four mutually exclusive profile categories in the order of precedence presented in Figure 1.
This rule hierarchy was intentionally designed to reflect the single most-limiting functional domain in each athlete—mirroring real-world practice where a primary deficit typically guides intervention. Although athletes may present with multiple suboptimal areas, assigning one dominant profile simplifies interpretation and prioritizes individualized training or rehabilitation. We selected the −0.5 SD cut-off a priori to capture mild-to-moderate underperformance without overflagging typical variability. Exploratory tests with stricter (−1.0 SD) and more lenient (−0.25 SD) thresholds showed that the −0.5 SD value preserved interpretability while avoiding excessive reclassification.

2.6. Deficit Flagging System

A parallel flagging system used lower terciles for FMS, strength, and YBT. Flags were summed into a 0–3 Total Flag Score, Green (0–1), Yellow (2), Red (3), that was used for practical communication not model input.

2.7. Machine Learning Model Development (Training and Evaluation)

To validate the expert-defined profiles, we trained two supervised classifiers—decision tree (DT) and random forest (RF)—to predict the four functional profile categories from the test data. Sixteen input features were used: 8 normalized strength values (HAbd, KE, KF, AP for both limbs), 6 normalized YBT scores (ANT, PM, PL for both limbs), encoded FMS category (Low = 0, Medium = 1, High = 2), BMI, and age. Although tree-based models are scale-invariant, all features were z-standardized (based on the soccer cohort) to maintain interpretability and support external application. The target variable was the categorical deficit profile.
Given the small sample size, model complexity was constrained to limit over-fitting. For DT, the hyperparameters included max depth (3–6) and minimum samples per split (2, 5, 10). For RF, grid search varied tree count (50, 100, 200), max depth (None, 10, 20), and minimum split (2, 5). Five-fold stratified cross-validation (CV) was used with macro F1-score as the selection criterion. The optimal DT had depth = 3; RF performed best with 100 trees, no depth cap, and minimum split = 5. Final models were retrained on the full soccer dataset.
To limit bias from the unequal distribution of the four deficit-profile labels, both DT and RF were trained with inverse-frequency class weights (balanced”), and performance was judged with macro-F1 and balanced accuracy—metrics that are insensitive to prevalence differences.
We restricted modeling to decision tree and random forest classifiers for two practical reasons. (i) Interpretability—both produce human-readable rules and can be explained with SHAP, aligning with our goal of a coach-friendly tool. (ii) Small-sample robustness—higher-capacity models such as XGBoost, LightGBM, or non-linear SVMs typically over-fit when n  <  50.

2.8. Cross-Validation Performance

Repeated 5-fold CV was conducted on the soccer group. Performance metrics included accuracy, balanced accuracy, macro F1-score, Cohen’s kappa (κ), and Matthews correlation coefficient (MCC). Mean values across folds were calculated. Confusion matrices from each fold were aggregated to evaluate misclassification patterns. For the RF model, 95% confidence intervals for key metrics were estimated using 1000 bootstrap resamples.

2.9. Model Interpretability (SHAP Analysis)

Model transparency was assessed using SHAP (SHapley Additive exPlanations), which quantified the contribution of each input feature to the classification decision. Global and class-specific SHAP values were visualized to confirm alignment between expert-defined logic and model behavior.

2.10. External Validation

To assess generalizability, the final models (trained on soccer players) were applied to the handball cohort. Input features were z-standardized using the soccer-derived means and SDs. Model predictions were compared to expert rule-based classifications, which served as the reference. Accuracy, macro F1-score, κ, and MCC were calculated. This tested model robustness to sport-specific bias. The trained models (from the soccer data) were applied to the handball data to predict their profiles, which were then compared to expert rule classifications for those players.

2.11. Software Tool: Athlete Functional Report Generator

Our side goal was to develop a plug-and-play functional profiling system for use in performance monitoring and training decision making. To enhance clinical usability, an automated report generator was developed, producing individual athlete profiles with visual summaries, classification output, and decision-support recommendations. We created a custom application titled Athlete Functional Report Generator. Transparency in AI-driven tools is increasingly highlighted in the sports medicine literature as essential for ethical and effective implementation [34]. Thus, we made the code for the program available for modification for practical and scientific needs. The tool is freely available through an open-access GitHub repository (https://github.com/BartWil/athlete_report_generator; accessed on 5 June 2025). We publicly hosted the web application in the Streamlit framework for rapid deployment (https://athletereportgenerator.streamlit.app/; version 1.0, accessed on 5 June 2025). The key software, data, and measurement tools used in this study are summarized in Table A1.
The goal was to offer a plug-and-play interface that allows practitioners to apply the classification model in clinical or sport environments without programming expertise.
The app supports direct upload of Excel spreadsheets and includes an internal column-mapping system to accommodate variability in data file structures. Once uploaded, athlete data is automatically standardized (Z-scores) for strength, stability, BMI, and chronological age. FMS scores are converted to percentiles within the dataset and classified into three interpretive categories (low, medium, high). Based on predefined expert rules, each athlete is classified into one of four mutually exclusive functional profiles. Classification is based on a hierarchical decision logic involving FMS category and Z-scores for mean strength and YBT performance. Additionally, each athlete is assigned a flag category—Red, Yellow, or Green—based on whether their performance in strength, stability, or FMS falls below the lowest tertile of the group distribution.
The app also includes an automated asymmetry detection module that identifies bilateral discrepancies greater than 15% in strength and stability measurements. Functional radar charts visualize Z-score differences across limbs and domains, supporting rapid clinical interpretation. Finally, the application produces individualized HTML reports containing athlete profiles, performance metrics, flag status, asymmetry analysis, and tailored training recommendations based on the identified deficits. For each athlete, the side-to-side asymmetry was computed for each strength and YBT component as the percent difference between limbs: Asymmetry (%) = |L − R|/max(L,R) × 10. We examined four strength asymmetries (hip abduction, knee extension, knee flexion, ankle plantarflexion) and three YBT asymmetries (one per reach direction). A clinical asymmetry threshold of 15% was set a priori (a commonly used cut-off for meaningful imbalance); any athlete with ≥1 measure exceeding 15% was flagged as having significant asymmetry. We created a binary indicator “Asym Flag” (1 = any asymmetry > 15%, 0 = no asymmetry > 15%). We also recorded each athlete’s maximum asymmetry value “Max Asym” to identify extreme imbalances (>30%). This tool was designed specifically to align with the real-world workflows of coaches, physiotherapists, and sport scientists and to support functional monitoring in team settings, rehabilitation programs, and return-to-play decision making.

2.12. Quantification and Statistical Analysis

All statistical analyses were performed using non-parametric methods appropriate for the small sample size and non-normal data distributions. The sample size was determined based on feasibility for an exploratory study; no a priori power analysis was conducted. Effect sizes were calculated to support interpretation and inform future sample size estimation. Continuous outcome variables (strength, YBT, FMS scores) were compared across the four expert-defined functional profiles (n = 37 soccer athletes) using Kruskal–Wallis one-way ANOVA on ranks. When the global test indicated statistical significance (p < 0.05), post hoc pairwise comparisons were performed using Dunn’s test with Bonferroni adjustment for multiple comparisons. Effect sizes for Kruskal–Wallis tests were reported as eta-squared (η2). Median and standard deviation (SD) or interquartile ranges were used to describe distributions, depending on skew. Two-group comparisons between the soccer and handball cohorts (n = 37 vs. n = 9) were conducted using Mann–Whitney U tests (two-sided) for continuous variables and ordinal FMS scores. Differences in categorical distributions (profile frequencies, flag categories) were tested using chi-square (χ2) tests of independence. Confidence intervals (95%) and Cliff’s delta were reported for group effect sizes where applicable. Model performance metrics—including accuracy, balanced accuracy, macro-averaged F1-score, Cohen’s kappa (κ), and Matthews correlation coefficient (MCC)—were computed using 5-fold stratified cross-validation. To assess the stability of the random forest (RF) model, bootstrapping with 1000 iterations was used to generate 95% confidence intervals for performance metrics. Confusion matrices were aggregated across folds to assess misclassification patterns. All modeling and statistical analyses were conducted using Python 3.10 with the following packages: scikit-learn (v1.2), scipy (v1.10), numpy (v1.24), pandas (v1.5), shap (v0.42), and matplotlib (v3.7). Significance was defined as α = 0.05 for all tests.

3. Results

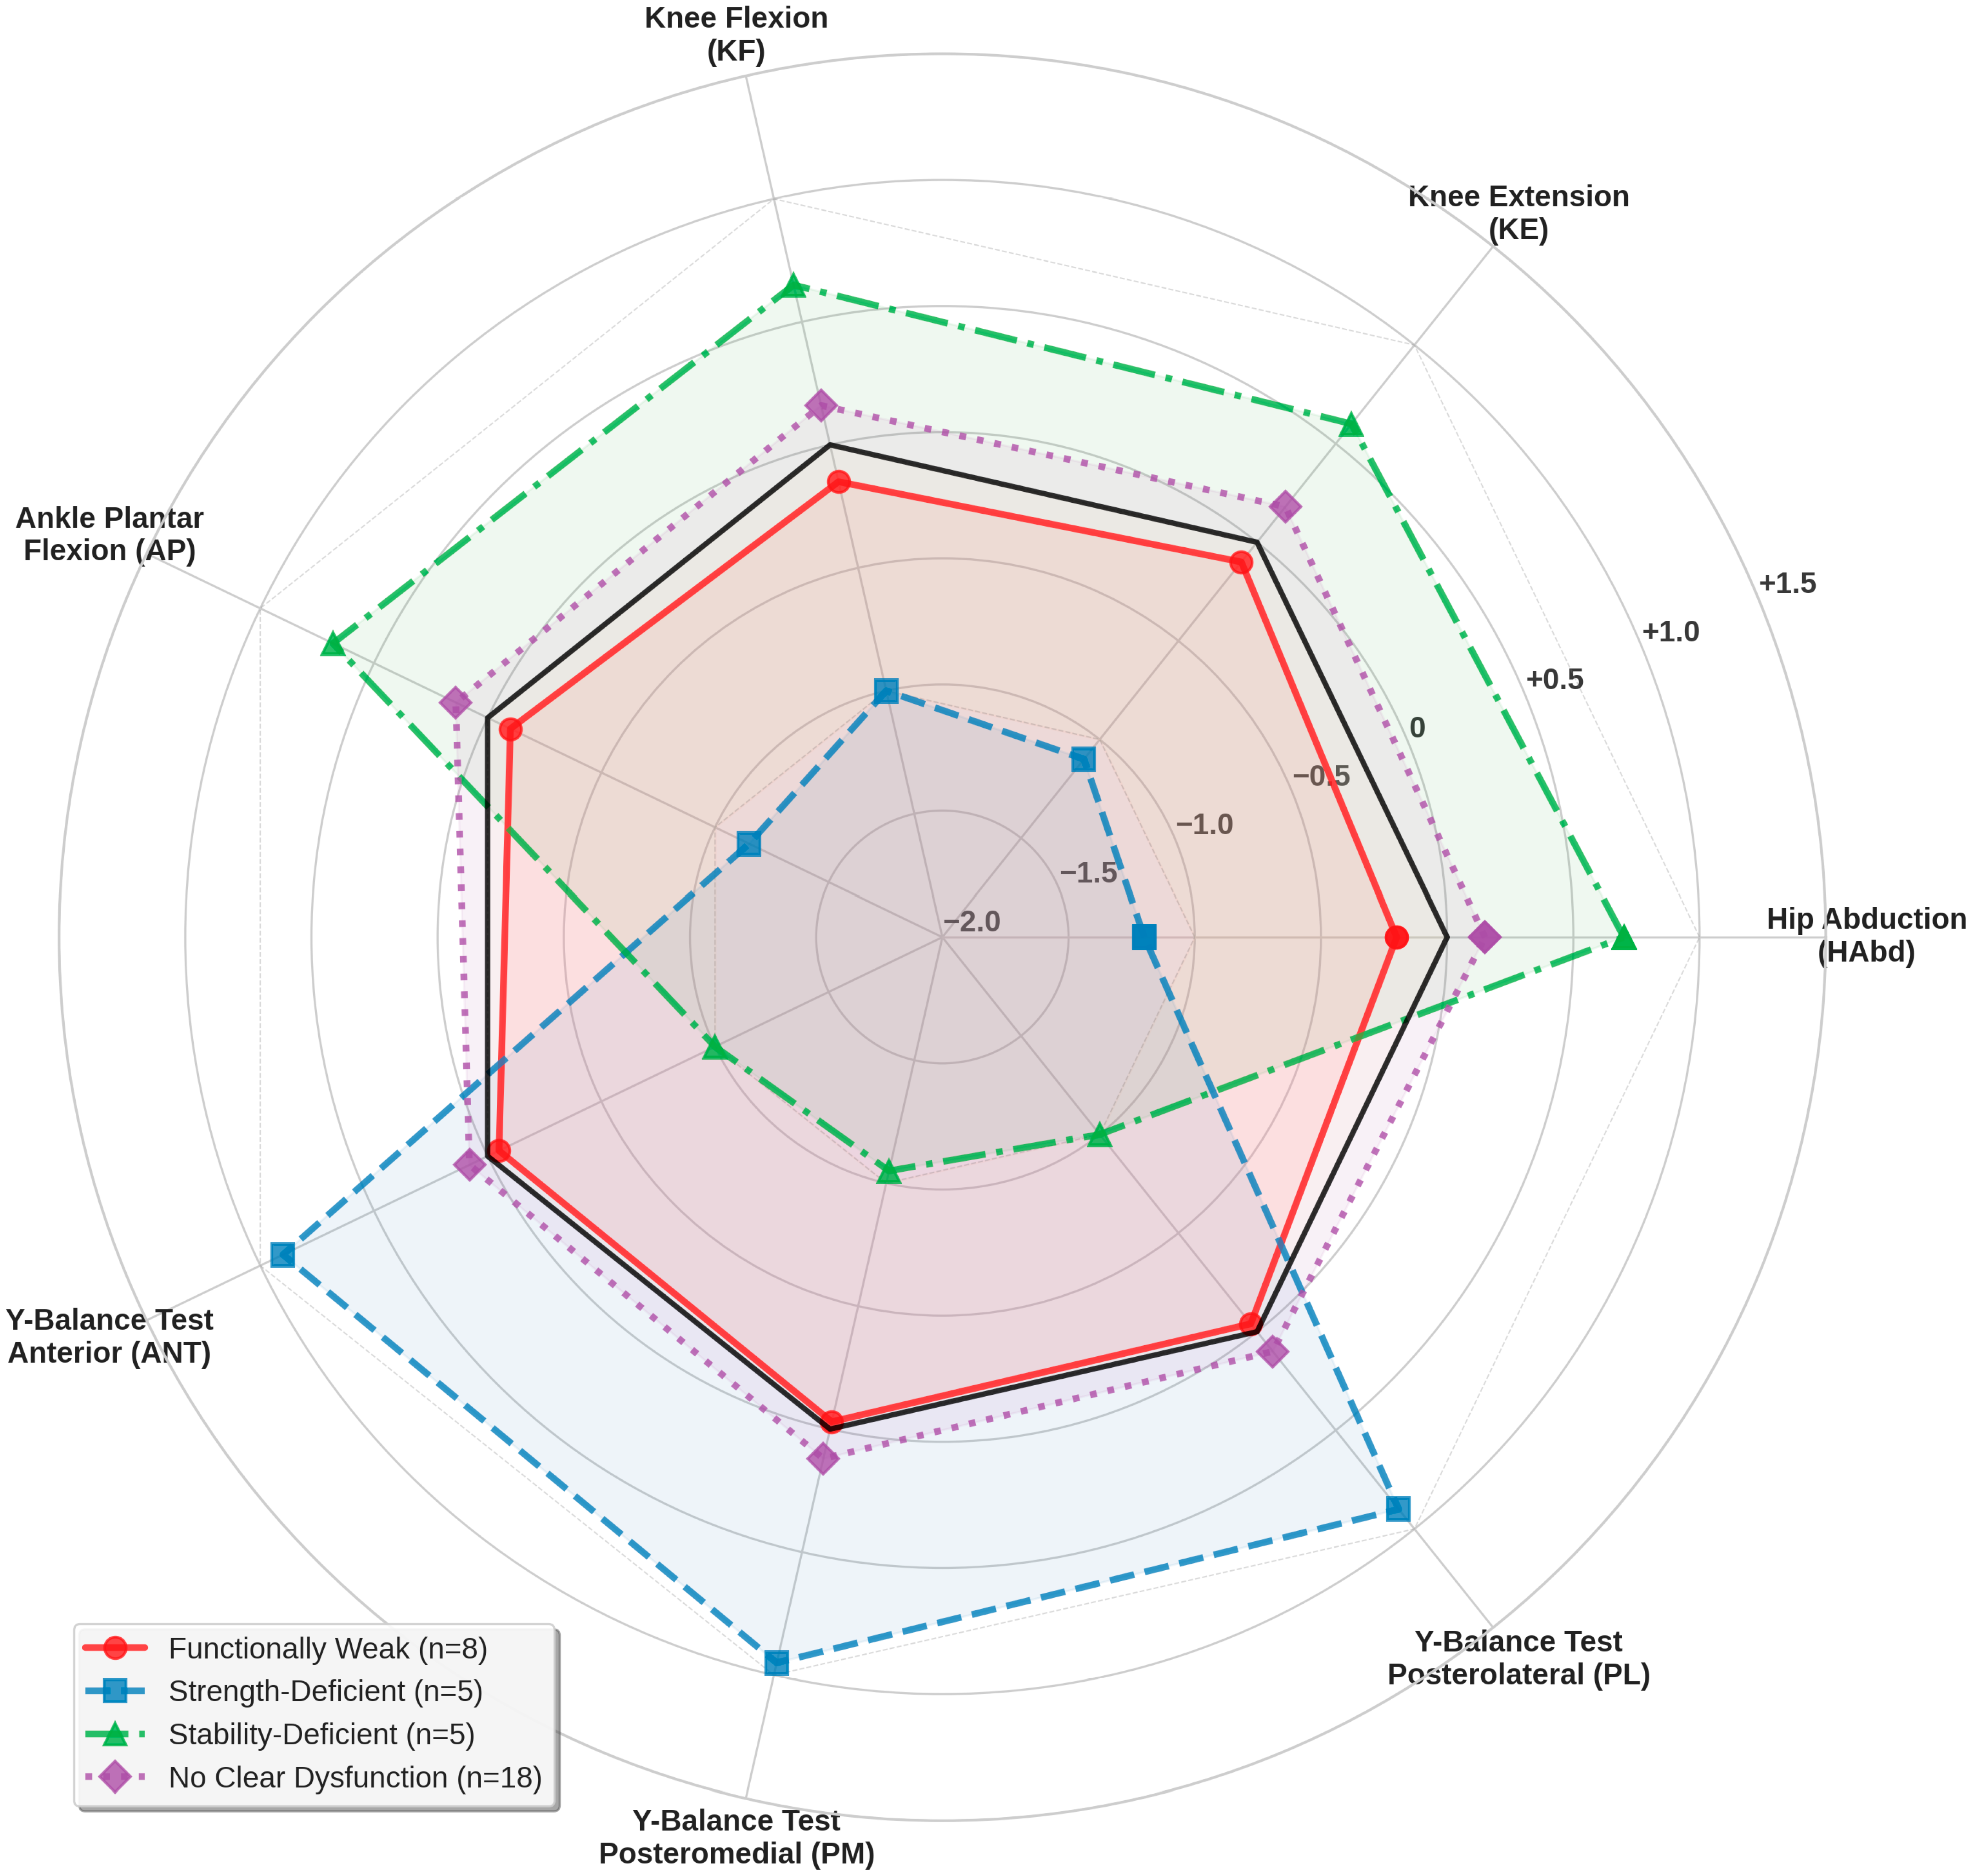
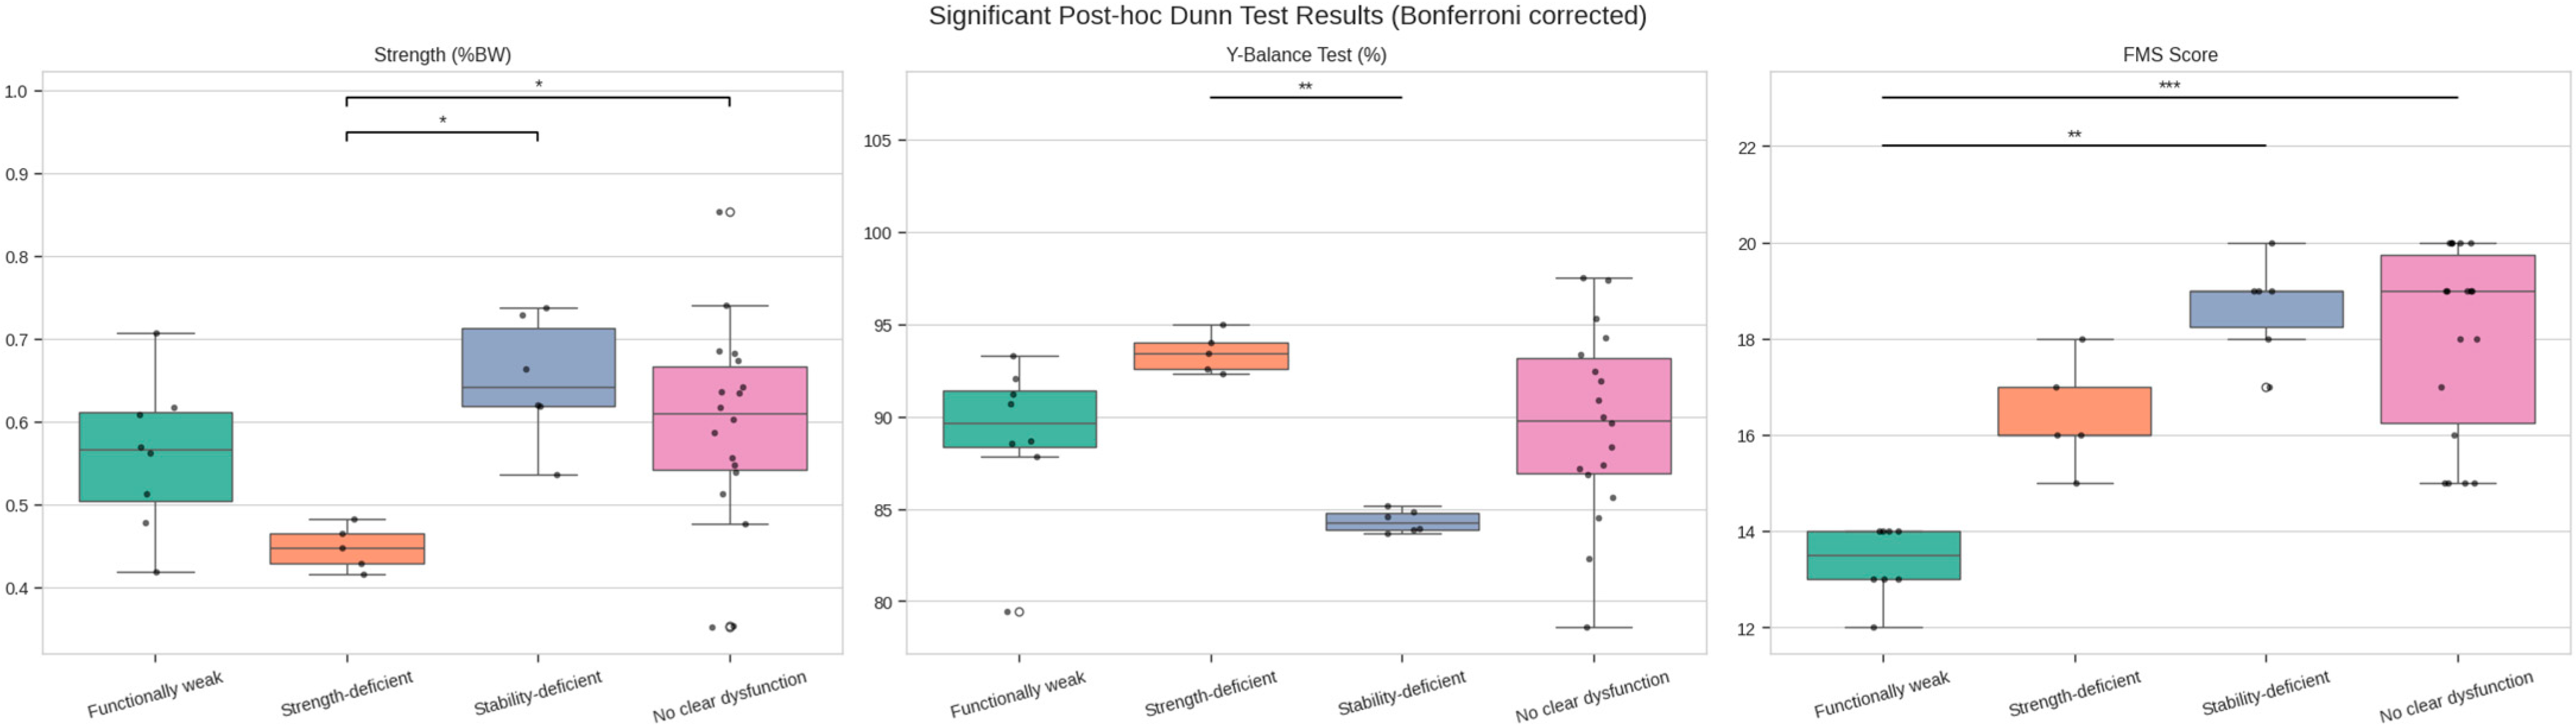
3.1. Functional Profile Distribution in Youth Soccer Players

Thirty-seven male youth soccer players (mean age 13.3 ± 1.6 years; full demographics in Table S1) were classified into four functional profiles using the expert rule-based system (Figure 1; Table 1); 8 players (21.6%) were categorized as Functionally Weak, 5 (13.5%) as Strength-Deficient, 6 (16.2%) as Stability-Deficient, and 18 (48.6%) as having No Clear Dysfunction. All Functionally Weak players had FMS scores ≤ 14, whereas the other groups had higher scores (median = 17, range = 15–21). The Strength-Deficient group exhibited the lowest mean normalized strength values (0.45 ± 0.03% BW), and the Stability-Deficient group showed the lowest YBT performance (84.34 ± 0.61). Athletes classified as No Clear Dysfunction had superior results across most metrics, with strength (0.59 ± 0.12), YBT (89.63 ± 5.11), and FMS scores (18.00 ± 1.97) exceeding those of all deficit groups. Flag categorization revealed 1 Red flag case (2.7%, 3 deficits), 8 Yellow (21.6%, 2 deficits), and 28 Green (75.7%, 0–1 deficit). A comparative radar plot of all functional profile groups is presented in Figure 2.
Statistical comparisons confirmed that the profiles differed significantly in the domain defining variables. Kruskal–Wallis tests were significant for FMS (H = 21.4, η2 = 0.56, p < 0.0001), strength (H = 10.8, η2 = 0.24, p = 0.012), and YBT (H = 12.9, η2 = 0.30 p = 0.0049) across the four profiles. Bonferroni-adjusted post hoc Dunn tests (Figure 3) revealed that Functionally Weak players had significantly lower FMS scores than some other groups (p < 0.0001 vs. no-dysfunction; p = 0.001 vs. Stability-Deficient) but no vs. the Strength-Deficient group (p = 0.345). Strength-Deficient players had lower strength values than no-dysfunction players (p = 0.044) and Stability-Deficient players (p = 0.011) but did not differ in YBT scores from them (p = 0.481). Conversely, the Stability-Deficient group did not have a significantly lower YBT than the no-dysfunction (p = 0.065) and Functionally Weak (p = 0.267) groups, but this metric was different than that in the Strength-Deficient group (p = 0.002). The Bonferroni-adjusted Dunn test heatmaps with p-values for strength, Y-Balance, and FMS across functional profiles are presented Figure S1.
No statistically significant differences were found between clinical profiles in BMI (p = 0.280). Chronological age showed a near-significant trend (p = 0.061), with “Stability-Deficient” athletes being younger (12.1 years) and “Strength-Deficient” being the oldest (14.8 years).

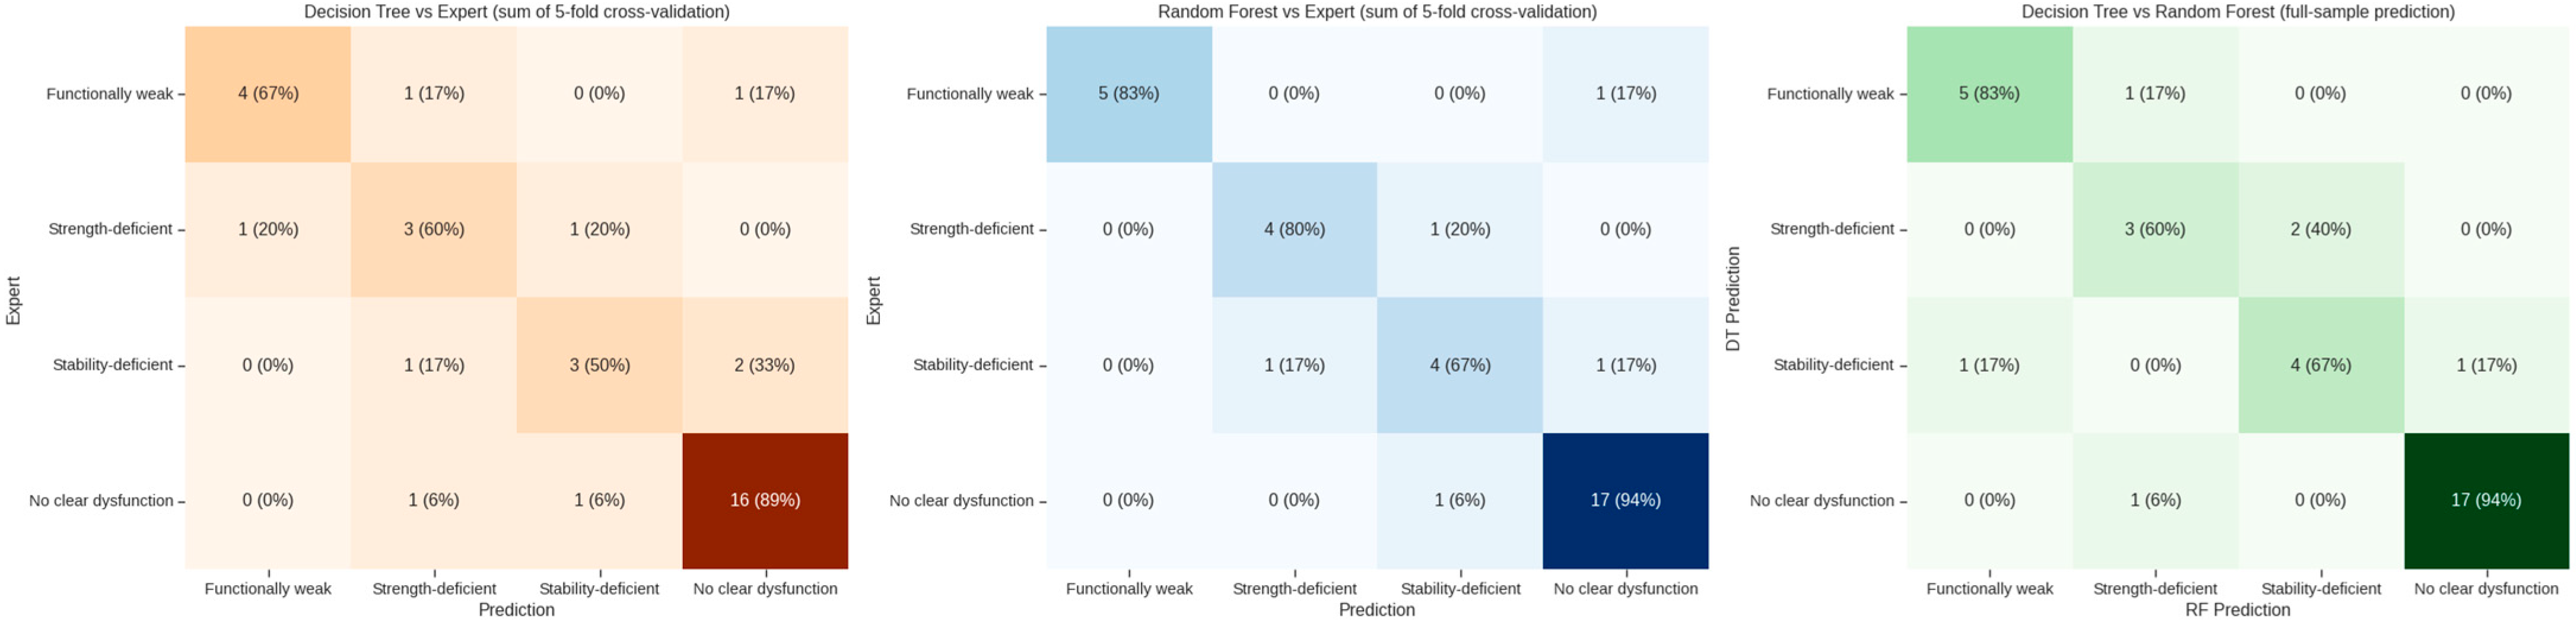
3.2. Random Forest Outperforms Decision Tree in Classifying Functional Profiles

Both the DF and RF models were trained to reproduce the above expert classifications from the quantitative test inputs. After 5-fold cross-validation, the RF model demonstrated superior accuracy and consistency compared to the DT model. The RF achieved a mean cross-validated accuracy of 81.1% (±6.5%) in classifying soccer players into the four profiles, versus 7.4% (±9.9%) for the DT. The RF’s macro-averaged F1 score was 0.71, compared to 0.68 for the DT. Likewise, the RF yielded substantially higher agreement with the true labels, Cohen’s κ ≈ 0.71 and MCC ≈ 0.71, indicating substantial agreement, whereas the DT’s κ and MCC were around 0.55–0.60 (moderate agreement). Figure 4 displays the confusion matrices from 5-fold cross-validation (DT and RF vs. expert) and the full-sample DT vs. RF agreement.
When considering the entire soccer dataset (training set performance), the models were able to fit the data closely. The final pruned DT, trained on all 37 soccer players, achieved 86.5% accuracy on that training set (32/37 correct), and the RF achieved 94.6% (35/37 correct). The cross-validated metrics reported above provide a more realistic assessment of generalization. We therefore focused on the cross-validated results: an overall accuracy around 80% for the RF and ~70% for the DT. The RF correctly classifies roughly 4 out of 5 players’ profiles, whereas the DT is correct for ~7 out of 10 players. Given the moderate sample size, these accuracies are quite encouraging for a first-pass model. Balanced accuracy for the RF (≈76%) was higher than for the DT (≈65%), indicating the RF maintained better sensitivity across the under-represented classes (strength- and Stability-Deficient) than the DT. The RF model outperformed the DT across all agreement metrics.

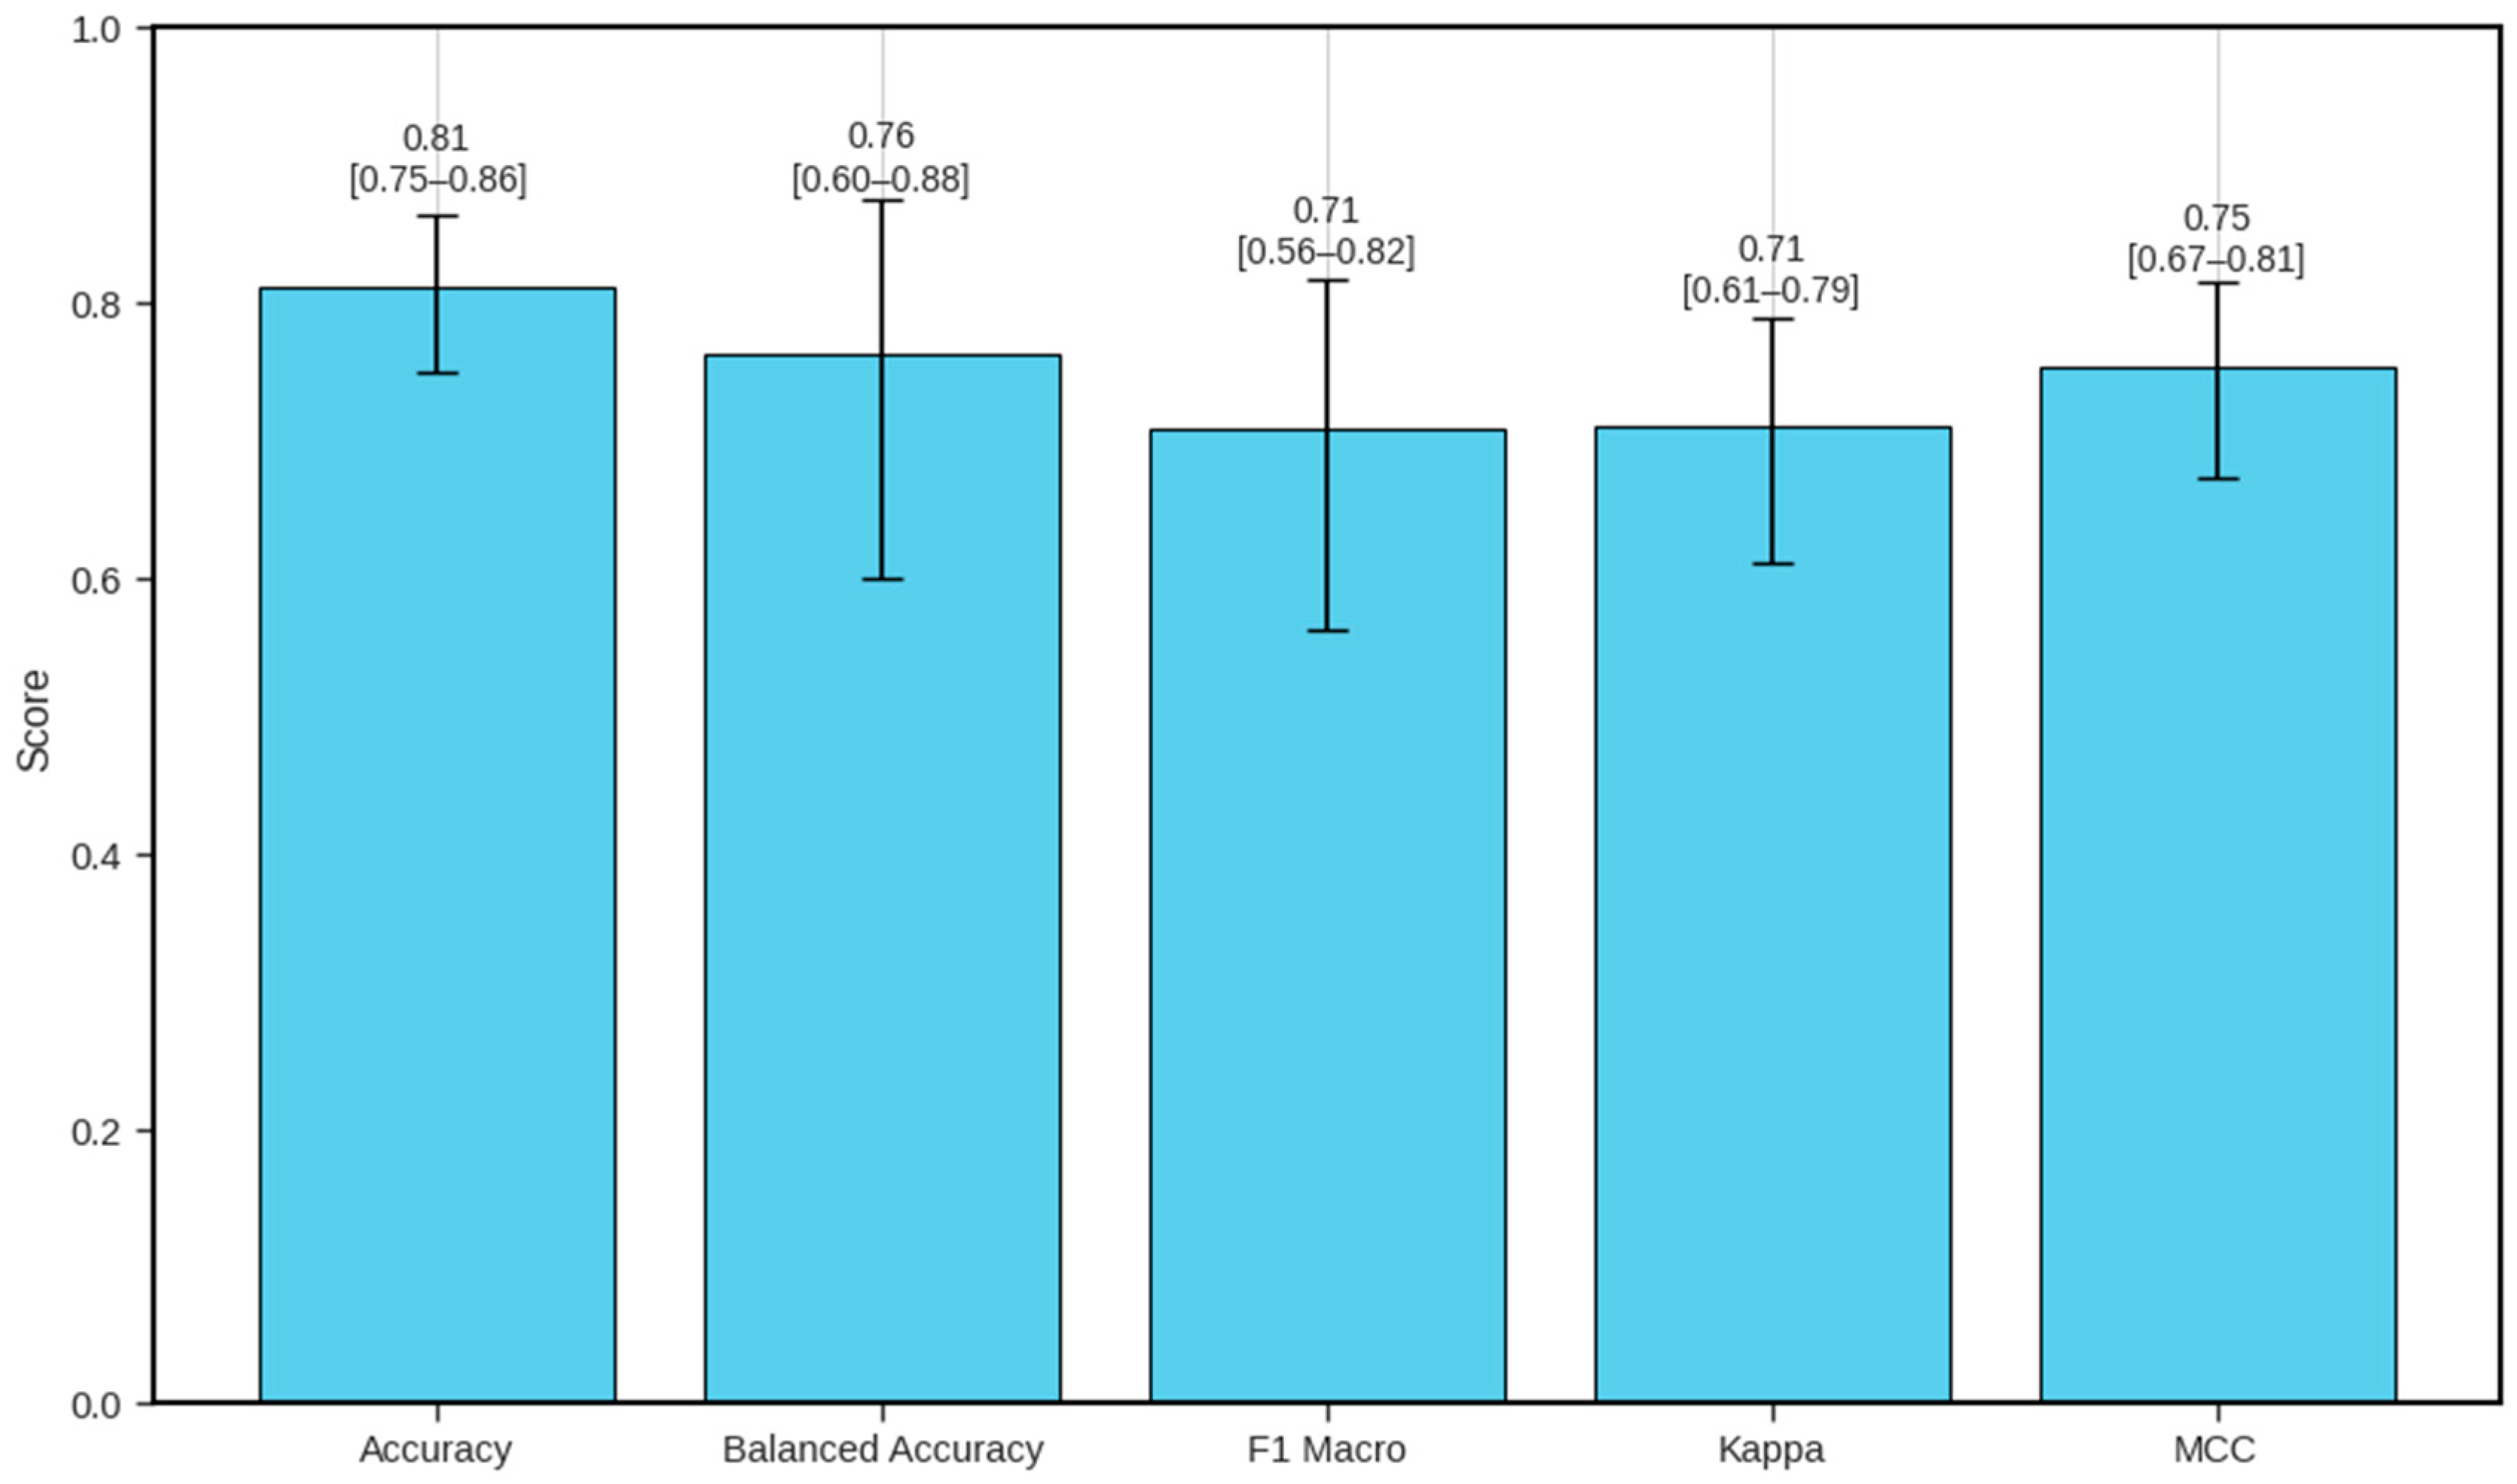
3.3. Bootstrap Validation Confirms the Reliability of the Random Forest Model

To further assess the reliability and stability of the RF model, 1000 bootstrap iterations were performed on the cross-validated predictions (Figure 5). The mean accuracy was 0.811 (95% CI: 0.750–0.864), balanced accuracy 0.762 (95% CI: 0.600–0.875), and macro F1-score 0.708 (95% CI: 0.562–0.816). Substantial agreement metrics indicated strong model reliability, with Cohen’s Kappa = 0.711 (95% CI: 0.611–0.788) and MCC = 0.753 (95% CI: 0.672–0.815).

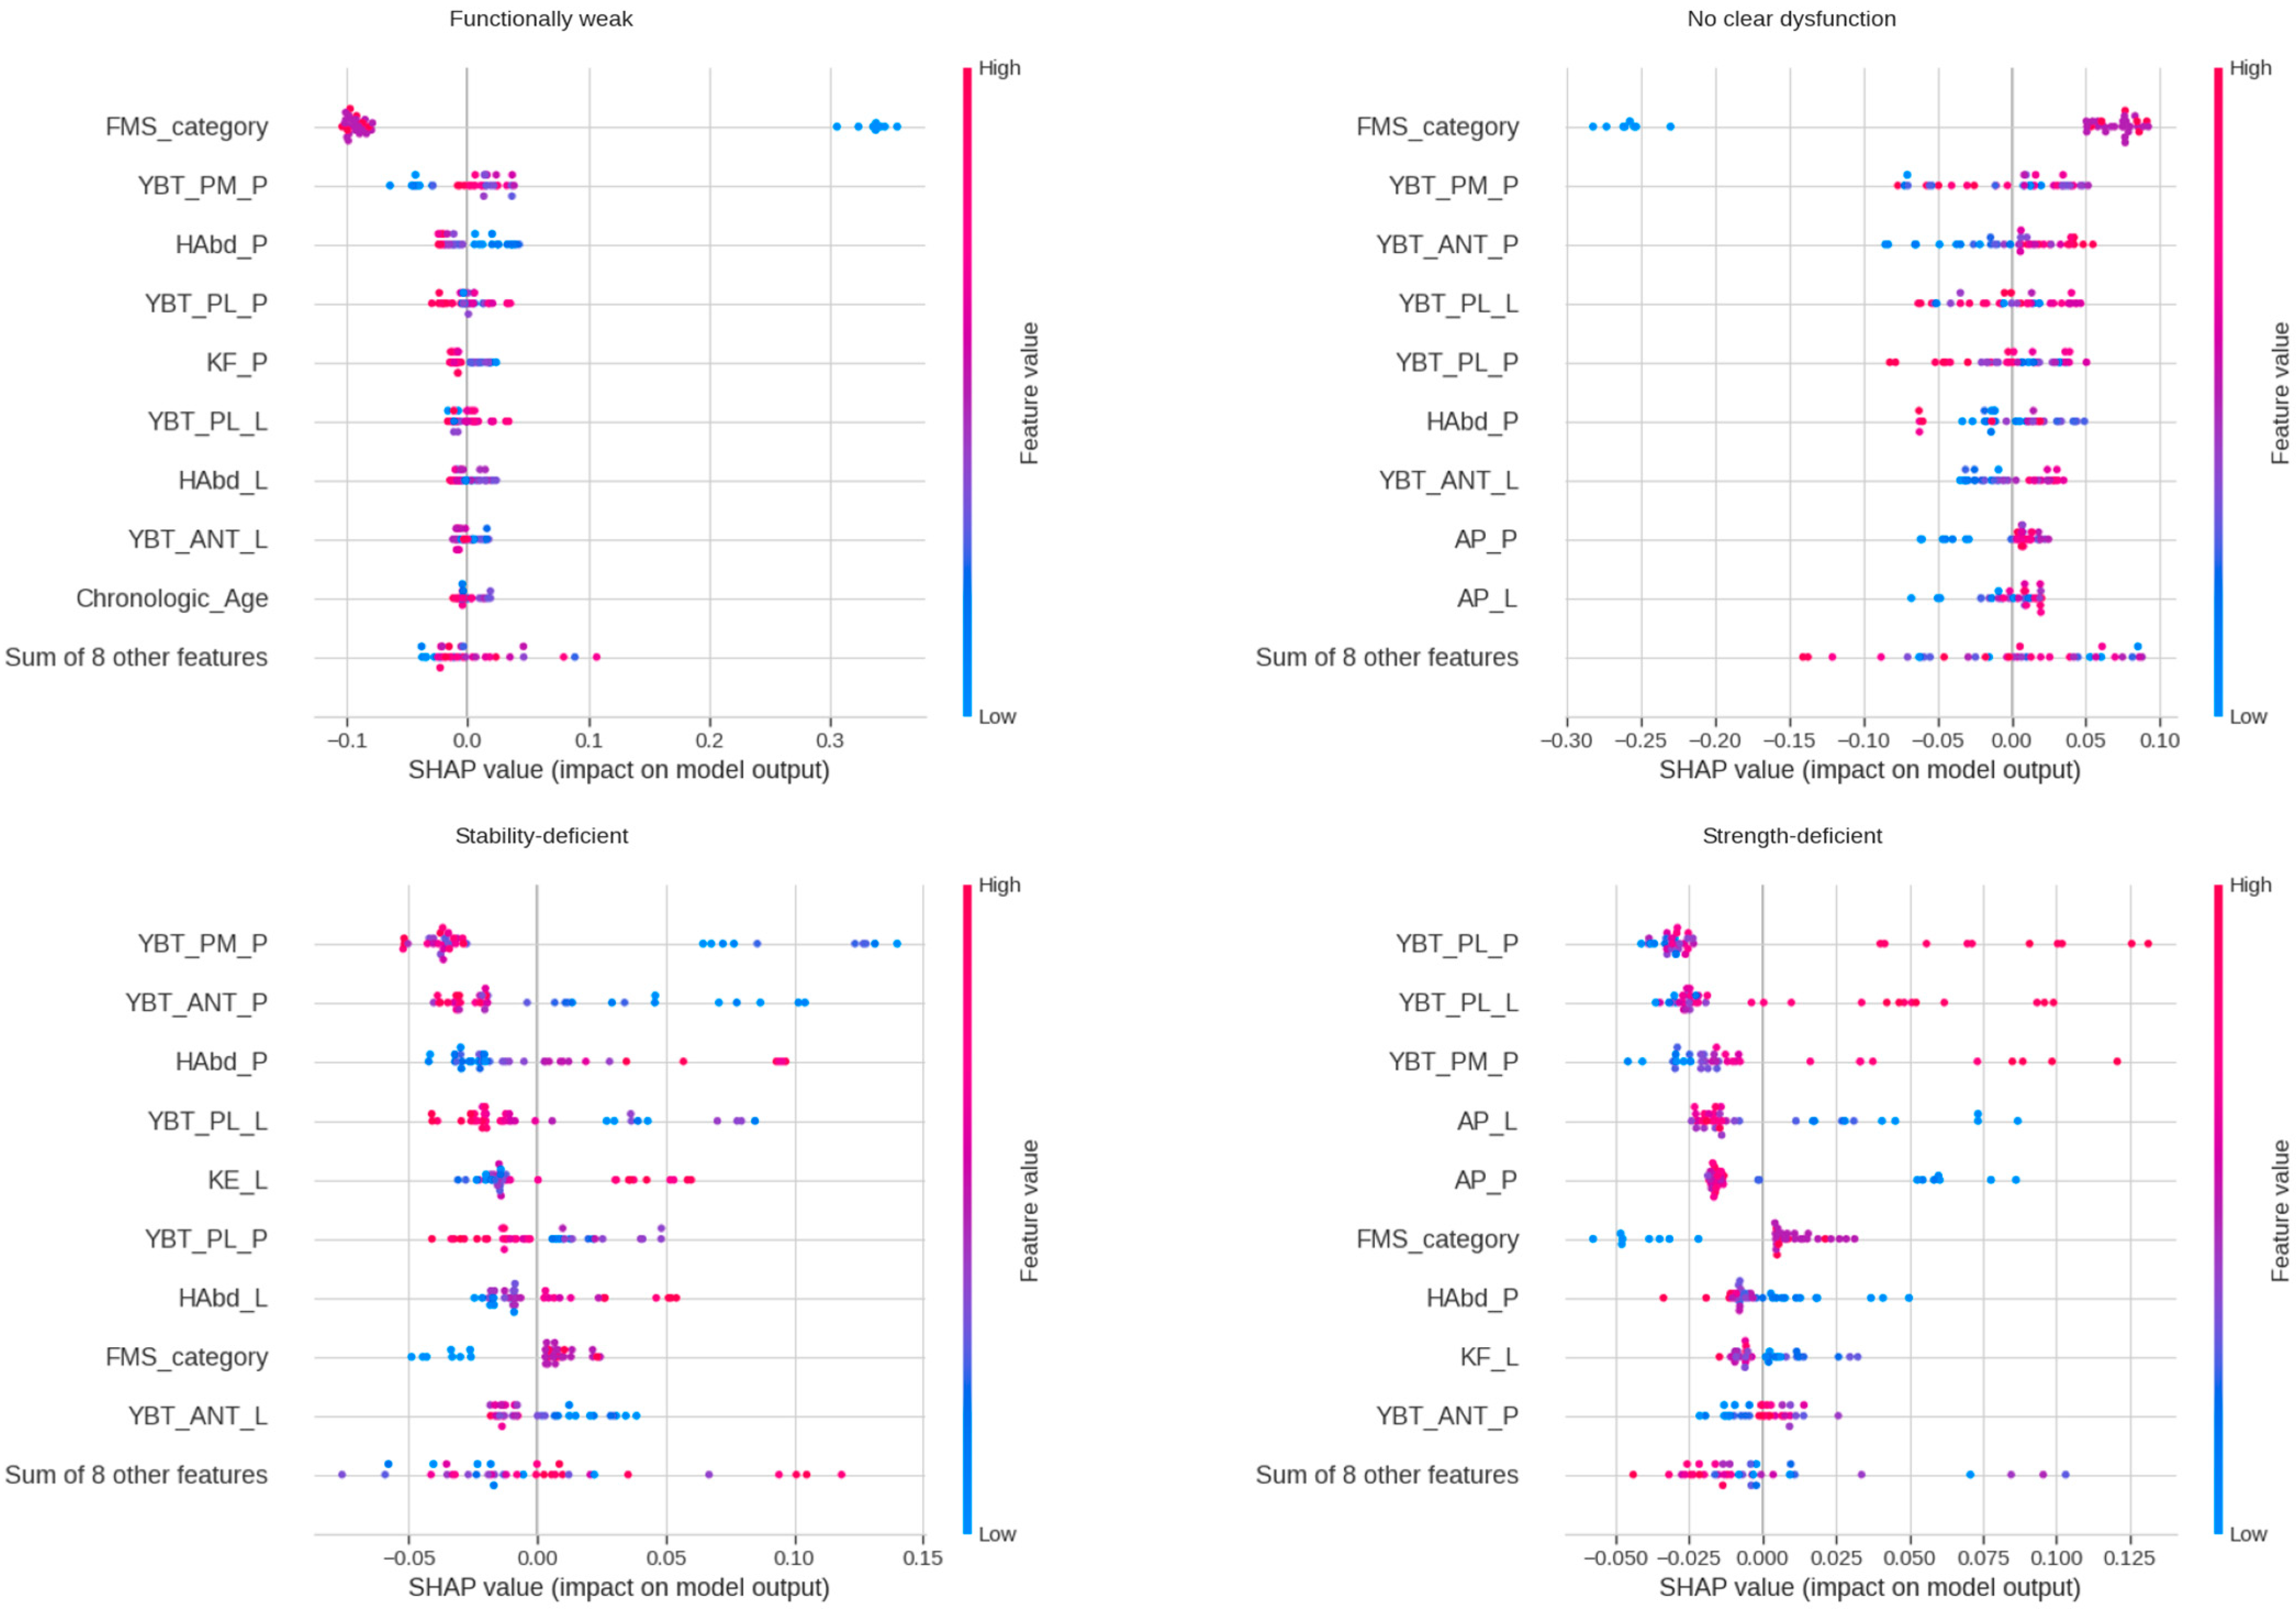
3.4. Key Features Driving Classification (SHAP Analysis)

To interpret the RF model’s decisions, we performed a SHAP (SHapley Additive exPlanations) analysis. The SHAP feature importance results aligned with the intended logic of the profiles, lending face validity to the model.
SHAP analysis identified FMS as the top predictor for the Functionally Weak class (abs SHAP = 0.145), followed by YBT PM (0.024) and HAbd (0.019). For Stability-Deficient athletes, YBT PM (0.055) and YBT ANT (0.035) were the dominant features. In the Strength-Deficient class, YBT PL (0.045), AP left (0.024), and AP right (0.024) were most influential. Globally, FMS category (0.073) and YBT metrics had the highest impact, while age and BMI showed minimal relevance. Figure 6 summarizes the top contributing features across all four profiles using SHAP beeswarm plots.

3.5. External Validation on Handball Players

An external validation was performed on a separate cohort of nine youth handball players (mean age 12.8 ± 0.7 years; five males, four females). Baseline differences between the soccer and handball groups were assessed using the Mann–Whitney U test. As shown in Table 2, there were no significant differences in normalized strength (U = 166.0, p = 1.000), FMS scores (U = 223.0, p = 0.118), BMI (U = 172.5, p = 0.879), or chronological age (U = 191.0, p = 0.506). The only significant difference emerged in dynamic balance (YBT), with handball athletes outperforming soccer players (U = 9.0, p = 0.035). The observed difference in composite YBT score was −4.97 LL% (95% CI: −1.76 to −0.024). Effect size estimates (Cliff’s delta) supported a small-to-moderate group difference in YBT, with negligible effects for other variables. Full comparative statistics are reported in Supplemental material.
When applied to the handball players, the trained models showed divergent performance. The RF maintained a high accuracy of 88.9% in predicting the expert-defined profiles of the handball athletes, correctly classifying eight of nine players (misclassified one Stability-Deficient player as No-Dysfunction). In contrast, the decision tree correctly classified only five of nine handball players (accuracy 55.6%). The RF’s macro F1-score on the handball set was 0.727, with a Cohen’s kappa of 0.804 and MCC of 0.827, indicating excellent agreement with the expert labels (nearly as strong as within-sample performance). The DT’s macro F1 on handball was 0.475, with kappa 0.379 and MCC 0.431, indicating only fair agreement.

4. Discussion

Our study developed and preliminarily validated a functional profiling system for youth athletes that integrates field-based assessments and interpretable machine learning. The system classified athletes into four distinct profiles—Functionally Weak, Strength-Deficient, Stability-Deficient, and No Clear Dysfunction—based on standardized measures of movement quality, strength, and balance. Most athletes showed at least one area of limitation, with Strength-Deficient and Stability-Deficient being the most common profiles. Similar distributions were observed across soccer and handball athletes, suggesting the classification logic may be applicable beyond a single-sport context, although further validation is required.
Unlike binary screens (e.g., FMS ≤ 14) [14], our system provides specific, actionable targets. If an athlete is classified as Strength-Deficient, the logical response is to prioritize strength development in their program—for example, through age-appropriate resistance training to build muscular power and robustness [35]. In contrast, an athlete identified as Stability-Deficient would benefit more from exercises targeting balance, proprioception, and core stability [36]. By breaking down a general concept of “functional motor skills” into specific components, the profiles ensure that training interventions can be individualized and thus more efficient [2,15]. This approach aligns with recent critiques of injury prediction screens, which argue for focusing on modifiable deficits rather than attempting to predict injury with single cut-off scores [37]. SHAP analysis further confirmed the model’s logic, showing that classifications were driven by domain-relevant variables—FMS for functional weakness, YBT for stability, and isometric strength for strength deficits—while anthropometric factors had minimal influence. This aligns with the recent literature emphasizing the clinical value of interpretable machine learning models, which enhance trust, transparency, and adoption in decision-support systems [38].

4.1. Model Accuracy and Robustness

The random forest (RF) model achieved high classification accuracy, especially in identifying Functionally Weak and Strength-Deficient profiles. Importantly, it never confused unrelated profiles (e.g., Stability vs. Strength), suggesting robust pattern recognition. Misclassifications occurred primarily at classification boundaries, e.g., borderline strength values, and never contradicted the expert logic. In contrast, the decision tree (DT) underperformed, frequently labeling mild deficits as No-Dysfunction. These findings underscore the RF model’s superior fit to expert logic and its potential as a reliable decision-support tool.

4.2. Flag System Alignment

The alternative flag-based stratification showed strong convergence with the profile system. Most Functionally Weak athletes had multiple domain deficits (e.g., FMS + strength), while No-Dysfunction athletes typically had no or a single mild flag. This alignment strengthens the credibility of the classification rules and provides a simpler communication layer for coaches.

4.3. Validation in a Separate Athlete Group

External validation on a small handball cohort showed promising agreement with expert-defined profiles. The random forest model correctly classified all Functionally Weak and Strength-Deficient athletes, misclassifying only one Stability-Deficient case. Despite differences in balance scores between sports, the model achieved substantial cross-sport agreement (κ = 0.80), suggesting potential for broader applicability. However, this result should be interpreted with caution due to the limited sample size, and further validation in larger, sport-diverse populations is needed.

4.4. Comparison with Existing Screening Tools

In our study, we used the most popular field-expedient screening (for motor skills and injury risk) tools in the sports environment. Consistent with previous studies [11,12,13], these tools offer practical, time-efficient assessments suitable for sport settings. However, accumulating evidence questions the predictive value of the FMS [39] or YBT [11] when used in isolation.
Our profile-based system offers a clear advantage over prior binary methods. Even when the FMS or similar screens are used within risk algorithms, the output has traditionally been a broad risk category. For example, the Move2Perform system was an attempt to integrate multiple inputs—including FMS, YBT, injury history, and demographics—into an algorithm that categorizes athletes into risk groups (e.g., “Normal”, “Slight”, “Moderate”, or “Substantial” risk) [16]. Lehr et al. pioneered this field-expedient algorithm and demonstrated its utility: collegiate athletes classified as high-risk (combining moderate/substantial categories) were 3.4 times more likely to sustain a non-contact lower extremity injury compared to low-risk athletes. The effectiveness of Move2Perform’s combined screening is further evidenced by Huebner et al., who applied it in a prospective intervention study [2]. They found that an 8-week targeted exercise program guided by initial Move2Perform risk categorization shifted a significant number of young athletes to lower risk categories [2].

4.5. Practical Implications

This system could have direct application in youth development settings. It relies on accessible field tests, requires minimal equipment, and integrates easily into seasonal assessments. The profile output enables coaches and clinicians to tailor training plans, track progress, and reassess athletes periodically to adjust interventions. In return-to-play contexts, the profiles offer a structured checklist of functional domains to restore before clearance. Coaches, clinicians, or sports scientists can use the profiles to tailor training, support return-to-play decisions, and monitor progress longitudinally. Although not intended as an injury prediction tool, early identification of functional deficits supports targeted intervention and aligns with preventative strategies in youth sports medicine.
To support adoption, we developed a user-friendly, open-source web application (Streamlit-based) that automatically generates an individual athlete’s profile report, including visualizations (e.g., radar chart of deficits) and training recommendations.
To limit the real-world variability of FMS, YBT, and HHD scores we recommend (i) compulsory assessor training on the exact test batteries used here, with periodic re-calibration sessions to control inter-rater drift; (ii) a locked-down protocol—identical warm-up, footwear, surface, and familiarization trials—and (iii) aggregation of limb-specific outputs into composite metrics (e.g., mean YBT reach, mean peak forces) that dilute single-measurement noise and yield the higher reliability coefficients reported for summary scores in the literature.

4.6. Limitations

This was a relatively small, exploratory study. Our final sample exceeded the minimum requirements for the Kruskal–Wallis comparisons but represents a limitation for the more complex classification modeling. To address this limitation, we employed structural regularization techniques by constraining model complexity—limiting the depth of decision trees and using ensemble averaging in the random forest. These approaches are intended to reduce over-fitting and emphasize the most stable predictors across validation folds. Because the depth = 3 decision tree underlying the RF ensemble contains only seven splitting parameters, the effective model dimensionality is 7 rather than the full set of 16 predictors. Using the conservative rule of ≥5 observations per parameter for classification models, a minimum of 35 athletes is required; our training sample of 37 (plus 9 in the external hold-out) therefore satisfies the current recommendations while limiting the risk of over-fitting despite four outcome classes [40]. This work addresses two common limitations in sport-performance machine learning research—the lack of external validation and poor model interpretability—by providing both cross-sport testing and feature-level transparency via SHAP analysis. Despite promising overall model performance (macro F1 = 0.71, κ = 0.71), the sample size per class was limited, particularly for Strength- and Stability-Deficient profiles. Bootstrapped precision, recall, and F1-score estimates revealed wide confidence intervals in these under-represented categories (e.g., F1: 0.286–1.000 for Strength-Deficient; 0.000–0.909 for Stability-Deficient) (Table S2). This underscores the need for cautious interpretation and highlights the importance of larger, more balanced datasets in future validation studies. The rule-based hierarchy introduces boundary effects; in rare cases, athletes with mixed deficits but normal FMS could be misclassified. While such cases did not appear in our data, they remain theoretically possible due to the use of mutually exclusive categories. This study was cross-sectional. We did not track athletes longitudinally to assess how profile-based interventions affect injury risk or performance outcomes. While the rationale for individualized targeting is strong, its real-world impact remains to be tested. Lastly, our test battery did not include markers such as speed or power, which could enhance profiling but would increase burden in field settings. Future studies with larger, multi-club datasets can revisit higher-capacity algorithms (e.g., XGBoost, SVM) once sample size is sufficient to avoid over-fitting. Because test performance varies with maturation and sex and two deficit categories were under-represented, there is a need for broader recruitment. Longitudinal implementation is also recommended to assess how well the profiling system supports training adaptations and injury prevention over time. Collaborative data collection with other academies or federations could strengthen the model, allow for recalibration of thresholds, and improve robustness for applied use.

5. Conclusions

This proof-of-concept study introduces a practical and interpretable functional profiling system for youth athletes based on standardized assessments of strength, balance, and movement quality. The system outperforms traditional binary classifications by offering profile-based feedback for individualized training. Preliminary validation demonstrates promising accuracy and usability, but further research is needed to confirm generalizability across sports, age groups, and contexts. Crucially, the profiling tool is open-source, making it freely accessible, fully transparent, and easily modifiable. We encourage coaches, clinicians, and researchers to test, adapt, and refine the tool within their own environments to support athlete development through evidence-based, targeted interventions.

Supplementary Materials

The following supporting information can be downloaded at: https://www.mdpi.com/article/10.3390/app15126436/s1, Figure S1: Bonferroni-adjusted Dunn test heatmaps for strength, Y-Balance, and FMS across functional profiles; Figure S2: Decision tree classifier—functional profile; Figure S3: Distribution of functional movement profiles by sport type; Figure S4: Comparison of key functional and anthropometric variables between soccer and handball athletes (box plots); Table S1: Characteristics of the soccer players; Table S2. Random forest per-class classification metrics with 95% bootstrapped confidence intervals.

Author Contributions

Conceptualization, B.W.; Methodology, B.W. and K.Z.; Investigation, B.W.; Writing—Original Draft, B.W.; Writing—Review and Editing, B.W., M.B. and K.Z.; Funding Acquisition, K.Z.; Resources, K.Z.; Supervision, K.Z. and M.B. All authors have read and agreed to the published version of the manuscript.

Funding

This research was supported and co-funded by the Polish Minister of Education and Science (project no. SONP/SP/549693/2022). The publication was co-financed from the state budget under the program of the Polish Minister of Education and Science under the name “Excellent Science” project no. DNK/SP/548321/2022.

Institutional Review Board Statement

All testing was conducted with institutional ethical approval and in accordance with the Declaration of Helsinki. The study protocol received approval from the institutional review board at [NKBBN/241/202].

Informed Consent Statement

This cross-sectional study was conducted as part of the Project Healthy Sport initiative (ClinicalTrials.gov ID: NCT06325228) and was approved by the Independent Bioethics Committee (NKBBN/241/2023). Written informed consent was obtained from all participants and their legal guardians.

Data Availability Statement

The data presented in this study are openly available in Open Science Framework at https://doi.org/10.17605/OSF.IO/DKSWH (accessed on 8 May 2025). The full code presented in this study are openly available in Open Science Framework at https://github.com/BartWil/athlete_report_generator (accessed on 8 May 2025).

Acknowledgments

During the preparation of this work, the authors used Grammarly, ChatGPT-4o, and DeepL to support grammar correction and clarity, as none of the authors are native English speakers. ChatGPT-4o and Claude 3.7 were used only to review and simplify the Python code used in the analysis and application development. All content was critically reviewed, edited, and validated by the authors, who take full responsibility for the final version of the manuscript.

Conflicts of Interest

The authors declare no competing interests.

Appendix A

Table A1. Key resources table.
Reagent or ResourceSourceIdentifier
Deposited data
De-identified raw data of experimentOpen Science FrameworkDOI: 10.17605/OSF.IO/AKUQ8
https://osf.io/akuq8/
(accessed on 5 June 2025)
Experimental models: Organisms/strains
Youth soccer athletes (male, 8–17 yrs)Regional academy teamsNCT06325228
Youth handball athletes (male and female, 8–17 yrs)Regional academy teamsNCT06325228
Software and algorithms
Python (v3.10)Python software foundationhttp://www.python.org/
(accessed on 5 June 2025)
scikit-learn (v1.2)scikit-learn developershttps://scikit-learn.org/
(accessed on 5 June 2025)
SHAP (v0.42)Lundberg and Leehttps://github.com/slundberg/shap
(accessed on 5 June 2025)
StreamlitStreamlit Inc.https://streamlit.io/
(accessed on 5 June 2025)
Athlete Functional Report Generator (App)This study/GitHubhttps://athletereportgenerator.streamlit.app/
(accessed on 5 June 2025)
Athlete Functional Report Generator (Code)This study/GitHubhttps://github.com/BartWil/athlete_report_generator
(accessed on 5 June 2025)
Other
Hand-held dynamometer (Model 01165)Lafayette Instrument Companyhttps://lafayetteinstrument.com/
(accessed on 5 June 2025)
Lower Quarter Y-Balance Test KitFunctional Movement Systemshttps://www.functionalmovement.com/
(accessed on 5 June 2025)
Functional Movement Screen KitFunctional Movement Systemshttps://www.functionalmovement.com/
(accessed on 5 June 2025)
Resource availability.
Any additional information required to reanalyze the data reported in this paper is available from the lead contact upon request. Further information and requests for resources should be directed to and fulfilled by the lead contact, Bartosz Wilczyński (bartosz.wilczynski@gumed.edu.pl).
Data and code availability:
-
De-identified data have been deposited at OSF and are publicly available as of the date of publication. The open-access link is listed in the key resources table.
-
Athlete Functional Report Generator: A publicly available, open-source web app designed to classify athletes into functional profiles using test data and generate individualized reports. https://athletereportgenerator.streamlit.app/ (accessed on 8 May 2025).
-
Source code for Report Generator: GitHub repository for modification, deployment, and integration. https://github.com/BartWil/athlete_report_generator (accessed on 8 May 2025).

References

  1. Pfeifer, C.E.; Sacko, R.S.; Ortaglia, A.; Monsma, E.V.; Beattie, P.F.; Goins, J.; Stodden, D.F. Functional Movement ScreenTM in Youth Sport Participants: Evaluating the Proficiency Barrier for Injury. Int. J. Sports Phys. Ther. 2019, 14, 436–444. [Google Scholar] [CrossRef] [PubMed]
  2. Huebner, B.J.; Plisky, P.J.; Kiesel, K.B.; Schwartzkopf-Phifer, K. Can Injury Risk Category Be Changed in Athletes? An Analysis of an Injury Prevention System. Int. J. Sports Phys. Ther. 2019, 14, 127–134. [Google Scholar] [CrossRef]
  3. Rommers, N.; Rössler, R.; Verhagen, E.; Vandecasteele, F.; Verstockt, S.; Vaeyens, R.; Lenoir, M.; D’Hondt, E.; Witvrouw, E. A Machine Learning Approach to Assess Injury Risk in Elite Youth Football Players. Med. Sci. Sports Exerc. 2020, 52, 1745–1751. [Google Scholar] [CrossRef] [PubMed]
  4. Kokstejn, J.; Musalek, M.; Wolanski, P.; Murawska-Cialowicz, E.; Stastny, P. Fundamental Motor Skills Mediate the Relationship between Physical Fitness and Soccer-Specific Motor Skills in Young Soccer Players. Front. Physiol. 2019, 10, 596. [Google Scholar] [CrossRef]
  5. Bruzda, R.; Wilczyński, B.; Zorena, K. Knee Function and Quality of Life in Adolescent Soccer Players with Osgood Shlatter Disease History: A Preliminary Study. Sci. Rep. 2023, 13, 19200. [Google Scholar] [CrossRef] [PubMed]
  6. Wilczyński, B.; Cabaj, P.; Biały, M.; Zorena, K. Impact of Lateral Ankle Sprains on Physical Function, Range of Motion, Isometric Strength and Balance in Professional Soccer Players. BMJ Open Sport Exerc. Med. 2024, 10, e002293. [Google Scholar] [CrossRef]
  7. Wilczynski, B.; Taraszkiewicz, M.; de Tillier, K.; Biały, M.; Zorena, K. Sinding-Larsen-Johansson Disease. Clinical Features, Imaging Findings, Conservative Treatments and Research Perspectives: A Scoping Review. PeerJ 2024, 12, e17996. [Google Scholar] [CrossRef]
  8. Jukic, I.; Prnjak, K.; Zoellner, A.; Tufano, J.J.; Sekulic, D.; Salaj, S. The Importance of Fundamental Motor Skills in Identifying Differences in Performance Levels of U10 Soccer Players. Sports 2019, 7, 178. [Google Scholar] [CrossRef]
  9. Biały, M.; Wilczyński, B.; Forelli, F.; Hewett, T.E.; Gnat, R. Functional Deficits in Non-Elite Soccer (Football) Players: A Strength, Balance, and Movement Quality Assessment After Anterior Cruciate Ligament Reconstruction. Cureus 2024, 16, e75846. [Google Scholar] [CrossRef]
  10. Cook, G.; Burton, L.; Hoogenboom, B.J.; Voight, M. Functional Movement Screening: The Use of Fundamental Movements as an Assessment of Function—Part 1. Int. J. Sports Phys. Ther. 2014, 9, 396–409. [Google Scholar]
  11. Plisky, P.; Schwartkopf-Phifer, K.; Huebner, B.; Garner, M.B.; Bullock, G. Systematic Review and Meta-Analysis of the y-Balance Test Lower Quarter: Reliability, Discriminant Validity, and Predictive Validity. Int. J. Sports Phys. Ther. 2021, 16, 1190–1209. [Google Scholar] [CrossRef]
  12. Kolodziej, M.; Nolte, K.; Schmidt, M.; Alt, T.; Jaitner, T. Identification of Neuromuscular Performance Parameters as Risk Factors of Non-Contact Injuries in Male Elite Youth Soccer Players: A Preliminary Study on 62 Players With 25 Non-Contact Injuries. Front. Sport. Act. Living 2021, 3, 615330. [Google Scholar] [CrossRef] [PubMed]
  13. Kawaguchi, K.; Taketomi, S.; Mizutani, Y.; Inui, H.; Yamagami, R.; Kono, K.; Takagi, K.; Kage, T.; Sameshima, S.; Tanaka, S.; et al. Hip Abductor Muscle Strength Deficit as a Risk Factor for Inversion Ankle Sprain in Male College Soccer Players: A Prospective Cohort Study. Orthop. J. Sport. Med. 2021, 9, 1–8. [Google Scholar] [CrossRef]
  14. Trinidad-Fernandez, M.; Gonzalez-Sanchez, M.; Cuesta-Vargas, A.I. Is a Low Functional Movement Screen Score (≤14/21) Associated with Injuries in Sport? A Systematic Review and Meta-Analysis. BMJ Open Sport Exerc. Med. 2019, 5, e000501. [Google Scholar] [CrossRef] [PubMed]
  15. Šiupšinskas, L.; Garbenytė-Apolinskienė, T.; Salatkaitė, S.; Gudas, R.; Trumpickas, V. Association of Pre-Season Musculoskeletal Screening and Functional Testing with Sports Injuries in Elite Female Basketball Players. Sci. Rep. 2019, 9, 9286. [Google Scholar] [CrossRef]
  16. Lehr, M.E.; Plisky, P.J.; Butler, R.J.; Fink, M.L.; Kiesel, K.B.; Underwood, F.B. Field-expedient Screening and Injury Risk Algorithm Categories as Predictors of Noncontact Lower Extremity Injury. Scand. J. Med. Sci. Sports 2013, 23, e225–e232. [Google Scholar] [CrossRef] [PubMed]
  17. Eckart, A.C.; Ghimire, P.S.; Stavitz, J.; Barry, S. Predictive Utility of the Functional Movement Screen and Y-Balance Test: Current Evidence and Future Directions. Sports 2025, 13, 46. [Google Scholar] [CrossRef]
  18. Sarker, I.H. Machine Learning: Algorithms, Real-World Applications and Research Directions. SN Comput. Sci. 2021, 2, 160. [Google Scholar] [CrossRef]
  19. Maru, S.; Kuwatsuru, R.; Matthias, M.D.; Simpson Jr, R.J. Public Disclosure of Results From Artificial Intelligence/Machine Learning Research in Health Care: Comprehensive Analysis of ClinicalTrials.Gov, PubMed, and Scopus Data (2010–2023). J. Med. Internet Res. 2025, 27, e60148. [Google Scholar] [CrossRef]
  20. Rico-González, M.; Pino-Ortega, J.; Méndez, A.; Clemente, F.M.; Baca, A. Machine Learning Application in Soccer: A Systematic Review. Biol. Sport 2023, 40, 249–263. [Google Scholar] [CrossRef]
  21. Benjaminse, A.; Nijmeijer, E.M.; Gokeler, A.; Di Paolo, S. Application of Machine Learning Methods to Investigate Joint Load in Agility on the Football Field: Creating the Model, Part I. Sensors 2024, 24, 3652. [Google Scholar] [CrossRef] [PubMed]
  22. Freitas, D.N.; Mostafa, S.S.; Caldeira, R.; Santos, F.; Fermé, E.; Gouveia, É.R.; Morgado-Dias, F. Predicting Noncontact Injuries of Professional Football Players Using Machine Learning. PLoS ONE 2025, 20, e0315481. [Google Scholar] [CrossRef] [PubMed]
  23. Nassis, G.P.; Verhagen, E.; Brito, J.; Figueiredo, P.; Krustrup, P. A Review of Machine Learning Applications in Soccer with an Emphasis on Injury Risk. Biol. Sport 2023, 40, 233–239. [Google Scholar] [CrossRef]
  24. Billingham, S.A.; Whitehead, A.L.; Julious, S.A. An Audit of Sample Sizes for Pilot and Feasibility Trials Being Undertaken in the United Kingdom Registered in the United Kingdom Clinical Research Network Database. BMC Med. Res. Methodol. 2013, 13, 2–7. [Google Scholar] [CrossRef] [PubMed]
  25. Mentiplay, B.F.; Perraton, L.G.; Bower, K.J.; Adair, B.; Pua, Y.H.; Williams, G.P.; McGaw, R.; Clark, R.A. Assessment of Lower Limb Muscle Strength and Power Using Hand-Held and Fixed Dynamometry: A Reliability and Validity Study. PLoS ONE 2015, 10, e0140822. [Google Scholar] [CrossRef]
  26. Hébert, L.J.; Maltais, D.B.; Lepage, C.; Saulnier, J.; Crête, M. Hand-Held Dynamometry Isometric Torque Reference Values for Children and Adolescents. Pediatr. Phys. Ther. 2015, 27, 414–423. [Google Scholar] [CrossRef]
  27. Plisky, P.J.; Gorman, P.P.; Butler, R.J.; Kiesel, K.B.; Underwood, F.B.; Elkins, B. The Reliability of an Instrumented Device for Measuring Components of the Star Excursion Balance Test. N. Am. J. Sports Phys. Ther. 2009, 4, 92–99. [Google Scholar] [PubMed]
  28. Wilczyński, B.; Radzimiński, Ł.; Sobierajska-Rek, A.; de Tillier, K.; Bracha, J.; Zorena, K. Biological Maturation Predicts Dynamic Balance and Lower Limb Power in Young Football Players. Biology 2022, 11, 1167. [Google Scholar] [CrossRef]
  29. Wilczyński, B.; Radzimiński, Ł.; Sobierajska-Rek, A.; Zorena, K. Association between Selected Screening Tests and Knee Alignment in Single-Leg Tasks among Young Football Players. Int. J. Environ. Res. Public Health 2022, 19, 6719. [Google Scholar] [CrossRef]
  30. Schwiertz, G.; Brueckner, D.; Schedler, S.; Kiss, R.; Muehlbauer, T. Performance and Reliability of the Lower Quarter Y Balance Test in Healthy Adolescents from Grade 6 to 11. Gait Posture 2019, 67, 142–146. [Google Scholar] [CrossRef]
  31. Shaffer, S.W.; Teyhen, D.S.; Lorenson, C.L.; Warren, R.L.; Koreerat, C.M.; Straseske, C.A.; Childs, J.D. Y-Balance Test: A Reliability Study Involving Multiple Raters. Mil. Med. 2013, 178, 1264–1270. [Google Scholar] [CrossRef]
  32. Kramer, T.A.; Sacko, R.S.; Pfeifer, C.E.; Gatens, D.R.; Goins, J.M.; Stodden, D.F. The Association Between the Functional Movement ScreenTM, Y-Balance Test, and Physical Performance Tests in Male and Female High School Athletes. Int. J. Sports Phys. Ther. 2019, 14, 911–919. [Google Scholar] [CrossRef] [PubMed]
  33. Bonazza, N.A.; Smuin, D.; Onks, C.A.; Silvis, M.L.; Dhawan, A. Reliability, Validity, and Injury Predictive Value of the Functional Movement Screen. Am. J. Sports Med. 2017, 45, 725–732. [Google Scholar] [CrossRef]
  34. Musat, C.L.; Mereuta, C.; Nechita, A.; Tutunaru, D.; Voipan, A.E.; Voipan, D.; Mereuta, E.; Gurau, T.V.; Gurău, G.; Nechita, L.C. Diagnostic Applications of AI in Sports: A Comprehensive Review of Injury Risk Prediction Methods. Diagnostics 2024, 14, 2516. [Google Scholar] [CrossRef] [PubMed]
  35. Granacher, U.; Lesinski, M.; Büsch, D.; Muehlbauer, T.; Prieske, O.; Puta, C.; Gollhofer, A.; Behm, D.G. Effects of Resistance Training in Youth Athletes on Muscular Fitness and Athletic Performance: A Conceptual Model for Long-Term Athlete Development. Front. Physiol. 2016, 7, 164. [Google Scholar] [CrossRef] [PubMed]
  36. Steffen, K.; Emery, C.A.; Romiti, M.; Kang, J.; Bizzini, M.; Dvorak, J.; Finch, C.F.; Meeuwisse, W.H. High Adherence to a Neuromuscular Injury Prevention Programme (FIFA 11+) Improves Functional Balance and Reduces Injury Risk in Canadian Youth Female Football Players: A Cluster Randomised Trial. Br. J. Sports Med. 2013, 47, 794–802. [Google Scholar] [CrossRef]
  37. Andersson, S.H.; Bahr, R.; Clarsen, B.; Myklebust, G. Preventing Overuse Shoulder Injuries among Throwing Athletes: A Cluster-Randomised Controlled Trial in 660 Elite Handball Players. Br. J. Sports Med. 2017, 51, 1073–1080. [Google Scholar] [CrossRef]
  38. Tonekaboni, S.; Joshi, S.; McCradden, M.D.; Goldenberg, A. What Clinicians Want: Contextualizing Explainable Machine Learning for Clinical End Use. Proc. Mach. Learn. Res. 2019, 106, 359–380. [Google Scholar]
  39. Karuc, J.; Mišigoj-Duraković, M.; Šarlija, M.; Marković, G.; Hadžić, V.; Trošt-Bobić, T.; Sorić, M. Can Injuries Be Predicted by Functional Movement Screen in Adolescents? The Application of Machine Learning. J. Strength Cond. Res. 2021, 35, 910–919. [Google Scholar] [CrossRef]
  40. Rhon, D.I.; Teyhen, D.S.; Collins, G.S.; Bullock, G.S. Predictive Models for Musculoskeletal Injury Risk: Why Statistical Approach Makes All the Difference. BMJ Open Sport Exerc. Med. 2022, 8, e001388. [Google Scholar] [CrossRef]
Figure 1. Rule-based logic for functional profile classification. Legend: Functionally Weak: Athletes with low overall movement quality, defined as an FMS score in the bottom quartile (≤25th percentile), regardless of strength or balance performance. This profile reflects generalized functional limitations in mobility and stability tasks. Strength-Deficient: Athletes not classified as Functionally Weak but with substantially low strength (Z ≤ −0.5) and normal balance (YBT Z > −0.5). Indicates a specific deficit in force production capacity. Stability-Deficient: Athletes with normal FMS and strength but poor balance (YBT Z ≤ −0.5) and preserved strength (Strength Z > −0.5). Reflects isolated deficits in dynamic stability. No Clear Dysfunction: Athletes with all three domains (FMS, strength, balance) within normal limits (i.e., no score ≤ −0.5 SD). Represents a well-rounded functional profile with no major deficits.
Applsci 15 06436 g001
Figure 2. Radar plot comparing motor test results across functional profiles.
Applsci 15 06436 g002
Figure 3. Group differences in strength, balance, and FMS across athlete profiles. Bonferroni-adjusted post hoc Dunn tests: p < 0.05 (*), p < 0.01 (**), p < 0.001 (***).
Applsci 15 06436 g003
Figure 4. Confusion matrices showing classification agreement across models. Each cell displays the number and percentage of predictions falling into each category. Color intensity represents the proportion of cases per row (darker = higher agreement).
Applsci 15 06436 g004
Figure 5. Bootstrapped performance metrics (accuracy, F1-score, κ, MCC) with 95% confidence intervals for the random forest model.
Applsci 15 06436 g005
Figure 6. SHAP beeswarm plots across the four classification profiles.
Applsci 15 06436 g006
Table 1. Performance metrics and flag distribution across functional profiles.
ProfileStrength
(Z-Score)
YBT
(Z-Score)
FMS
(Category)
Flags
Functionally Weak
(n = 8)
0.56 ± 0.09
(−0.15 ± 0.79)
88.96 ± 4.28
(−0.04 ± 0.91)
13.38 ± 0.74 (Low)R = 0
Y = 4
G = 4
Strength-Deficient
(n = 5)
0.45 ± 0.03
(−1.13 ± 0.24)
93.45 ± 1.09
(0.92 ± 0.23)
16.40 ± 1.14 (Medium)R = 0
Y = 1
G = 4
Stability-Deficient
(n = 6)
0.65 ± 0.08
(0.66 ± 0.67)
84.34 ± 0.61
(−1.02 ± 0.13)
18.67 ± 1.03 (Medium)R = 0
Y = 0
G = 6
No clear dysfunction
(n = 18)
0.59 ± 0.12
(0.16 ± 1.10)
89.63 ± 5.11
(0.10 ± 1.09)
18.00 ± 1.97 (Medium)R = 1
Y = 3
G = 14
Table Legend: Performance metrics and flag distribution by functional profile (soccer players, n = 37). Values for strength and YBT are mean ± SD with corresponding Z-scores in parentheses; FMS is mean ± SD with category indicated (Low/Medium/High). R = Red/Y = Yellow/G = Green flag counts are number of athletes.
Table 2. Comparison of functional movement and performance metrics between soccer and handball athletes.
Soccer
(n = 37)
Handball
(n = 9)
p
Performance
Mean Strength (kg/%BW)0.58 ± 0.110.58 ± 0.081.0
Mean YBT (%)89.15 ± 4.7694.11 ± 5.900.035 *
FMS Total Score (0–21)16.89 ± 2.4815.22 ± 2.680.118
Profiles
Functionally Weak (%)8 (21.6%)2 (22.2%)1.0
Strength-Deficient (%)5 (13.5%)1 (11.1%)1.0
Stability-Deficient (%)6 (16.2%)1 (11.1%)1.0
No Clear Dysfunction (%)18 (48.6%)5 (55.6%)1.0
FMS
FMS Low (%)8 (21.6%)2 (22.2%)1.0
FMS Medium (%)23 (62.2%)4 (44.4%)0.456
FMS High (%)6 (16.2%)3 (33.3%)0.348
Table Legend: Continuous variables: Mean ± standard deviation. Categorical variables: Percentage of athletes in each category. Statistical tests: MW = Mann–Whitney U test, used for all continuous variables (mean strength, mean YBT, FMS total, Z-scores); F = Fisher’s exact test, used for all categorical comparisons due to the small sample size (n = 9) in the handball group. Significance: * p < 0.05.
Disclaimer/Publisher’s Note: The statements, opinions and data contained in all publications are solely those of the individual author(s) and contributor(s) and not of MDPI and/or the editor(s). MDPI and/or the editor(s) disclaim responsibility for any injury to people or property resulting from any ideas, methods, instructions or products referred to in the content.

