Article

Modeling of Historical Marine Casualty on S-100 Electronic Navigational Charts

1
Division of Marine System Engineering, National Korea Maritime and Ocean University, Busan 49112, Republic of Korea
2
Division of Maritime Information Technology, National Korea Maritime and Ocean University, Busan 49112, Republic of Korea
*
Author to whom correspondence should be addressed.
Appl. Sci. 2025, 15(12), 6432; https://doi.org/10.3390/app15126432
Submission received: 9 May 2025 / Revised: 3 June 2025 / Accepted: 5 June 2025 / Published: 7 June 2025
(This article belongs to the Special Issue Risk and Safety of Maritime Transportation)

Abstract

:
With the increasing digitalization of maritime transportation, the demand for structured and interoperable data has grown. While the S-100 framework developed by the International Hydrographic Organization (IHO) provides a foundation for standardizing maritime information, a data model for representing marine casualties has not yet been developed. As a result, past incident data—such as collisions or groundings—remain fragmented in unstructured formats and are excluded from electronic navigational systems, limiting their use in safety analysis and route planning. To address this gap, this paper proposes a data model for structuring and visualizing marine casualty information within the S-100 standard. The model was designed by defining an application schema, constructing a machine-readable feature catalogue, and developing a portrayal catalogue and custom symbology for integration into Electronic Navigational Charts (ENCs). A case study using actual casualty records was conducted to examine whether the model satisfies the structural and portrayal requirements of the S-100 framework. The proposed model enables previously unstructured casualty data to be standardized and spatially integrated into digital chart systems. This approach allows accident information to be used alongside other S-100-based data models, contributing to risk-aware route planning and future applications in smart ship operations and maritime safety services.

1. Introduction

In the past, maritime navigation primarily relied on paper nautical charts and the accumulated experience of navigators to determine safe routes. With the advancement of digital technology, traditional paper charts were gradually replaced by ENCs, enabling ships to access and interpret hydrographic information more efficiently and accurately. To support this transition and to standardize the digital encoding of chart data, the IHO developed the S-57 standard [1]. S-57 facilitated the electronic exchange of chart information and served as the basis for the production and distribution of ENCs used in Electronic Chart Display and Information Systems (ECDIS). However, S-57 was designed with a fixed data structure tailored specifically for static chart features, and its architecture lacked the flexibility to accommodate new and dynamic types of maritime information, such as time-dependent environmental data, traffic updates, and complex metadata. These limitations became increasingly apparent with the growing demand for integrated and interoperable navigational services. As a result, the IHO introduced the S-100 Universal Hydrographic Data Model (UHDM) as a more versatile and extensible framework for the future of maritime data exchange [2].
Following the adoption of S-100, initial development efforts focused on creating data models that represent fundamental chart features previously supported by S-57. These models provide the core base layer of digital navigational information and are essential for ensuring safe passage. Once these foundational data models were in place, additional efforts were made to develop a range of supplementary data models aimed at enhancing navigational safety. These include models for representing bathymetry, tidal information, surface currents, and navigational warnings. Many of these models are now being applied in digital chart systems to support both real-time monitoring and voyage planning [3,4,5]. Despite this expansion, a significant gap remains within the current set of S-100-based data models: the absence of a model for representing marine casualty. In maritime operations, past incidents such as groundings, collisions, and structural failures often contain valuable insights into navigational risks. However, these insights are typically passed down informally through the personal experience of captains and navigators, without being structured or made accessible in digital navigation systems. In contrast, the land transportation sector systematically utilizes both real-time and past incident data to identify high-risk areas and enhance safety outcomes [6,7,8,9,10].
If casualty data were structured and integrated within the S-100 framework, it could serve as a valuable resource for route planning, risk analysis, and safety management. While several prior studies have attempted to organize casualty data for archival or analytical purposes, their outputs were not designed to be interoperable with the S-100-based environment and thus cannot be used within electronic navigational systems [11,12]. To address this gap, this study proposes a new data model for representing and exchanging marine casualty, developed in full alignment with the S-100 modeling methodology. The proposed model defines both a data storage structure—interpretable by both humans and machines—and a portrayal structure that specifies how this data can be visualized within electronic chart systems. To examine the proposed data model, a case study was conducted using real-world casualty records from the Global Integrated Shipping Information System (GISIS) of the International Maritime Organization (IMO). The goal was to verify S-100 compliance and assess its potential use in navigational data systems.
By introducing a structured approach to managing marine casualty, this study contributes an extension to the S-100 framework that addresses an area previously not covered by existing data models. When used in combination with real-time data sources, it may improve situational awareness by offering both current and past perspectives. The proposed model’s compatibility with other standardized data models within the S-100 framework enables integration, thereby supporting risk-informed decision-making and effective operational coordination in navigational systems [13]. The model also lays a foundation for future applications that depend on consistent and interoperable datasets, particularly as digitalization and automation continue to advance in the maritime transportation sector.
This paper is organized as follows. Section 2 reviews the S-100 standard and relevant data modeling methods, and highlights the necessity of this research based on a review of related literature. Section 3 defines and designs a data model for structuring marine casualties in accordance with the S-100 framework. Section 4 visualizes real-world casualty data structured according to the proposed model using an S-100-based viewer to confirm its compliance with the standard. Section 5 discusses the applicability and limitations of the model, and Section 6 concludes the paper and suggests directions for future work.

2. Background

2.1. Evolution of Electronic Navigational Charts

The S-57 standard played a foundational role in digital chart production, but its fixed structure limited support for both dynamic updates and the integration of increasingly diverse maritime information. To address these limitations, the IHO developed the S-100 UHDM [2]. S-100 is designed with a flexible and modular structure to more effectively represent marine geospatial information, and it can accommodate a variety of technical data types including static data, time-series, grid-based, and three-dimensional data. One of the key features of S-100 is its registry-based architecture, which supports the systematic creation and maintenance of documents that define maritime data elements and their portrayal. This structure facilitates easier updates across systems and enhances interoperability. Recognizing the benefits of S-100, the IMO has announced that all new ECDIS installations must comply with S-100-based systems starting from 1 January 2029 [14]. This regulatory shift reinforces the importance of transitioning to S-100 and underlines the need to develop data models that can fully leverage its capabilities.
S-100 provides a foundational framework for handling marine geospatial information, enabling each domain to define data structures, encoding formats, and visualization methods tailored to their specific needs. Building on this framework, a wide range of domain-specific data models—such as those for aids to navigation, navigational warnings, and marine environmental data—have been developed [15]. These models enable a more integrated and layered representation of navigational information within digital chart systems, thereby enhancing situational awareness and voyage planning for navigators.
Among the various data models developed under the S-100 framework, one that is particularly relevant to the subject of this study is the ‘Navigational Warnings’ model designed to support the delivery of real-time navigational safety information [16]. This model enables the structured and spatially referenced provision of hazard alerts, such as warnings related to maritime accidents, military exercises, or severe weather. The Australian Maritime Safety Authority (AMSA) has implemented this model in testbed services, where real-time navigational warnings are transmitted, structured, and visualized directly on ENCs [17]. These services demonstrate how S-100-based data models can be applied in operational environments to enhance situational awareness by overlaying time-sensitive safety information on digital charts in an intuitive and spatially meaningful way. Figure 1 shows a screenshot of AMSA’s testbed system, where real-time navigational warnings are displayed on the chart along with a list of corresponding messages, illustrating how such information is integrated and portrayed in practice.

2.2. S-100-Based Data Modeling Methods

The S-100 framework defines a structured and standardized approach for developing domain-specific data models in the maritime domain. It extends the General Feature Model (GFM) defined in ISO 19109, which provides a conceptual foundation for representing real-world geographic phenomena, their attributes, and relationships [2,18]. The goal of S-100 is to enable interoperable, flexible, and extensible data exchange by separating the logical structure of data from its portrayal and encoding.
To develop an S-100-based data model, a set of interrelated components must be defined and maintained as a package. These include the application schema, Feature Catalogue (FC), Portrayal Catalogue (PC), and symbology. The application schema, defined using Unified Modeling Language (UML), represents the conceptual structure of the data and is primarily intended to be human-readable. It serves as a logical blueprint for how features, attributes, and their associations are organized. The FC provides a standardized, machine-readable specification of the same content, enabling consistent data encoding, validation, and interoperability across systems. The PC defines how features should be visually represented in navigational systems, including symbols, colors, and display rules. Symbology resources support consistent visual rendering in ECDIS and other platforms. These components are tightly coupled and must be designed cohesively to ensure consistency in how maritime information is structured, exchanged, and displayed.
Table 1 describes the key components defined during data modeling and how they are represented in the application schema. For example, a feature type represents real-world spatial objects such as aids to navigation and is used as core information directly displayed on ENCs. An information type contains non-spatial auxiliary data associated with a feature, such as the contact information of the managing authority linked to an aid to navigation. Attribute types describe the characteristics of these objects—the height of an aid to navigation may be defined as a real number, availability as a fixed-value enumeration, and color as an extensible code list. Objects can also have relationships with each other, allowing structures such as a single route being linked to multiple aids to navigation. All of these elements defined in the application schema exist at the type level, and the actual data created based on these definitions is referred to as an instance.
In the S-100 framework, naming conventions are strictly defined to ensure consistency and clarity in how model elements are structured. When names consist of multiple words, spaces are omitted; instead, each word begins with an uppercase letter to improve readability. This style is commonly referred to as CamelCase, with two variations adopted in S-100: UpperCamelCase, where the first letter of the name is capitalized, and lowerCamelCase, where it is lowercase. Feature types and information types must use UpperCamelCase (e.g., Wreck, AtoNInformation), whereas attribute names must follow lowerCamelCase (e.g., color, horizontalAccuracy). These conventions are not optional; they are enforced throughout the modeling process to ensure uniformity and to support reliable data exchange and system interoperability.

2.3. Literature Review

To enhance the safety of maritime transportation, previous research has examined the use of real-time data for route planning and navigational support. Lu et al. [19] proposed a system that automatically generates collision-avoidance routes for autonomous ships using a domain-based Predictive Avoidance Domain (PAD), and visualizes the results on ENCs to support real-time decision-making by navigators. Pan et al. [20] developed an intelligent route guidance system capable of dynamically steering vessels within temporarily restricted areas by integrating real-time data from Automatic Identification System (AIS), radar, and Closed Circuit Television (CCTV). Lee et al. [21] analyzed multi-dimensional AIS data using a Density-Based Spatial Clustering Of Applications With Noise (DBSCAN)-based clustering algorithm, and visualized maritime traffic flow and density on ENCs to support both situational awareness and route planning. Similarly, Fagerhaug et al. [22] proposed a real-time coastal navigation optimization framework for autonomous ships using a graph-based search algorithm that combines AIS information and ENC data to improve route safety.
In addition to real-time sources, some studies have explored the use of historical data to improve navigational safety. Lei et al. [23] linked AIS and radar data based on vessel trajectories in inland waterways to analyze navigational behavior and support intelligent navigation. Li and Yang [24] used machine learning techniques to train models on AIS-based routes, enabling autonomous ships to emulate typical vessel behavior in generating safe navigation paths. Research on marine casualty data has also been conducted to support safety assessment and risk prediction. Zhang et al. [11] performed a spatial analysis of global marine casualty distributions, while Munim et al. [12] proposed a model to predict casualty risk using AutoML techniques. While these studies have provided valuable insights into data-driven approaches to maritime safety, most research dealing with marine casualties has structured their data according to specific application needs. This practice often limits interoperability across platforms and reduces the potential for data reuse.
Recent research has demonstrated how standardized datasets within the S-100 framework can be integrated to support various maritime applications. Palma et al. [3] demonstrated that optimal route planning could be achieved by utilizing S-100-based data models for environmental and meteorological information. Jang et al. [4] and Choi et al. [5] also confirmed that S-100-based data integration is effective in improving both navigational decision-making and operational performance. Contarinis et al. [13] emphasized that the open and extensible nature of the S-100 framework enables data integration not only for route planning, but also for broader maritime applications such as environmental monitoring and resource management. Lee et al. [25] analyzed the design and implementation considerations of S-100-based data models from a software engineering perspective to promote consistency and system-level compatibility. Cao et al. [26] conducted a comprehensive review of key trends in marine accident research, but the studies on data structuring or modeling were not included in their analysis.
Despite these efforts, no standardized data model currently exists for representing marine casualty data within the S-100 framework. Most existing studies either treat such data in isolation or rely on non-standardized formats, which limits their reusability and integration into modern navigational systems. Therefore, to support risk-informed route planning and enable structured use of casualty data within digital navigation environments, there is a clear need for a data model that conforms to the principles of the S-100 standard. This study addresses that gap by proposing a structured and interoperable data model for marine casualties, aiming to support enhanced safety, visualization, and maritime data integration.

3. Method: Data Modeling of Marine Casualty

This section describes how the proposed data model was developed to represent marine casualty information in accordance with the S-100 standard. The model was designed to provide a structured and interoperable format for encoding casualty data into digital representations suitable for use in ENCs. The overall development process followed the standard modeling methodology defined by the S-100 framework and included key stages such as requirements analysis, schema design, and portrayal configuration [27]. Figure 2 provides a visual summary of this development process, illustrating how each step contributes to the construction of a complete S-100-compliant data model package.
The application schema was developed using Enterprise Architect version 10, a UML-based modeling tool widely used for geospatial data standardization [25]. The FC and PC were authored directly in Extensible Markup Language (XML) format in accordance with the S-100 standard structure. The accompanying symbology was created as a set of Scalable Vector Graphics (SVG) image files consistent with the defined portrayal rules. All resulting model components—including the application schema, FC, PC, and symbology—have been published in a GitHub repository for reference and use (see Data Availability Statement).

3.1. Requirements Identification

Requirements analysis is the starting point of data modeling, aimed at identifying and formalizing the real-world entities, attributes, and relationships covered by the data model. This process provides the foundation for the definition of the application schema and the development of the FC.
To establish a foundation for structuring marine casualty data, three representative sources were reviewed: the GISIS managed by the IMO [28], the Marine Accident Investigation Branch (MAIB) of the United Kingdom [29], and the Maritime Transportation Safety Information System (MTIS) of the Republic of Korea [30]. These datasets were selected due to their relevance, public accessibility, and coverage of incident types.
While all three contain useful information, they differ in structure and terminology, requiring a comparative analysis to identify common elements and reconcile classification differences. Among the datasets, certain attributes were commonly available and consistently structured, including incident type, time of occurrence, and geographical location. These were identified as core attributes essential for spatial representation and integration into ENCs. In contrast, information on human casualties—such as fatalities, injuries, and missing persons—was explicitly provided in MTIS, while in GISIS and MAIB, such information had to be extracted from unstructured textual descriptions.
Regarding incident classification, both GISIS and MAIB follow the IMO MSC-MEPC.3/Circ.4/Rev.1 guidelines [31], whereas MTIS applies a separate taxonomy based on the Administrative Guidelines on the Investigation of and Inquiry into Marine Accidents established by the Republic of Korea [32]. Although these classification systems share similar conceptual foundations, they differ in terminology, granularity, and categorization logic, making direct alignment challenging. To enable consistent structuring and facilitate integration into a unified model, a reclassification process was carried out. This involved identifying semantically equivalent categories across the datasets and evaluating their applicability for spatial portrayal in navigational systems. Table 2 presents the resulting correspondence matrix, which also helped to reveal overlapping or ambiguous categories that required consolidation or clarification.
For example, ‘collision’ and ‘contact’ are both physical impact events with similar implications for route planning and navigational response. In the context of digital chart systems, combining them into a single category improves clarity and usability. In contrast, some categories such as ‘marine pollution’ represent secondary consequences of other incidents and are not suitable as primary classifications. Similarly, incidents such as ‘occupational accidents’, which occur internally on board and lack a clear spatial dimension, were excluded due to their limited applicability to location-based decision-making. Based on these criteria, this paper established a classification scheme that prioritizes incident types with spatial significance and relevance to maritime transportation safety. The selected categories form the basis for defining feature types in the subsequent data modeling process.

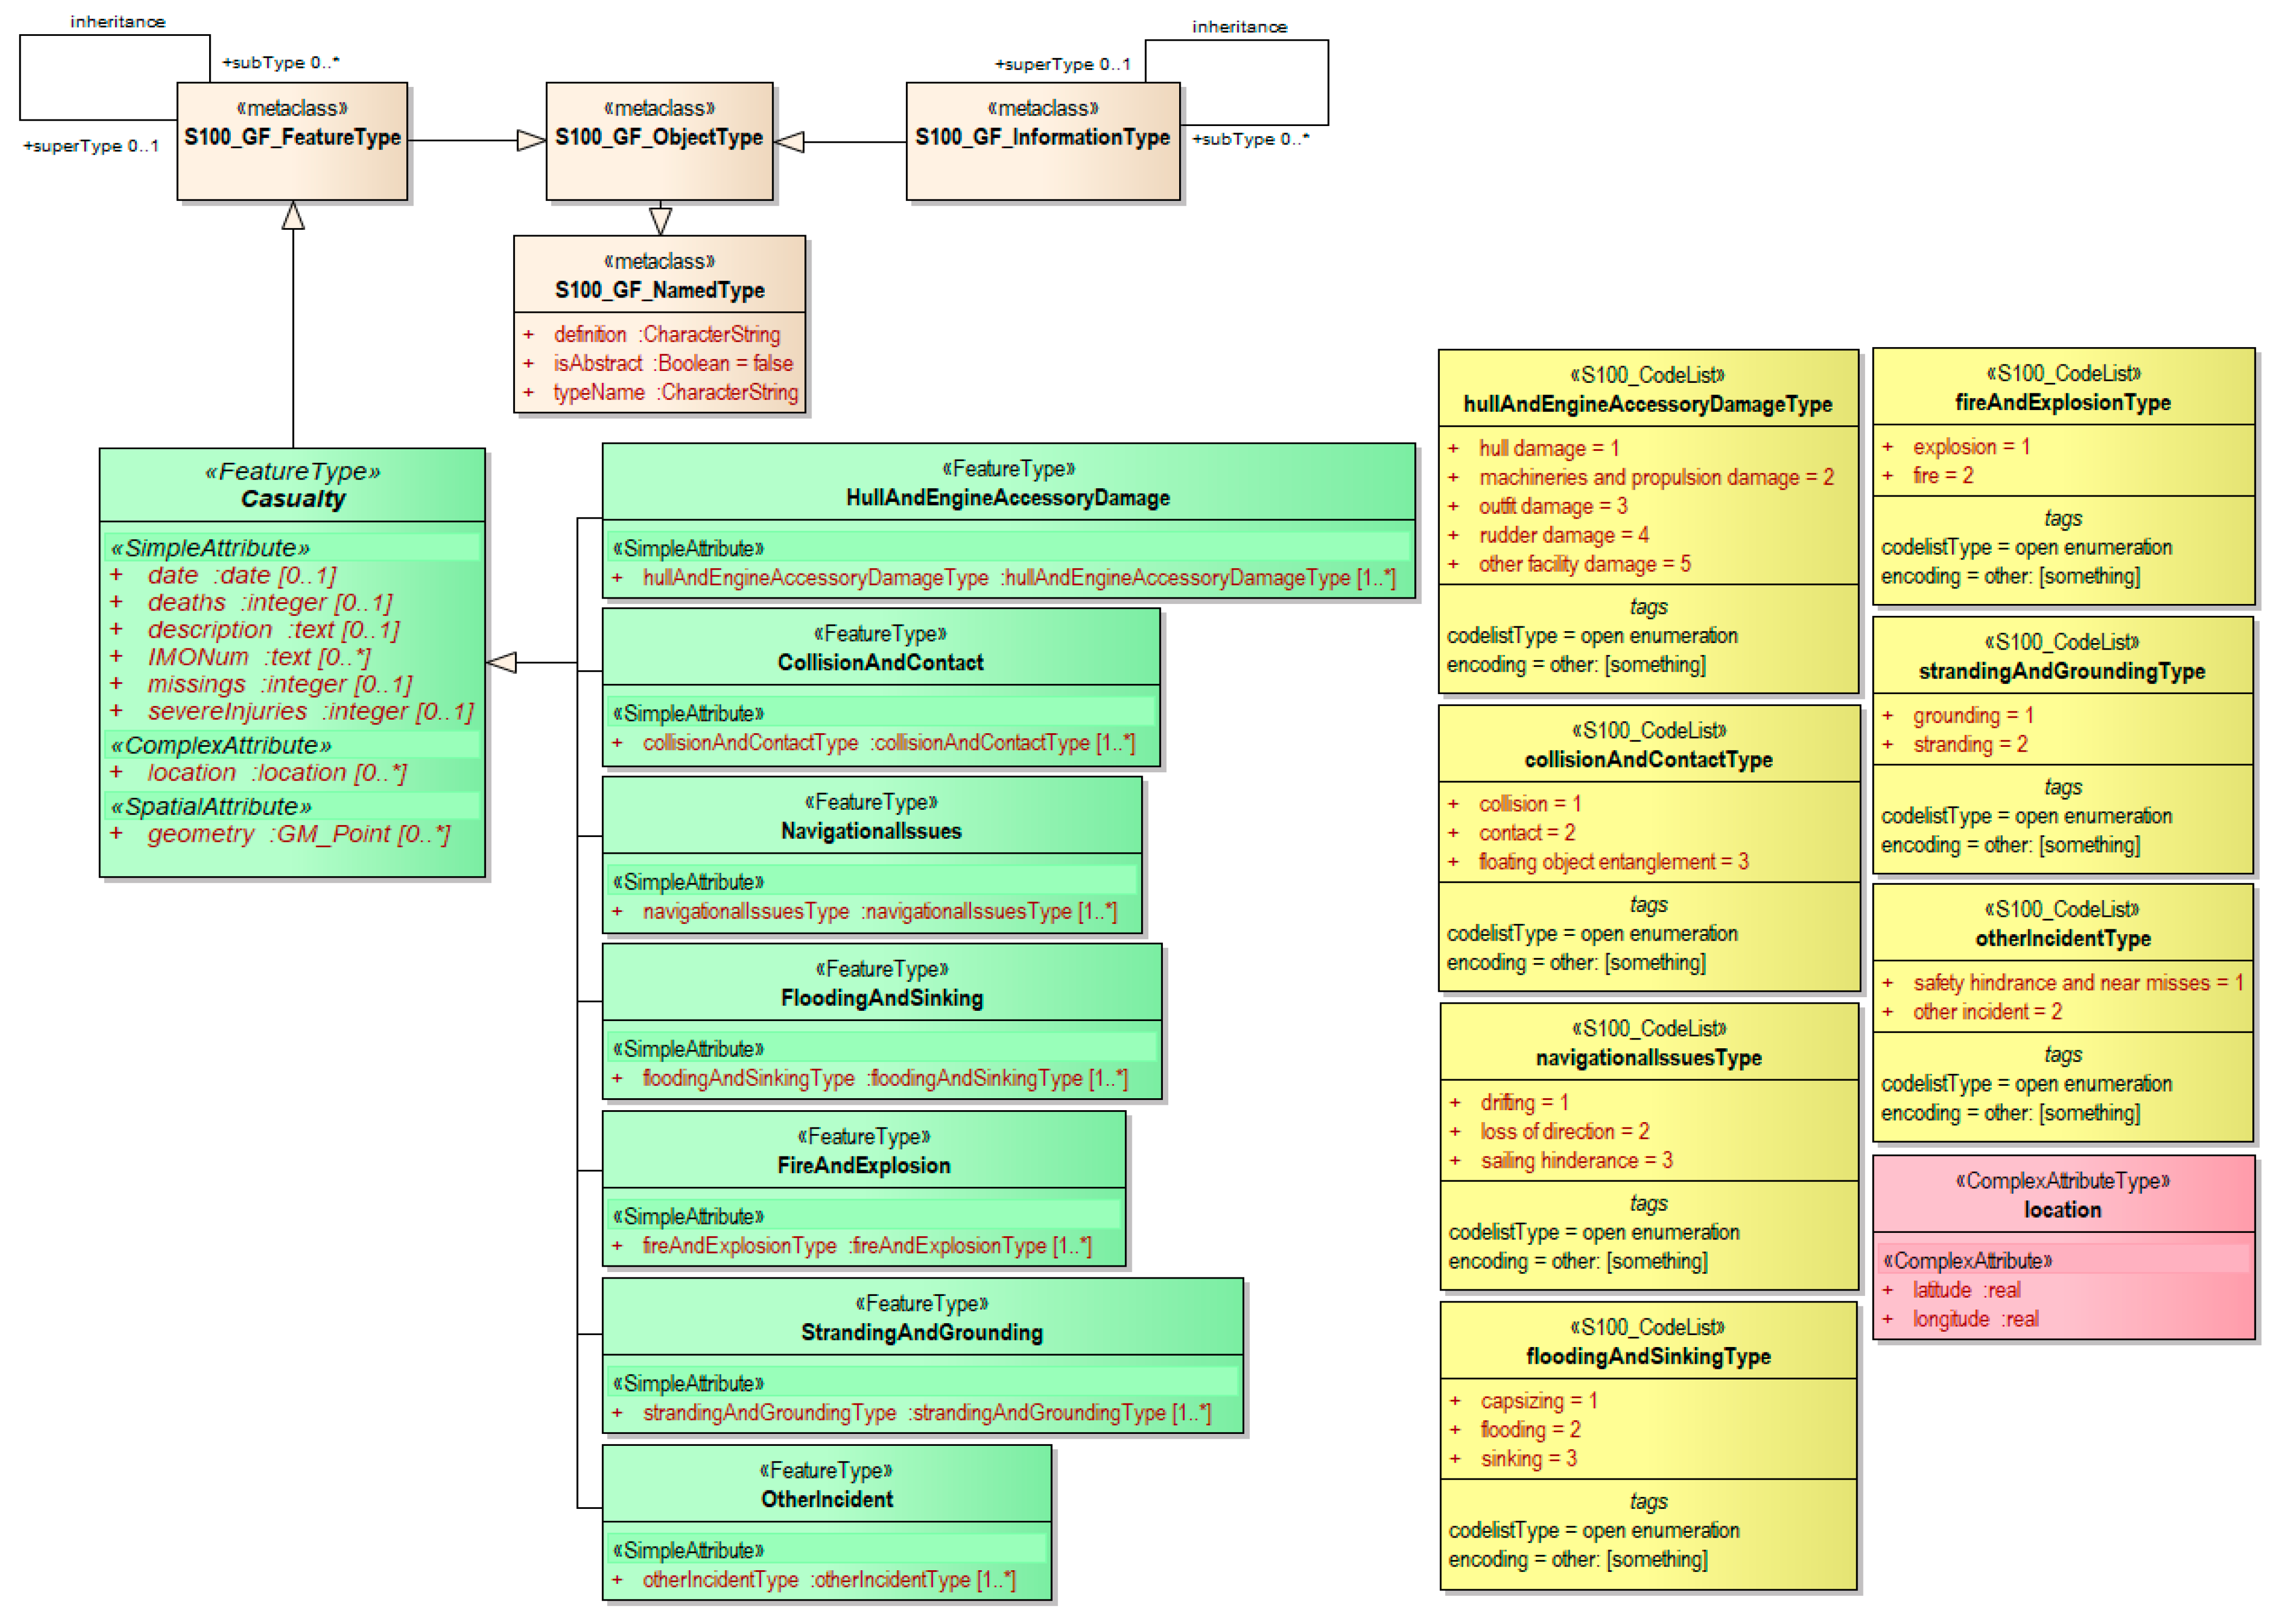
3.2. Application Schema Definition

Application schema definition is the process of formally defining data types, attributes, and relationships based on the information elements and requirements identified. This step provides the structural foundation that ensures data can be consistently generated, interpreted, and exchanged within application systems such as ECDIS. It also serves as the starting point for creating the FC and datasets. As required by the S-100 standard, the application schema is formally expressed using UML and is designed in accordance with the structure and rules defined in the GFM.
The key requirements identified for modeling marine casualty data are ensuring consistent representation of attributes common to all types of incidents, capturing characteristics specific to each incident type, and enabling extensibility to accommodate emerging types of incidents. These requirements are reflected in the application schema defined in this study, which is presented as a UML diagram in Figure 3. To define a structure that includes common attributes, a feature type named Casualty was created and is structured by inheriting from the upper-level element (S100_GF_FeatureType) defined in the S-100 GFM as the basic structure for feature type definition. The requirement to distinguish incidents based on their spatial and functional characteristics was addressed by defining multiple concrete feature types that inherit from Casualty. This approach eliminates the need to repeatedly define shared attributes for each incident type and enables the addition of specialized attributes for individual types. As a result, a hierarchical structure was established that accommodates both commonality and specificity.
In anticipation of the increasing diversity of incident types due to developments such as smart ship technologies, the classification of incident types was defined using S100_CodeList. The code lists defined as classes on the right side of the diagram contain enumerated values representing incident subtypes and are designed to support extension without requiring structural changes to the model. When new incident types need to be added, the application schema must be updated accordingly, and the new code list values should be submitted to the IHO Registry. These submissions are reviewed by the appropriate domain control body and must be formally approved before the values can be officially registered and used within S-100-compliant systems [2].
Table 3 presents the structure of the marine casualty data model defined in this study, showing all feature types illustrated in Figure 3 along with their defined attributes and structural relationships. The Casualty feature type is defined to include only the attributes that are commonly applicable to all types of marine casualties. This feature contains only common properties and does not represent any specific incident type, so it is designated as an abstract feature type. This prevents unspecified incidents from being included in the dataset and ensures structural consistency by allowing concrete subtypes to inherit its attributes. Each concrete feature type inherits from Casualty and defines one additional attribute to represent a specific subclass of incidents.
Table 4 presents the attributes of the abstract feature type Casualty, which includes common information shared across different types of marine incidents. This feature includes attributes such as the date and time of the incident, human casualties, a textual description of the incident, vessel identification information, and the location of the event. The location attribute is defined as a complex attribute comprising latitude and longitude. In the S-100 standard, complex attributes are modeled as separate classes composed of simple attributes. The geometry attribute has the data type GM_Point, which is a spatial object based on the ISO 19107, Spatial schema [33]. It represents a point feature that enables the incident location to be visually displayed on ENCs. These attributes are inherited by all specific feature types, ensuring structural consistency across the data model. The column labeled ‘Mult.’ describes the multiplicity of each attribute, or how many times the attribute may appear in a single feature instance. This is expressed in the format ‘[min..max]’, where min represents the minimum number of occurrences (e.g., ‘0’ for optional), and max represents the maximum number (e.g., ‘*’ for unlimited repetition). For example, a multiplicity of ‘[0..1]’ for the deaths attribute means that it is optional and may contain at most one value, without implying an actual limit on the number of deaths. In contrast, attributes such as IMONum have a multiplicity of ‘[0..*]’, allowing them to appear multiple times within a single instance. This enables the model to represent incidents involving multiple vessels or descriptive records.
Table 5 presents specific feature types derived from Casualty along with their attributes. These types were defined by analyzing collected incident data and grouping similar cases into distinct categories. Each feature’s attribute uses the data type S100_CodeList, which supports extensible enumerated values tailored to the classification requirements of each incident type. In accordance with the S-100 standard, this modeling approach defines code lists as separate classes to manage both predefined and extensible value sets consistently. The multiplicity of each attribute is set to [1..*], indicating that every incident must be assigned at least one classification code. This ensures that all feature instances are meaningfully categorized and that multiple applicable subtypes can be represented when necessary. For instance, the HullAndEngineAccessoryDamage feature type includes an attribute named hullAndEngineAccessoryDamageType, which can have values such as hull damage, machinery and propulsion damage, and others. This feature enables mechanical failure information to be visualized on ENCs, helping navigators identify areas where similar issues have occurred and take preventive measures or exercise caution.
The CollisionAndContact feature type structures contact incidents such as vessel-to-vessel collisions, contact with structures, and entanglement with floating objects. Providing this information supports the identification of areas where such incidents have occurred frequently, enabling safer route planning or increased caution in those zones. The NavigationalIssues feature type covers navigational control problems including drifting, loss of direction, and sailing hindrances. This enables users to understand which waters may pose navigational challenges, helping them evaluate route options more effectively. The FloodingAndSinking feature type includes incidents such as flooding, sinking, and capsizing. When displayed on electronic charts, this data helps identify areas where structural failures have been reported and may, in the future, be integrated with weather information to enhance situational awareness. The FireAndExplosion feature type captures incidents involving fires and explosions. By referencing this information, vessels—particularly those carrying hazardous materials—can avoid areas with a history of such events or plan appropriate safety measures. The StrandingAndGrounding feature type includes incidents involving contact with the seafloor or grounding in shallow waters. Highlighting these locations can inform decisions about depth-related route adjustments. This information could also be linked to under keel clearance management data models to support safer navigation in shallow or constrained waters. The OtherIncident feature type accommodates incidents that fall outside predefined categories, such as near misses or potentially unsafe behaviors. Incident types emerging from evolving technologies such as smart ships can be represented by extending the associated code lists. This structured representation of marine casualty data can serve as a foundation for decision-support tools.

3.3. Feature Catalogue Development

The FC is a machine-readable document that describes the data structures defined in the application schema. It includes structured definitions of each feature type, along with their associated attributes, relationships, and code lists. These definitions allow S-100-based systems to consistently interpret and visualize data during dataset creation and display on ENCs.
In this study, an FC was created based on the proposed application schema. The FC was implemented in XML format to ensure machine readability, allowing systems like ECDIS to interpret the structure and semantics of the data. This approach provides a foundation for visualization and interoperability. The completed FC is publicly available and can be accessed through the GitHub repository referenced in the data availability statement section.

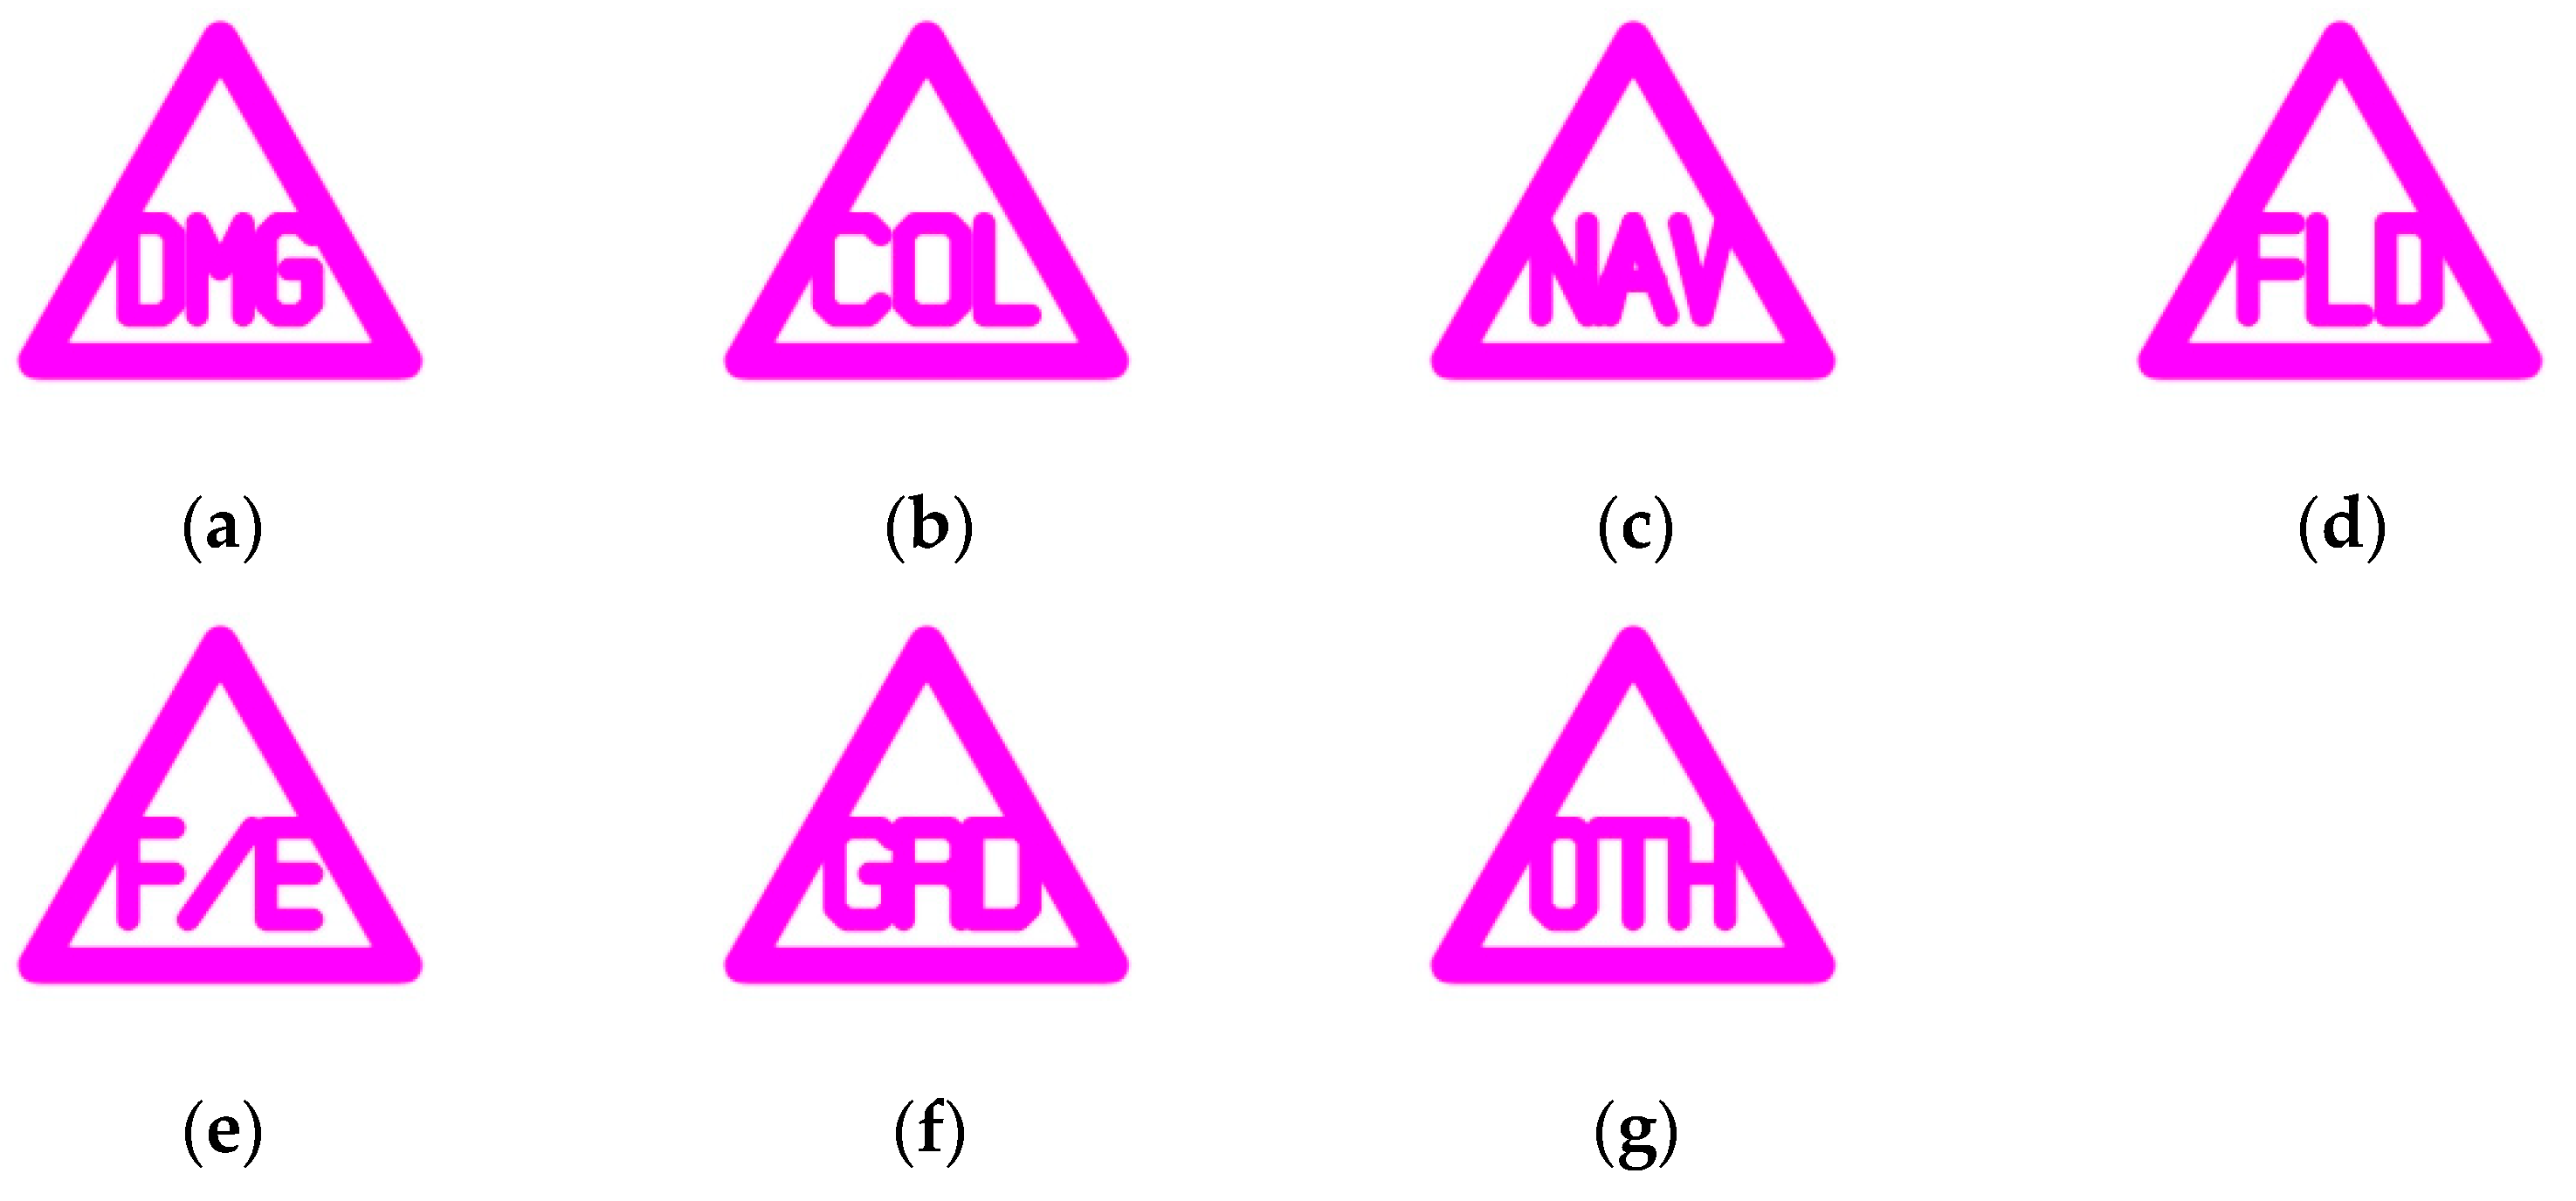
3.4. Portrayal Catalogue Development

The PC defines the rules for visually displaying structured marine casualties on ENCs. It enables users to intuitively recognize and interpret incident information. Based on the feature and attribute type defined in the FC, the PC specifies how each feature should be portrayed—through symbols, colors, lines, and area styles—ensuring consistent visual representation across systems. These portrayal rules are structured to ensure consistent visualization across different systems. The PC was implemented in XML format, and is designed to operate in conjunction with the FC, allowing S-100-compliant systems to render marine casualty features in a standardized way. The XML-based PC document is publicly available in the GitHub repository referenced in the data availability section.
Since all marine casualty features are represented as point geometries, corresponding symbology was developed to match the portrayal requirements for point-based features. A set of triangular warning symbols was created for this purpose, with each symbol incorporating an abbreviation to indicate the specific category of the incident. Figure 4 shows the complete set of these symbols, which provide a clear visual distinction between the different types of marine casualties on ENCs.

4. Case Study

This case study demonstrates the applicability of the proposed S-100-based data model by applying it to a large-scale marine casualty dataset and validating its compatibility with S-100-compliant systems. The study focuses on verifying whether real-world incident data can be structured, encoded, and visualized in accordance with the model specifications, thus confirming its practical relevance for integration into navigational support systems.

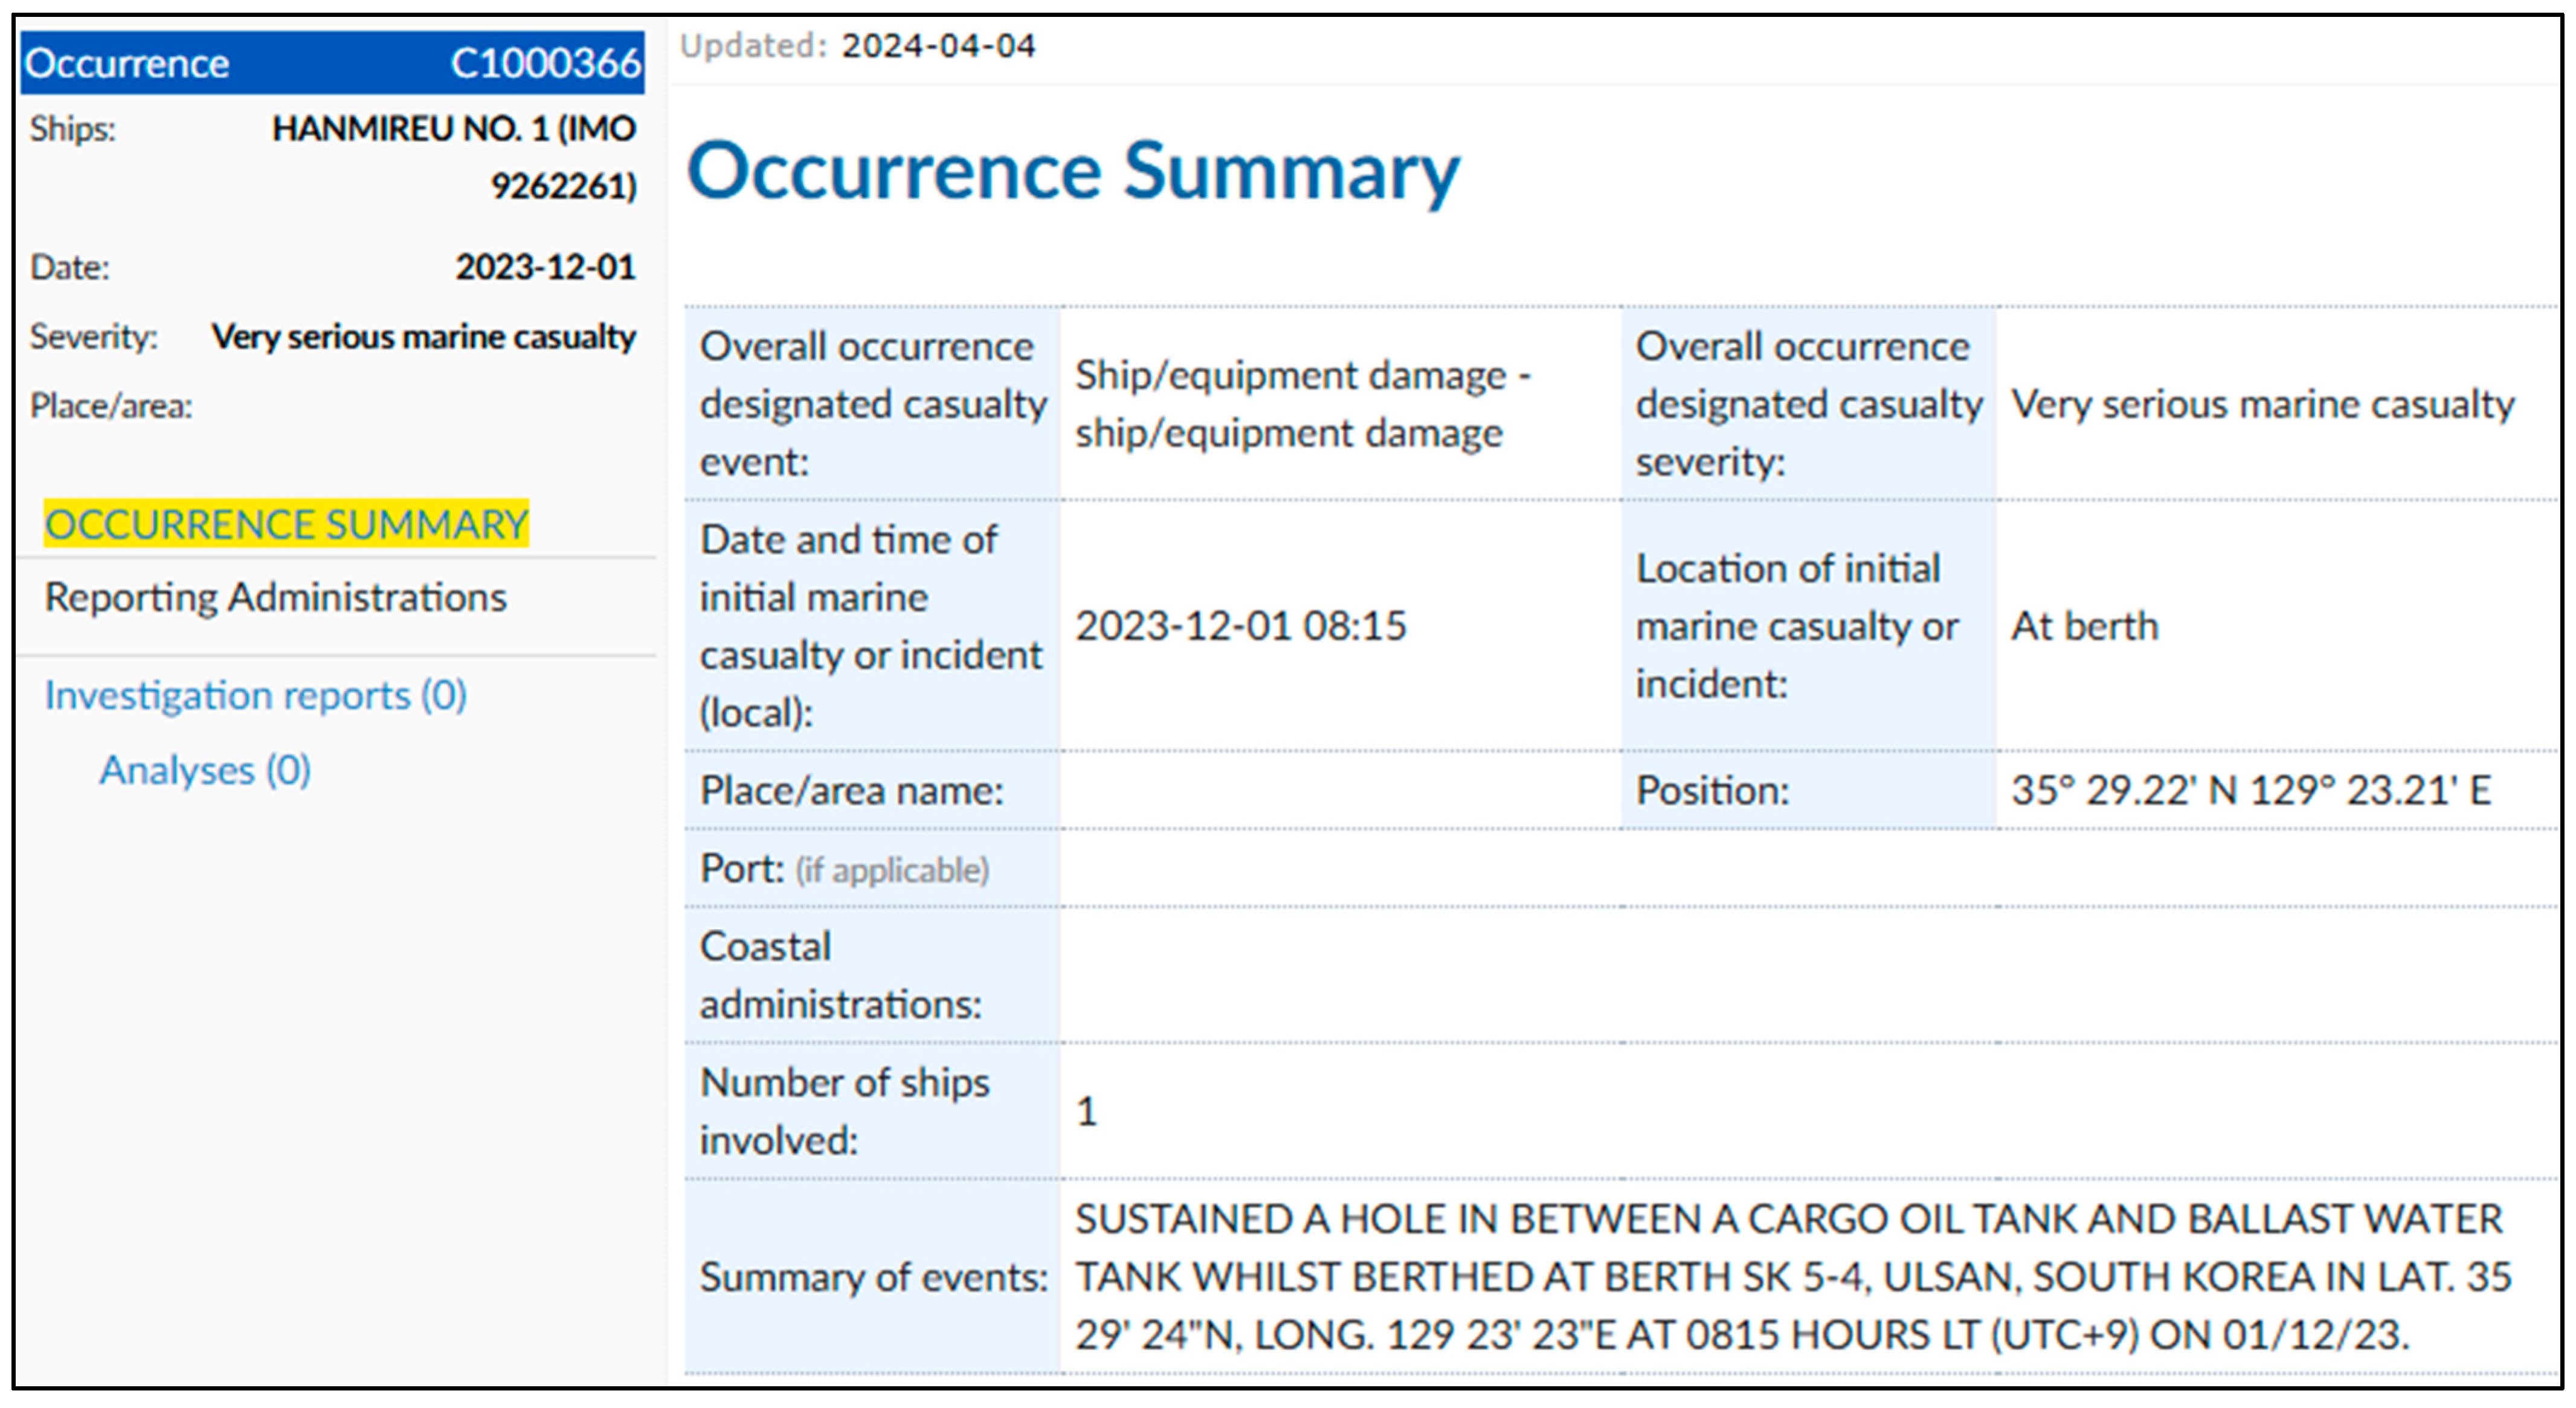
4.1. Data Collection and Preprocessing

Marine casualty reports were collected from three major sources. These reports provide official and reliable data on maritime accidents, each with differing levels of structure and detail. In total, 21,539 records were gathered from incidents reported between 2020 and 2024—454 from GISIS, 4354 from MAIB, and 16,731 from MTIS. Table 6 provides a summary of the sources, countries of origin, record counts, and a brief description of each dataset’s characteristics. These data formed the basis for developing and testing the proposed model, enabling the construction of a representative and heterogeneous casualty dataset for model evaluation.
The structure and format of the collected data exhibited notable variation across sources. Both the MAIB and MTIS datasets are semi-structured, following predefined field formats while also containing narrative fields that require contextual interpretation. Similarly, GISIS data is provided in a semi-structured tabular form; however, access to detailed case descriptions typically requires navigating to individual report pages. For instance, as shown in Figure 5, each GISIS record includes a summary view of key attributes—such as the incident type, location, and date—alongside unstructured narrative text describing the event. This layout, while informative, necessitates manual interpretation for consistent classification and structuring.
To ensure consistency across the heterogeneous sources, a rule-based classification procedure was applied based on the comparative taxonomy described in Table 2. This allowed all records to be categorized into seven unified incident types regardless of their original classification schemes. The results of this categorization process are presented in Table 7, which shows the number of classified incidents per category from each data source.

4.2. Manual Mapping to Model Attributes

To structure the collected casualty records in accordance with the proposed data model, a manual mapping process was applied. While the classification of incident types was largely handled during the preprocessing stage through a rule-based approach, the remaining attributes—such as vessel name, ship type, and date of occurrence—required careful manual extraction and interpretation.
Many records, particularly those from GISIS and MAIB, included narrative fields or inconsistently formatted information that did not directly correspond to the model’s predefined attribute structure. To address this, domain experts manually reviewed each record to populate the relevant fields in the feature schema. Table 8 provides examples of selected GISIS records that were used in the mapping process. Each entry includes key elements such as reference ID, vessel name, ship type, date of incident, and the incident category that had been preprocessed. These records demonstrate the practical feasibility of transforming semi-structured casualty data into a model-compliant format through combined rule-based and manual efforts.

4.3. Data Construction and Encoding

Once the attribute values were manually mapped for each selected marine casualty case, the structured data was prepared for encoding in compliance with the S-100 framework. The transformation process involved aligning each record with the feature types and attribute definitions specified in the application schema. To ensure interoperability with S-100-based systems, the data was encoded using Geography Markup Language (GML), a widely supported XML-based encoding format.
Table 9 presents the structured attribute values extracted from the raw GISIS reports. Each column represents a different incident category, and the rows indicate specific attributes defined in the proposed data model, such as the incident date, IMO number, number of casualties, location, description, and incident subtype. The values were organized according to the standardized attribute structure defined in the feature catalogue. In particular, the ‘Subtype’ row indicates the specific subcategory selected from the corresponding code list defined for each feature type. Using these structured values, a GML-based dataset was constructed for use in S-100-compliant visualization systems.

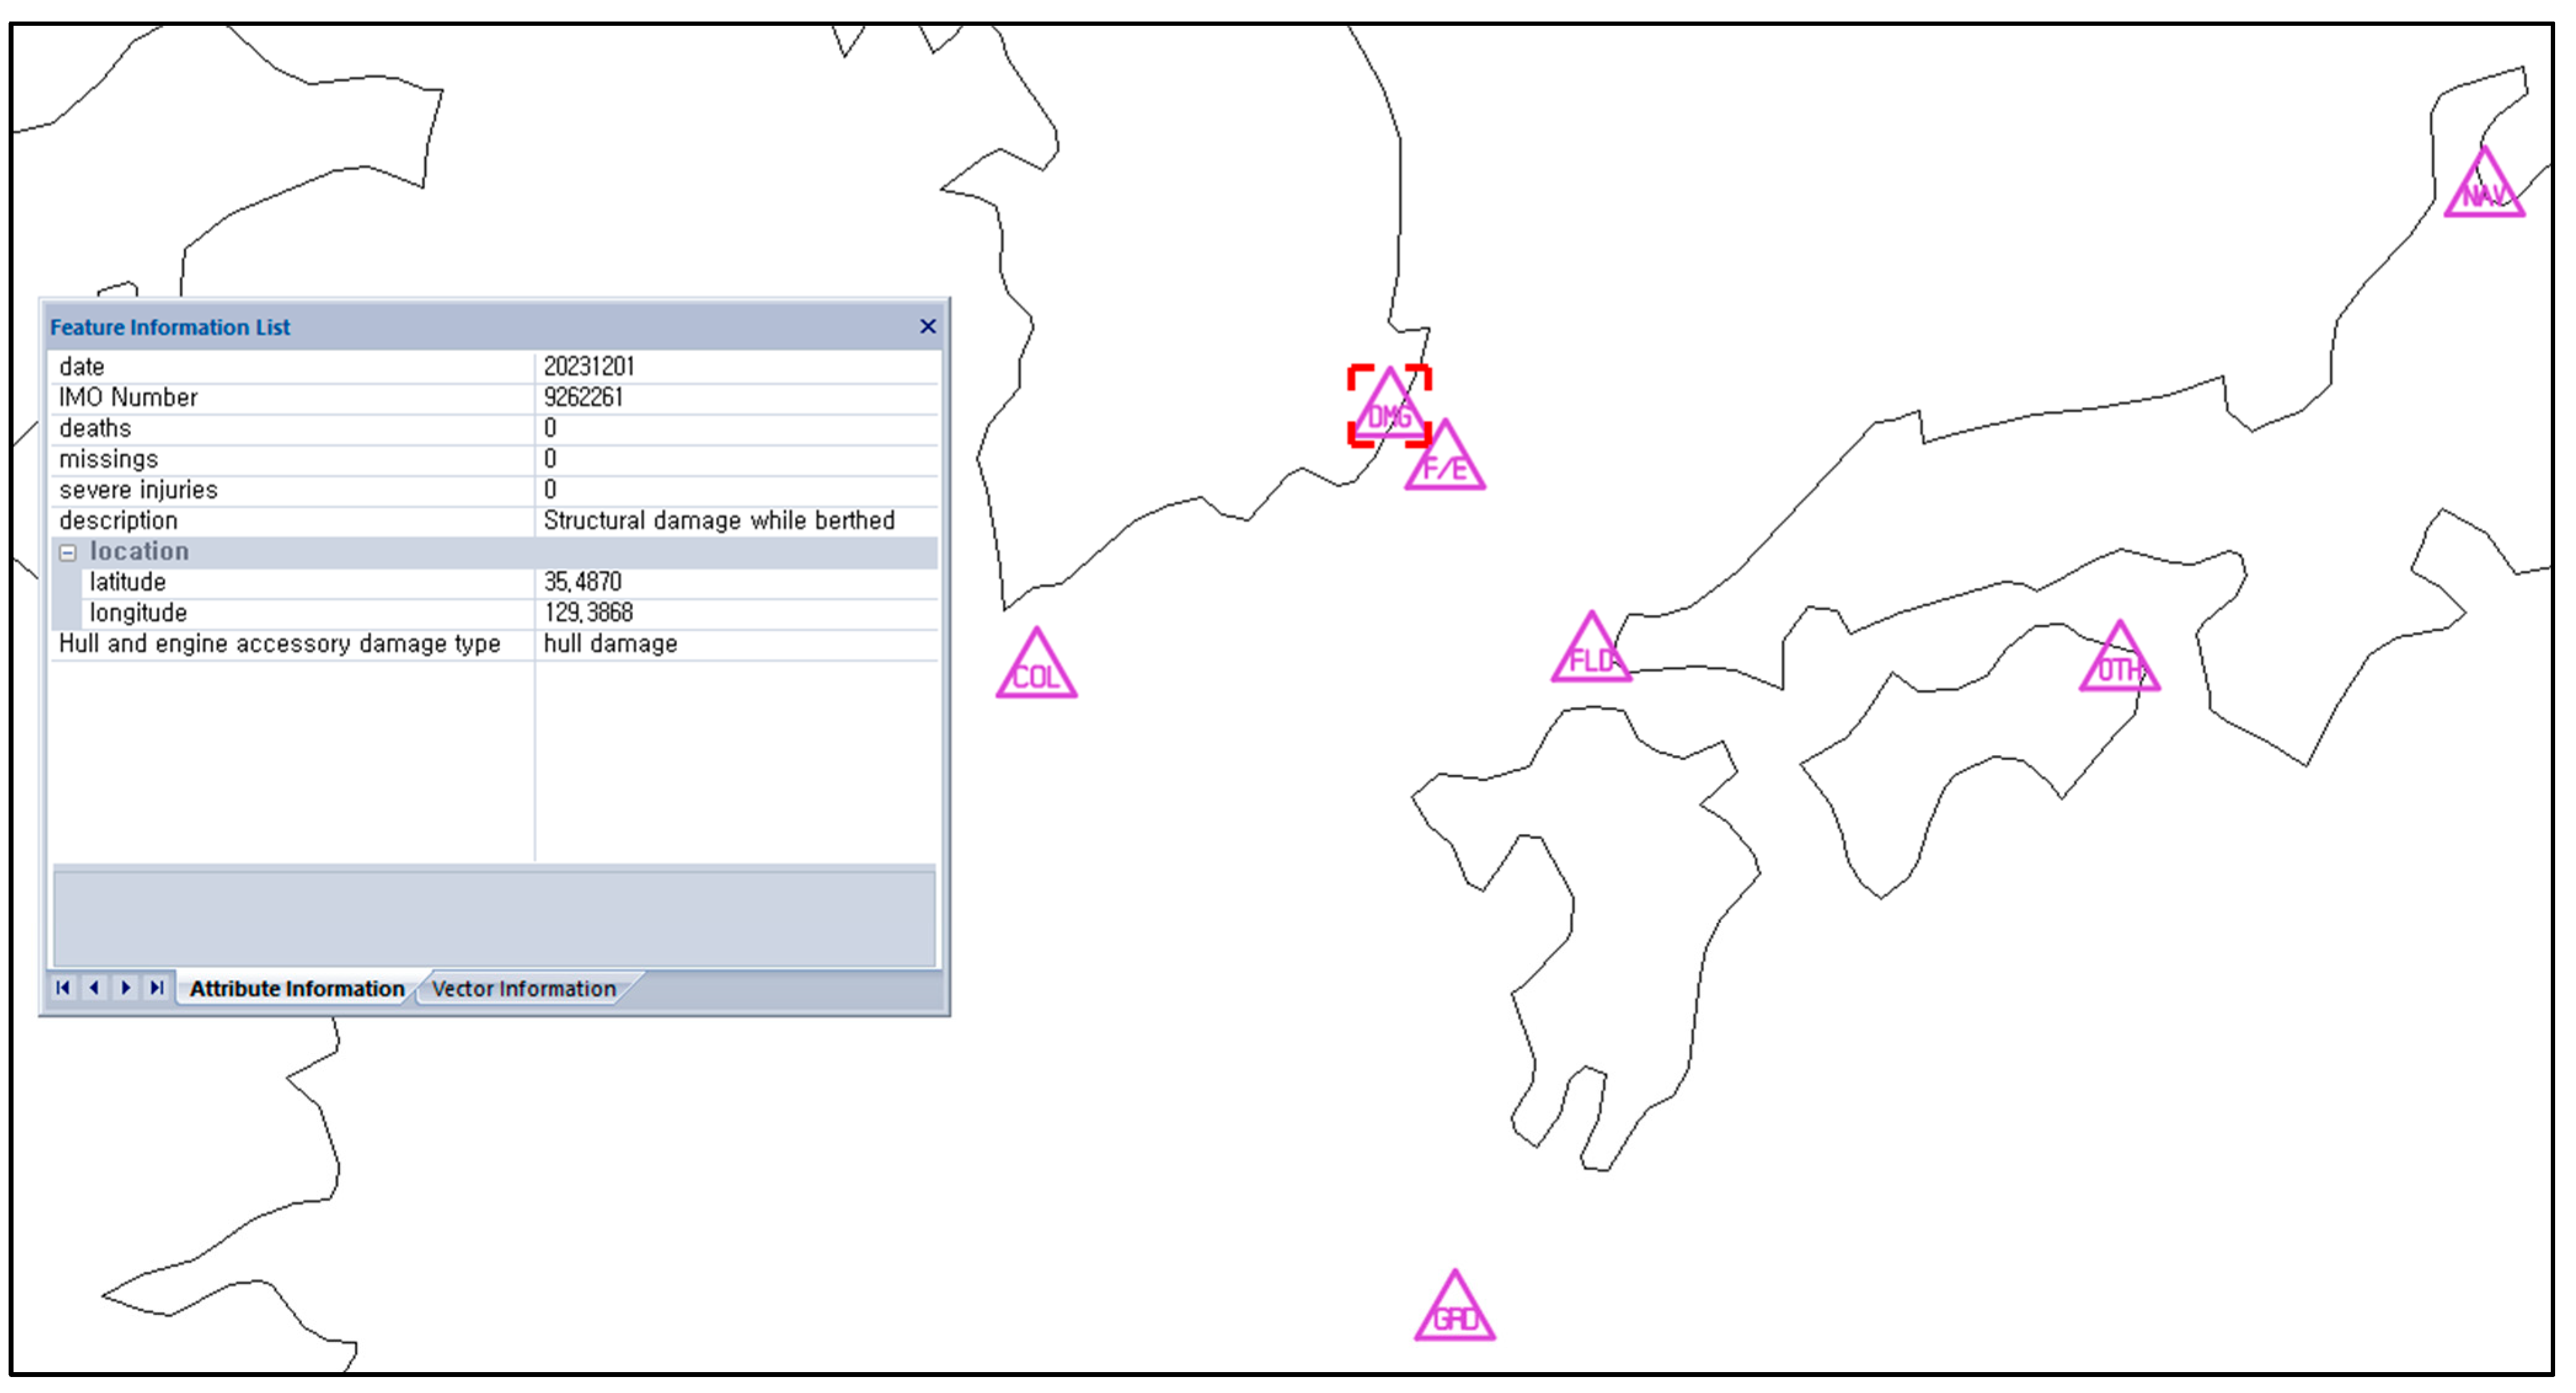
4.4. Visualization and Portrayal Testing

To evaluate the applicability of the constructed dataset in a realistic navigational environment, we tested the visualization of marine casualty features using the S-100-based viewer developed by the Korea Hydrographic and Oceanographic Agency (KHOA) [34]. This viewer supports datasets encoded in GML format and requires the accompanying FC and PC to be loaded for proper structural interpretation and rendering.
Initially, the 454 instances from the GISIS dataset were visualized to assess the system’s capacity to render marine casualty data. As shown in Figure 6, all features were rendered on a single chart, each represented by a triangular warning icon annotated with an abbreviation indicating the incident type. While the rendering confirmed the syntactic correctness and successful symbol assignment, it also revealed a practical limitation: overlapping symbols in high-density zones significantly reduced readability. This issue was particularly evident in coastal waters and port approaches, where marine incidents tend to be densely concentrated.
When additional records from the MAIB and MTIS datasets were loaded—raising the total number of feature instances to over 21,000—the symbol congestion became even more pronounced, effectively overwhelming the chart display. This result underscored the importance of applying contextual or spatial filtering strategies to ensure information accessibility in operational environments. To further explore this need, we simulated a more operational and context-aware use case by assuming a navigational scenario in which a vessel is transiting between Korea and Japan. The target area focused on the East Sea, following a high-traffic corridor between the ports of Busan and Kitakyushu. Instead of displaying all available incident records, the dataset was filtered to include only features located within a defined corridor surrounding the ship’s assumed route. As illustrated in Figure 7, this selective portrayal significantly enhanced readability and made the output more aligned with navigational needs.
This portrayal testing confirmed that the proposed model’s structure and GML encoding are functionally compatible with S-100-based systems. It also demonstrated the importance of implementing spatial and context-based filtering strategies to reduce visual clutter and enhance information accessibility in real-world maritime applications. Although this study focused on a single navigational route scenario, future work will expand applicability testing to other settings—such as anchorage zones, port approaches, and busy straits—to further validate the model’s adaptability across various operational contexts.

4.5. Summary of Results

The case study demonstrated the technical applicability and structural integrity of the proposed data model when applied to a real-world dataset of 21,539 marine casualty records. Through a multi-step process involving manual mapping, GML encoding, and S-100-based visualization, the model was verified to be compliant with the S-100 framework and capable of supporting digital representation and portrayal of casualty data. Visualization tests showed that while the model can handle a high volume of data, practical use cases benefit from context-aware display filtering to prevent symbol overcrowding. These findings support the feasibility of the proposed model as a foundation for future implementation in navigational decision-support systems, and they underscore the need for additional work on real-time integration and user-centered display strategies.

5. Discussion and Limitation

This paper proposed a structured approach for incorporating marine casualty data into the S-100 framework. Through schema development, feature encoding, and portrayal testing, it demonstrated how unstructured maritime incident records can be formalized and visualized within navigational systems. While the technical feasibility of the model was confirmed through a case study, several limitations remain. These include challenges in harmonizing heterogeneous data sources, scaling the model for large datasets, integrating user-centered feedback, and extending the current representation approach. The following subsections outline each limitation and discuss potential directions for further development.

5.1. Data Classification and Harmonization Challenges

The integration of marine casualty data from heterogeneous sources such as GISIS, MAIB, and MTIS revealed substantial differences in terminology, format, and classification logic. These discrepancies posed a significant challenge in mapping incident records to the proposed feature types and subtypes. For example, while some sources provided structured tables with coded values, others used free-text narratives, requiring interpretive judgment to determine appropriate classifications.
To achieve semantic consistency, expert reviewers manually matched each record to predefined code list values based on the model’s controlled vocabulary. However, this process was labor-intensive and not immune to subjectivity. This limitation indicates the need for standardized vocabularies or ontology-based alignment across reporting systems to support more consistent data transformation. Without harmonization, cross-jurisdictional integration may yield inconsistencies that reduce the reliability of the model in large-scale applications.

5.2. Visualization and Scalability in High-Density Environments

The portrayal testing highlighted critical issues of symbol congestion and readability when rendering large datasets on ENCs. As demonstrated in the case study, displaying several hundred incidents simultaneously—particularly in coastal waters or busy port approaches—can lead to excessive visual clutter. Such saturation diminishes the interpretability of the chart and can potentially obscure safety-critical information.
Although spatial filtering based on route proximity significantly improved clarity, further enhancements are needed to manage visual overload. Possible strategies include dynamic clustering of symbols, generalization into density-based heatmaps, and selective rendering based on temporal or severity thresholds. These techniques must be carefully designed to balance information richness with visual clarity and computational performance, especially in resource-constrained ECDIS environments.

5.3. Representation and Integration with Other S-100 Layers

The current implementation represents all casualty features as point objects. While appropriate for simple incident visualization, this approach may oversimplify the spatial and temporal extent of certain accident types. For instance, events such as drifting, collision tracks, or grounding zones may be more effectively portrayed using lines or polygons to capture the full geographic scope of the event.
In addition, the integration of casualty layers with other S-100-based datasets—such as ENC, S-111 surface currents, or S-124 navigational warnings—raises concerns about symbol prioritization, overlap resolution, and portrayal consistency. Ensuring compatibility with existing portrayal catalogs and maintaining interpretability across multiple overlapping layers will require the development of clear rendering rules and interaction logic. Addressing these issues is essential for embedding the proposed model within a broader ecosystem of safety-critical S-100 services.

5.4. Need for User-Centered Evaluation

Beyond technical validation, it is crucial to assess how effectively the model supports real-world decision-making by end-users such as navigators, VTS officers, and maritime analysts. The current study focused on data modeling and system-level visualization, without direct involvement of operational users. This limits the ability to evaluate usability, relevance, and situational awareness in practical contexts.
To address this gap, we plan to conduct a structured usability evaluation in future work, following the ISO/IEC 25023 standard [35]. Evaluation metrics will include task effectiveness (e.g., correct identification of incidents), efficiency (e.g., completion time), and user satisfaction (e.g., perceived clarity and usefulness). Scenario-based testing will be performed with professional users who interact with the casualty data in simulated navigational tasks. Their feedback will inform adjustments to both the data structure and portrayal logic, ensuring the model aligns with operational expectations and cognitive workflows.

5.5. Future Development Opportunities

The limitations identified in this study also point toward several promising directions for further development. Most notably, the reliance on manual data mapping highlights the need for automated structuring of unstructured narrative reports. Advances in Natural Language Processing (NLP), particularly in multilingual and domain-specific contexts, can support automated extraction of incident attributes from text.
Additionally, expanding the model’s geometry support to include lines and polygons will allow for richer spatial analysis. Coupled with real-time integration capabilities and context-aware filtering, this will enable dynamic updates and personalized information delivery based on vessel position, route, or risk thresholds.
By addressing these areas, the proposed model can evolve into a core component of next-generation maritime information infrastructures—supporting proactive risk monitoring, navigational safety, and smarter vessel operations.

6. Conclusions

This study proposed a data model for representing marine casualty information in accordance with the S-100 framework, addressing a previously unstructured domain within maritime data systems. While recent S-100-based models have primarily focused on real-time navigational safety data, such as warnings and environmental conditions, the model presented in this study is distinguished by its focus on formalizing and visualizing historical casualty records. By doing so, it introduces a foundation for integrating accident data into digital navigational environments in a structured, spatially referenced, and interoperable form.
The modeling process involved more than conceptual design—it required the actual development of a complete S-100 data package. This included the definition of a domain-specific application schema, the creation of a machine-readable FC, and the development of a PC specifying the visual representation of casualty data in ECDIS environments. Symbol design was carried out with attention to clarity, consistency, and integration with existing navigational symbology. Each component was carefully aligned with the S-100 GFM and relevant parts of the standard to ensure compliance and interoperability. A case study using 21,539 real marine casualty records demonstrated that the proposed model could be successfully implemented in an S-100-compatible viewing environment.
The findings also revealed practical challenges—particularly in terms of symbol congestion in high-density areas and the limitations of point-based representation. Visualization experiments underscored the importance of filtering and generalization strategies to ensure clarity and operational relevance. Furthermore, issues of semantic harmonization across data sources and the need for integration with other S-100 layers were identified as important directions for improvement.
The significance of this work lies in its transformation of marine casualty data—from informal, narrative-based documentation—into a standardized format that can be utilized within digital navigational systems. Rather than treating accident data as isolated historical records, this model enables its integration into broader maritime information systems, where it can contribute to risk-aware route planning, incident pattern analysis, and situational awareness. The interoperability of the model also opens avenues for alignment with other safety-related S-100 layers, ensuring consistent portrayal and interaction across applications.
To enhance the model’s practical applicability, future work will include structured usability evaluations based on ISO/IEC 25023 metrics [35], involving ECDIS operators, VTS officers, and maritime analysts to assess task performance, efficiency, and perceived usability in realistic scenarios. In parallel, applying NLP techniques may support the automated transformation of unstructured casualty reports into model-compliant instances, improving scalability. Taken together, these developments will help establish the proposed model as a practical framework for structuring and visualizing marine casualty data within the S-100 environment. The structured dataset may also support advanced applications such as route optimization, incident trend analysis, and predictive risk assessment—contributing to the broader shift toward standardized, data-driven navigation systems.

Author Contributions

Conceptualization, S.L.; methodology, C.L.; software, H.J.; validation, C.L.; formal analysis, C.L.; investigation, H.J.; resources, S.L.; data curation, H.J.; writing—original draft preparation, H.J.; writing—review and editing, C.L.; visualization, H.J.; supervision, S.L.; project administration, S.L. All authors have read and agreed to the published version of the manuscript.

Funding

This research was supported by the Korea Institute of Marine Science & Technology Promotion (KIMST) funded by the Ministry of Oceans and Fisheries, Republic of Korea (RS-2023-00238653).

Institutional Review Board Statement

Not applicable.

Informed Consent Statement

Not applicable.

Data Availability Statement

The developed documents for the proposed marine casualty data model are openly available at the following GitHub repository: https://github.com/KMOUSQA/MCI (accessed on 5 May 2025).

Acknowledgments

The authors thank the Korea Hydrographic and Oceanographic Agency (KHOA) for providing the S-100 Viewer, available at: https://github.com/S-100ExpertTeam/khoa-s100-viewer (accessed on 5 May 2025).

Conflicts of Interest

The authors declare no conflicts of interest.

Abbreviations

AISAutomatic Identification System
AMSAAustralian Maritime Safety Authority
CCTVClosed Circuit Television
DBSCANDensity-Based Spatial Clustering Of Applications With Noise
DMSDegrees, Minutes, Seconds
ECDISElectronic Chart Display and Information System
ENCsElectronic Navigational Charts
FCFeature Catalogue
GFMGeneral Feature Model
GMLGeography Markup Language
GISISGlobal Integrated Shipping Information System
HDF5Hierarchical Data Format version 5
IHOInternational Hydrographic Organization
IMOInternational Maritime Organization
ISOInternational Organization for Standardization
MAIBMarine Accident Investigation Branch
MTISMaritime Transportation Safety Information System
NLPNatural Language Processing
PADPredictive Avoidance Domain
PCPortrayal Catalogue
SVGScalable Vector Graphics
UMLUnified Modeling Language
UHDMUniversal Hydrographic Data Model
VTSVessel Traffic Services
XMLExtensible Markup Language

References

  1. International Hydrographic Organization (IHO). IHO Transfer Standard for Digital Hydrographic Data, 3.1 ed.; IHO: Monaco, Monaco, 2000; pp. 1–20. [Google Scholar]
  2. International Hydrographic Organization (IHO). Universal Hydrographic Data Model, 5.2.0 ed.; IHO: Monaco, Monaco, 2024; pp. 1–623. [Google Scholar]
  3. Palma, V.; Giglio, D.; Tei, A. Investigating the Influence of E-Navigation and S-100 over the Computation of the Weather Route. WMU J. Marit. Aff. 2024, 23, 457–475. [Google Scholar] [CrossRef]
  4. Jang, J.; Park, S.; Oh, S.; Kim, I. The Effectiveness of S-100 ECDIS Capable of ENDS in the View of Ship Officers’ Visual Characteristics. Int. Hydrogr. Rev. 2023, 29, 164–171. [Google Scholar] [CrossRef]
  5. Choi, H.; Ju, H.; Oh, S.; Park, H. Economic and Environmental Performance Improvements Based on S-100 Hydrographic Information. Sens. Mater. 2025, 37, 745–758. [Google Scholar] [CrossRef]
  6. Khosravi, Y.; Hosseinali, F.; Adresi, M. Identifying accident prone areas and factors influencing the severity of crashes using machine learning and spatial analyses. Sci. Rep. 2024, 14, 29836. [Google Scholar] [CrossRef] [PubMed]
  7. Ye, Q.; Li, Y.; Shen, W.; Xuan, Z. Division and Analysis of Accident-Prone Areas near Highway Ramps Based on Spatial Autocorrelation. Sustainability 2023, 15, 7942. [Google Scholar] [CrossRef]
  8. Ryder, B.; Gahr, B.; Egolf, P.; Dahlinger, A.; Wortmann, F. Preventing traffic accidents with in-vehicle decision support systems—The impact of accident hotspot warnings on driver behaviour. Decis. Support Syst. 2017, 99, 64–74. [Google Scholar] [CrossRef]
  9. Liao, X.; Zhou, T.; Wang, X.; Dai, R.; Chen, X.; Zhu, X. Driver Route Planning Method Based on Accident Risk Cost Prediction. J. Adv. Transp. 2022, 2022, 5023052. [Google Scholar] [CrossRef]
  10. Gandur, N.L.; Ekwaro-Osire, S.; Rasty, J.; Parker, O.; Fernandes, G. Navigating Safer Car Routes Based on Measured Car Accidents. Metrology 2024, 4, 517–533. [Google Scholar] [CrossRef]
  11. Zhang, Y.; Sun, X.; Chen, J.; Cheng, C. Spatial Patterns and Characteristics of Global Maritime Accidents. Reliab. Eng. Syst. Saf. 2021, 207, 107310. [Google Scholar] [CrossRef]
  12. Munim, Z.H.; Sørli, M.A.; Kim, H.; Alon, I. Predicting Maritime Accident Risk Using Automated Machine Learning. Reliab. Eng. Syst. Saf. 2024, 251, 110148. [Google Scholar] [CrossRef]
  13. Contarinis, S.; Pallikaris, A.; Nakos, B. The Value of Marine Spatial Open Data Infrastructures—Potentials of IHO S-100 Standard to Become the Universal Marine Data Model. J. Mar. Sci. Eng. 2020, 8, 564. [Google Scholar] [CrossRef]
  14. International Maritime Organization (IMO). Resolution MSC.530(106): Performance Standards for Electronic Chart Display and Information Systems (ECDIS); IMO: London, UK, 2022; pp. 1–28. [Google Scholar]
  15. International Hydrographic Organization (IHO). IHO GI Registry. Available online: https://registry.iho.int/main.do (accessed on 26 May 2025).
  16. International Hydrographic Organization (IHO). Navigational Warnings, 1.0.0 ed.; IHO: Monaco, Monaco, 2023; p. 16. [Google Scholar]
  17. Australian Maritime Safety Authority (AMSA). WWNWS15/3/5/1/1: Report on Australia’s S-124 Testbed; IHO: Monaco, Monaco, 4 August 2023. [Google Scholar]
  18. ISO 19109:2015; Geographic Information—Rules for Application Schema, 2nd ed. International Organization for Standardization (ISO): Geneva, Switzerland, 2015; pp. 9–69.
  19. Lu, C.-W.; Hsueh, C.-K.; Chuang, Y.-L.; Lai, C.-M.; Yang, F.-S. Marine Collision Avoidance Route Planning Model for MASS Based on Domain-Based Predicted Area of Danger. J. Mar. Sci. Eng. 2023, 11, 1724. [Google Scholar] [CrossRef]
  20. Pan, W.; Fan, J.; Xie, X.-L.; Li, M. Theoretical Research and System Design of Ship Navigation Guidance for Local Temporary Prohibited Navigation Area. Sci. Rep. 2025, 15, 11801. [Google Scholar] [CrossRef] [PubMed]
  21. Lee, D.; Jang, D.; Yoo, S. Development of a Multidimensional Analysis and Integrated Visualization Method for Maritime Traffic Behaviors Using DBSCAN-Based Dynamic Clustering. Appl. Sci. 2025, 15, 529. [Google Scholar] [CrossRef]
  22. Fagerhaug, E.S.; Bye, R.T.; Osen, O.L.; Hatledal, L.I. Oceanscape: A Graph-Based Framework for Autonomous Coastal Navigation. Ocean Eng. 2024, 297, 120230. [Google Scholar] [CrossRef]
  23. Lei, J.; Sun, Y.; Wu, Y.; Zheng, F.; He, W.; Liu, X. Association of AIS and Radar Data in Intelligent Navigation in Inland Waterways Based on Trajectory Characteristics. J. Mar. Sci. Eng. 2024, 12, 890. [Google Scholar] [CrossRef]
  24. Li, H.; Yang, Z. Incorporation of AIS Data-Based Machine Learning into Unsupervised Route Planning for Maritime Autonomous Surface Ships. Transp. Res. Part E Logist. Transp. Rev. 2023, 177, 103171. [Google Scholar] [CrossRef]
  25. Lee, S.; Lee, C.; Kim, G.; Na, H.; Kim, H.; Lee, J.; Park, M. A Study of S-100 Based Product Specifications from a Software Implementation Point of View: Focusing on Data Model Representation, Similar Features and Symbols, and ECDIS and VTS Software. J. Navig. 2022, 75, 1226–1242. [Google Scholar] [CrossRef]
  26. Cao, Y.; Wang, X.; Yang, Z.; Wang, J.; Wang, H.; Liu, Z. Research in Marine Accidents: A Bibliometric Analysis, Systematic Review and Future Directions. Ocean Eng. 2023, 284, 115048. [Google Scholar] [CrossRef]
  27. International Hydrographic Organization (IHO). IHO Guidelines for Creating S-100 Product Specifications, 1.1.0 ed.; IHO: Monaco, Monaco, 2020; pp. 48–52. [Google Scholar]
  28. International Maritime Organization (IMO). Global Integrated Shipping Information System (GISIS)—Marine Casualty and Incident Module. Available online: https://gisis.imo.org/Public/MCI/Search.aspx (accessed on 2 June 2025).
  29. MAIB Data Portal—Power BI Dashboard. Available online: https://maps.dft.gov.uk/maib-data-portal/web-pages/pbi_dashboard.html (accessed on 5 May 2025).
  30. Marine Accident Analysis System. Available online: https://mtis.komsa.or.kr/gs/gisAnlz/acdntAnlz (accessed on 2 June 2025).
  31. International Maritime Organization (IMO). MSC-MEPC.3/Circ.4/Rev.1: Casualty-Related Matters—Reports on Marine Casualties and Incidents; IMO: London, UK, 18 November 2014; pp. 1–12. [Google Scholar]
  32. Ministry of Oceans and Fisheries (MOF). Administrative Guidelines on the Investigation of and Inquiry into Marine Accidents, Korea Maritime Safety Tribunal Instruction No. 93; Ministry of Oceans and Fisheries: Sejong, Republic of Korea, 2024; Available online: https://www.law.go.kr/LSW/admRulLsInfoP.do?admRulId=2047247&efYd=0 (accessed on 2 June 2025).
  33. ISO 19107:2019; Geographic Information—Spatial Schema, 2nd ed. International Organization for Standardization (ISO): Geneva, Switzerland, 2019; pp. 17–111.
  34. KHOA S-100 Viewer Repository. Available online: https://github.com/S-100ExpertTeam/khoa-s100-viewer (accessed on 5 May 2025).
  35. ISO/IEC 25023:2016; Systems and Software Engineering—Systems and Software Quality Requirements and Evaluation (SQuaRE)—Measurement of System and Software Product Quality, 1st ed. International Organization for Standardization (ISO): Geneva, Switzerland, 2016; pp. 1–45.
Figure 1. AMSA testbed displaying navigational warnings on ENCs [17].
Applsci 15 06432 g001
Figure 2. S-100-based procedure for marine casualty data modeling.
Applsci 15 06432 g002
Figure 3. Application schema represented as UML class diagram for marine casualty data model. The model defines an abstract feature type, Casualty, which includes common attributes across all incidents (e.g., date, deaths, location). Subtypes represent specific incident categories (e.g., CollisionAndContact, FireAndExplosion), each associated with a corresponding enumerated code list that describes incident subtypes. Code lists are shown in yellow and follow the S-100 coding convention. Spatial information is modeled using a location complex attribute containing latitude and longitude values.
Applsci 15 06432 g003
Figure 4. Symbols for marine casualty feature types: (a) HullAndEngineAccessoryDamage; (b) CollisionAndContact; (c) NavigationalIssues; (d) FloodingAndSinking; (e) FireAndExplosion; (f) StrandingAndGrounding; (g) OtherIncident.
Applsci 15 06432 g004
Figure 5. Semi-structured marine casualty report from IMO GISIS [28].
Applsci 15 06432 g005
Figure 6. Visualization of 454 marine casualty features with symbol congestion.
Applsci 15 06432 g006
Figure 7. Route-based filtering of marine casualty features between Korea and Japan.
Applsci 15 06432 g007
Table 1. Definitions of core components in the S-100 framework [2].
Implemented ClassDefinition
Feature TypeA conceptual unit that represents real-world spatial or non-spatial entities and serves as the core data element displayed to users on ENCs. They are implemented as a class in UML.
Information TypeA non-spatial data structure associated with a feature type, used to provide auxiliary information. They are implemented as a class in UML.
Attribute TypeProperties of a Feature or Information Type that describe the state or characteristics of the object. They are implemented as properties of a class and can have data types depending on the nature of the data being represented (e.g., integer, real, text, date, enumeration, S100_CodeList).
Association TypeA structure that represents relationships between feature types or between a feature type and an information type. It can express various types of relationships, including associations, aggregations, and compositions. They are represented as connecting lines between classes.
Table 2. Comparative analysis of marine casualty taxonomies.
GISIS/MAIB ClassificationMTIS ClassificationCategorized Navigational Utility
CollisionCollisionCollisions or contacts with vessels or external objects function similarly in route avoidance decisions. Navigators can identify high-risk areas and take actions such as slowing down or maneuvering to avoid potential collisions.
Collision and contact
ContactContact, Entanglement by floating object
GroundingGroundingGrounding incidents occur in shallow waters where vessels contact the seabed, and can be used in conjunction with depth data to assess navigational risk zones. Navigators may follow recommended routes or secure sufficient turning margins in these areas.
Stranding and grounding
Fire/ExplosionFire/ExplosionFire and explosion events follow similar navigational decision-making flows and may be related to hazardous cargo operations. Navigators can avoid high-risk areas or adjust berthing plans accordingly.
Fire and explosion
Hull failureEngine system failureStructural or mechanical failures can be assessed by their occurrence locations and frequency, contributing to vessel reliability analysis. Navigators may enhance equipment checks or proactively adjust their routes.
Hull and engine accessory damage
Ship/equipment damagePropulsion shaft system damage
Loss of controlSteering gear failure, Navigational impairmentNavigational impairment incidents are directly applicable to route safety decisions based on position data. Navigators may minimize heading changes or maintain heightened awareness when passing through affected areas.
Navigational issues
Capsize/ListingCapsizingStructural failure incidents such as flooding, capsizing, or sinking are useful for identifying hazardous sea areas. Navigators can use this information to anticipate environmental threats like currents or weather and adjust voyage conditions accordingly.
Flooding and sinking
Flooding/FounderingSinking, Flooding
OtherOthersGeneral accident types that are structurally difficult to categorize often lack consistent interpretive standards.
Other incident
Table 3. Features with attributes and relationships in marine casualty model.
FeatureDescriptionAttributeRelationship
Casualty Abstract feature type defining common information across all types of incidents. date, deaths, missings, severeInjuries, description, IMONum, location, geometryIt was implemented by inheriting from the S100_GF_FeatureType meta class and contains common attributes shared by the subordinate feature types.
HullAndEngineAccessoryDamageIncidents related to damage of the hull, propulsion systems, or rudder components.hullAndEngineAccessoryDamageTypeIt was implemented by inheriting from the Casualty abstract feature type.
CollisionAndContactIncidents involving collisions with other vessels, piers, structures, or floating objects.collisionAndContactType
NavigationalIssuesIncidents caused by navigational errors such as drifting, loss of direction, or blocked passage.navigationalIssuesType
FloodingAndSinkingSerious structural failures resulting in flooding, sinking, or capsizing.floodingAndSinkingType
FireAndExplosionIncidents involving fires or explosions occurring internally or externally on the vessel.fireAndExplosionType
StrandingAndGroundingIncidents involving groundings or contact with the seafloor in shallow areas.strandingAndGroundingType
OtherIncidentIncidents that do not fall under any of the predefined categories or are difficult to classify.otherIncidentType
Table 4. Attributes of the abstract feature type Casualty.
FeatureAttributeDescriptionData TypeMult.
CasualtydateRepresents the date and time of the incident.date[0..1]
IMONumIndicates the IMO number of the vessel involved in the incident.text[0..*]
deathsIndicates the number of fatalities resulting from the incident.integer[0..1]
missingsIndicates the number of missing persons after the incident.integer[0..1]
severeInjuriesRepresents the number of people who sustained severe injuries from the incident.integer[0..1]
locationIndicates the location related to the incident as a complex attribute composed of the simple attributes latitude and longitude. This information explicitly specifies the position.location[0..*]
descriptionProvides a detailed description of the incident.text[0..1]
geometryGeometric object come from Geometry class in the S-100 standardGM_Point[0..*]
Table 5. Specialized attributes and code lists for each marine casualty feature type.
FeatureAttributeMult.
HullAndEngineAccessoryDamagehullAndEngineAccessoryDamageType can have the following values:
1. hull damage
2. machineries and propulsion damage
3. other facility damage
4. rudder damage
5. outfit damage
[1..*]
CollisionAndContactcollisionAndContactType can have the following values:
1. collision
2. contact
3. floating object entanglement
[1..*]
NavigationalIssuesnavigationalIssuesType can have the following values:
1. drifting
2. loss of direction
3. sailing hindrance
[1..*]
FloodingAndSinkingfloodingAndSinkingType can have the following values:
1. capsizing
2. flooding
3. sinking
[1..*]
FireAndExplosionfireAndExplosionType can have the following values:
1. explosion
2. fire
[1..*]
StrandingAndGroundingstrandingAndGroundingType can have the following values:
1. grounding
2. stranding
[1..*]
OtherIncidentotherIncidentType can have the following values:
1. safety hindrance and near misses
2. other incidents
[1..*]
Table 6. Summary of marine casualty data sources and record counts.
Source NameCountryNumber of RecordsDescription
GISIS [28]IMO454Standardized marine casualty reports from IMO’s global reporting system.
MAIB [29]UK4354Official investigation reports of UK maritime accidents.
MTIS [30]Republic of Korea16,731Domestic maritime traffic and accident data managed by Korean authorities.
Table 7. Categorization results of marine casualty records across data sources.
Incident TypeGISISMAIBMTIS
Hull and engine accessory damage3410976181
Collision and contact645534794
Navigational issues9557647
Flooding and sinking841931916
Fire and explosion81234798
Stranding and grounding37377884
Other incident14513431511
Table 8. Selected GISIS casualty records manually mapped to the proposed data model [28].
Ships InvolvedShip TypeDate Incident Classification
HANMIREU NO. 1
(IMO 9262261)
tanker1 December 2023HullAndEngineAccessoryDamage
SM JEJU LNG1
(IMO 9830745)
liquefied gas17 February 2024CollisionAndContact
DONG YU
(IMO 9575369)
general cargo25 January 2024NavigationalIssues
KEOYOUNG SUN
(IMO 9146924)
chemical tanker20 March 2024FloodingAndSinking
KALTAN
(IMO 9047984)
fish catching21 April 2023FireAndExplosion
KEOYOUNG PIONEER
(IMO 9355020)
chemical tanker16 April 2024StrandingAndGrounding
DONGJIN FORTUNE
(IMO 9251145)
container9 November 2021OtherIncident
Table 9. Structured attribute values of marine casualty instances [28].
AttributeHullAndEngineAccessoryDamageCollisionAndContactNavigationalIssuesFloodingAndSinkingFireAndExplosionStrandingAndGroundingOtherIncident
date20,231,20120,240,21720,240,12520,240,32020,230,42120,240,41620,211,109
IMONum9,262,2619,830,7459,575,3699,146,9249,047,9849,355,0209,251,145
deaths0009401
missings0001000
severeInjuries0000000
location35.4870,
129.3868
33.9533,
126.8533
36.7665,
137.2370
34.0497,
130.8333
35.1833,
129.7833
30.0550,
129.8533
33.9950,
134.6215
descriptionStructural damage while berthedCollision due to poor lookout while driftingDrift caused by strong windCapsizing of chemical tankerFire in crew accommodationGrounding during course changeMooring line snapped during berthing
Subtypehull damagecollisiondriftingcapsizingfiregroundingother incidents
Disclaimer/Publisher’s Note: The statements, opinions and data contained in all publications are solely those of the individual author(s) and contributor(s) and not of MDPI and/or the editor(s). MDPI and/or the editor(s) disclaim responsibility for any injury to people or property resulting from any ideas, methods, instructions or products referred to in the content.

