
Techno-Economical Evaluation of Extractive Distillation Process for Isopropanol Dehydration with Different Extractive Solvents


Abstract
1. Introduction
2. Methodology
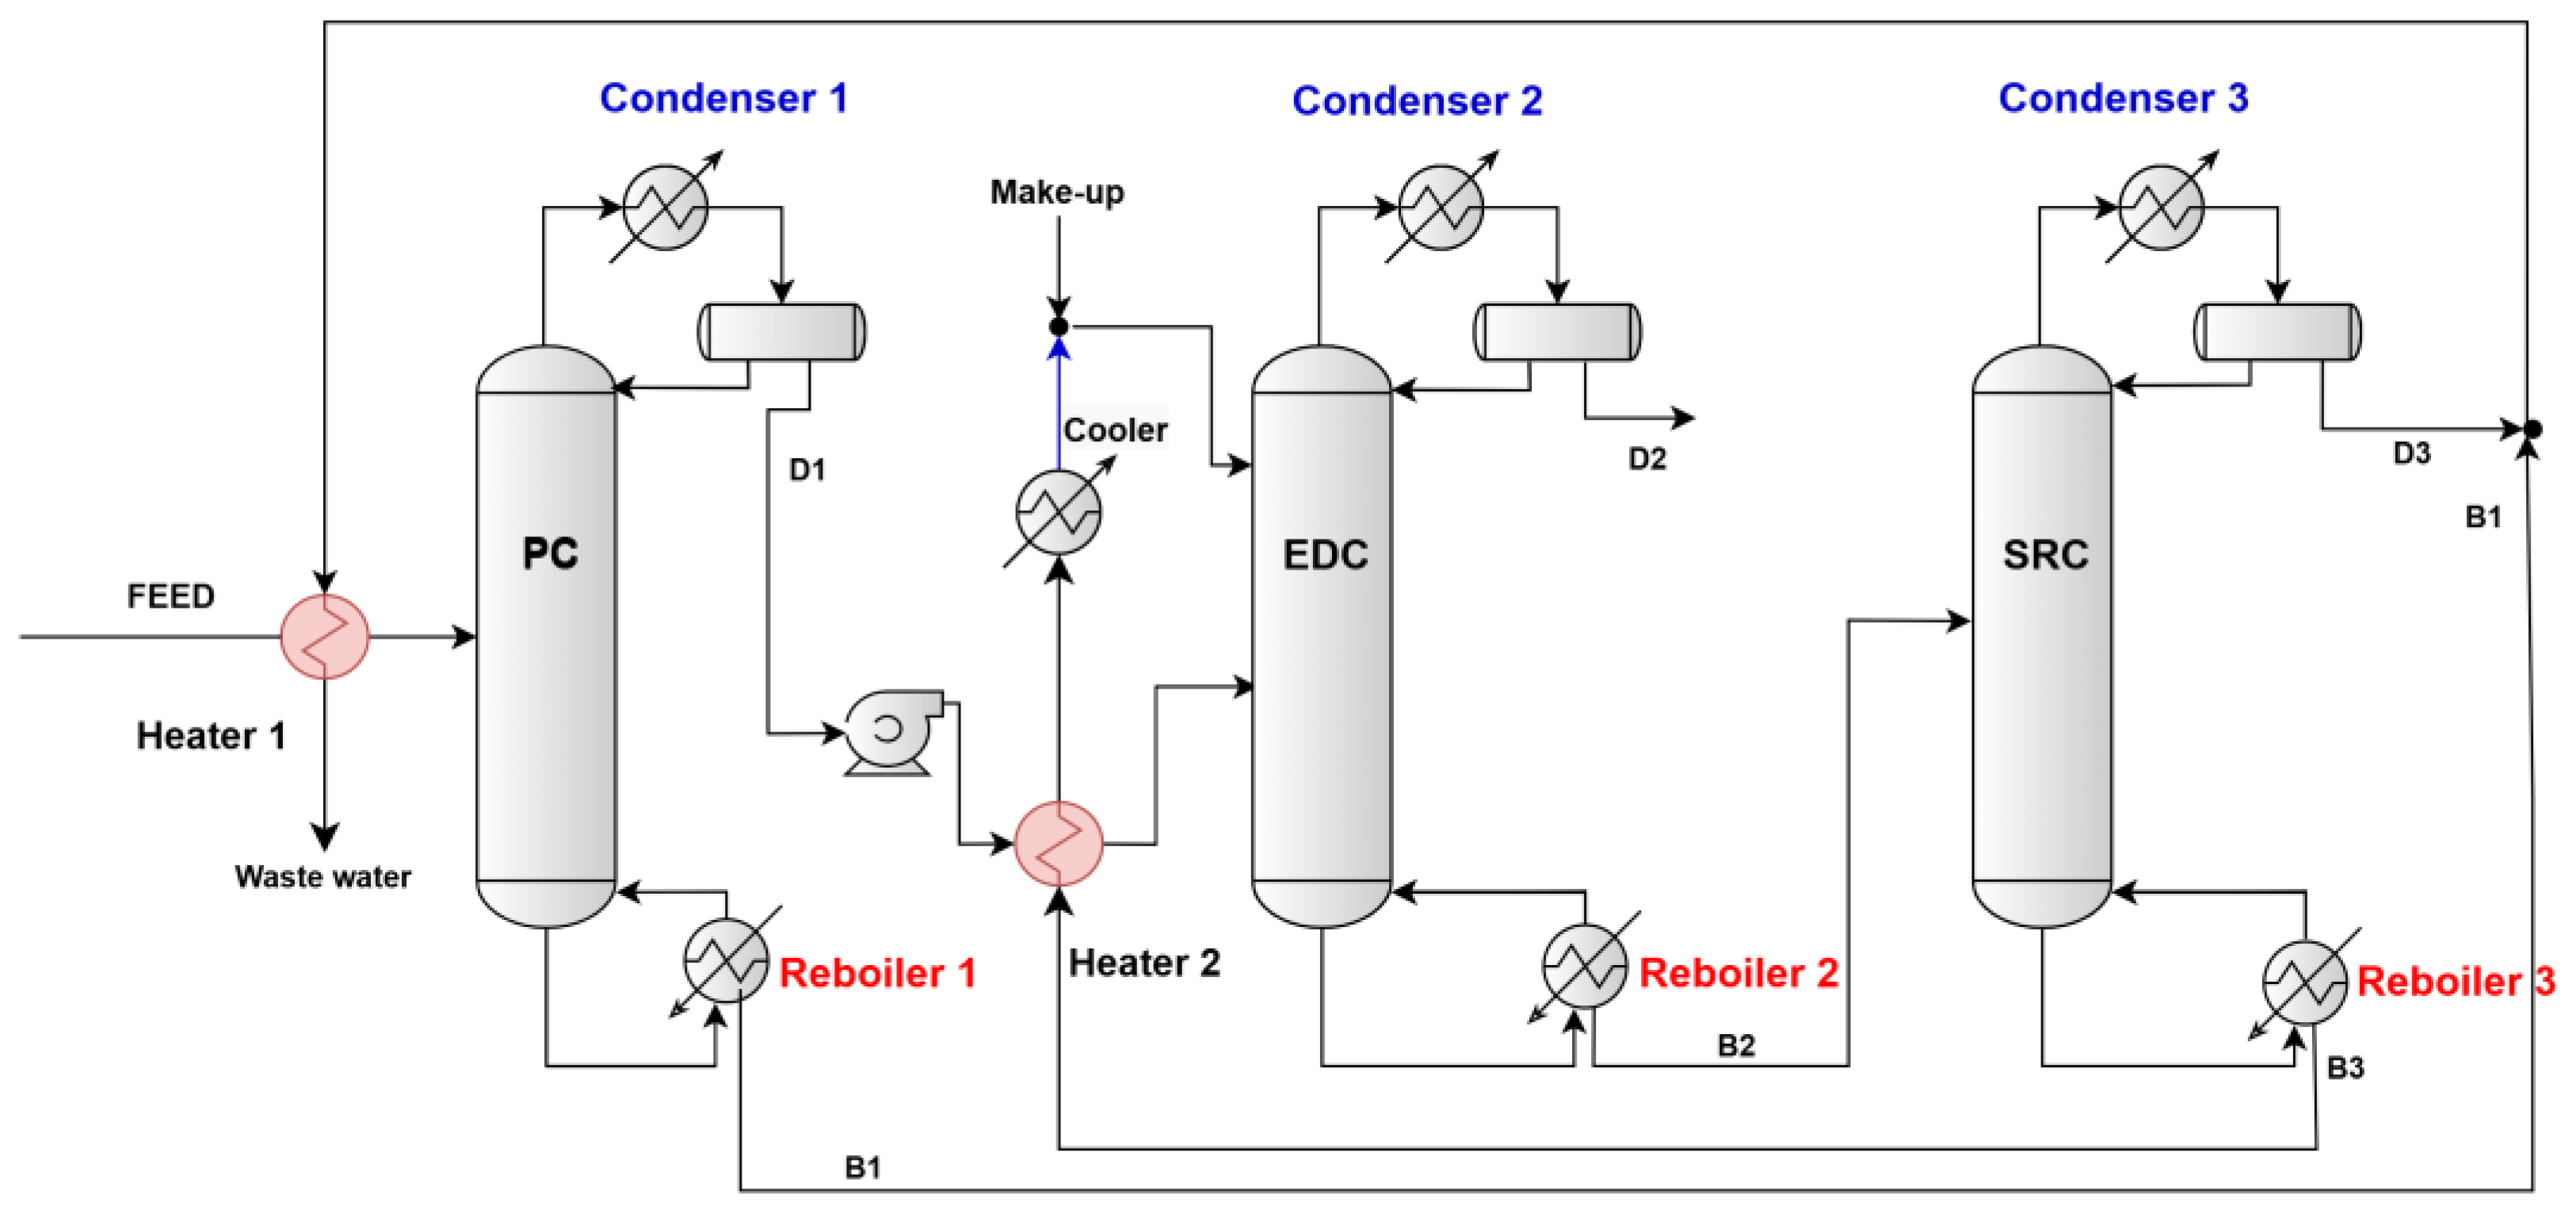
2.1. Separation Process Design TCED
2.2. Sensible Heat Recovery from the Hot Streams
2.3. Economic Evaluation
3. Results and Discussions
3.1. Design of the Conventional TCED Process
- The number of trays in the EDC, labeled as NT2, was set at 20, following AVEVA PRO/II’s notation of numbering from top to bottom. The feed tray, referred to as NF2, was fixed at 16, while the feed tray for the extractive solvent, labeled NFE, was fixed at 5. Additionally, the reflux molar ratio (RR2) was set at 0.9. The molar ratio of the extractive solvent to feed (E/D1) was varied from 0.5:1.0 to 2.0:1.0 for the EG solvent and from 0.25:1.0 to 1.0:1.0 for the DMSO solvent. The results of the changing effect of the E/D1 ratio over the IPA and solvent concentration in D2 are reported in Figure 3a,b. The increase in the solvent ratio significantly impacts the purity of the D2 product from the top of the column. While it raises the IPA concentration in the D2 stream, which is desired, it also results in a higher concentration of solvent in that stream. Therefore, selecting the optimal solvent ratio involves balancing the IPA concentration with the solvent concentration. We will also examine additional parameters to ensure the overall quality of the D2 distilled product. In the case of EG solvent, the most proper IPA concentration in D2 is only 99.8 mol% but with a very small loss of EG in D2 (i.e., 0.74 ppm), which was depicted for the E/D1 value of 1.25/1, and in the case of DMSO solvent, there was an IPA concentration in D2 over the target (i.e., 99.93 mol%) but with an unacceptable loss of DMSO (i.e., 30.98 ppm) in D2, which was depicted for the E/D1 value of 0.8/1.
- At an optimal solvent ratio (i.e., E/D1 at 1.25/1.0 for EG and E/D1 value of 0.8/1 for DMSO), the number of trays in EDCs changes from 20 to 26 trays in the EDC with EG and from 19 to 24 trays in the EDC with DMSO. All the other parameters remain unchanged. The number of trays in the EDCs affects both the height of the column and the investment costs. Generally, columns with fewer trays require a lower initial investment. However, the choice of the optimal number of trays should primarily focus on ensuring the quality of the D2 distilled product. Figure 4a,b show that at 22 optimal trays in the EDC with EG solvent, the IPA concentration in D2 was 99.91 mol% (very close to the target of 99.92 mol%) and with a very small loss of EG in D2 (i.e., 0.74 ppm). In the case of DMSO solvent, the optimal number of trays in the EDC was established at 23 because the loss of solvent was a little bit lower (i.e., 30.84 ppm), while the IPA concentration was 99.94 mol%. The number of trays in the EDC has minimal impact on the DMSO concentration in D2.
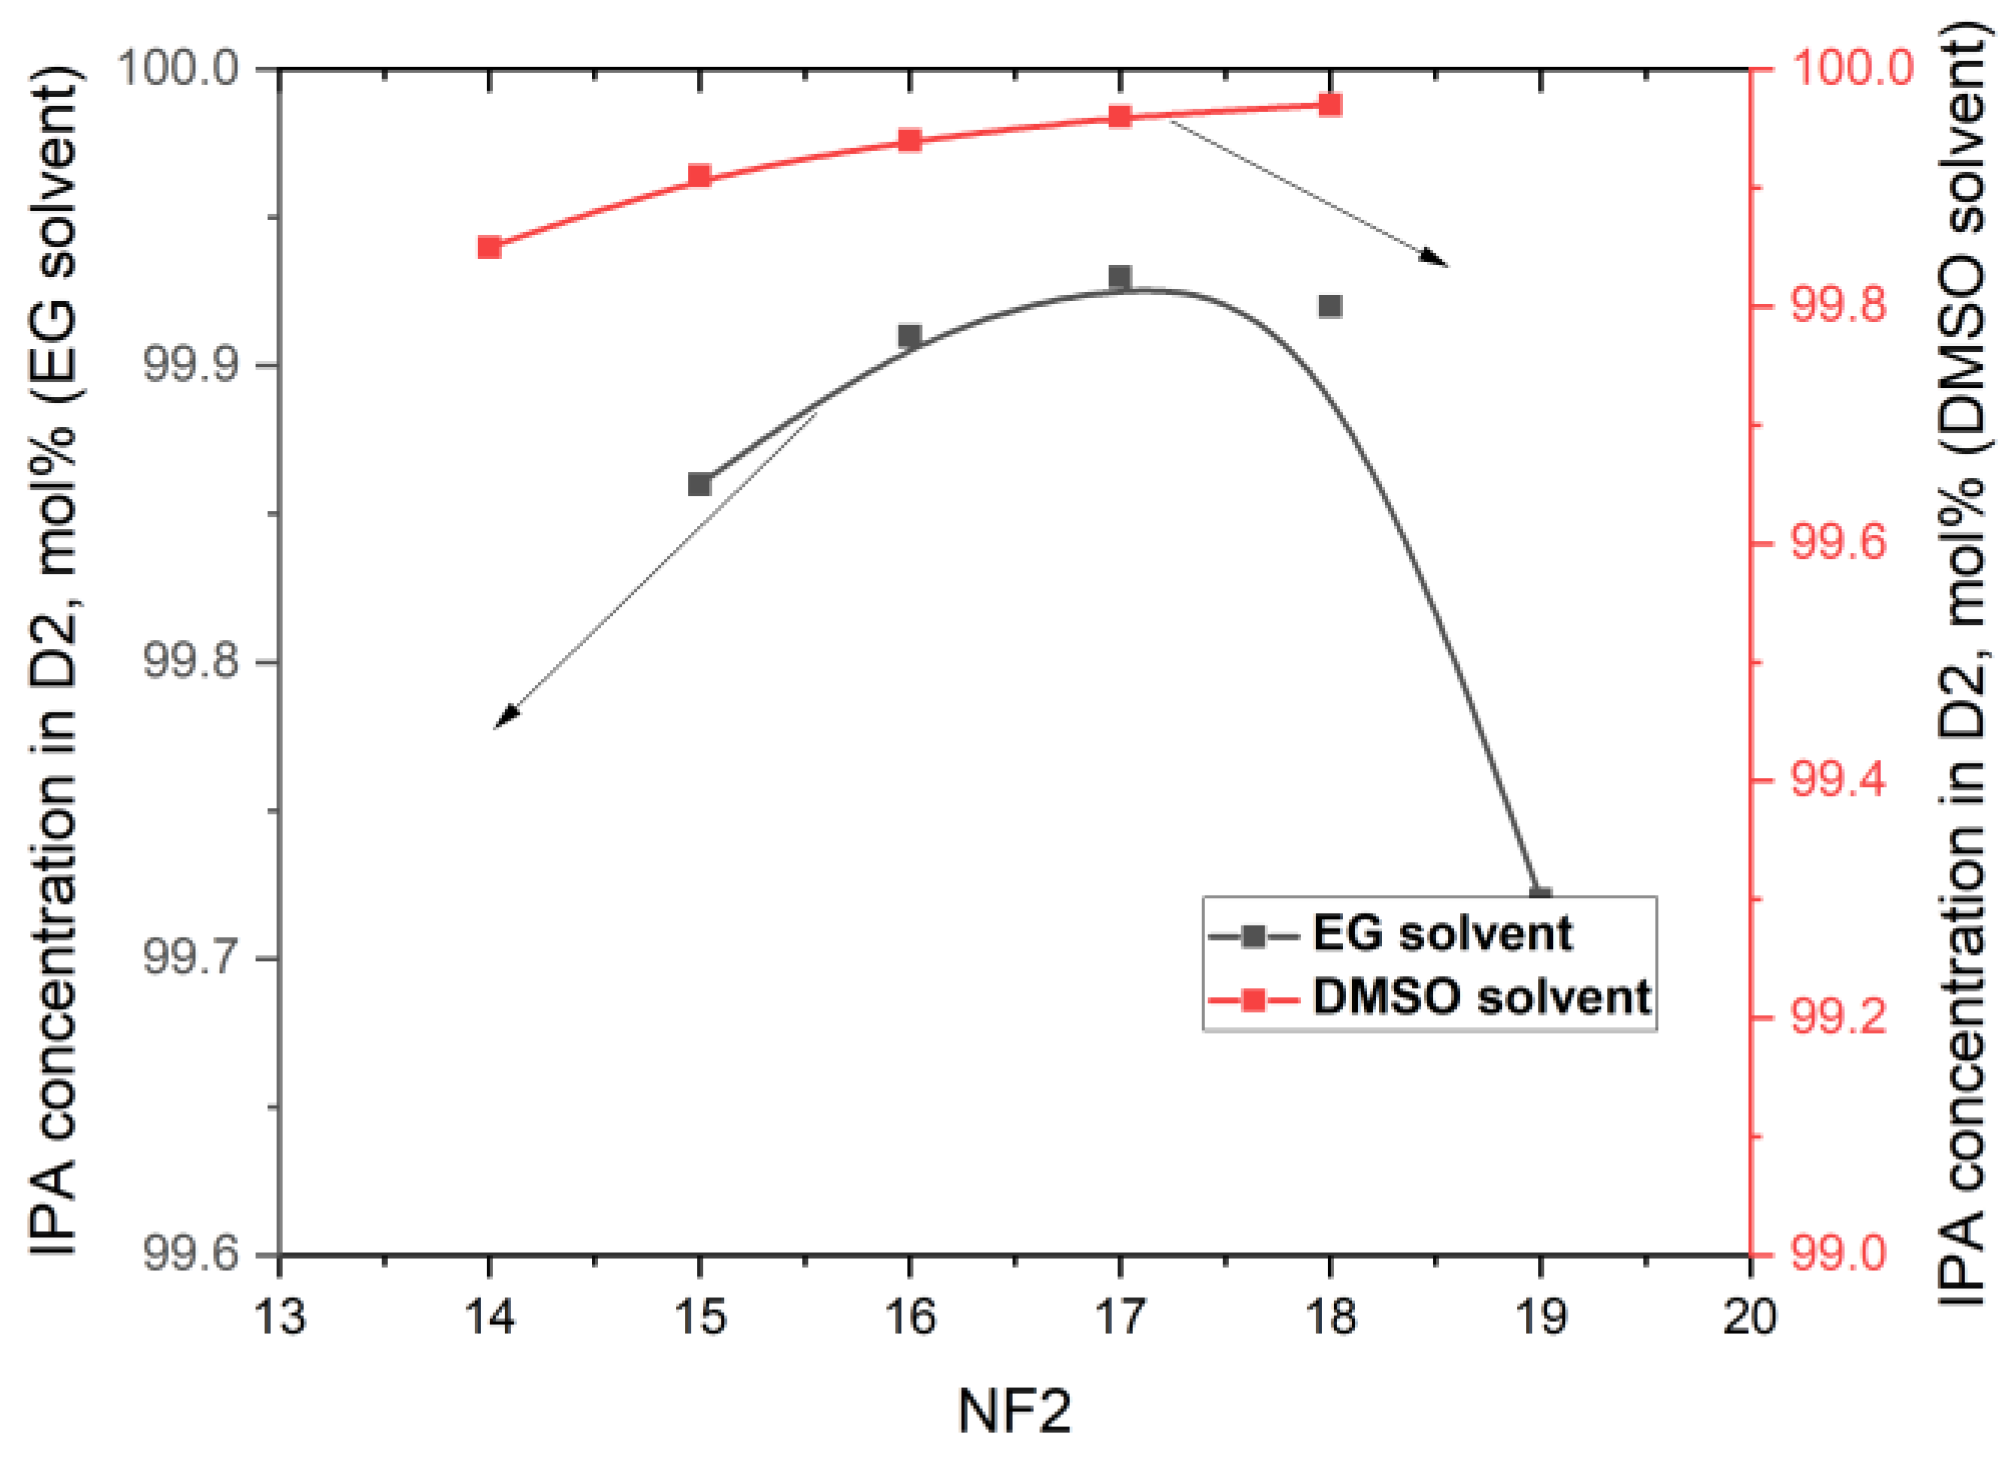
- The next step in our simulations was to study the effect of the feed tray (NF2) position on the target concentrations. All the other parameters remain unchanged. For the EDC with EG, the range of the feed tray position was in the range of 15 to 19, and for the EDC with DMSO, in the range of 14 to 18. The position of NF2 has very little influence on the concentrations of IPA and/or solvents in D2, as illustrated in Figure 5. Lowering the feed from tray 16 to tray 17 leads to an increase in the IPA concentration in D2 from 99.91 mol% to 99.93 mol% in the EDC with EG and from 99.94 mol% to 99.96 mol% in the EDC with DMSO. A significant decrease in DMSO concentration in D2 was not expected.
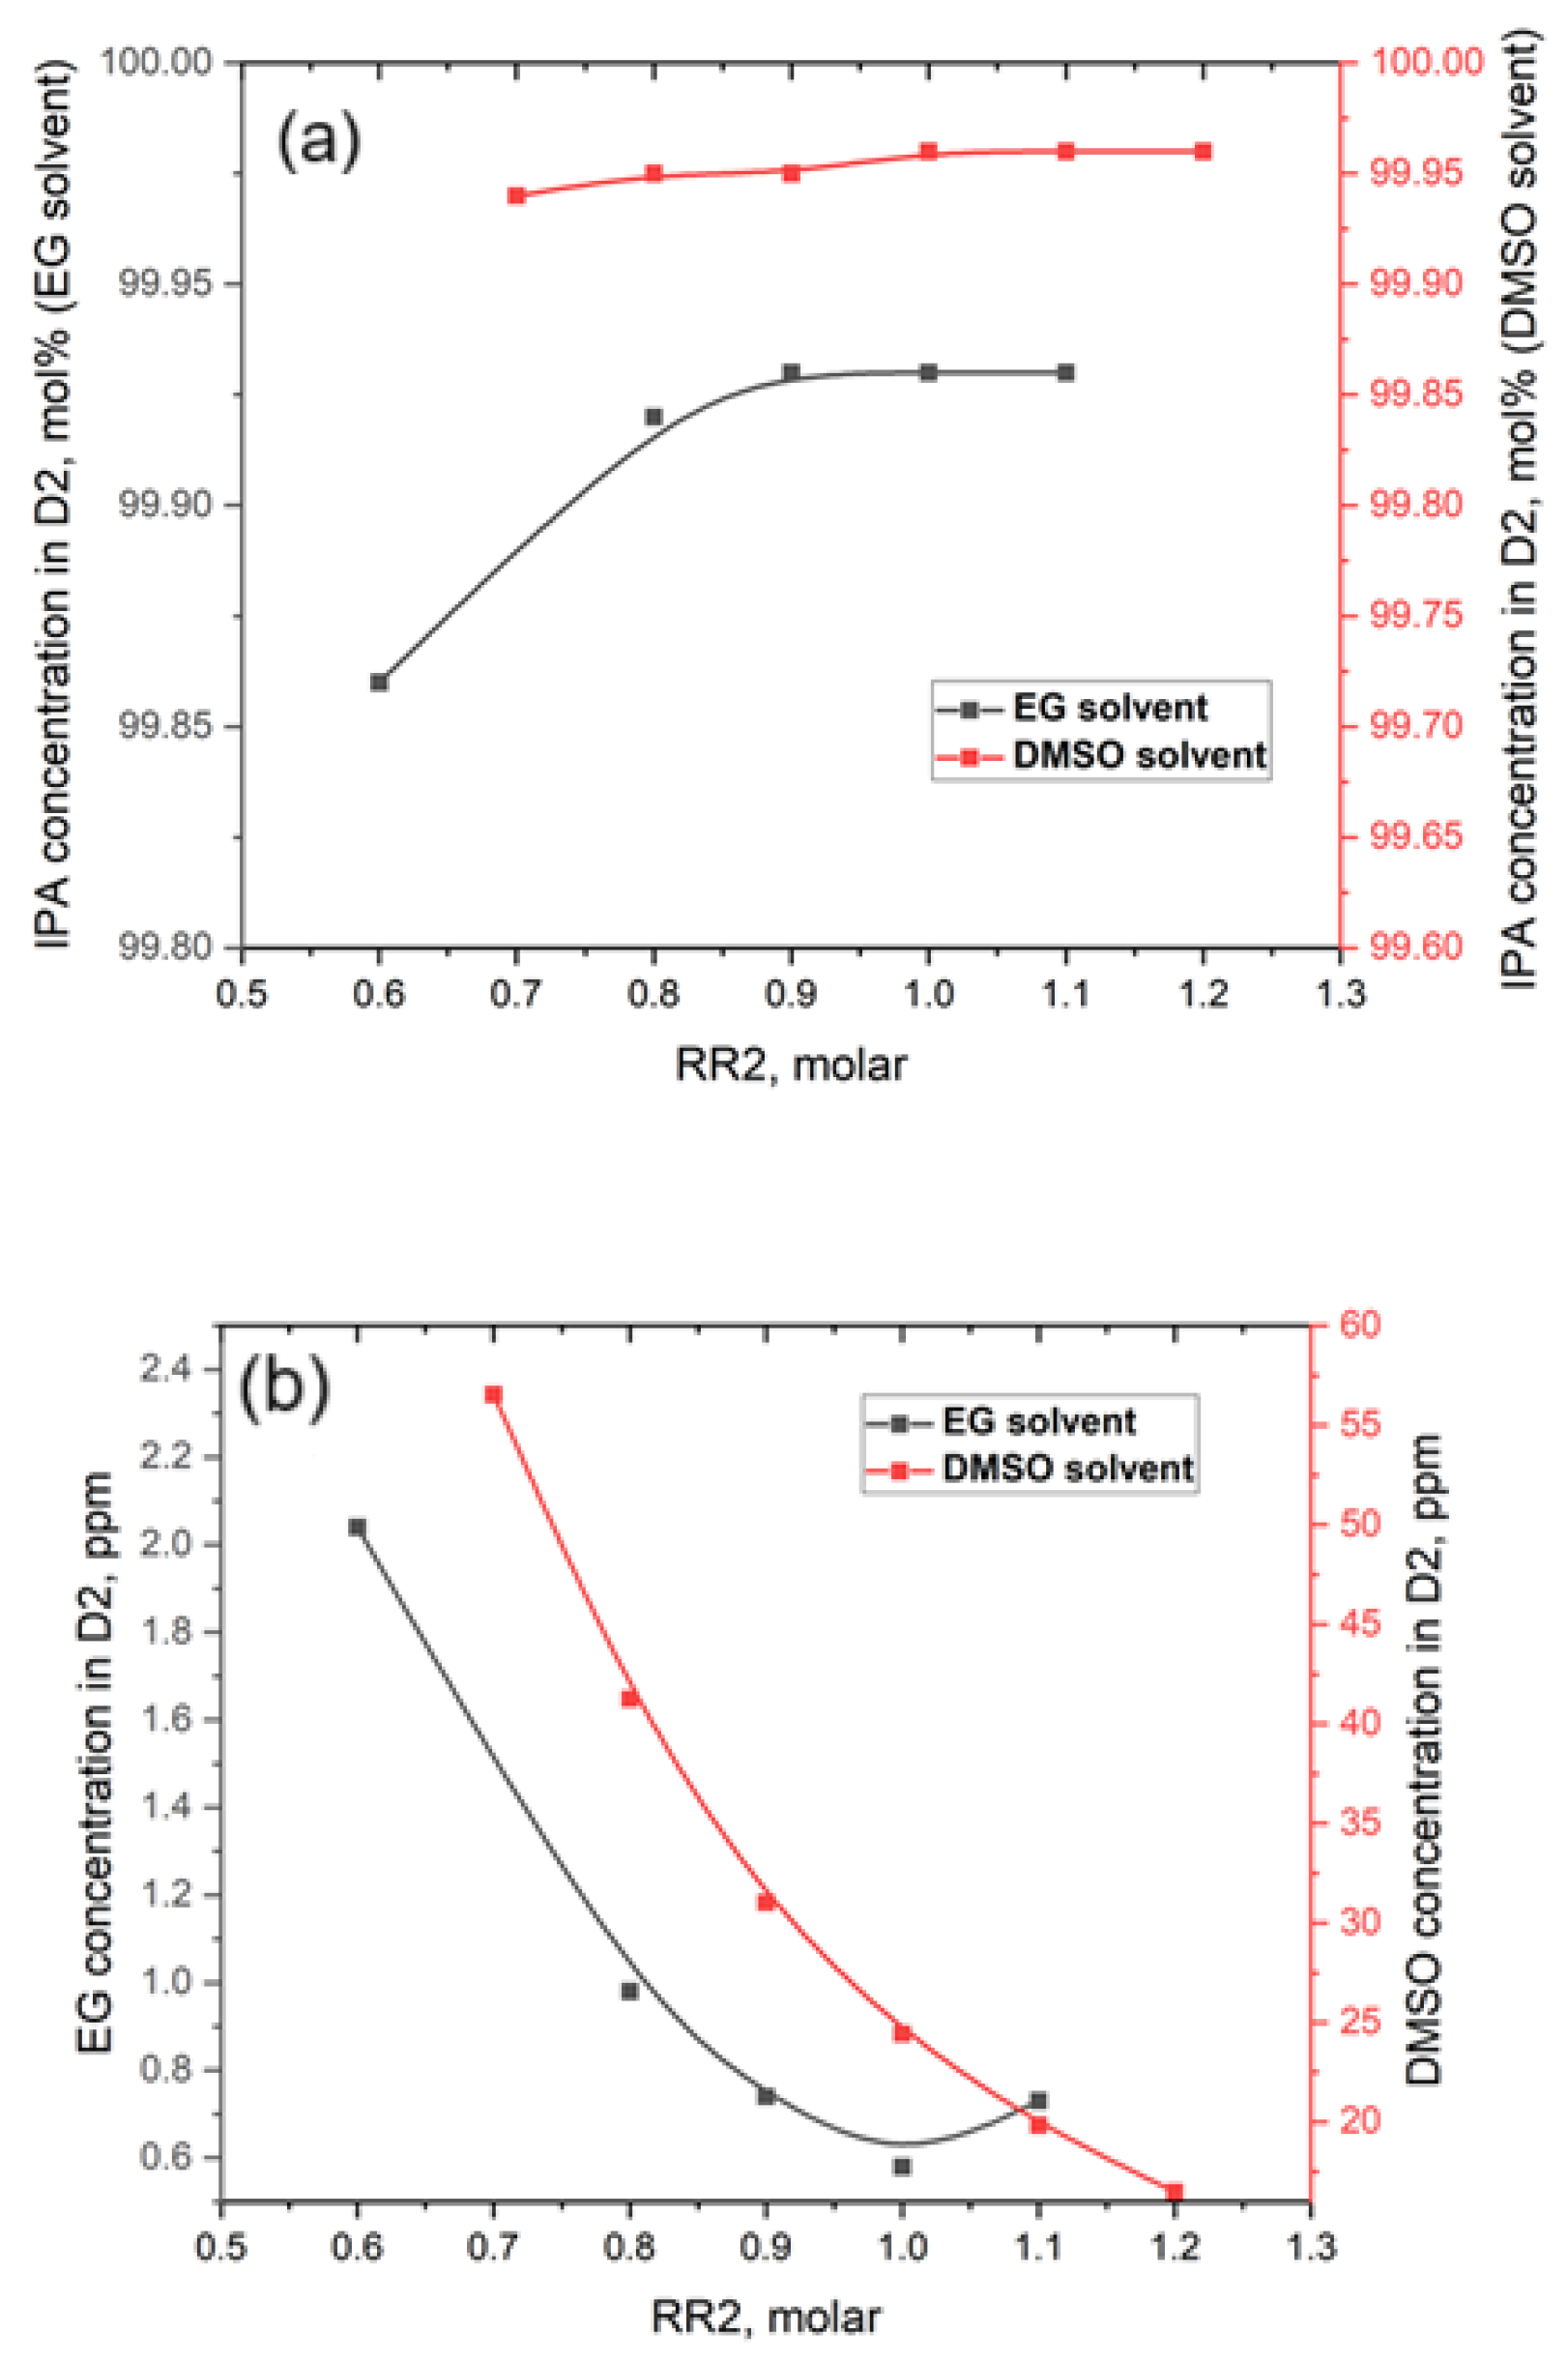
- We expect the reflux ratio (RR2) to have a significant contribution to the separation. Also, the reflux ratio plays a crucial role in the overall TCED process, affecting both the diameter and investment costs of the EDCs. It also impacts the thermal duty of the condensers and reboilers, along with their associated utility consumption. Ideally, the reflux ratio should be kept as low as possible to minimize both investment and operating costs. However, the most important factor in determining the optimal ratio is the quality of the D2 distilled product. The investigation range of RR2 was 0.6 to 1.1 in the EDC with EG and in the range of 0.7 to 1.2 in the EDC with DMSO. As can be seen from Figure 6a,b, the increase in RR2 values leads to a slight increase in IPA concentration but also to an expected decrease in DMSO concentration. So, in taking into account the targets of concentrations in D2, it can be concluded that an RR2 value of 1.1 provides an IPA concentration of 99.93 mol% and an EG concentration of 0.47 ppm. In the case of DMSO solvent, for an RR2 of 1.2, the IPA concentration of 99.96 mol% is very satisfactory, but the DMSO at 16.5 ppm is still very high.
- The last step in our iterative procedure refers to the feed tray position of solvent (NFE). This investigation was conducted only for the case of an EDC with DMSO. Lowering the NFE for DMSO by a single tray (from 5 to 6) has a pronounced impact on the decrease in DMSO concentration from 16.5 ppm to below 2 ppm (i.e., 1.57 ppm). A small decrease in IPA concentration was depicted (i.e., from 99.96 mol% to 99.94 mol%).
- The feed tray (NF3) was fixed at 7, and the reflux molar ratio (RR3) was fixed at 1.5 for the SRCs. The number of trays in the SRCs was changed from 13 to 17 trays in the EDC for both EG and DMSO solvents. The results of the changing effect of the number of trays (NT3) over the IPA and solvent concentration in D3 are reported in Figure 7. The increase in NT3 leads to a significant reduction in the solvent concentration in the D3 water stream. The reduction is substantial in the case of DMSO, from 383,000 ppm (38.30 mol%) for 13 trays in the SRC to only 0.008 ppm for 17 trays in the SRC. Regarding the EG concentration in D3, it is 0.53 ppm for 13 trays and 0.0022 ppm for 17 trays in the SRC. It is observed that the number of trays in the SRC has minimal impact on IPA concentration in D3, which reaches a maximum of 0.51 mol% in both cases studied. The optimum number of trays for the EG recovery column was selected to be 15, and for the DMSO recovery column, it was selected to be 16.
- The position of the feed tray on the composition of the D3 distillate is not notable. For these reasons, NF3 remains at 7.
- However, the reflux ratio (RR3) has considerable effects on the separation in the SRC. The investigation range of RR3 was 0.4 to 1.5 in the EG regeneration column and in the range of 0.8 to 1.5 in the SRC for DMSO. As can be seen from Figure 8, the increase in RR3 values leads to a drastic decrease in solvent concentration in water D3 flow. It can be concluded that an RR3 value of 0.6 results in an EG concentration of 1.2 ppm and an IPA concentration of 5133 ppm. In the case of DMSO solvent, its concentration in D3 for an RR3 of 1.4 is 1.04 ppm, and the IPA concentration is 5132 ppm.
3.2. Design of TCED Energy-Saving Processes
3.3. Economic Performance Comparison of TCED Processes
4. Conclusions
Supplementary Materials
Author Contributions
Funding
Institutional Review Board Statement
Informed Consent Statement
Data Availability Statement
Conflicts of Interest
Nomenclature
| Abbreviations | |
| DMSO | dimethyl sulfoxide |
| EG | ethylene glycol |
| ED | extractive distillation |
| IPA | isopropanol |
| PG | Propylene glycol |
| TCED | three-column extractive distillation |
| LMTDs | log-mean temperature differences |
| SH | flowsheet for energy-saving process by sensible heat recovery of hot streams |
| NRTL | non-random two-liquid |
| UNIFAC | universal quasi-chemical |
| TACC | total annual capital costs (USD/y) |
| TAEC | total annual energy costs (USD/y) |
| TAC | total annual cost (USD/y) |
| Symbols | |
| PC | preconcentration column |
| EDC | extractive distillation column |
| SRC | solvent recovery column |
| Bn | bottom product for column n (kmol/h) |
| Dn | distillate product for column n (kmol/h) |
| NF1 | feeding location for the fresh feed |
| NF2 | feeding location for the feed to column EDC |
| NF3 | feeding location for the feed to column SRC |
| NFE | feeding location for the solvent |
| NTn | number of trays for column n |
| RRn | reflux ratio for column n |
| Condensern | condenser duty for column n (kW) |
| Reboilern | reboiler duty for column n (kW) |
| Cooler | cooler duty (kW) |
References
- Duan, C.; Li, C. Energy-saving improvement of heat integration for separating dilute azeotropic components in extractive distillation. Energy 2023, 263, 125821. [Google Scholar] [CrossRef]
- Zhong, J.; Cheng, H.; Dai, Y.; Jiao, Y.; Wang, K.; Xin, L.; Zhang, Y.; Zhu, Z.; Cui, P.; Lu, Y.; et al. Design and multiple performance evaluation of green sustainable process for azeotropes separation via extractive distillation. ACS Sustain. Chem. Eng. 2023, 11, 16849–16881. [Google Scholar] [CrossRef]
- Pan, J.; Li, J.; Xu, Z.; Wu, H.; Ye, Q. Economic, thermodynamic and environmental analysis of separating high-concentration azeotropic mixture by a novel extractive dividing wall column configuration combining preconcentration and extractive distillation based on multi-objective optimization. Energy 2025, 319, 134935. [Google Scholar] [CrossRef]
- Wang, C.; Zhuang, Y.; Dong, Y.; Liu, L.; Zhang, L.; Du, J. Conceptual design of sustainable extractive distillation processes combining preconcentration and extractive distillation functions for separating ternary multi-azeotropic mixture. Chem. Eng. Sci. 2022, 263, 118088. [Google Scholar] [CrossRef]
- Wu, Q.; Wang, Z.; Xu, W.; Xin, L.; Hu, R.; Zhu, Z.; Wang, Y.; Cui, P. Innovative extractive distillation process combining preconcentration and solvent recovery functions for efficiently separating diisopropyl ether/isopropanol/water. Sep. Purif. Technol. 2025, 360, 131021. [Google Scholar] [CrossRef]
- Wang, Z.; Xin, L.; Wang, Y.; Wu, Q.; Xu, W.; Zhu, Z.; Wang, Y.; Cui, P. Optimization and dynamic control of green energy-saving process for azeotropes separation by mixed solvent extractive distillation. Renew. Sustain. Energy Rev. 2025, 218, 115813. [Google Scholar] [CrossRef]
- Duan, C.; Li, C. Energy-saving improvement of heat integration for separating dilute azeotropic components in extractive distillation: Part II-process integration. Sep. Purif. Technol. 2025, 360, 131009. [Google Scholar] [CrossRef]
- Belinchón, A.; Navarro, P.; Rubias, A.; Santiago, R.; Hernández, E.; Palomar, J. Extractive distillation for separating short-chain alcohols from water using cyclic carbonates as an extractive solvent: Experimental and process simulation. Sep. Purif. Technol. 2025, 370, 133283. [Google Scholar] [CrossRef]
- Hegely, L.; Nemeth, B.; Lang, P. Isopropanol dehydration by batch extractive distillation under variable pressure. Sep. Purif. Technol. 2025, 369, 133178. [Google Scholar] [CrossRef]
- Spatolisano, E.; Pellegrini, L.A. Dehydration of IPA-H2O mixture: Review of fundamentals and proposal of novel energy-efficient separation schemes. Chem. Eng. Sci. 2023, 273, 118672. [Google Scholar] [CrossRef]
- Thi, H.T.D.; Toth, A.J. Environment-Oriented Assessment of Hybrid Methods for Separation of N-Propanol–Water Mixtures: Combination of Distillation and Hydrophilic Pervaporation Processes. Membranes 2025, 15, 48. [Google Scholar] [CrossRef]
- Dongmin, H.; Chen, Y.; Shi, D. Different extractive distillation processes for isopropanol dehydration using low transition temperature mixtures as entrainers. Chem. Eng. Process. 2022, 178, 109049. [Google Scholar] [CrossRef]
- Lo, K.-M.; Chien, I.-L. Efficient separation method for tert -butanol dehydration via extractive distillation. J. Taiwan Inst. Chem. Eng. 2017, 73, 27–36. [Google Scholar] [CrossRef]
- Aniya, V.; De, D.; Singh, A.; Satyavathi, B. Design and operation of extractive distillation systems using different class of entrainers for the production of fuel grade tert-butyl alcohol: A techno-economic assessment. Energy 2018, 144, 1013–1025. [Google Scholar] [CrossRef]
- Arifin, S.; Chien, I.-L. Design and Control of an Isopropyl Alcohol Dehydration Process via Extractive Distillation Using Dimethyl Sulfoxide as an Entrainer. Ind. Eng. Chem. Res. 2008, 47, 790–803. [Google Scholar] [CrossRef]
- Luyben, W.L. Plantwide control of an isopropyl alcohol dehydration process. AIChE J. 2006, 52, 2290–2296. [Google Scholar] [CrossRef]
- Kalla, S.; Upadhyaya, S.; Singh, K.; Dohare, R.K.; Agarwal, M. A case study on separation of IPA-water mixture by extractive distillation using aspen plus. Int. J. Adv. Technol. Eng. Explor. 2016, 3, 187–193. [Google Scholar] [CrossRef]
- Nicolae, M.; Neagu, M.; Cursaru, D.-L. Energy-Saving Extractive Distillation Process for Isopropanol Dehydration with Propylene Glycol as Novel Extractive Solvent. Appl. Sci. 2024, 14, 9420. [Google Scholar] [CrossRef]
- Prausnitz, J.; Lichtenthaler, R.; de Azevedo, E.G. Molecular Thermodynamics of Fluid-Phase Equilibria, 3rd ed.; Prentice-Hall International Series in the Physical and Chemical Engineering Sciences; Prentice Hall PTR: Upper Saddle River, NJ, USA, 1999. [Google Scholar]
- Cui, Y.; Zhang, Z.; Shi, X.; Guang, C.; Gao, J. Triple-column side-stream extractive distillation optimization via simulated annealing for the benzene/isopropanol/water separation. Sep. Purif. Technol. 2020, 236, 116303. [Google Scholar] [CrossRef]
- Sommer, S.; Melin, T. Design and Optimization of Hybrid Separation Processes for the Dehydration of 2-Propanol and Other Organics. Ind. Eng. Chem. Res. 2004, 43, 5248–5259. [Google Scholar] [CrossRef]
- Knight, J.R.; Doherty, M.F. Optimal design and synthesis of homogeneous azeotropic distillation sequences. Ind. Eng. Chem. Res. 1989, 28, 564–572. [Google Scholar] [CrossRef]
- Qi, K.; Li, Z.; Zhang, C.; Tan, X.; Wan, C.; Liu, X.; Wang, L.; Lee, D.-J. Biodegradation of real industrial wastewater containing ethylene glycol by using aerobic granular sludge in a continuous-flow reactor: Performance and resistance mechanism. Biochem. Eng. J. 2020, 161, 107711. [Google Scholar] [CrossRef]
- Staples, C.; Williams, J.; Craig, G.; Roberts, K. Fate, Effects and potential environmental risks of ethylene glycol: A review. Chemosphere 2001, 43, 377–383. [Google Scholar] [CrossRef]
- Bielefeldt, A.; Illangasekare, T.; Uttecht, M.; LaPlante, R. Biodegradation of propylene glycol and associated hydrodynamic effects in sand. Water Res. 2002, 36, 1707–1714. [Google Scholar] [CrossRef] [PubMed]
- West, R.; Banton, M.; Hu, J.; Klapacz, J. The distribution, fate, and effects of propylene glycol substances in the environment. Rev. Environ. Contam. Toxicol. 2014, 232, 107–138. [Google Scholar] [CrossRef]


| Parameters | EDC with PG Solvent * | EDC with EG Solvent | EDC with DMSO Solvent | ||
|---|---|---|---|---|---|
| D2 flowrate | kmol/h | 109.07 | 108.79 | 108.76 | |
| kg/h | 6551.47 | 6534.05 | 6533.55 | ||
| D2 composition | molar | IPA | 99.92 | 99.93 | 99.94 |
| Water | 807 ppm | 706.4 ppm | 600 ppm | ||
| Solvent | 5.5 ppm | 0.47 ppm | 1.57 ppm | ||
| B2 flowrate | kmol/h | 628.32 | 267.43 | 192.21 | |
| kg/h | 44,416.12 | 14,037.31 | 11,517.24 | ||
| B2 composition | molar | Solvent | 90.69 | 78.15 | 69.59 |
| Water | 9.30 | 21.74 | 30.25 | ||
| IPA | 97.7 ppm | 1121 ppm | 1560 ppm | ||
| NT2 | 30 | 22 | 23 | ||
| NF2 | 20 | 17 | 17 | ||
| NS2 | 5 | 5 | 6 | ||
| RR2 | 1.5 | 1.1 | 1.2 | ||
| Condenser 2, duty | kWh | 2999 | 2512 | 2631 | |
| Condenser 2, area | m2 | 86.70 | 72.30 | 76.02 | |
| Water consumption to condenser 2 (a) | kg/h | 128,899.085 | 107,979.57 | 113,108.26 | |
| Reboiler 2, duty | kWh | 6639 | 3431 | 3205 | |
| Reboiler 2, area | m2 | 344.55 | 120 | 111.71 | |
| Steam consumption to reboiler 2 (b) | kg/h | 12,118 | 6262 | 5849 | |
| Diameter | m | 1.524 | 1.219 | 1.219 | |
| Parameters | SRC with PG Solvent * | SRC with EG Solvent | SRC with DMSO Solvent | ||
|---|---|---|---|---|---|
| D3 flowrate | kmol/h | 58.51 | 58.42 | 58.44 | |
| kg/h | 1056.68 | 1065.00 | 1065.52 | ||
| D3 composition | molar | Water | 99.89 | 99.49 | 99.49 |
| solvent | 2.0 ppm | 1.2 ppm | 1.04 ppm | ||
| IPA | 1050 ppm | 5133 ppm | 5132 ppm | ||
| B3 flowrate | kmol/h | 569.81 | 209.00 | 133.77 | |
| kg/h | 43,359.60 | 12,972.31 | 10,451.72 | ||
| B3 composition | molar | Solvent | 100 | 100 | 100 |
| Water | 5 ppm | 5 ppm | 5 ppm | ||
| IPA | - | - | - | ||
| NT3 | 17 | 15 | 16 | ||
| NF3 | 7 | 7 | 7 | ||
| RR3 | 1.9 | 0.6 | 1.4 | ||
| Condenser 3, duty | kWh | 1928 | 1066 | 1599 | |
| Condenser 3, area | m2 | 38.70 | 21.74 | 32.77 | |
| Water consumption to condenser 3 (a) | kg/h | 83,690.3 | 45,813.3 | 68,733.9 | |
| Reboiler 3, duty | kWh | 2724 | 1514 | 1781 | |
| Reboiler 3, area | m2 | 94.11 | 65.00 | 66.65 | |
| Steam consumption to reboiler 3 (b) | kg/h | 5592 | 3108 | 3656 | |
| Cooler duty | kWh | 4418 | 1352 | 740 | |
| Cooler area | m2 | 101 | 29.7 | 16.6 | |
| Water consumption to cooler a | kg/h | 189,954.02 | 58,110.33 | 31,791.5 | |
| Diameter | m | 1.219 | 0.914 | 1.067 | |
| Values | PG Solvent * | EG Solvent | DMSO Solvent |
|---|---|---|---|
| Flowrate in B3, kmol/h | 569.81 | 209 | 133.8 |
| Temperature of B3, K | 464.93 | 474.9 | 468.9 |
| Temperature of B3 after Heater 2, K | 415.77 | 358.15 | 358.15 |
| D1 temperature before Heater 2, K | 355.86 | 355.86 | 355.86 |
| D1 temperature after Heater 2 | 386.25 (vapor fraction of 1.00) | 358.36 (vapor fraction of 0.66) | 358.36 (vapor fraction of 0.36) |
| Reboiler 2 duty before heat recovery, kWh | 6639 | 3431 | 3205 |
| Reboiler 2 duty after heat recovery, kWh | 4664 | 2174 | 2522 |
| Reboiler 2 energy saving, % | 29.75 | 36.64 | 21.31 |
| Cooler duty before heat recovery, kWh | 4418 | 1352 | 740 |
| Cooler duty after heat recovery, kWh | 2441 | 96.80 | 58.16 |
| Cooler energy saving, % | 44.75 | 92.84 | 92.14 |
| TCED PG * | SH PG * | TCED EG | SH EG | TCED DMSO | SH DMSO | |
|---|---|---|---|---|---|---|
| Capital cost (a), USD | 10,371,453 | 10,173,728 | 6,187,377 | 5,519,908 | 6,824,645 | 7,028,530 |
| Capital cost saving (% difference) | - | 1.90 | - | 10.79 | - | +2.9 |
| Utility cost, USD/y | 3,236,748 | 2,726,795 | 2,119,247 | 1,758,288 | 2,148,365 | 1,923,793 |
| Utility cost saving (% difference) | - | 15.78 | - | 17.03 | - | 10.45 |
| TAC (a), USD/y | 6,693,899 | 6,116,673 | 4,181,706 | 3,598,257 | 4,423,247 | 4,266,637 |
| TAC saving (% difference) | - | 8.69 | - | 13.95 | - | 3.54 |
Disclaimer/Publisher’s Note: The statements, opinions and data contained in all publications are solely those of the individual author(s) and contributor(s) and not of MDPI and/or the editor(s). MDPI and/or the editor(s) disclaim responsibility for any injury to people or property resulting from any ideas, methods, instructions or products referred to in the content. |
© 2025 by the authors. Licensee MDPI, Basel, Switzerland. This article is an open access article distributed under the terms and conditions of the Creative Commons Attribution (CC BY) license (https://creativecommons.org/licenses/by/4.0/).
Share and Cite
Neagu, M.; Cursaru, D.-L. Techno-Economical Evaluation of Extractive Distillation Process for Isopropanol Dehydration with Different Extractive Solvents. Appl. Sci. 2025, 15, 6430. https://doi.org/10.3390/app15126430
Neagu M, Cursaru D-L. Techno-Economical Evaluation of Extractive Distillation Process for Isopropanol Dehydration with Different Extractive Solvents. Applied Sciences. 2025; 15(12):6430. https://doi.org/10.3390/app15126430
Chicago/Turabian StyleNeagu, Mihaela, and Diana-Luciana Cursaru. 2025. "Techno-Economical Evaluation of Extractive Distillation Process for Isopropanol Dehydration with Different Extractive Solvents" Applied Sciences 15, no. 12: 6430. https://doi.org/10.3390/app15126430
APA StyleNeagu, M., & Cursaru, D.-L. (2025). Techno-Economical Evaluation of Extractive Distillation Process for Isopropanol Dehydration with Different Extractive Solvents. Applied Sciences, 15(12), 6430. https://doi.org/10.3390/app15126430