
Vibration Response Characteristics of Prefabricated Frame Structures Around the Subway


Abstract
1. Introduction
2. Modeling Method and Verification of Prefabricated Frame Structures with Semirigid Joints
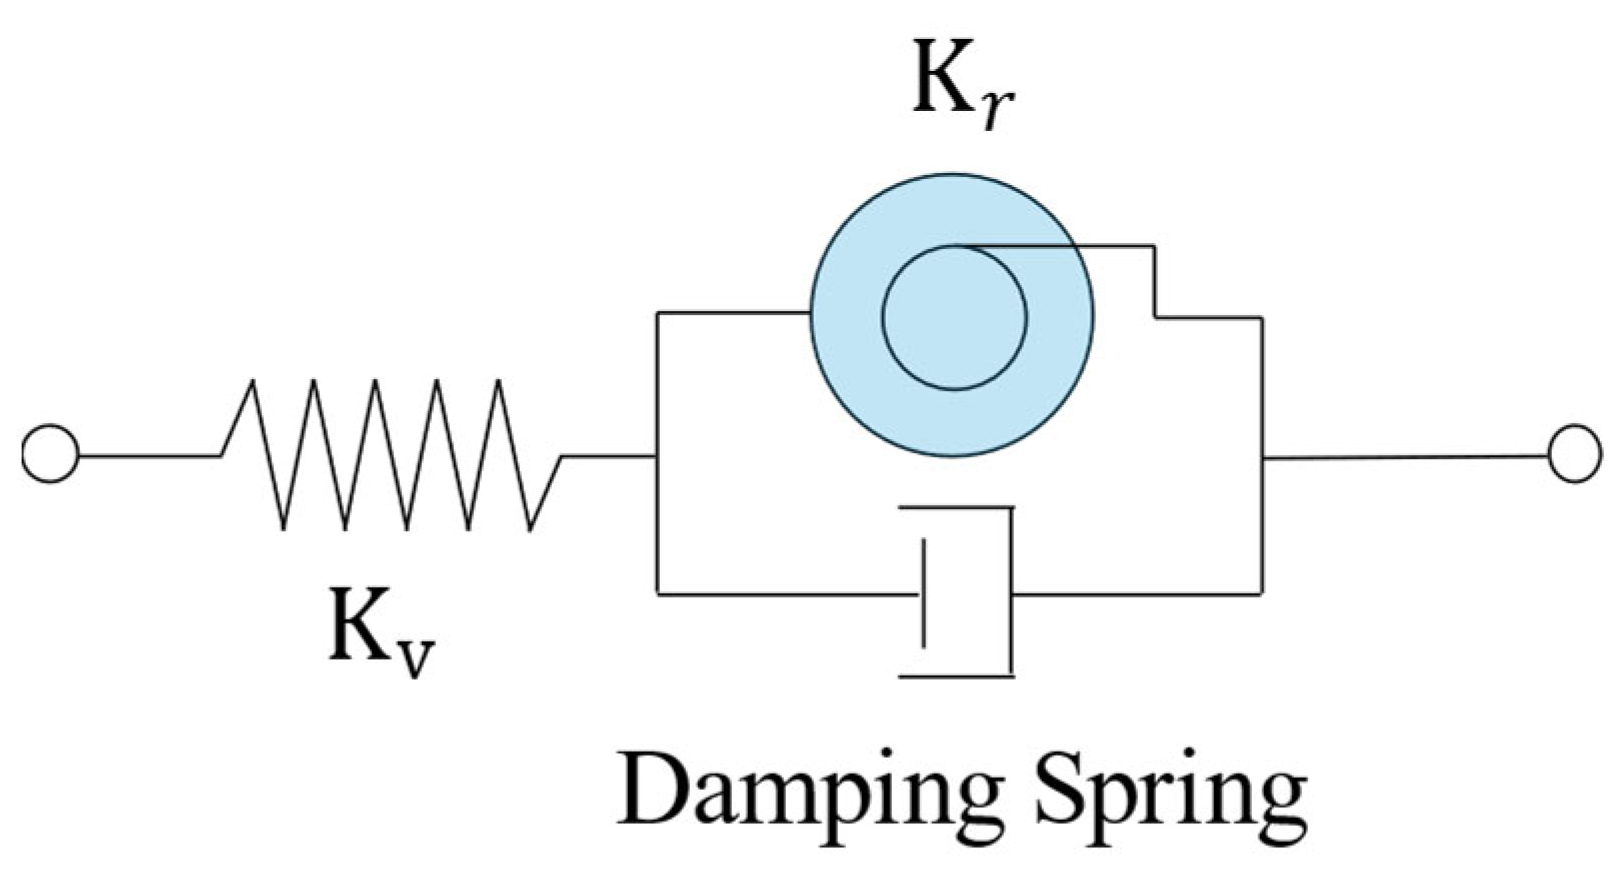
2.1. Selection of Joint Model for Prefabricated Frame Structures
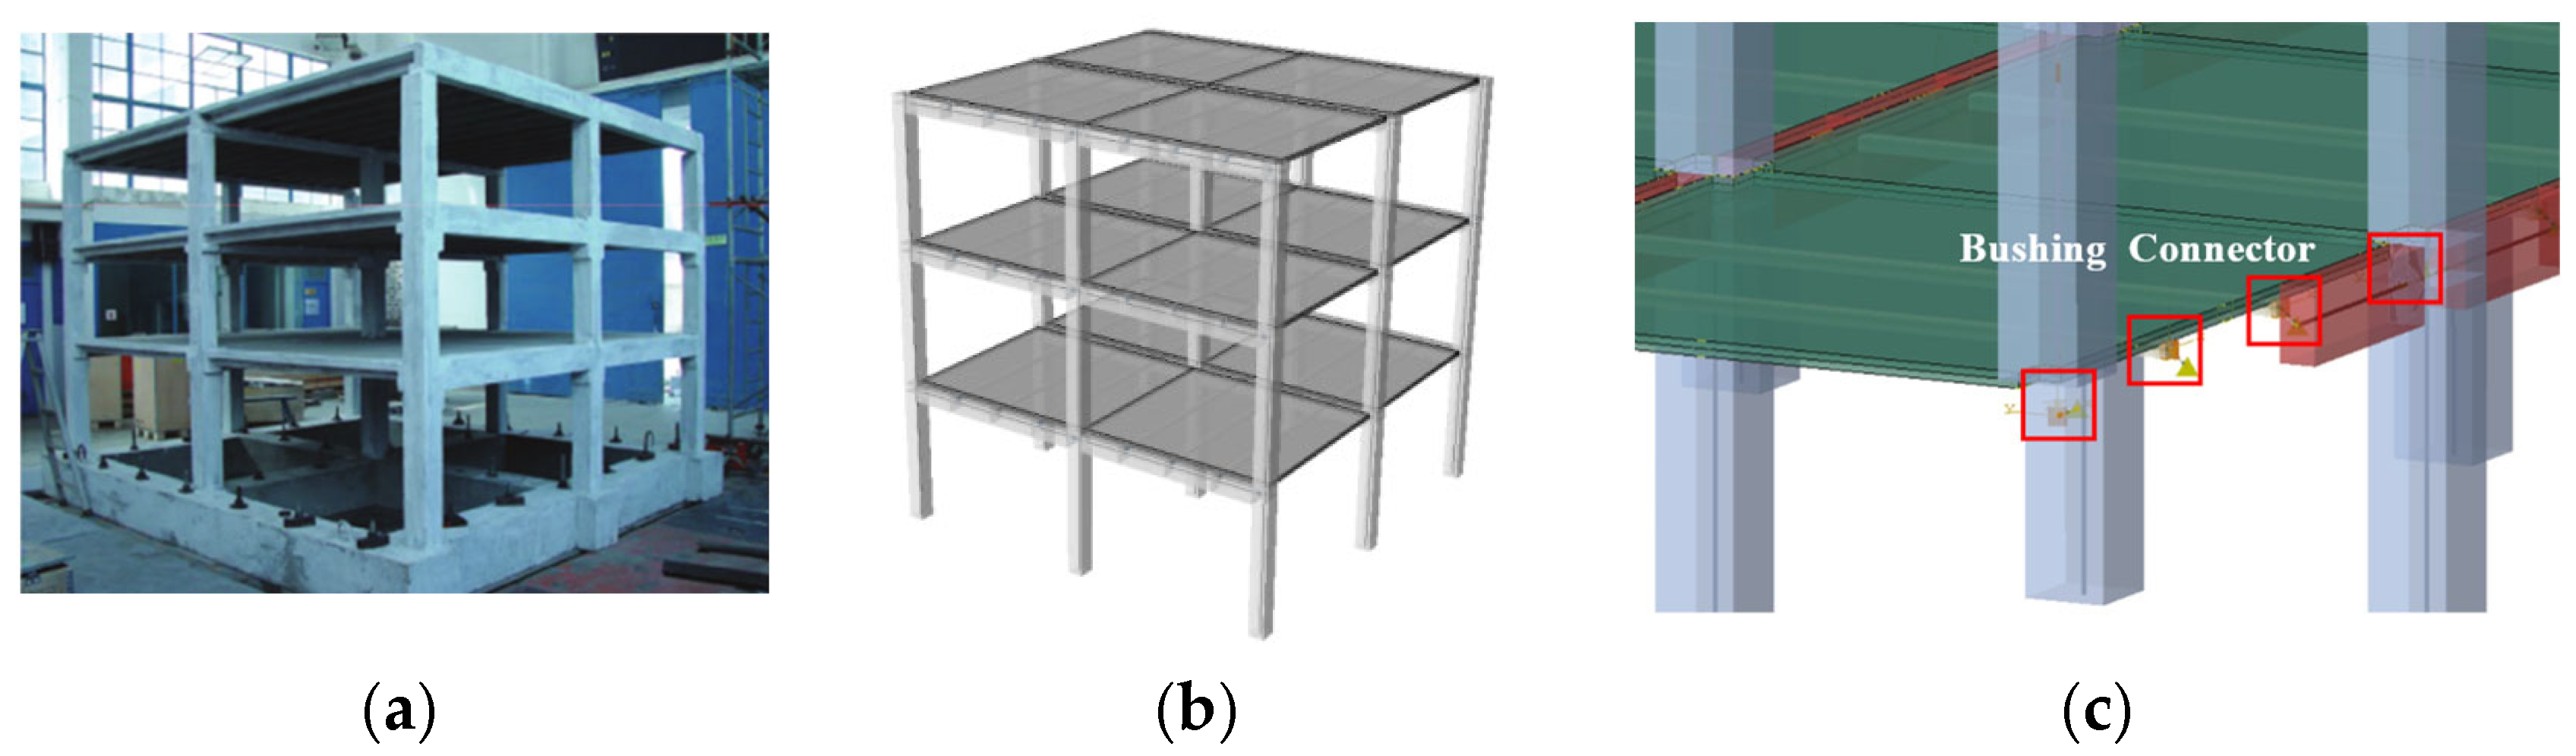
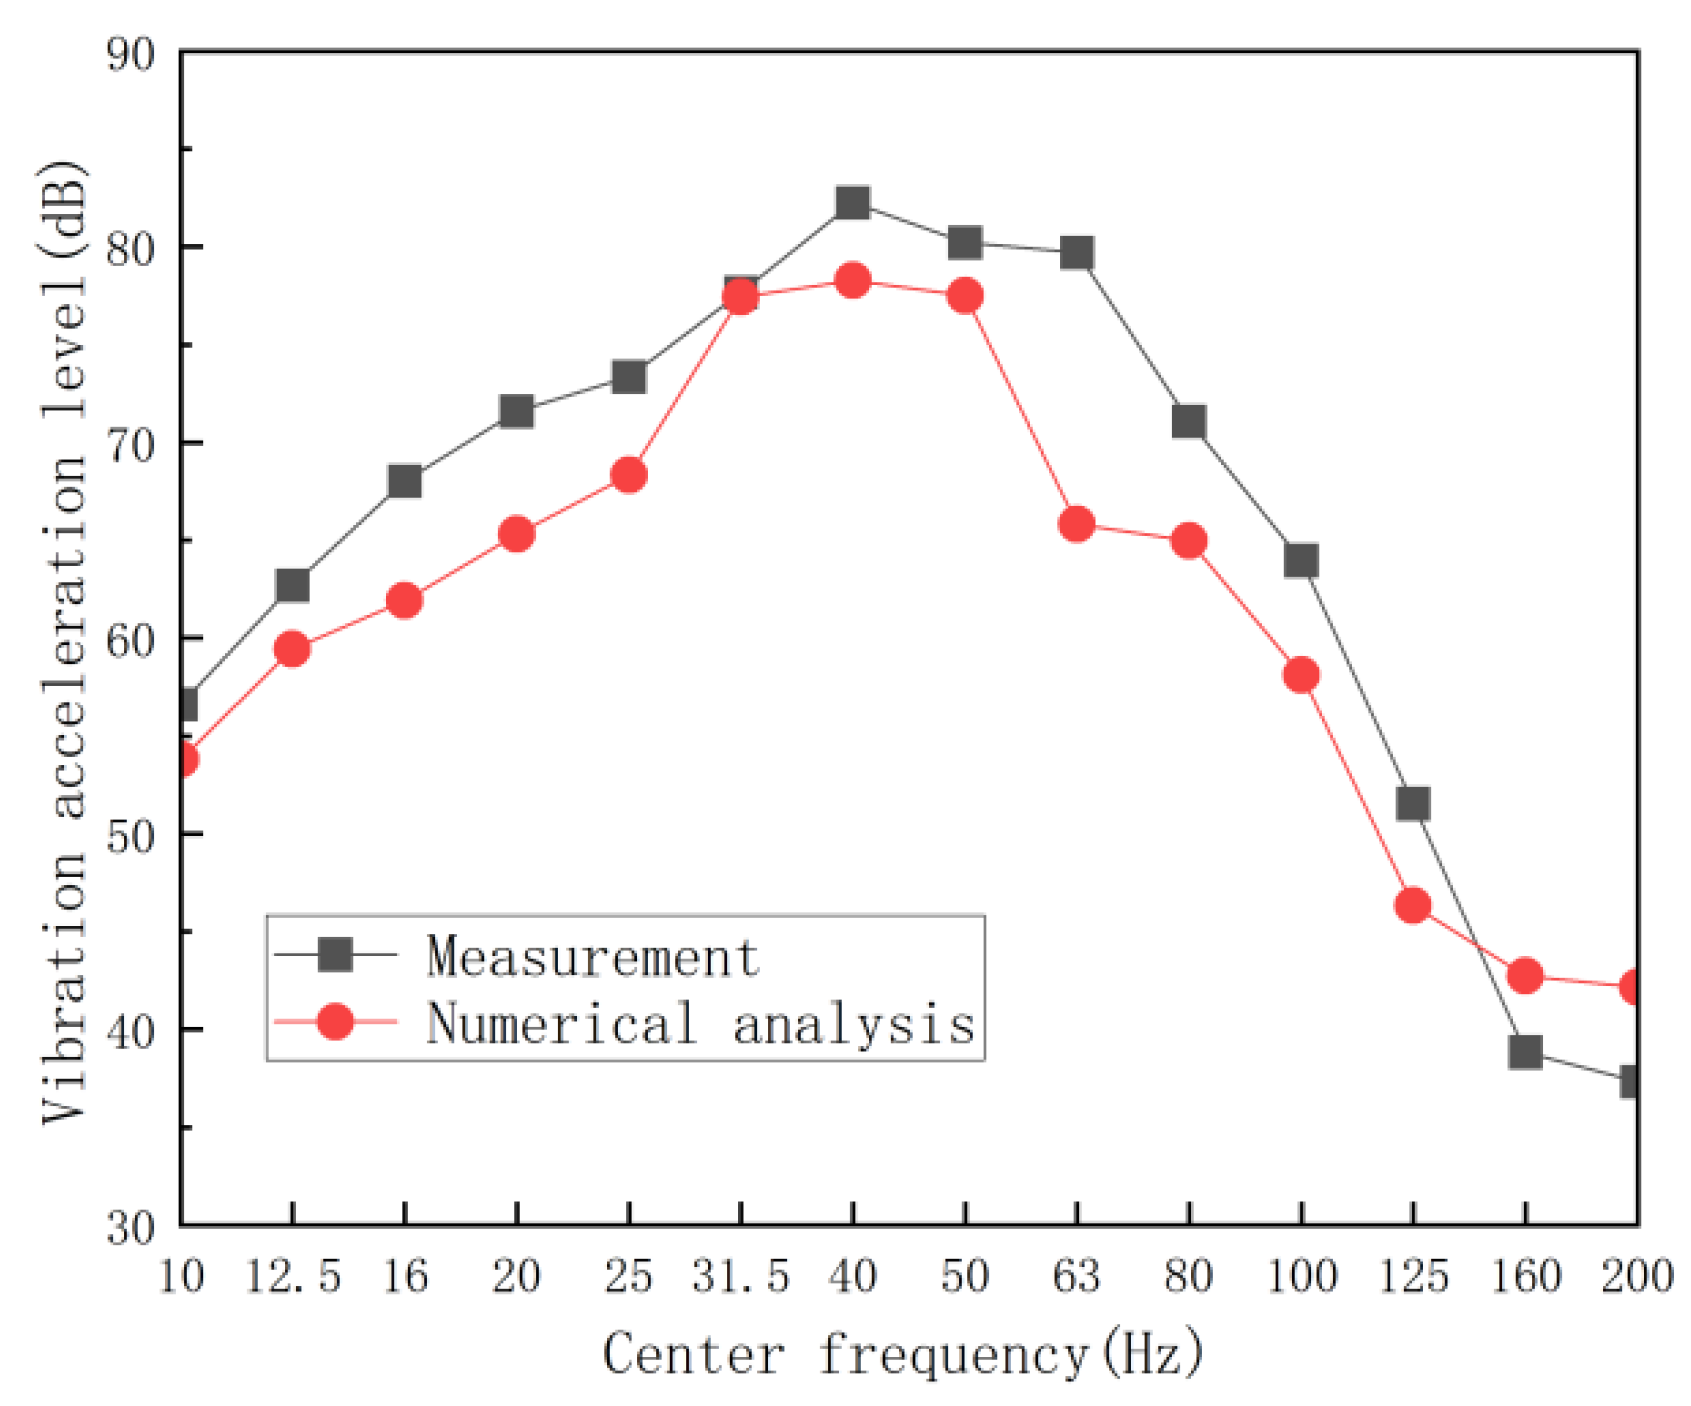
2.2. Verification of the Model
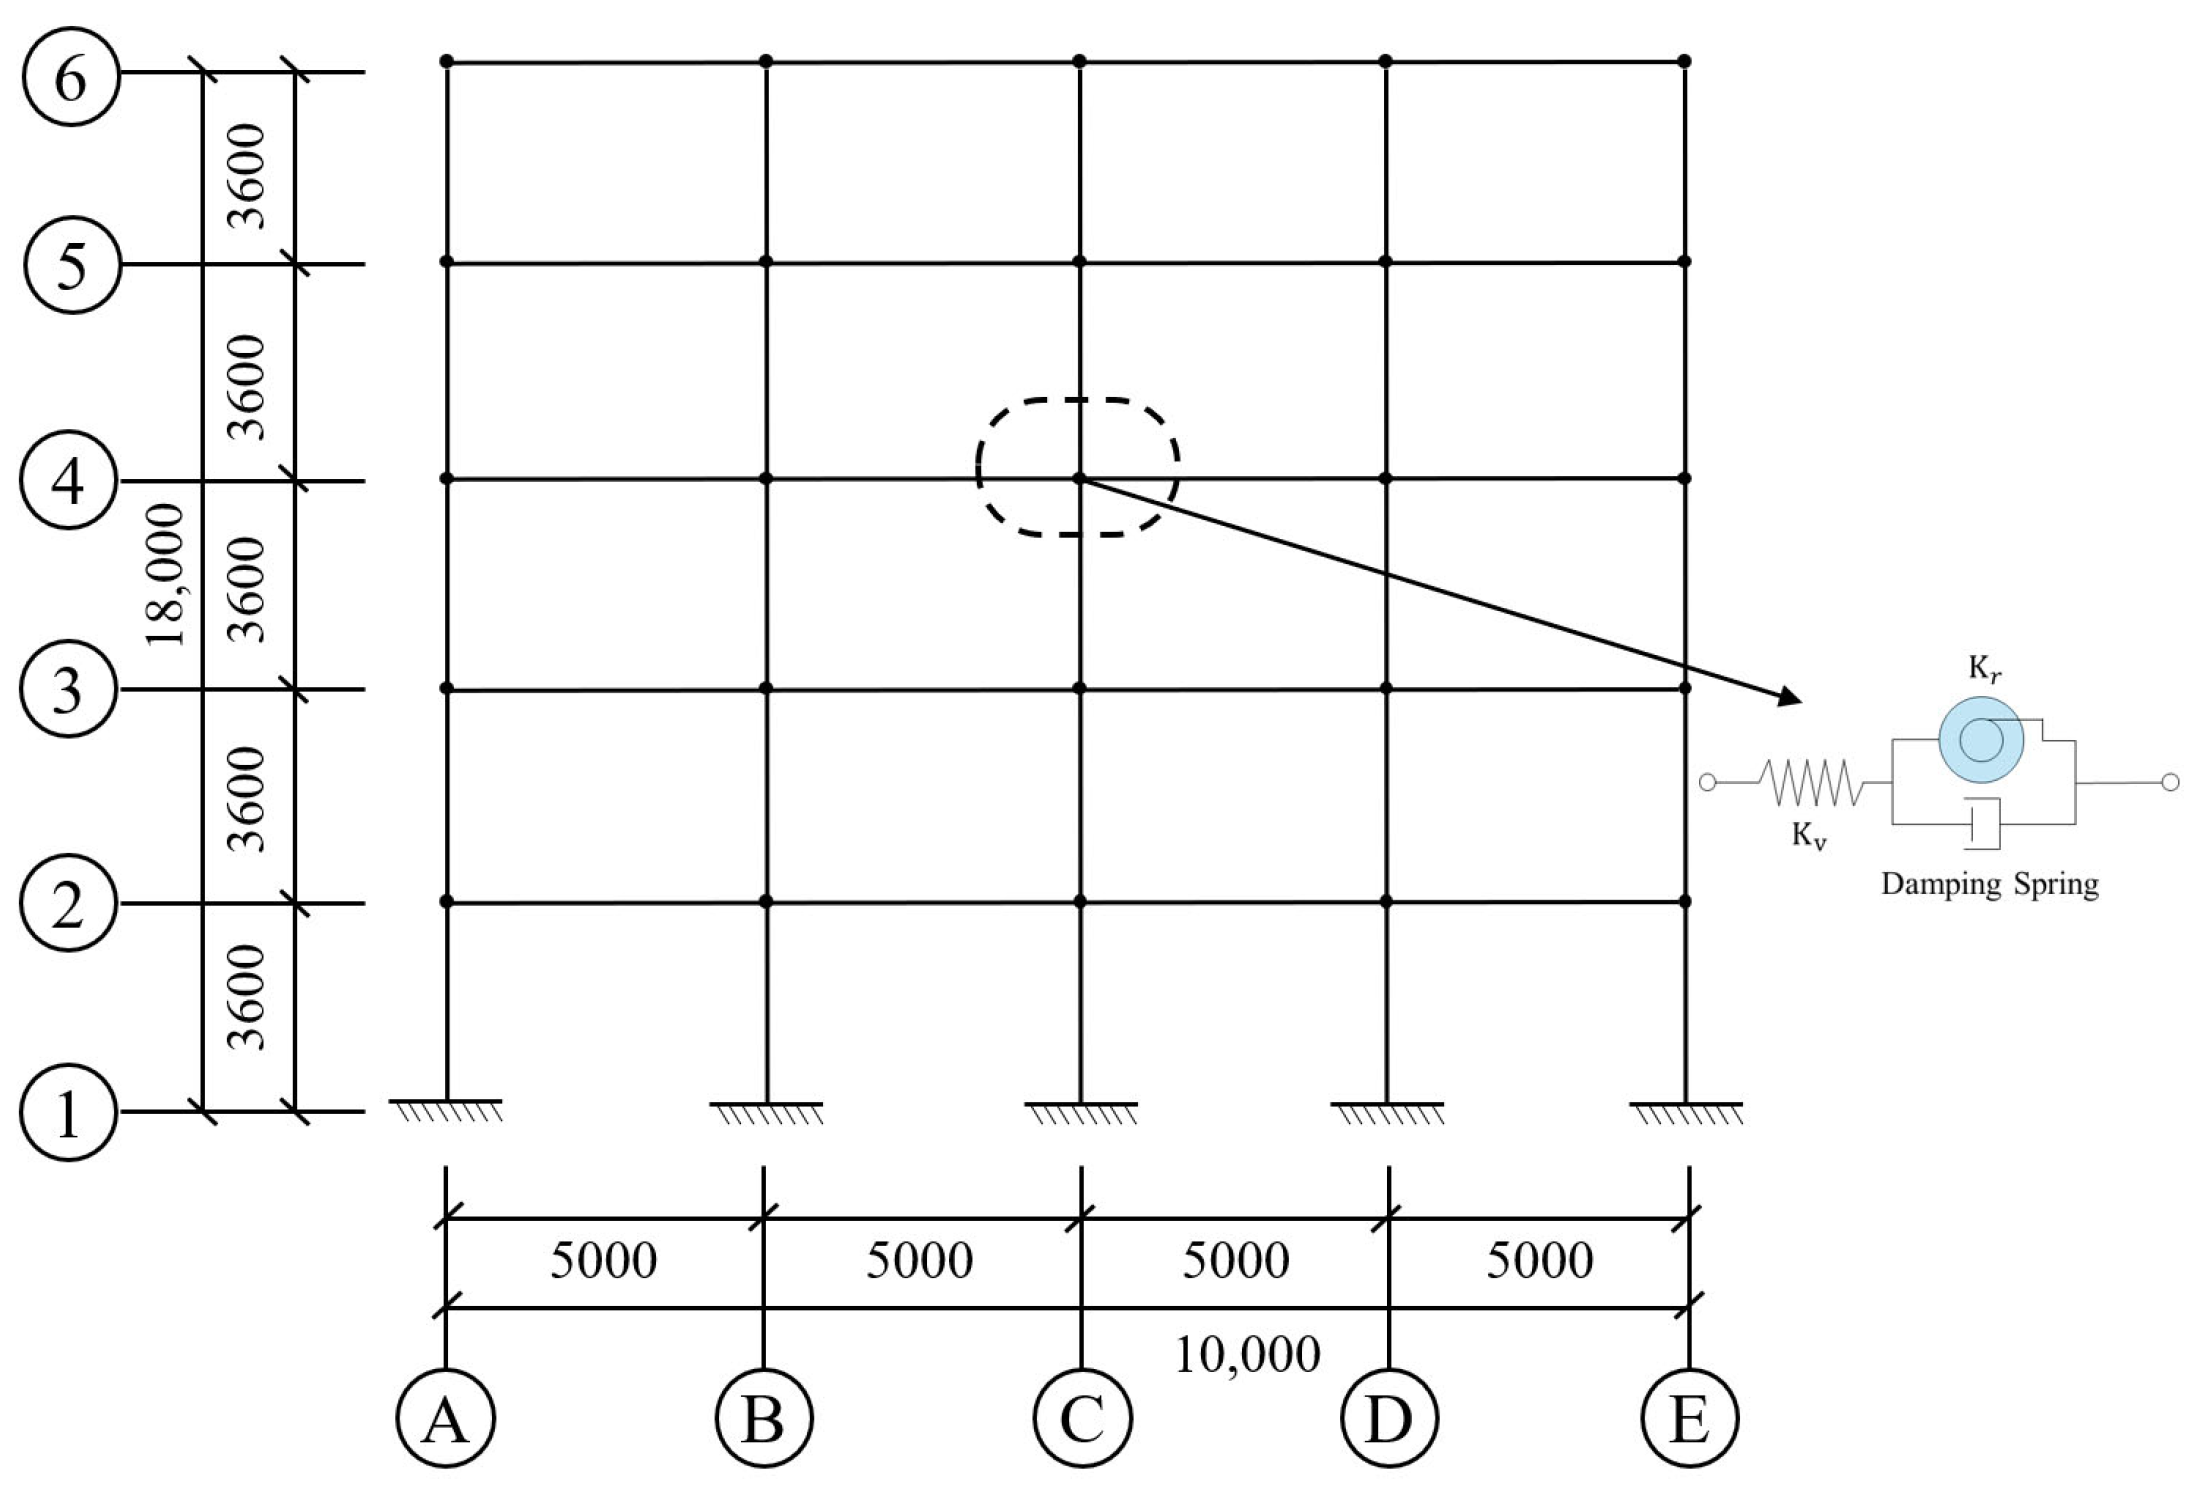
3. Finite Element Model of the Baseline Structure
4. Multipoint Vibration Excitation Input Method
5. Vibration Response Characteristics of Prefabricated Frame Structures Around Subways
5.1. Influence of Beam Cross-Section Variation on the Structural Vibration Response
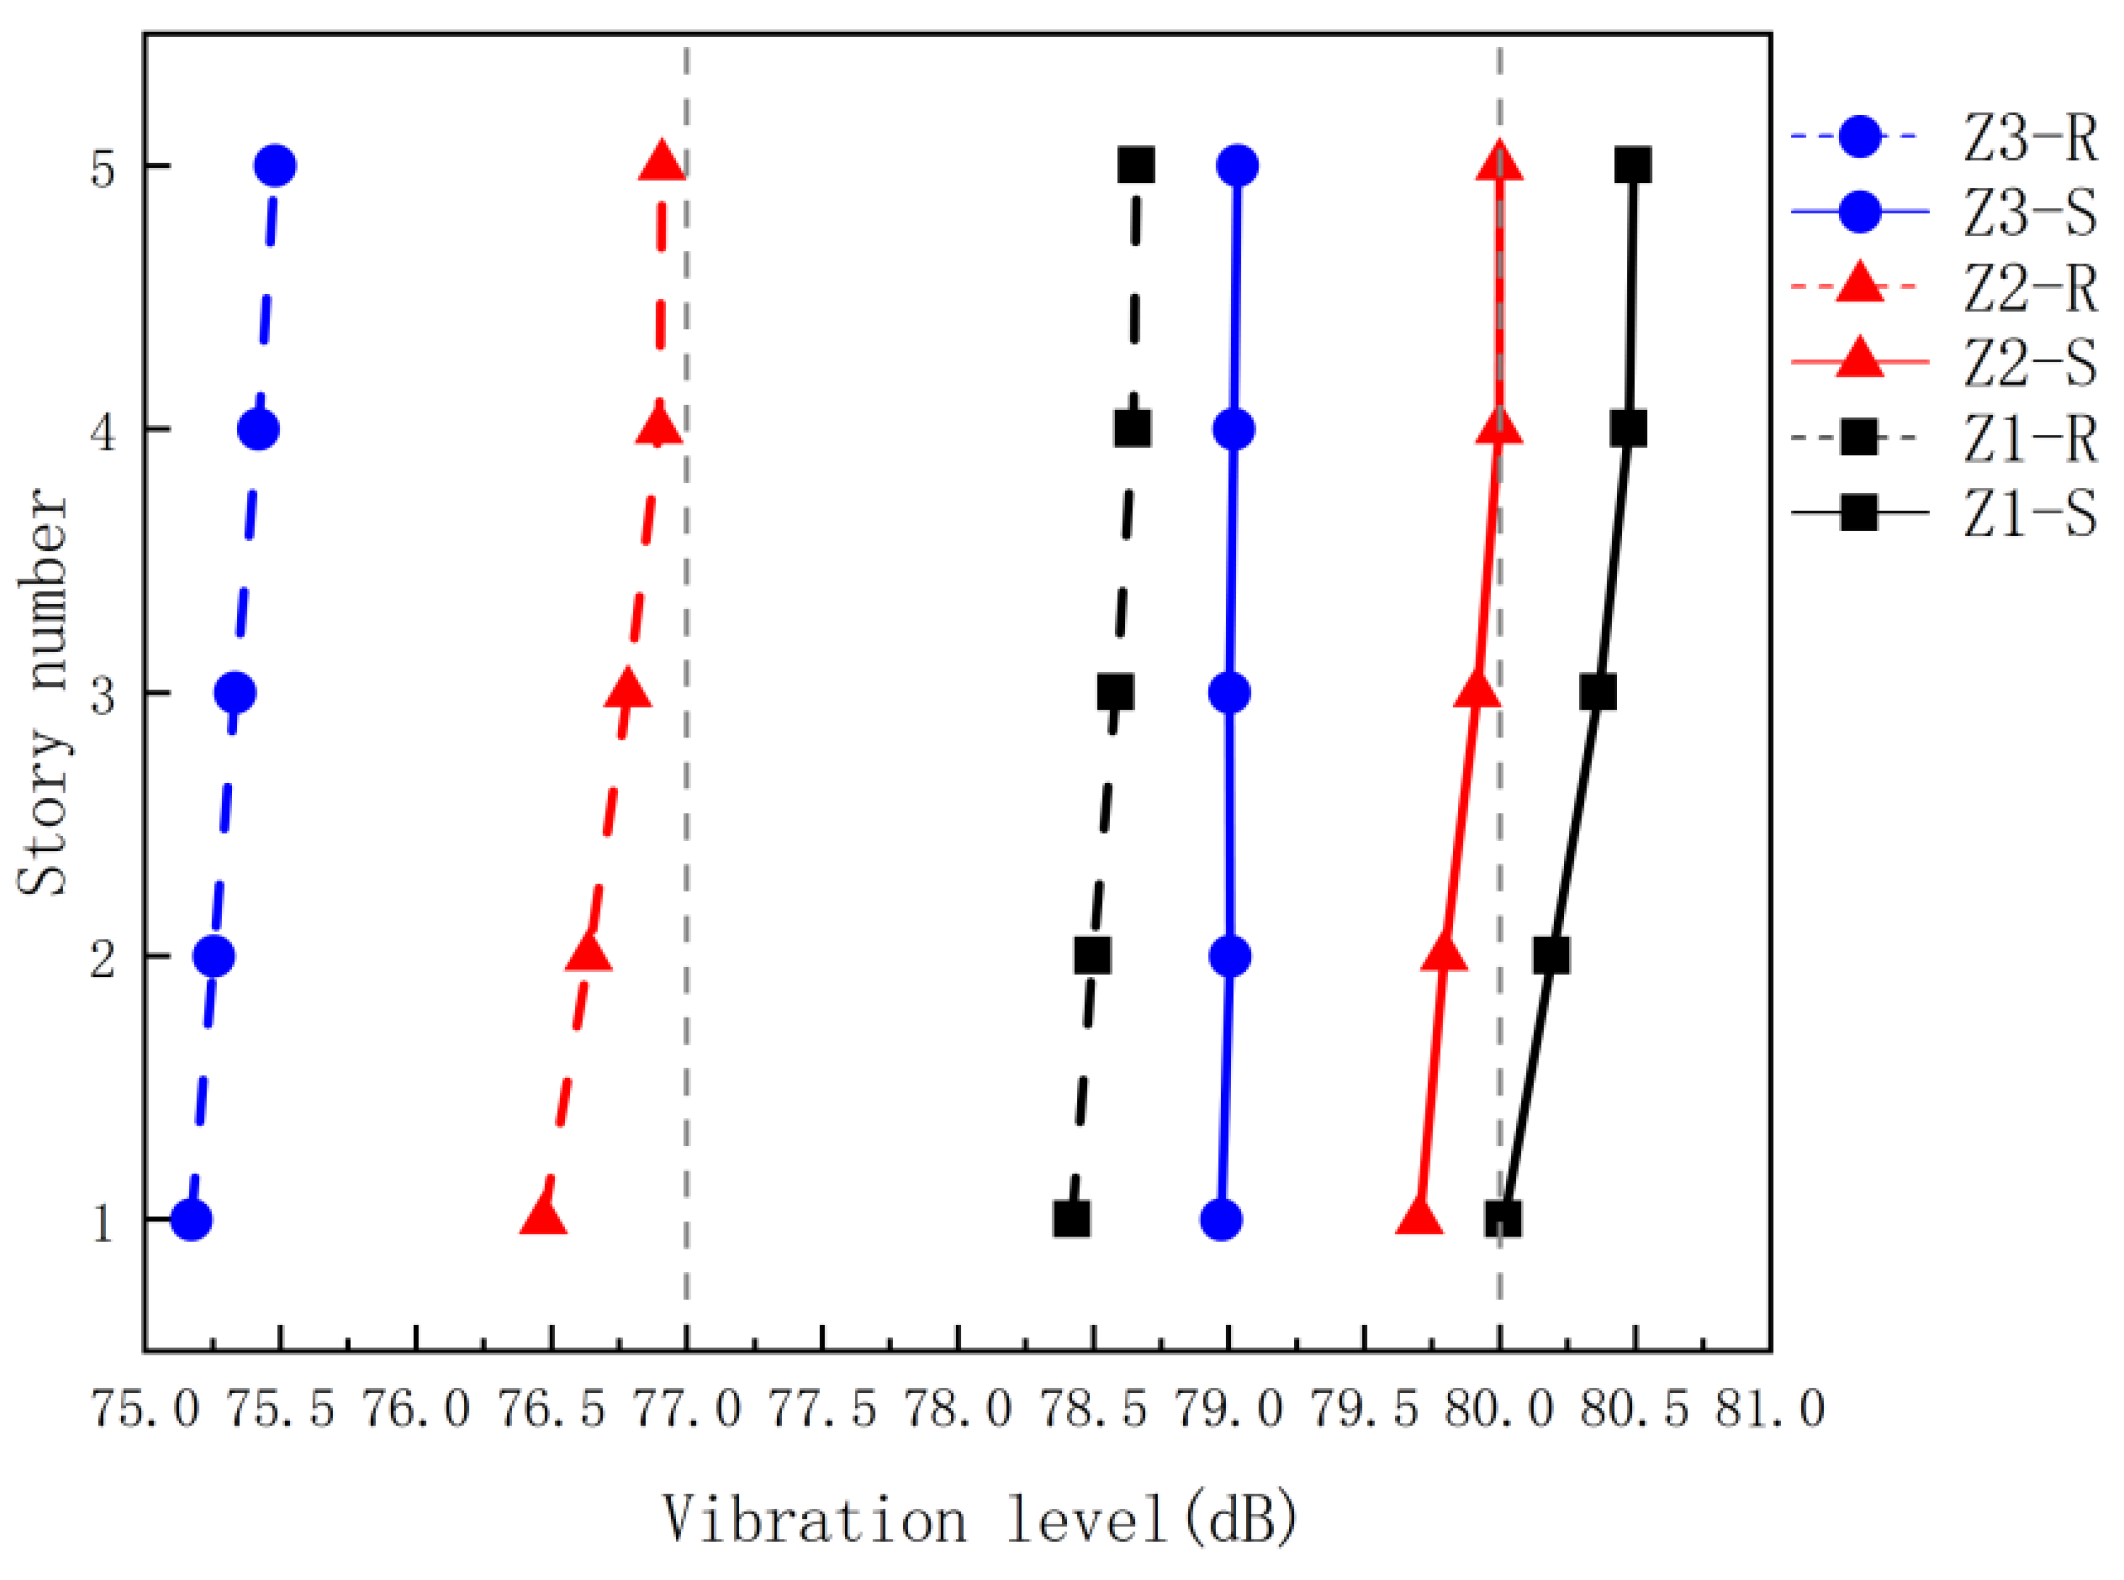
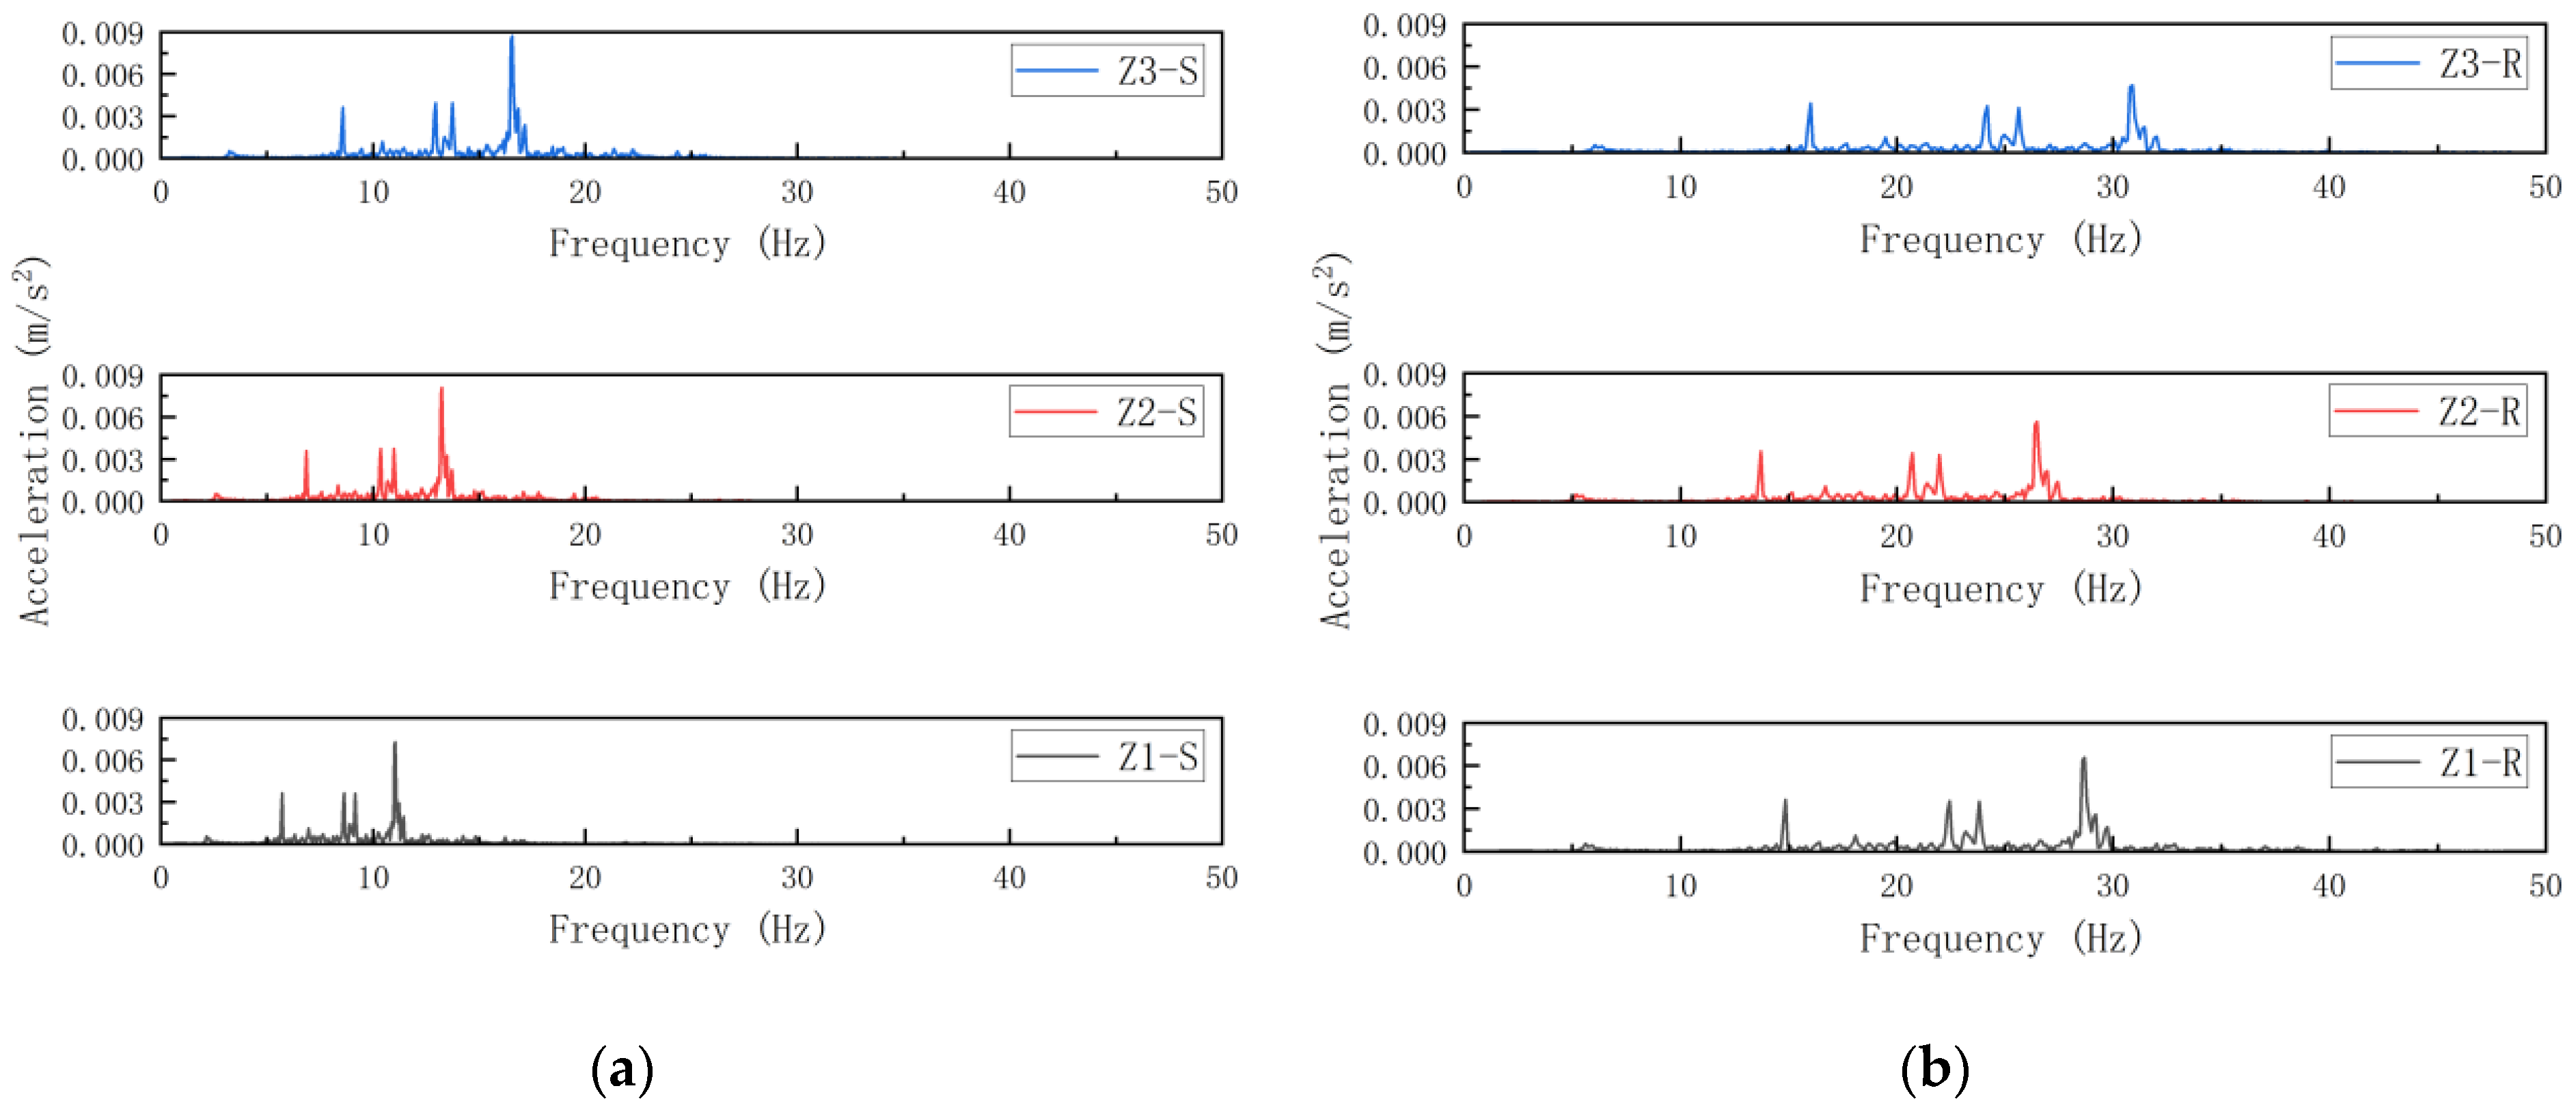
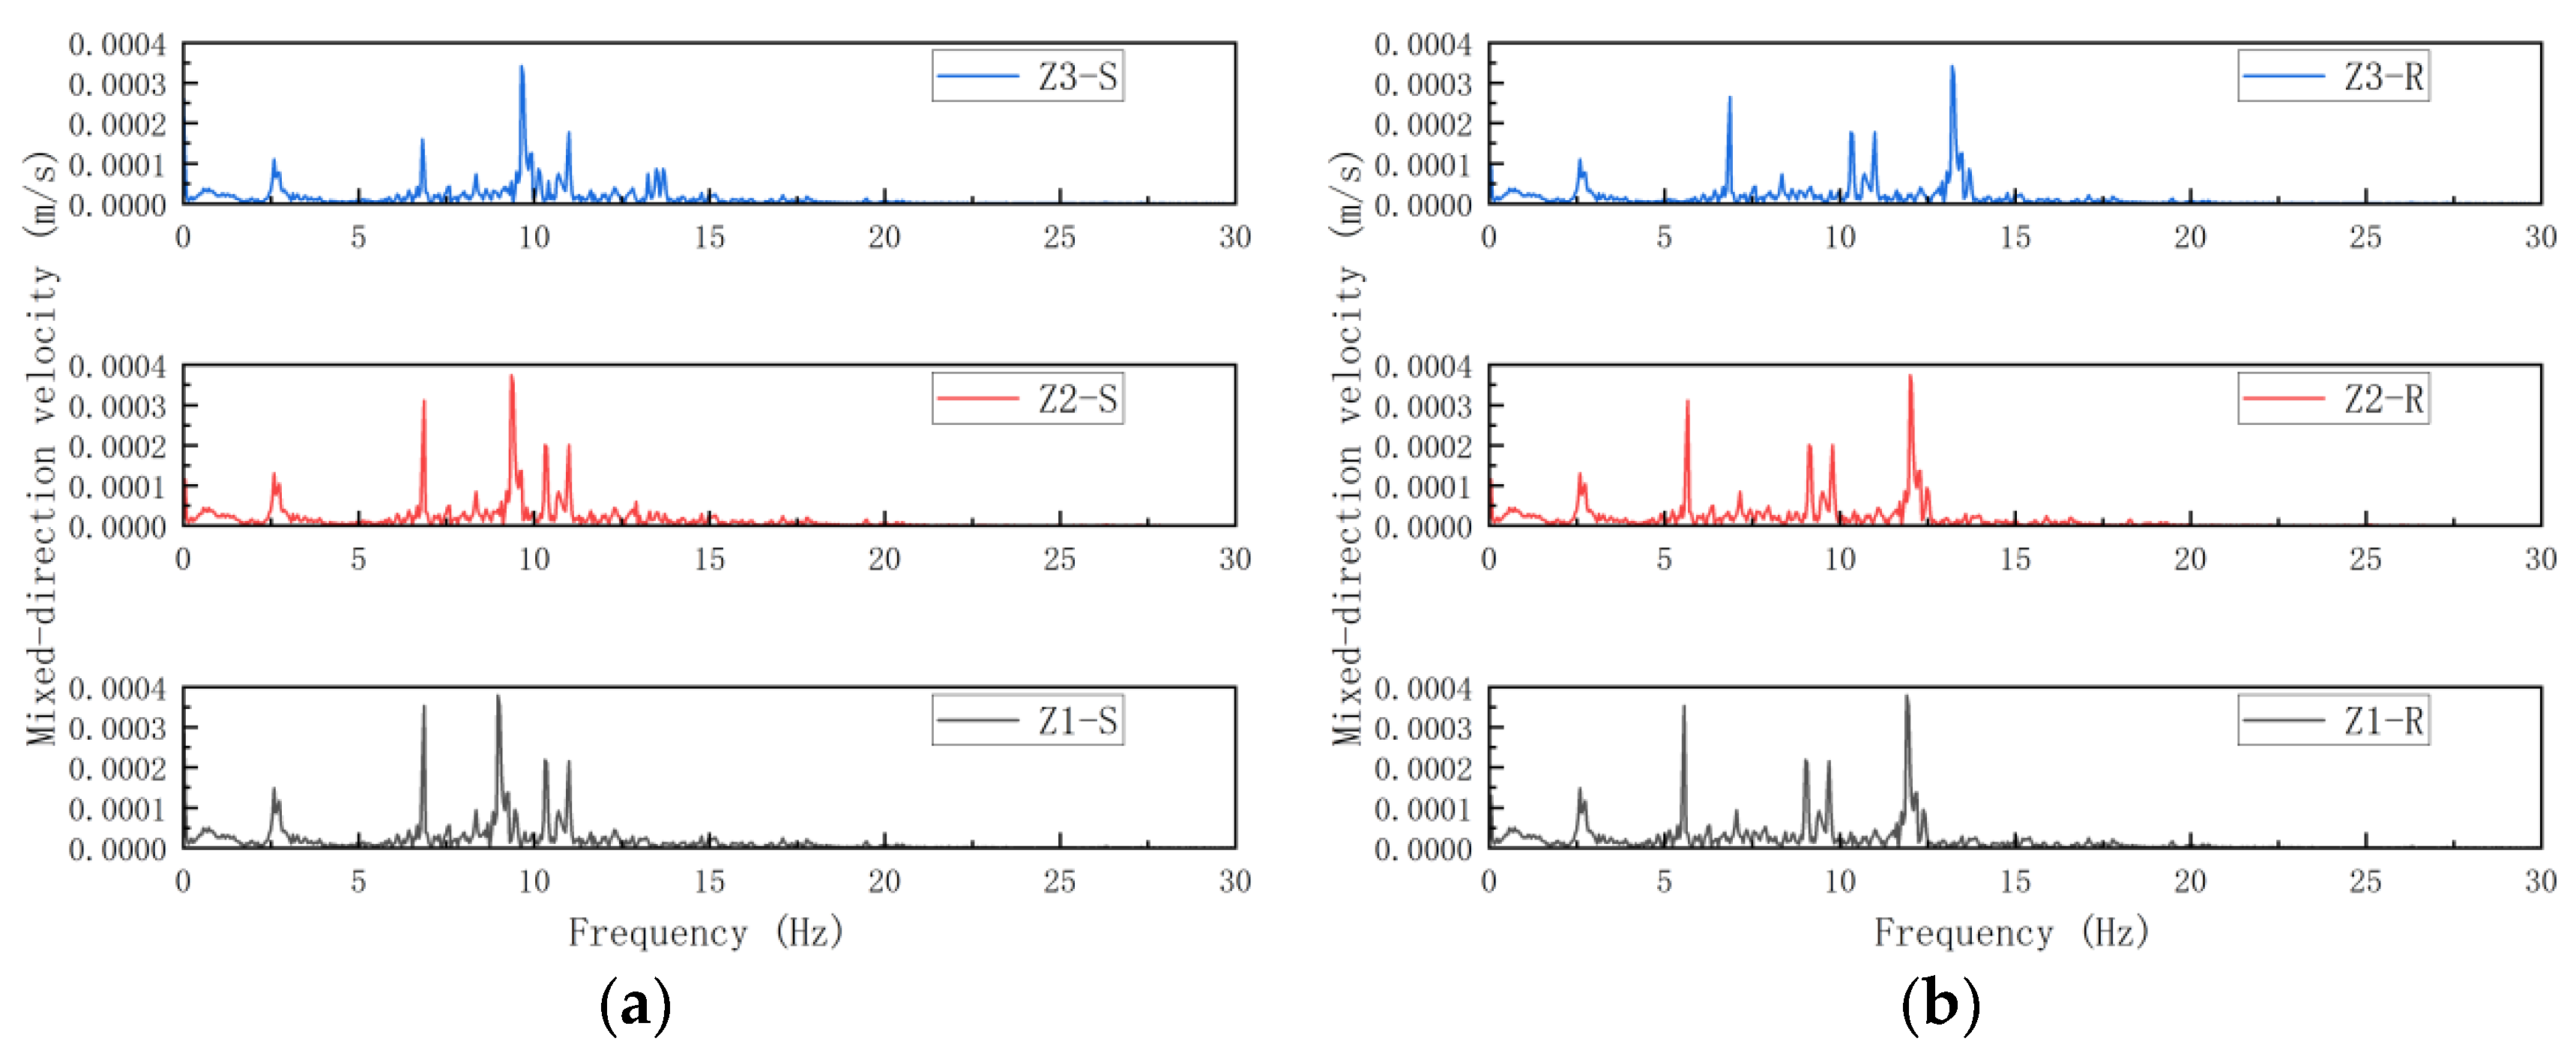
5.2. Influence of Column Cross-Section Variation on the Structural Vibration Response
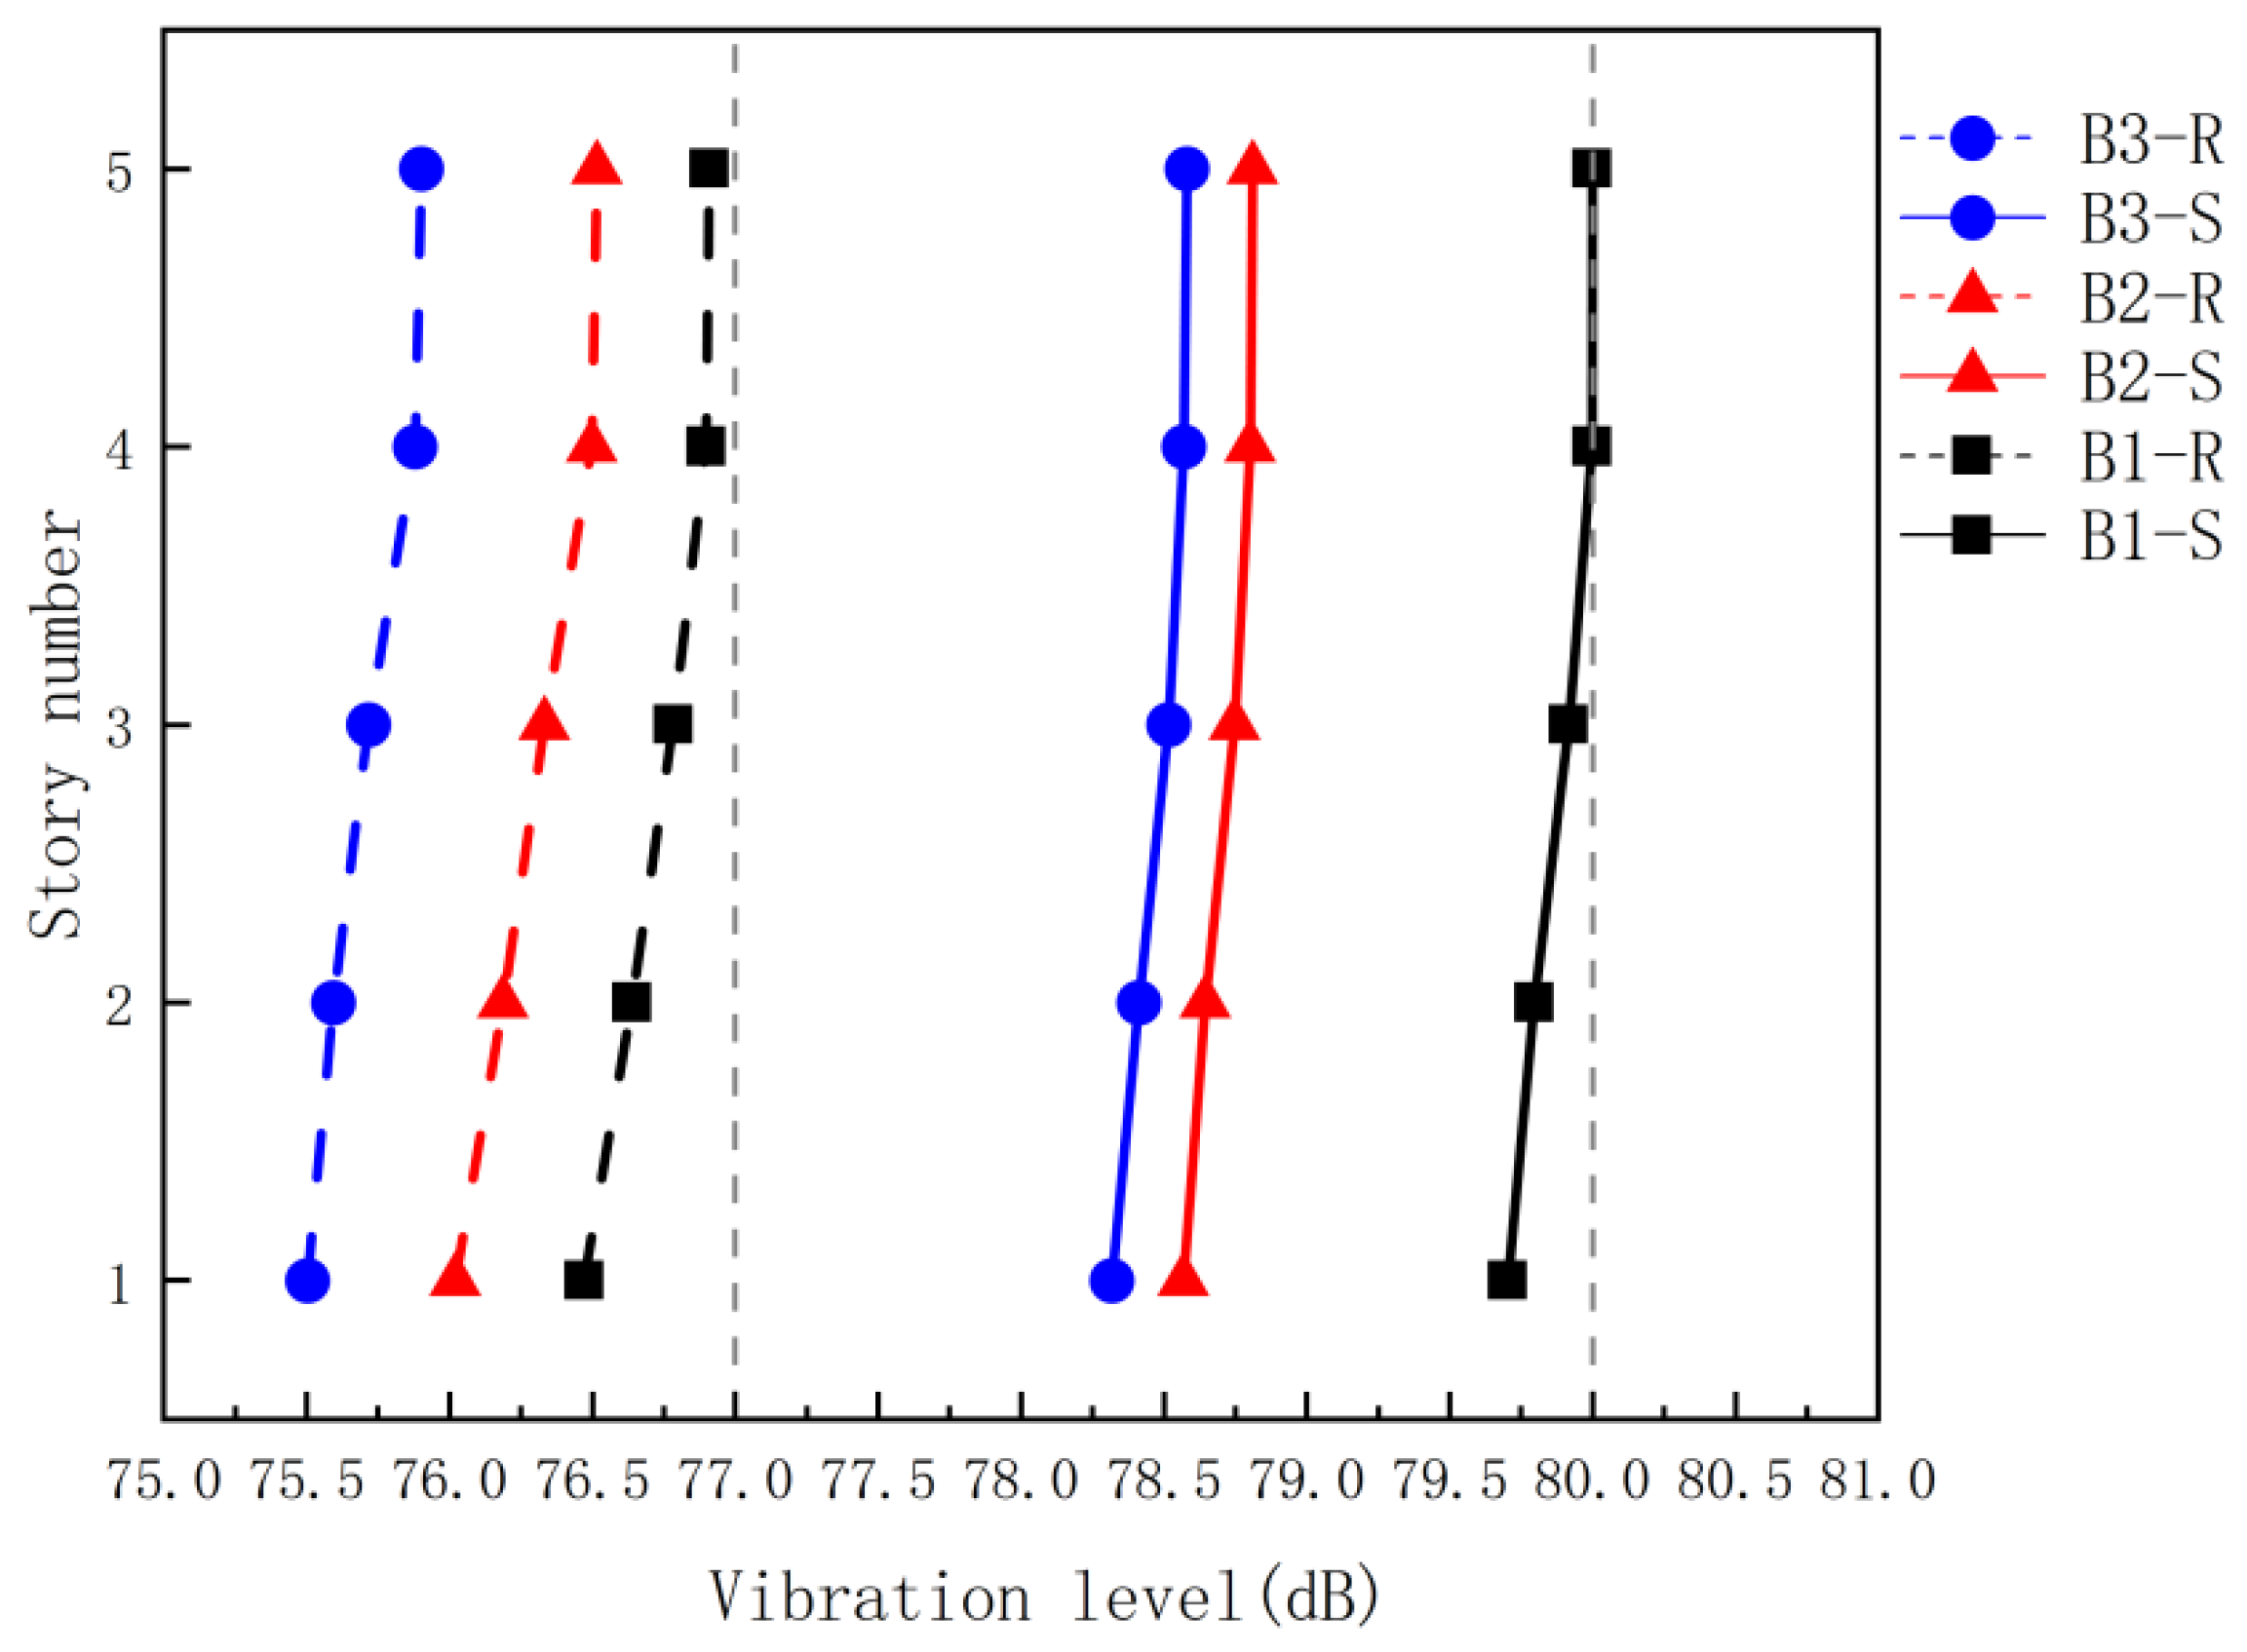
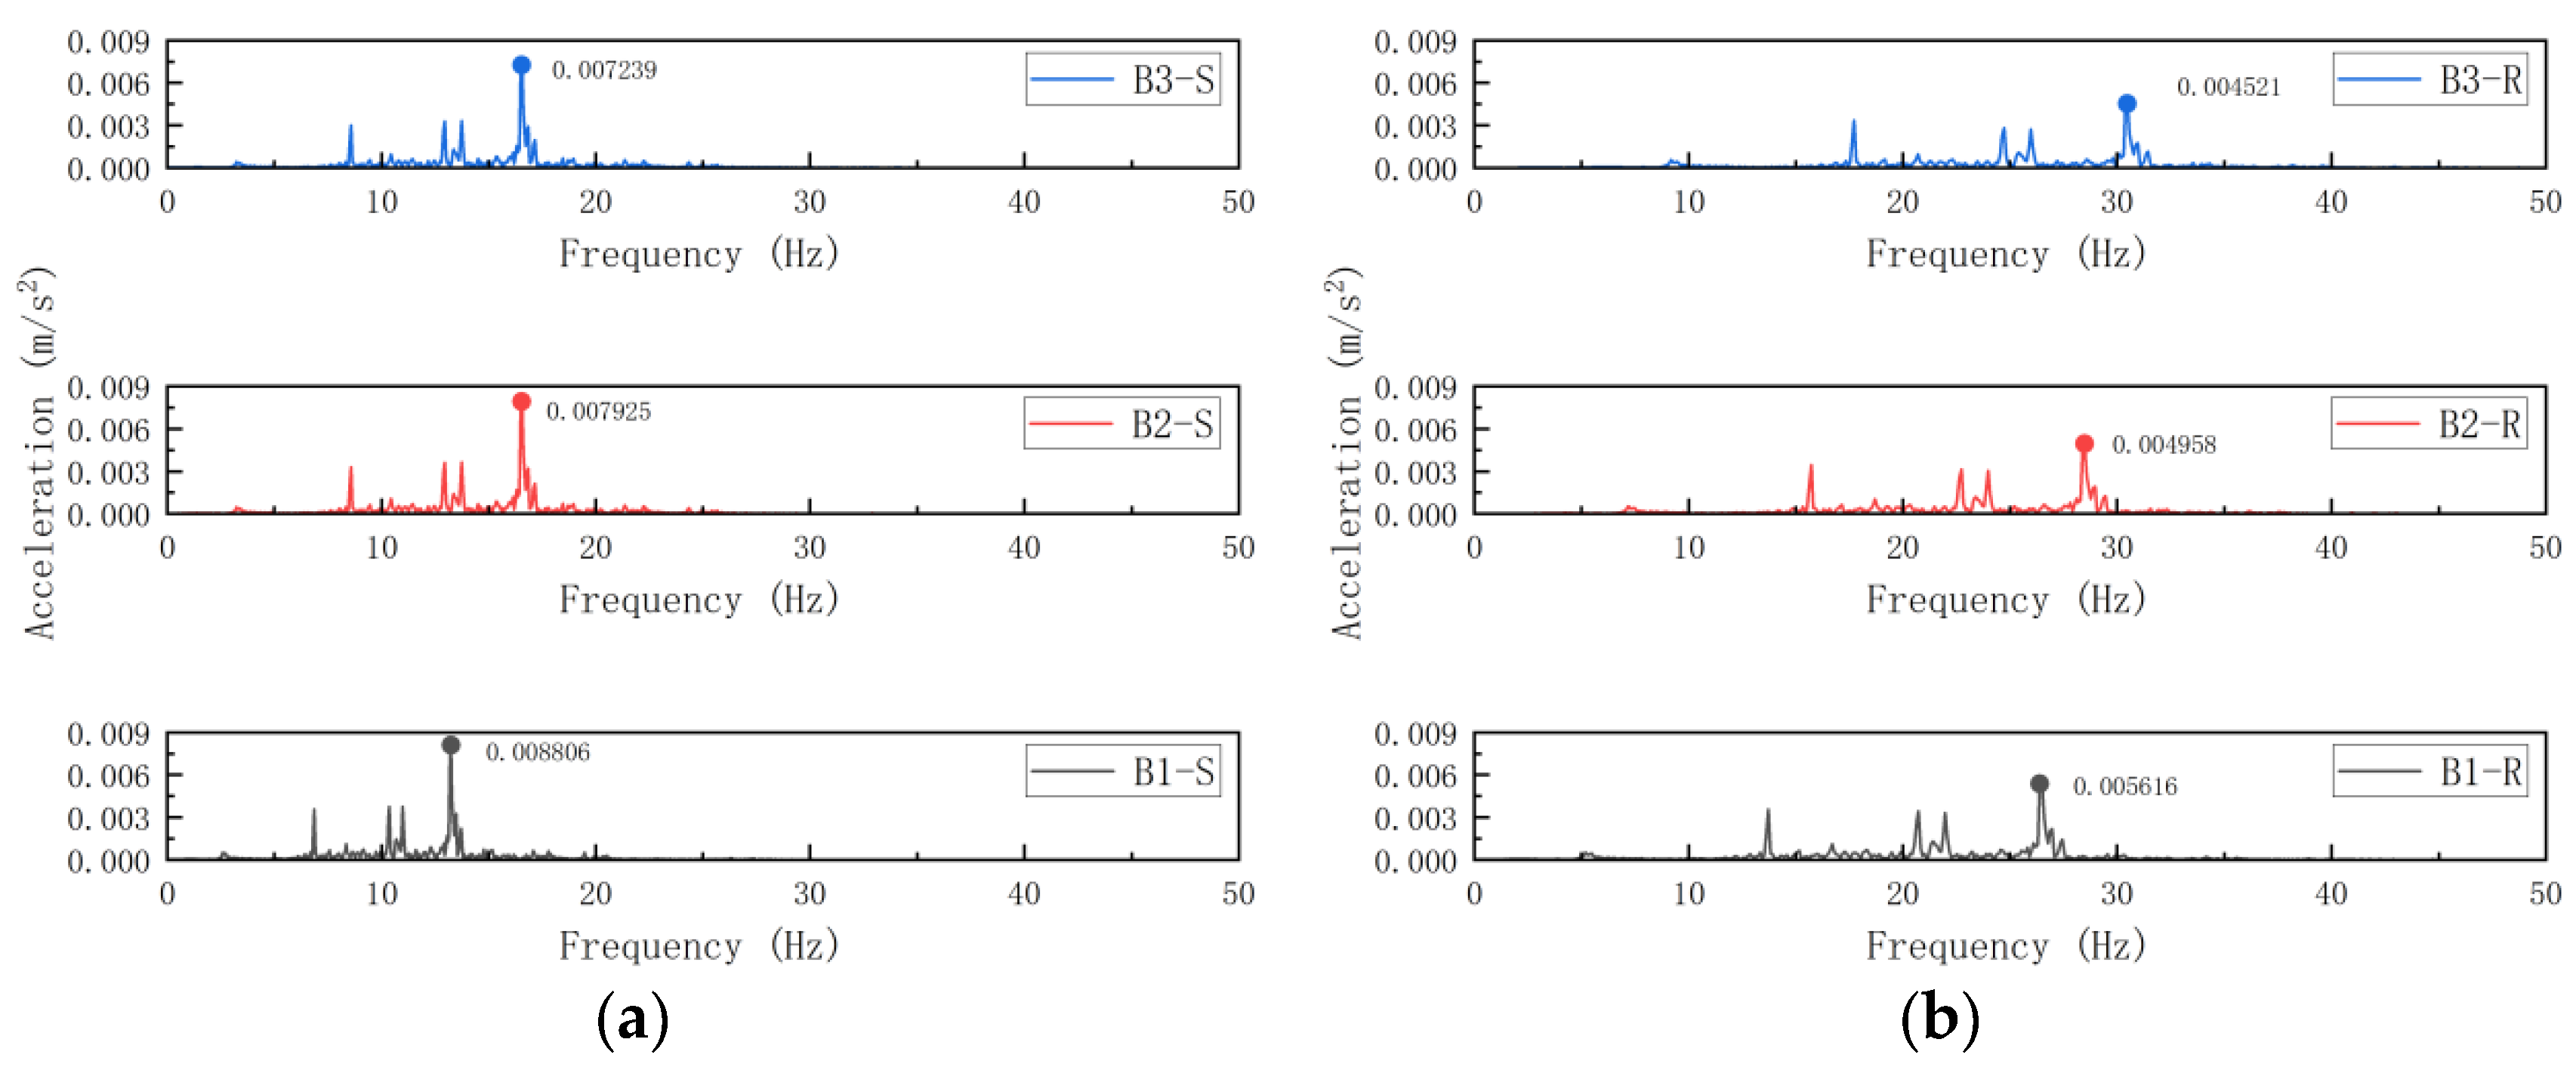
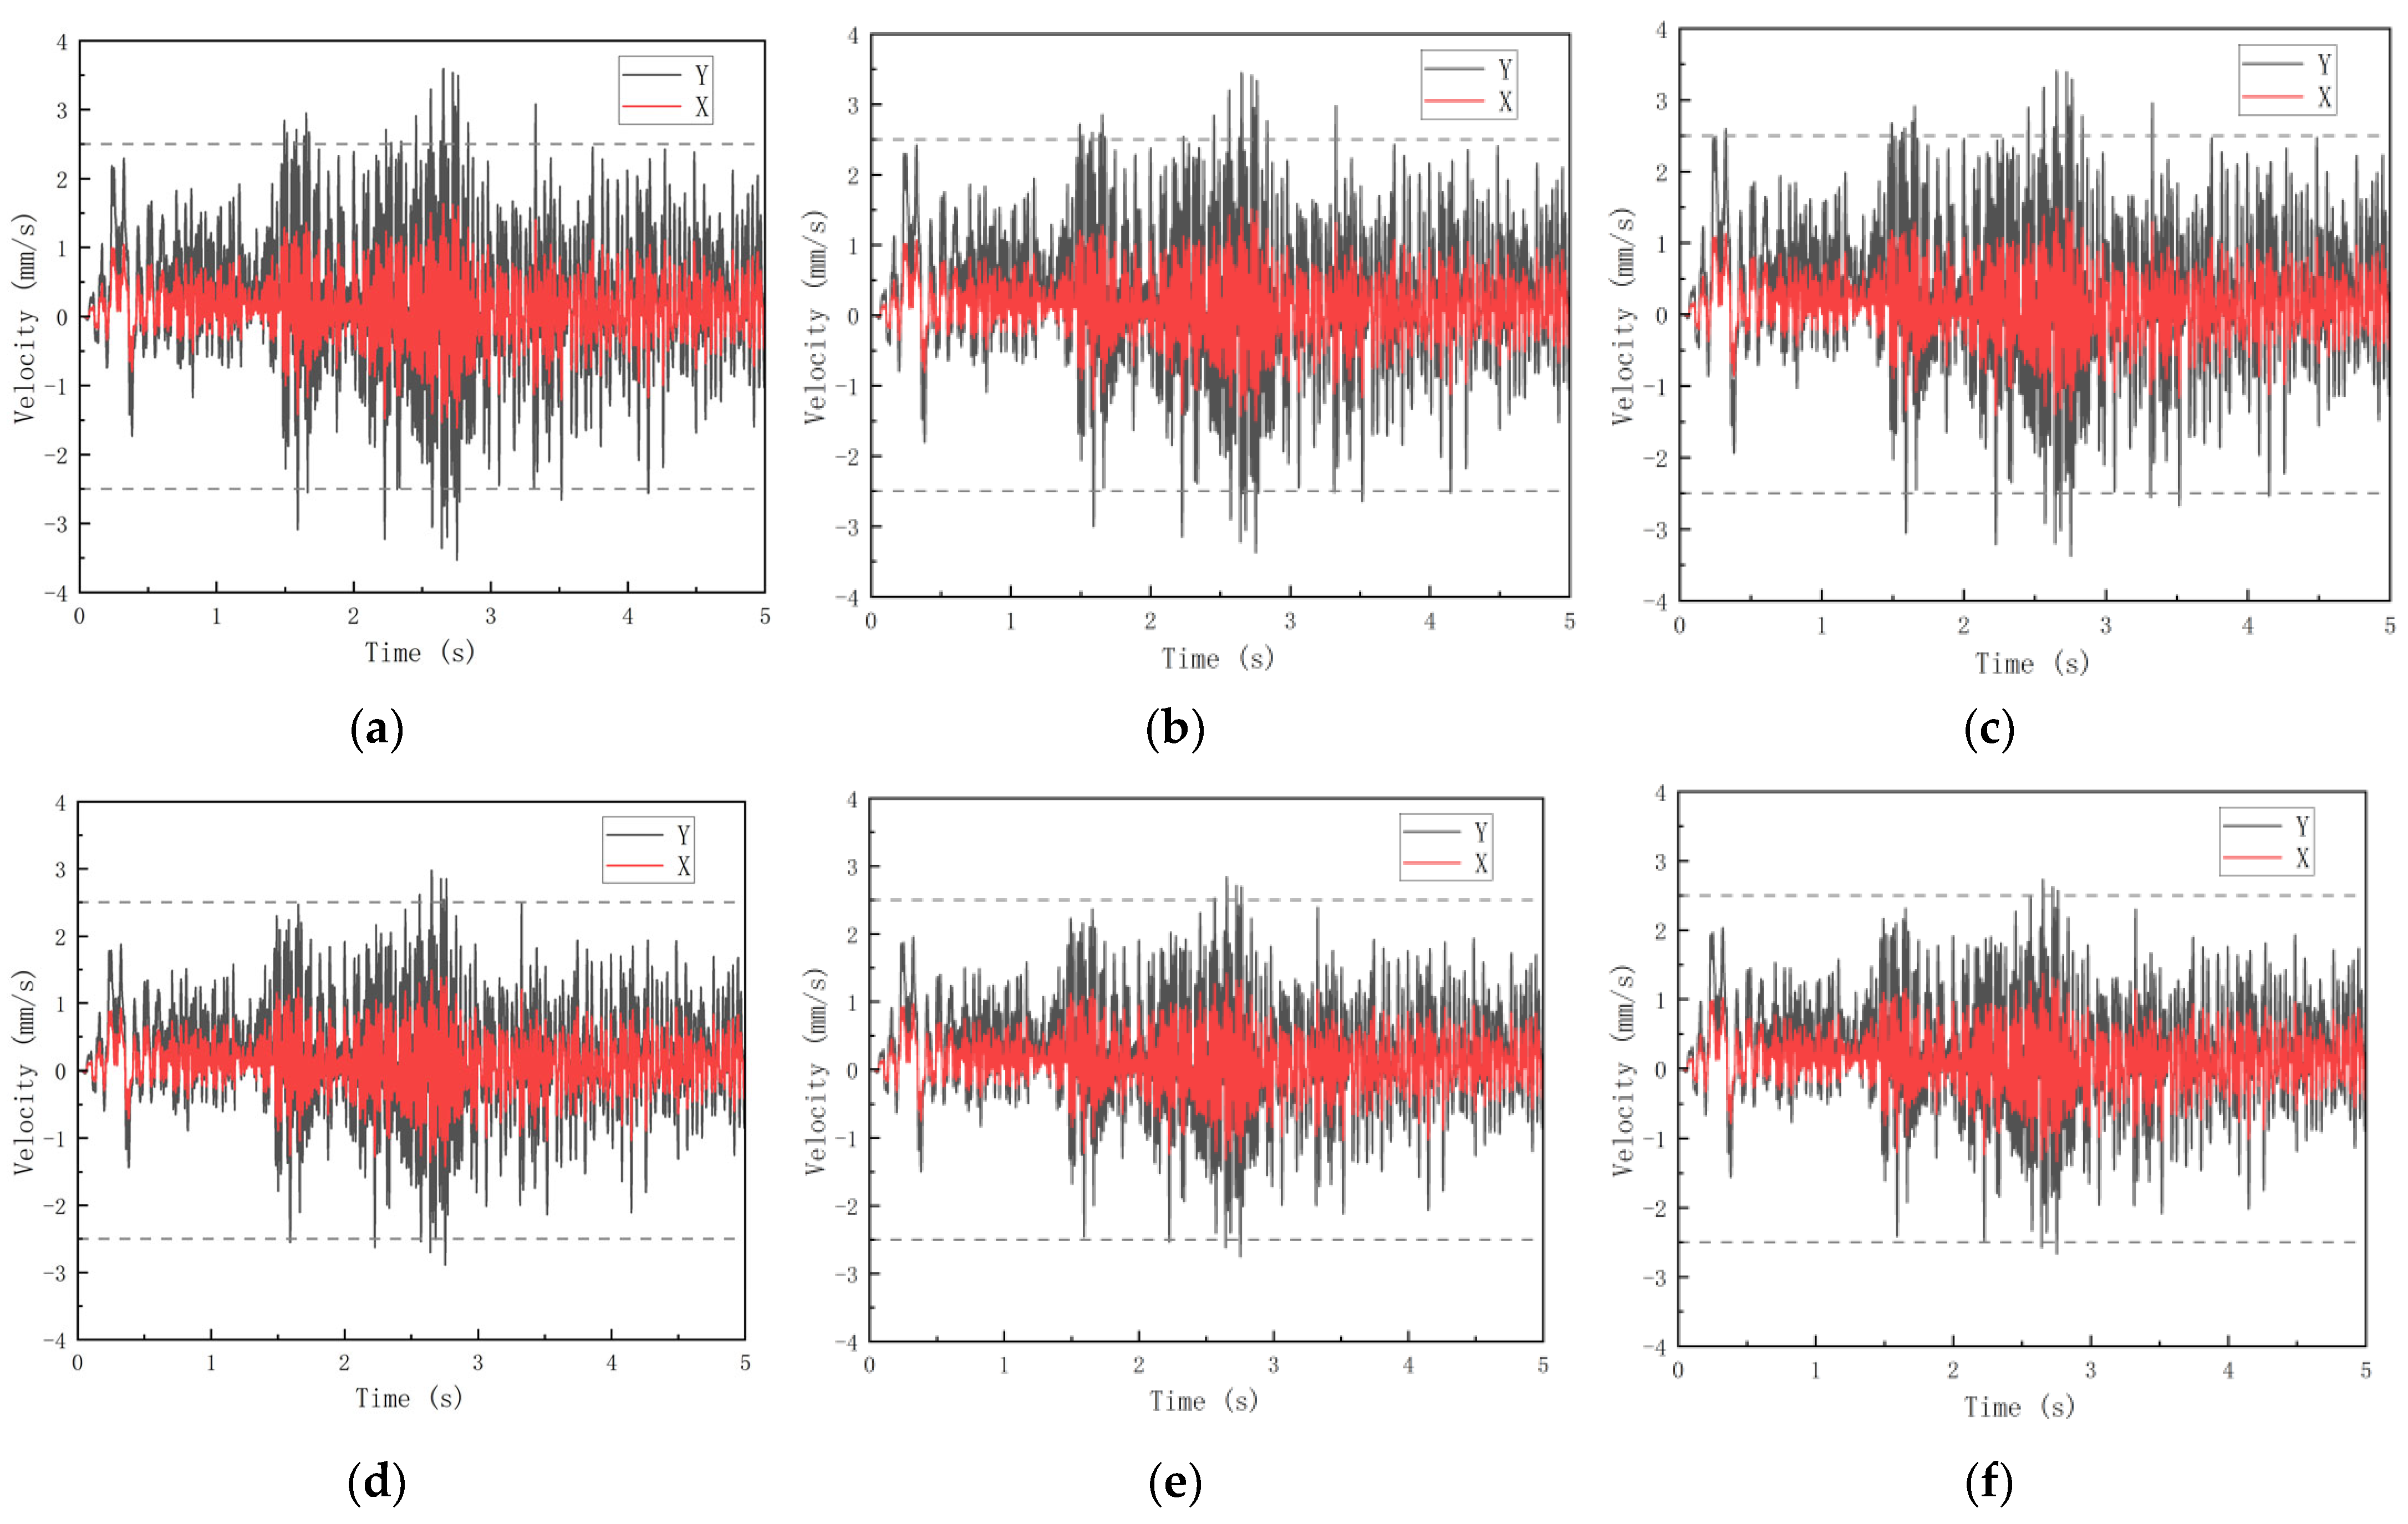
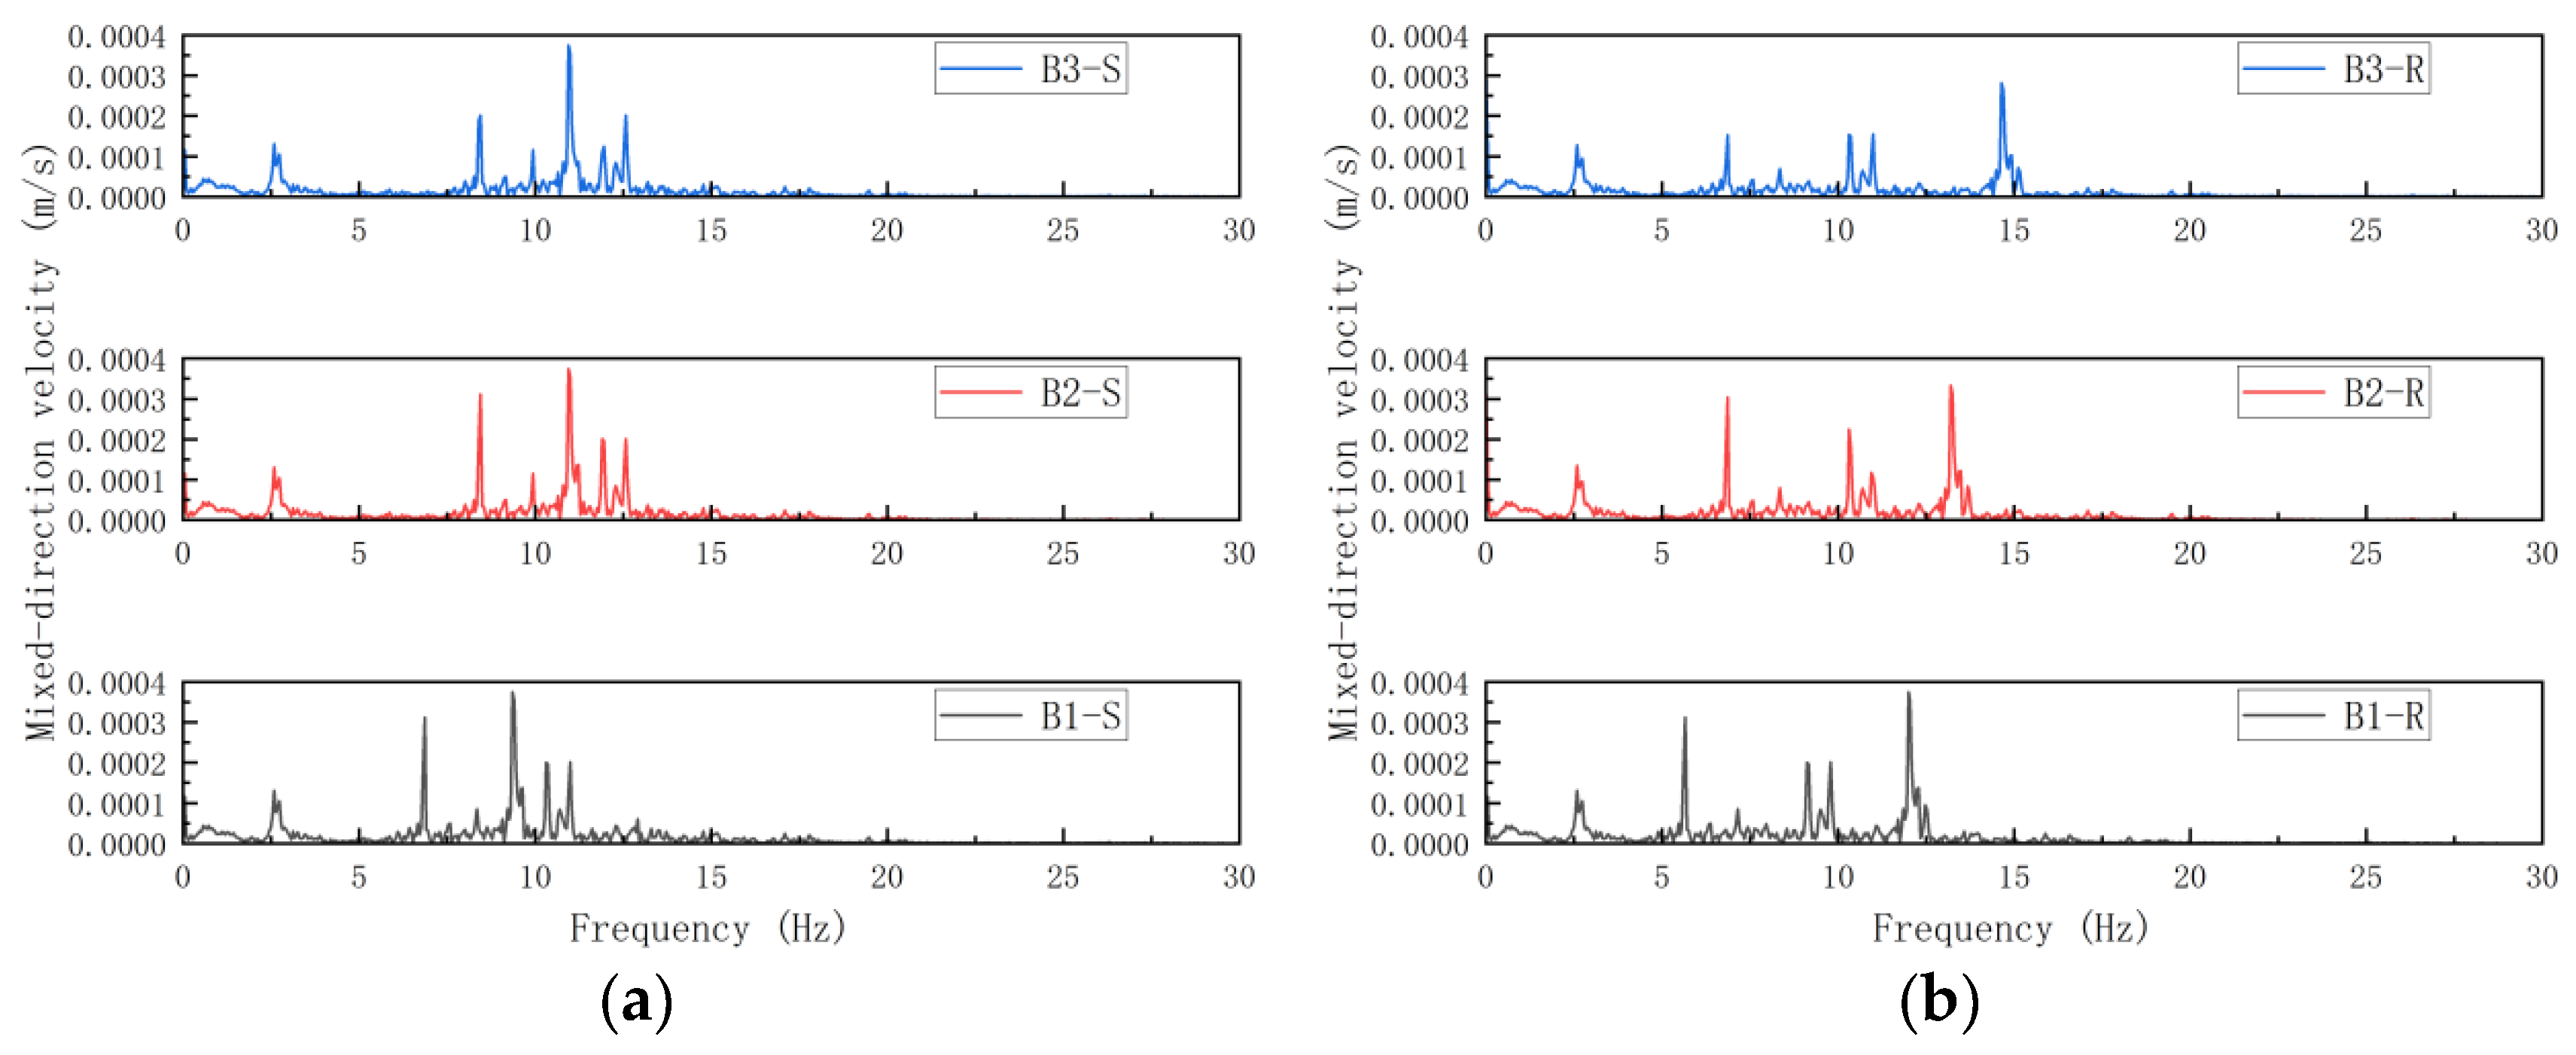
5.3. Influence of Slab Thickness Variation on the Structural Vibration Response
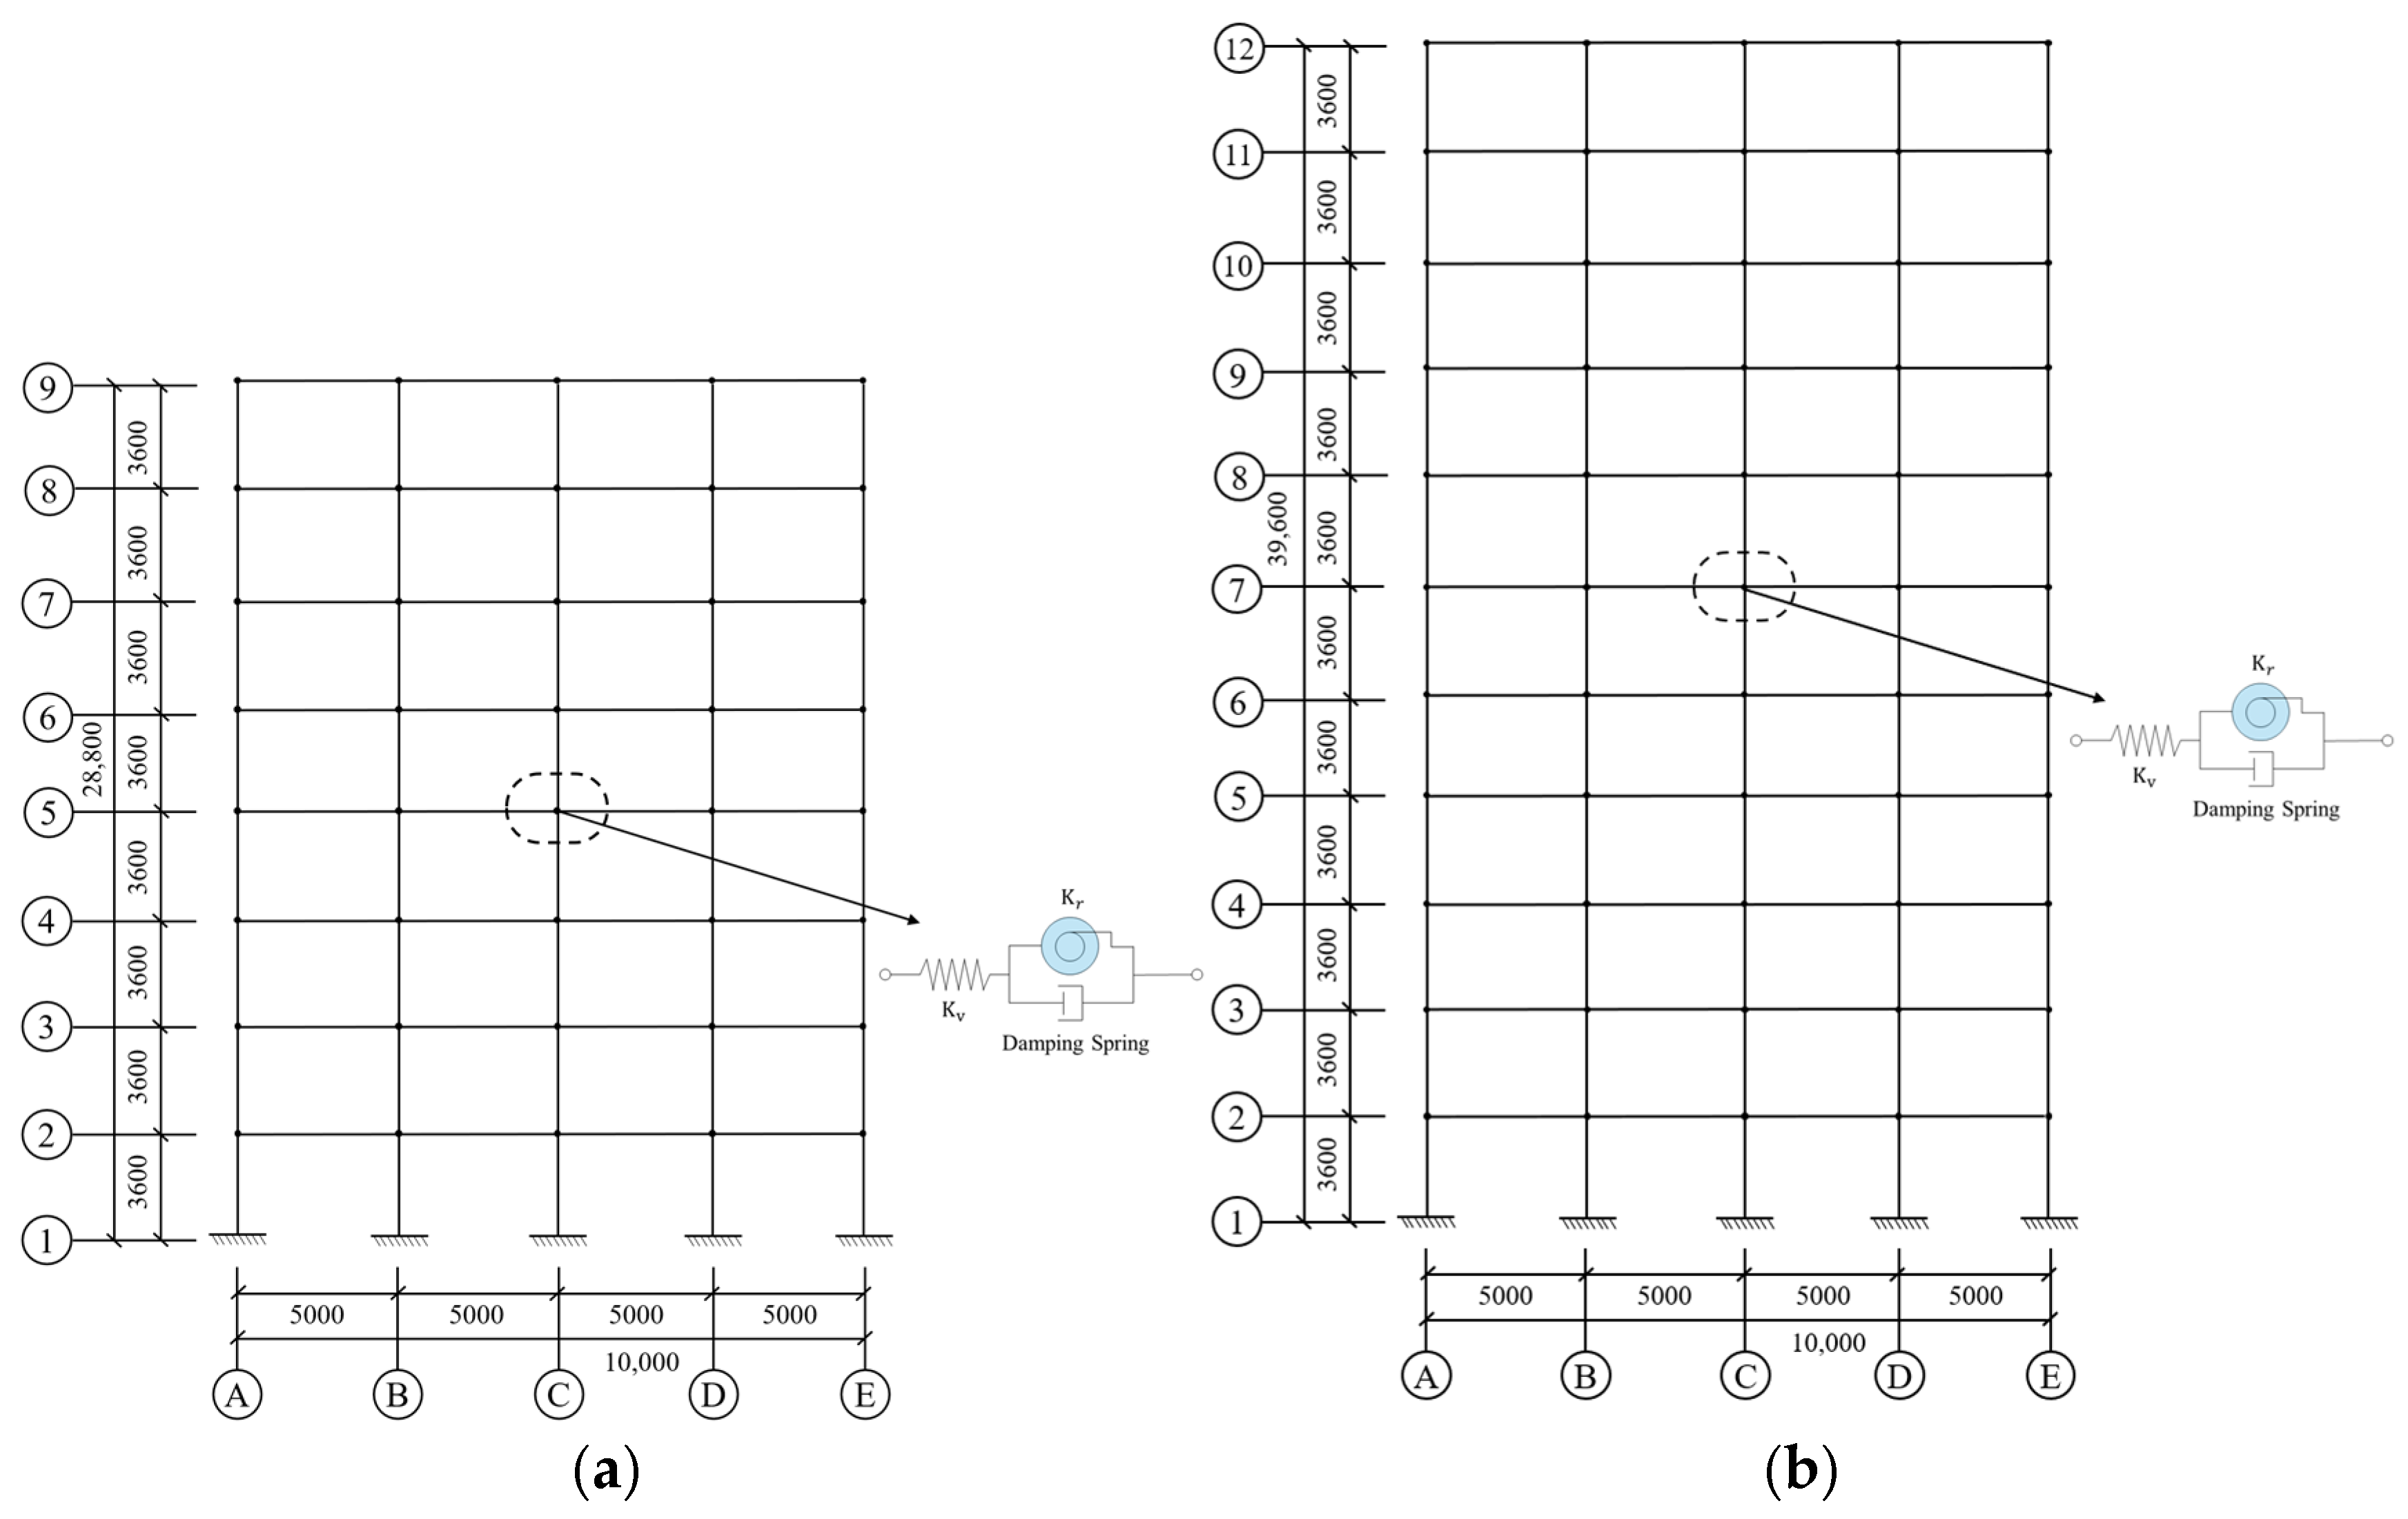
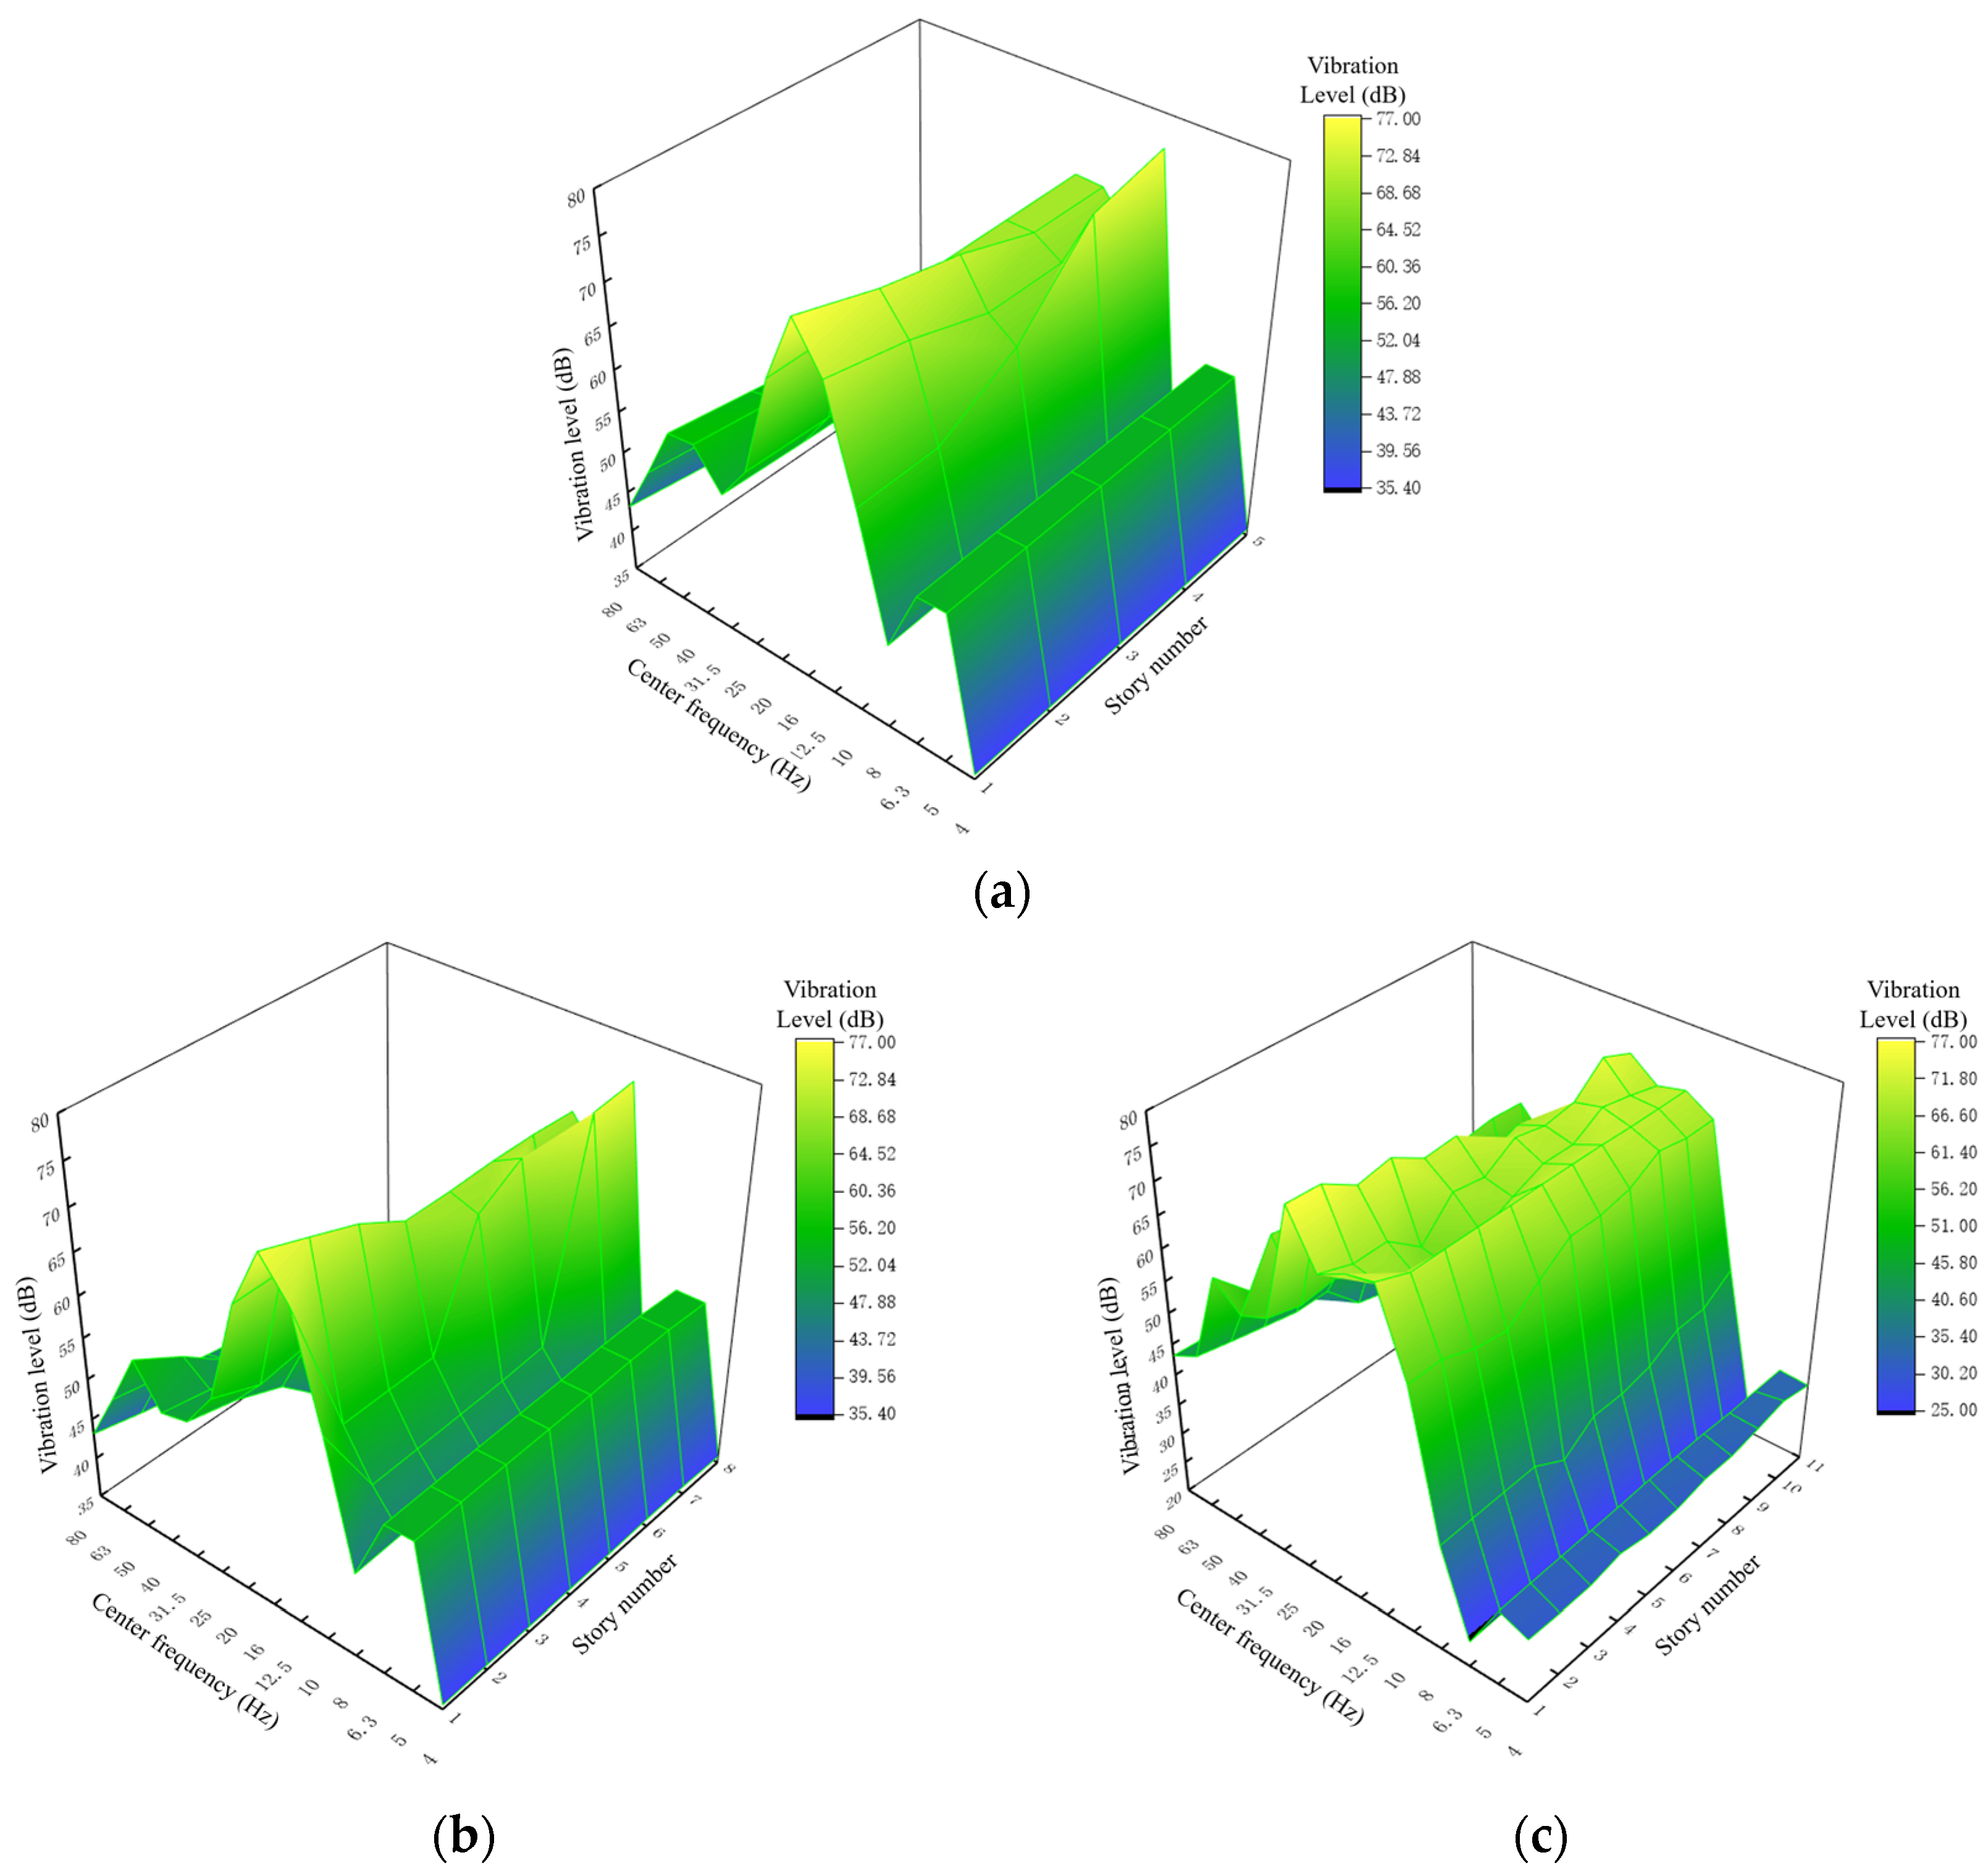
5.4. Influence of the Total Structural Stories Variation on the Structural Vibration Response
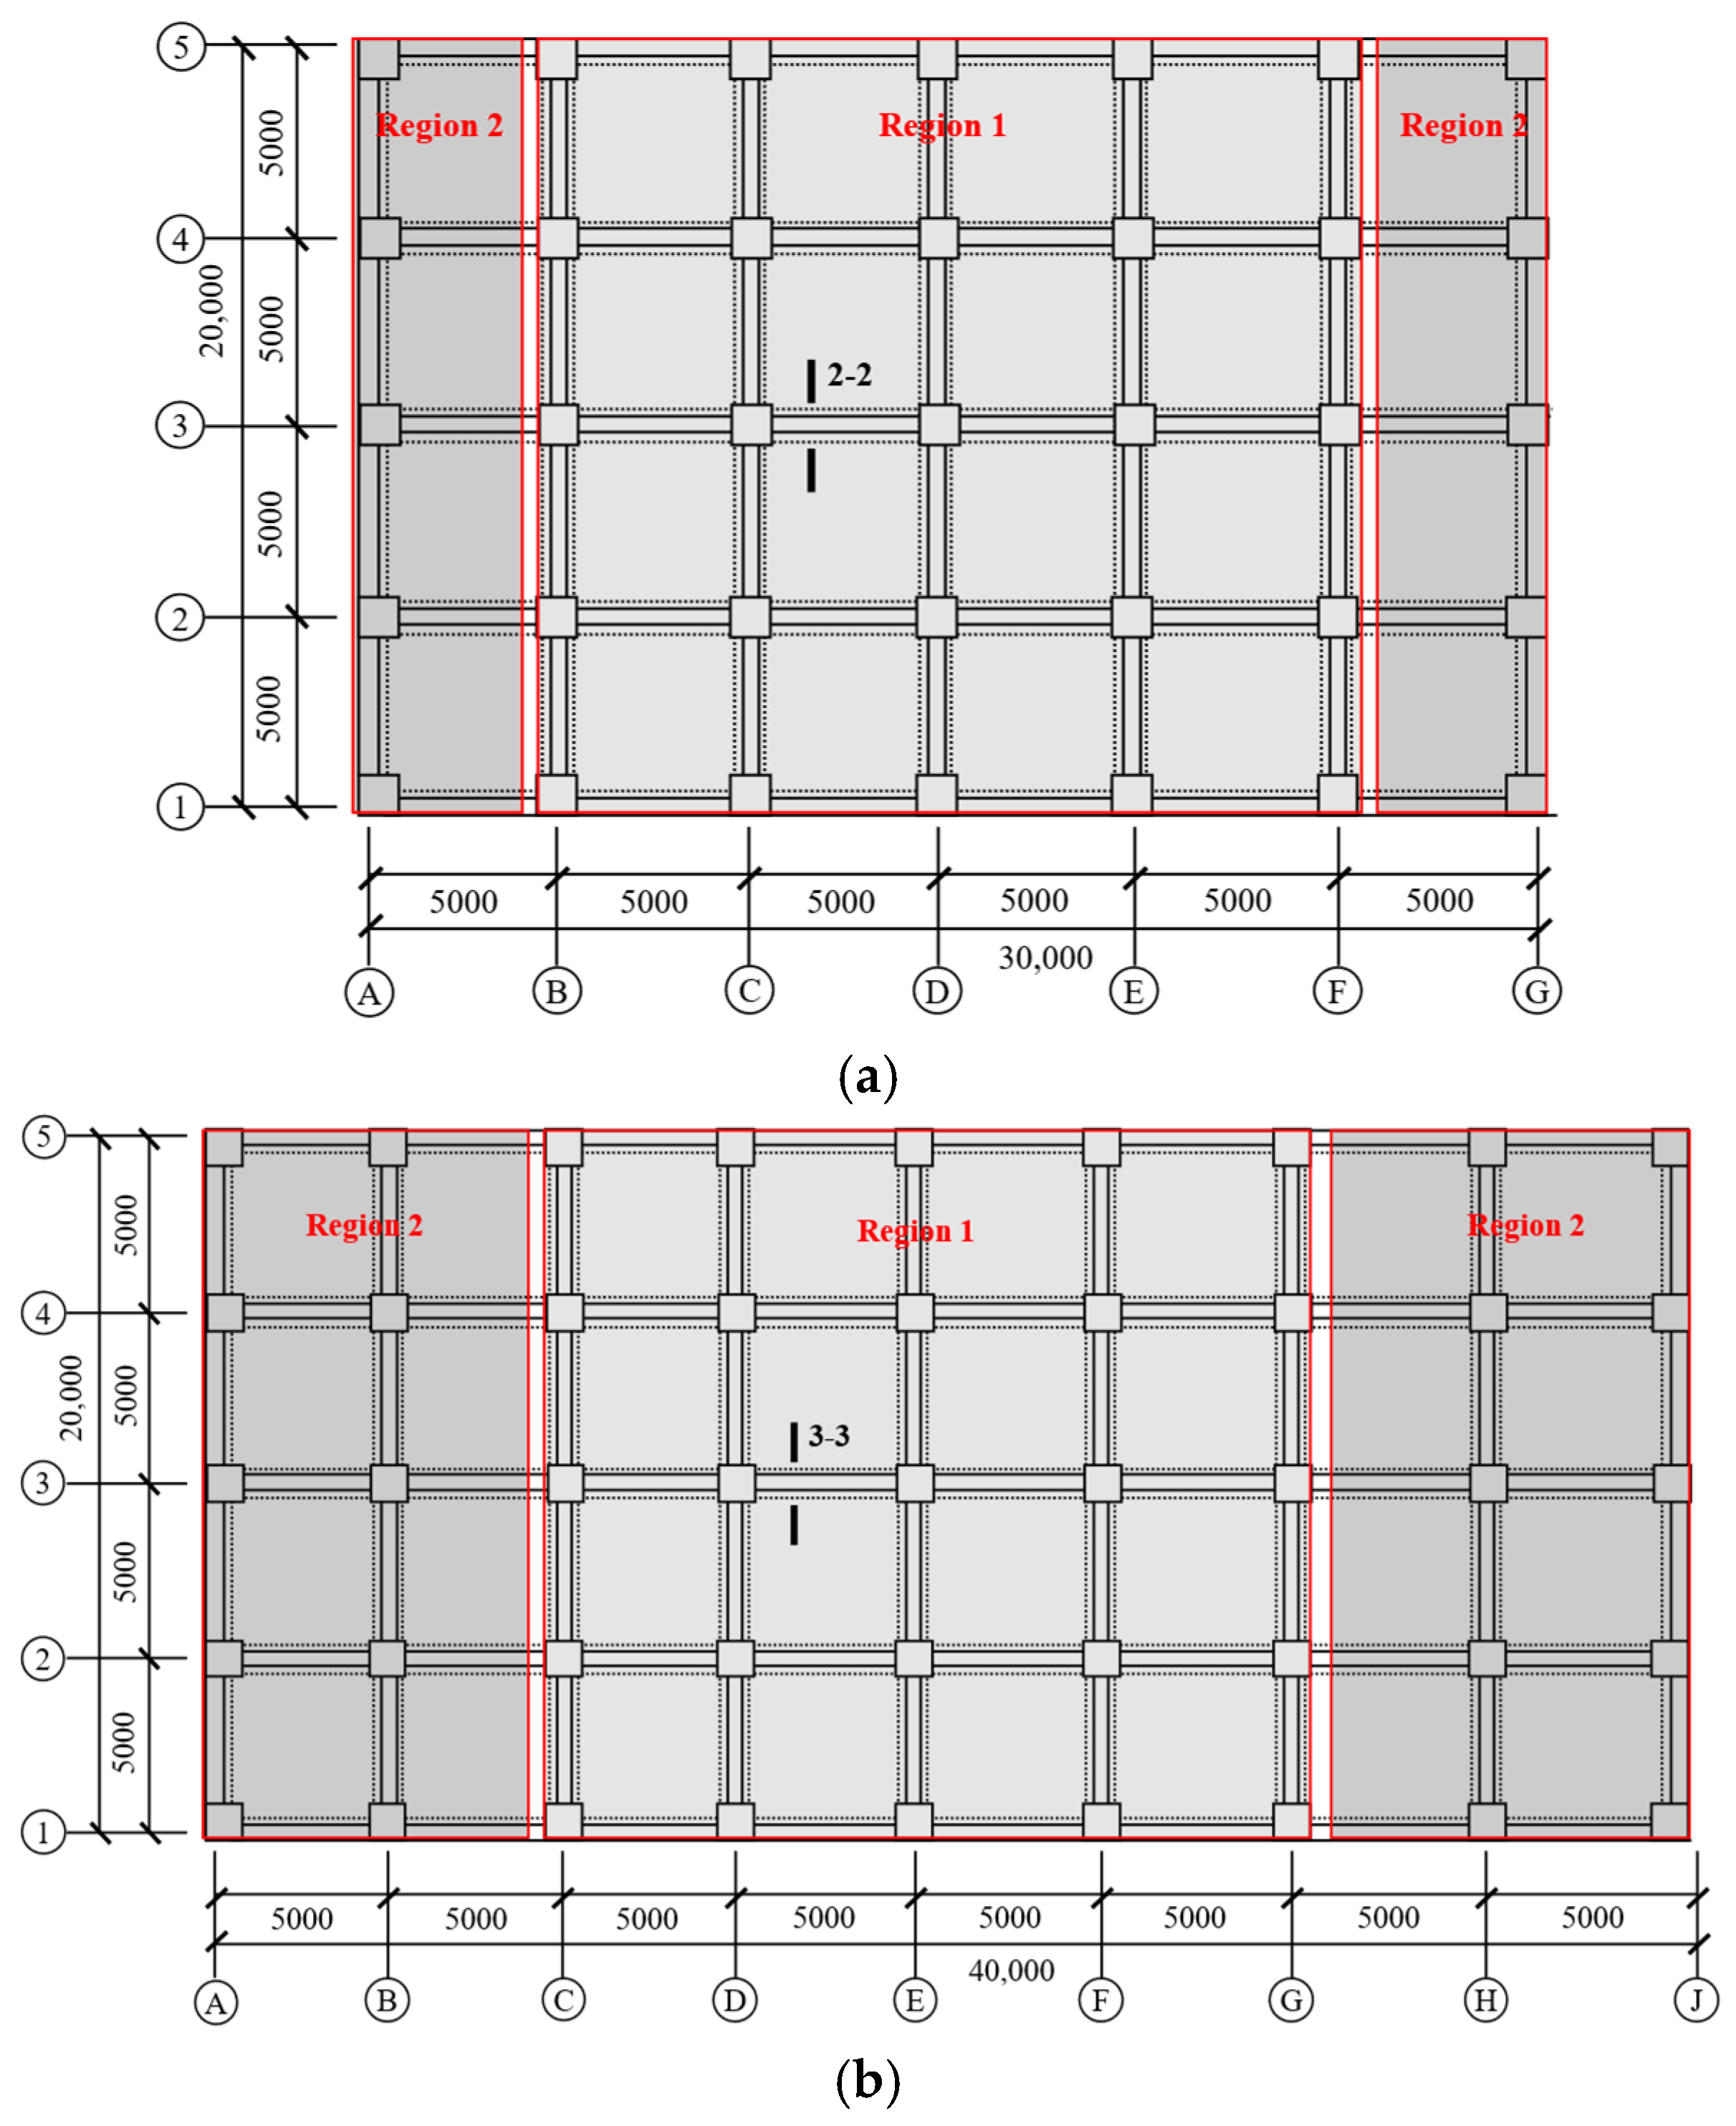
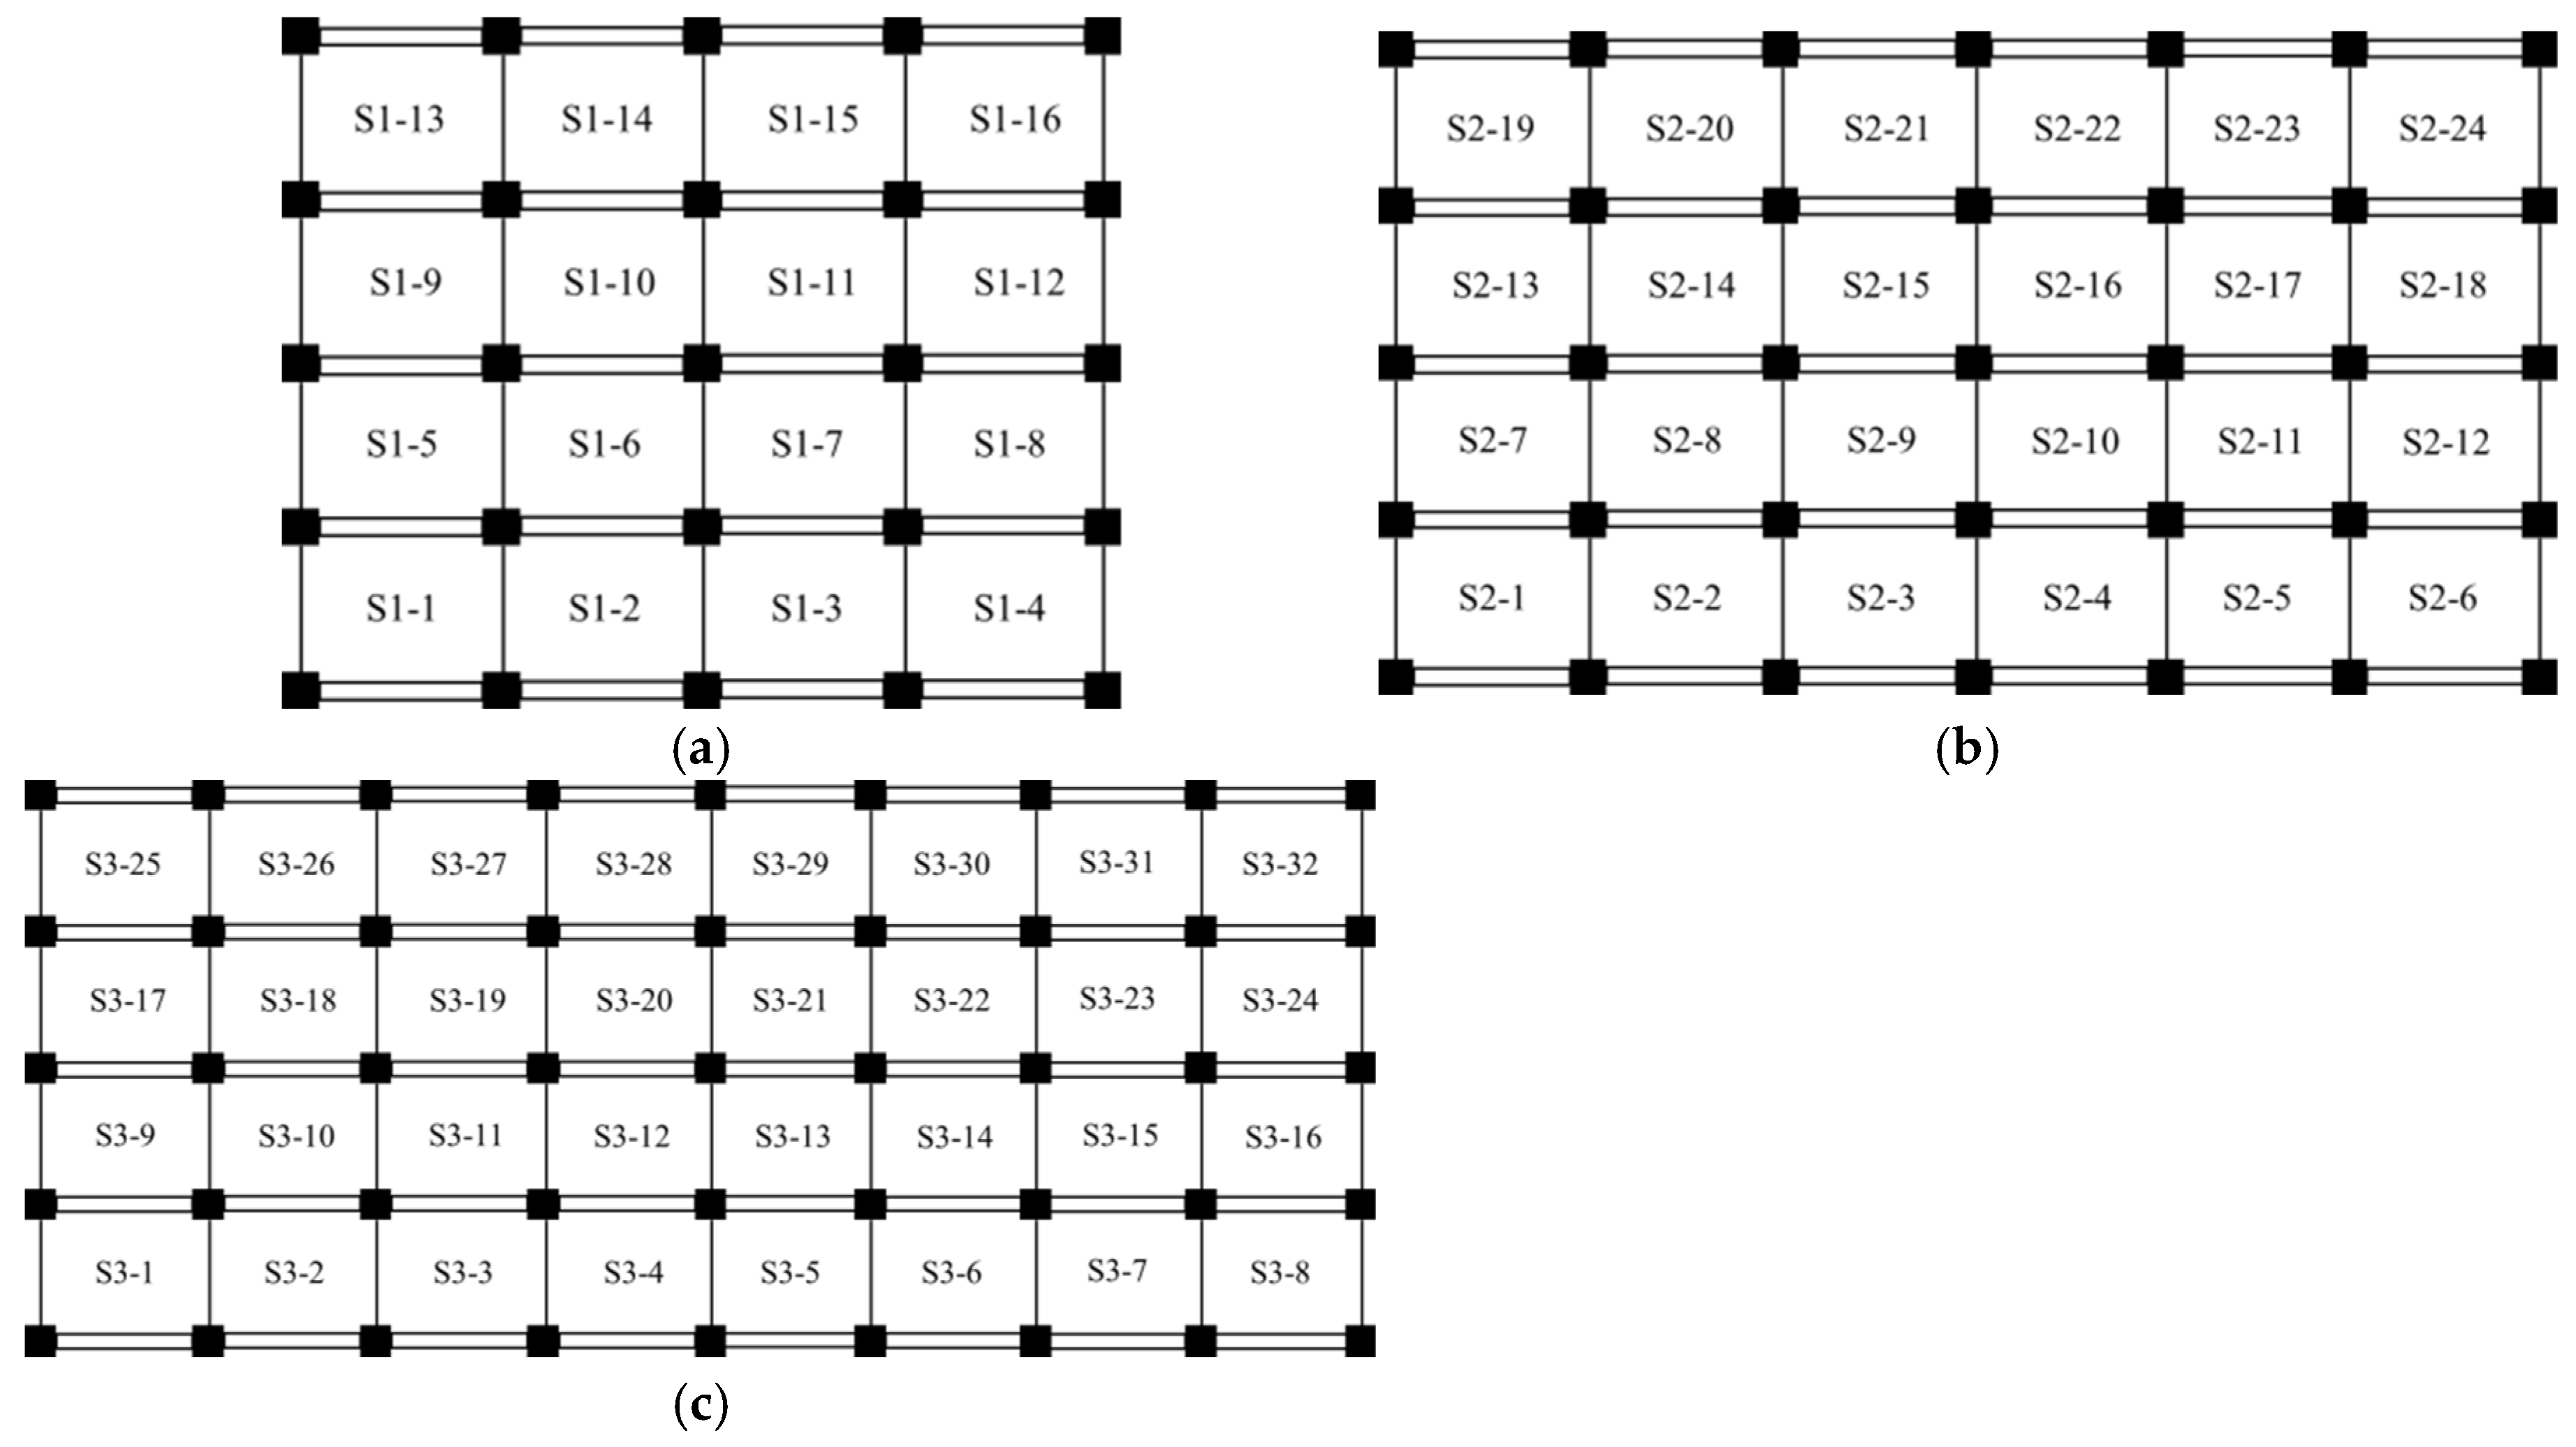
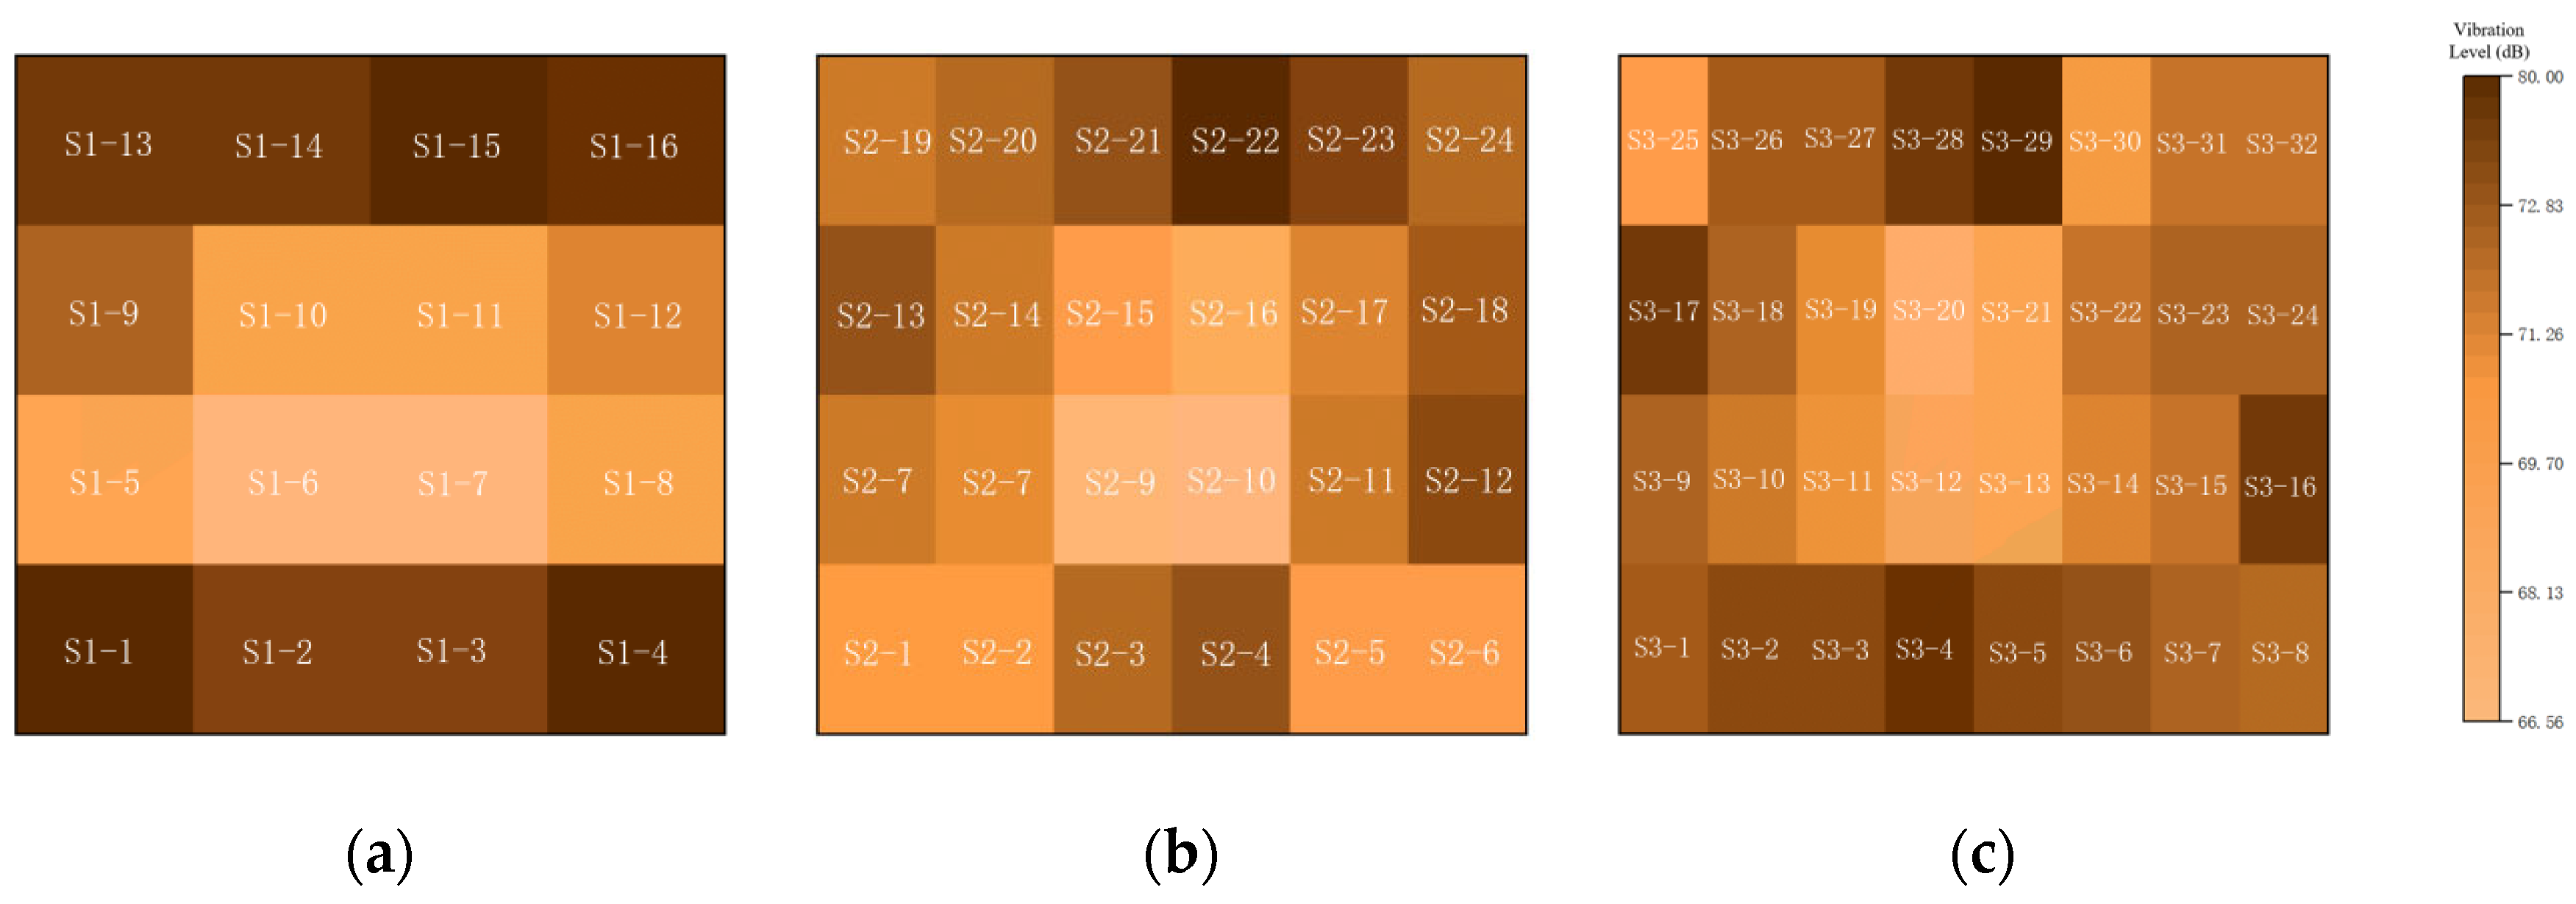
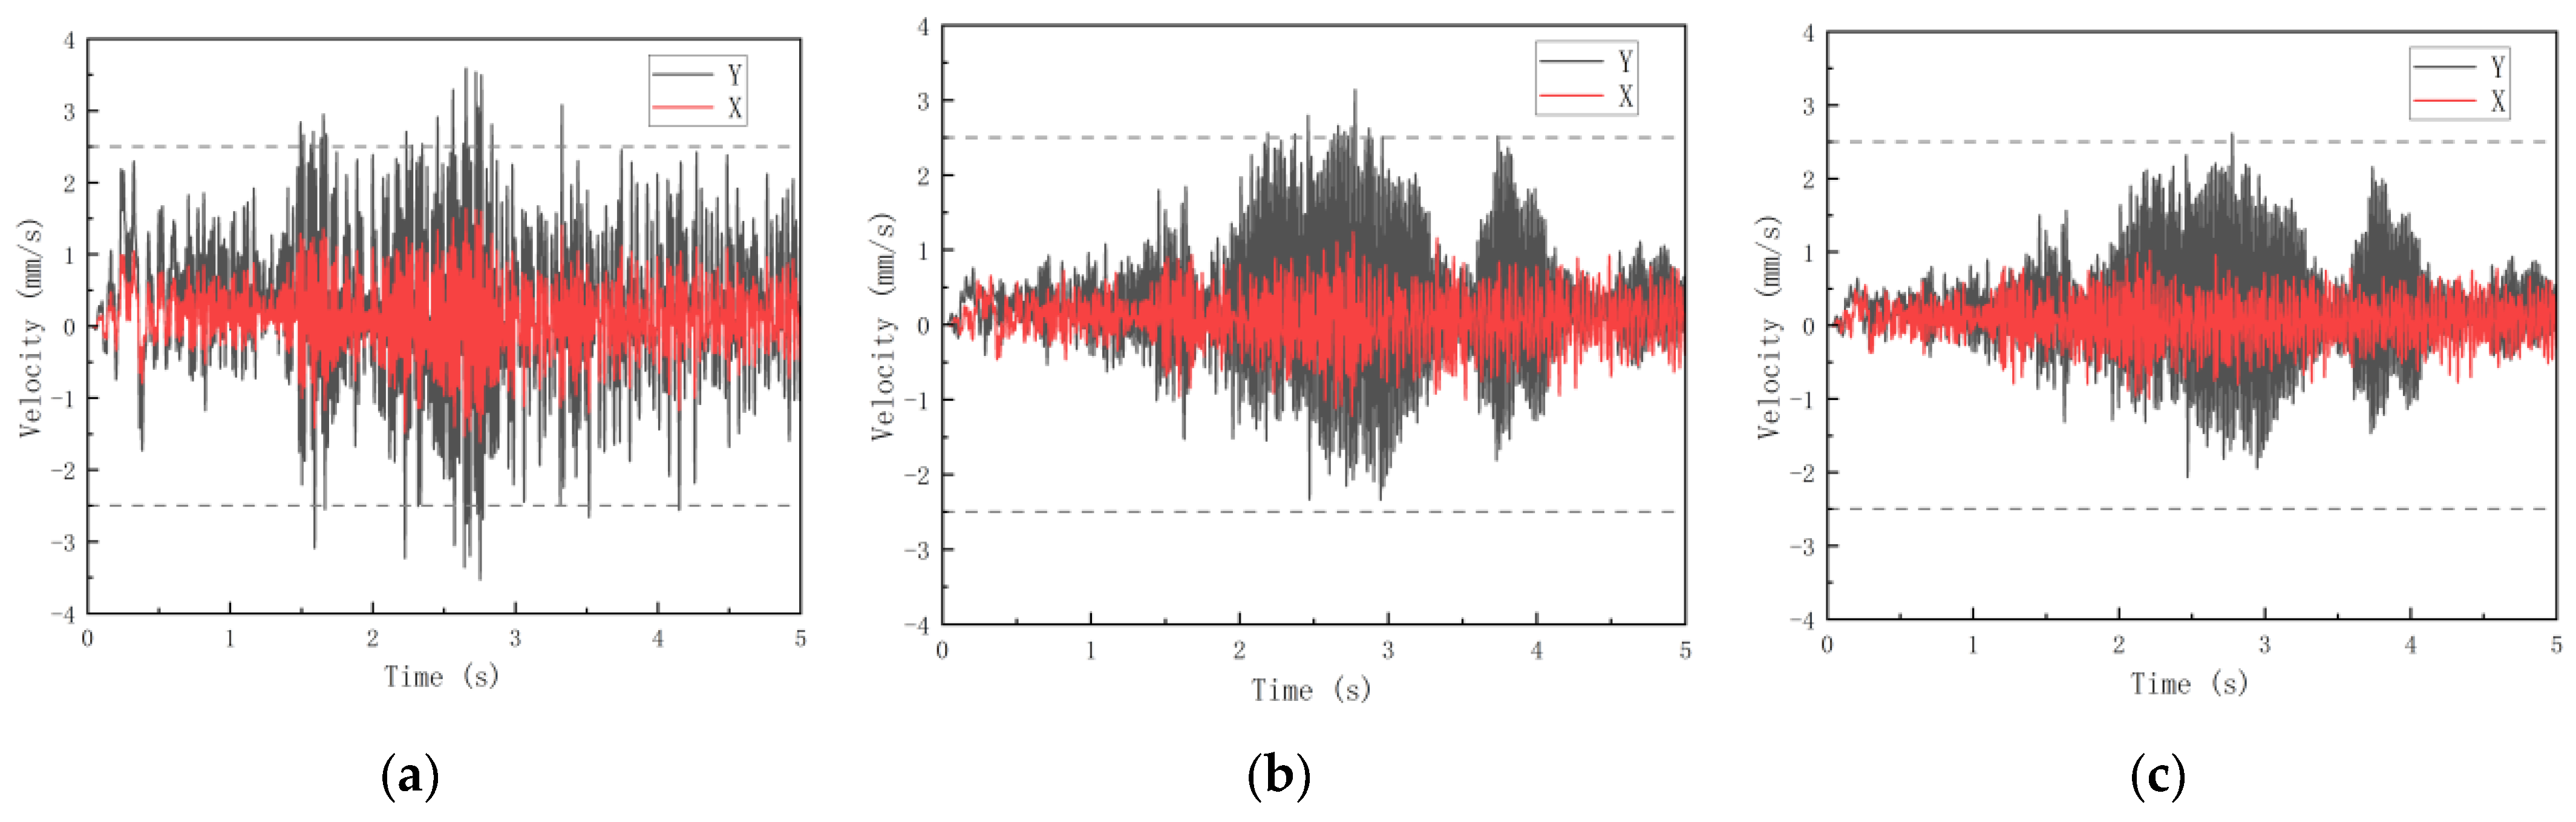
5.5. Influence of the Total Structural Spans Variation on the Structural Vibration Response
6. Conclusions
- (1)
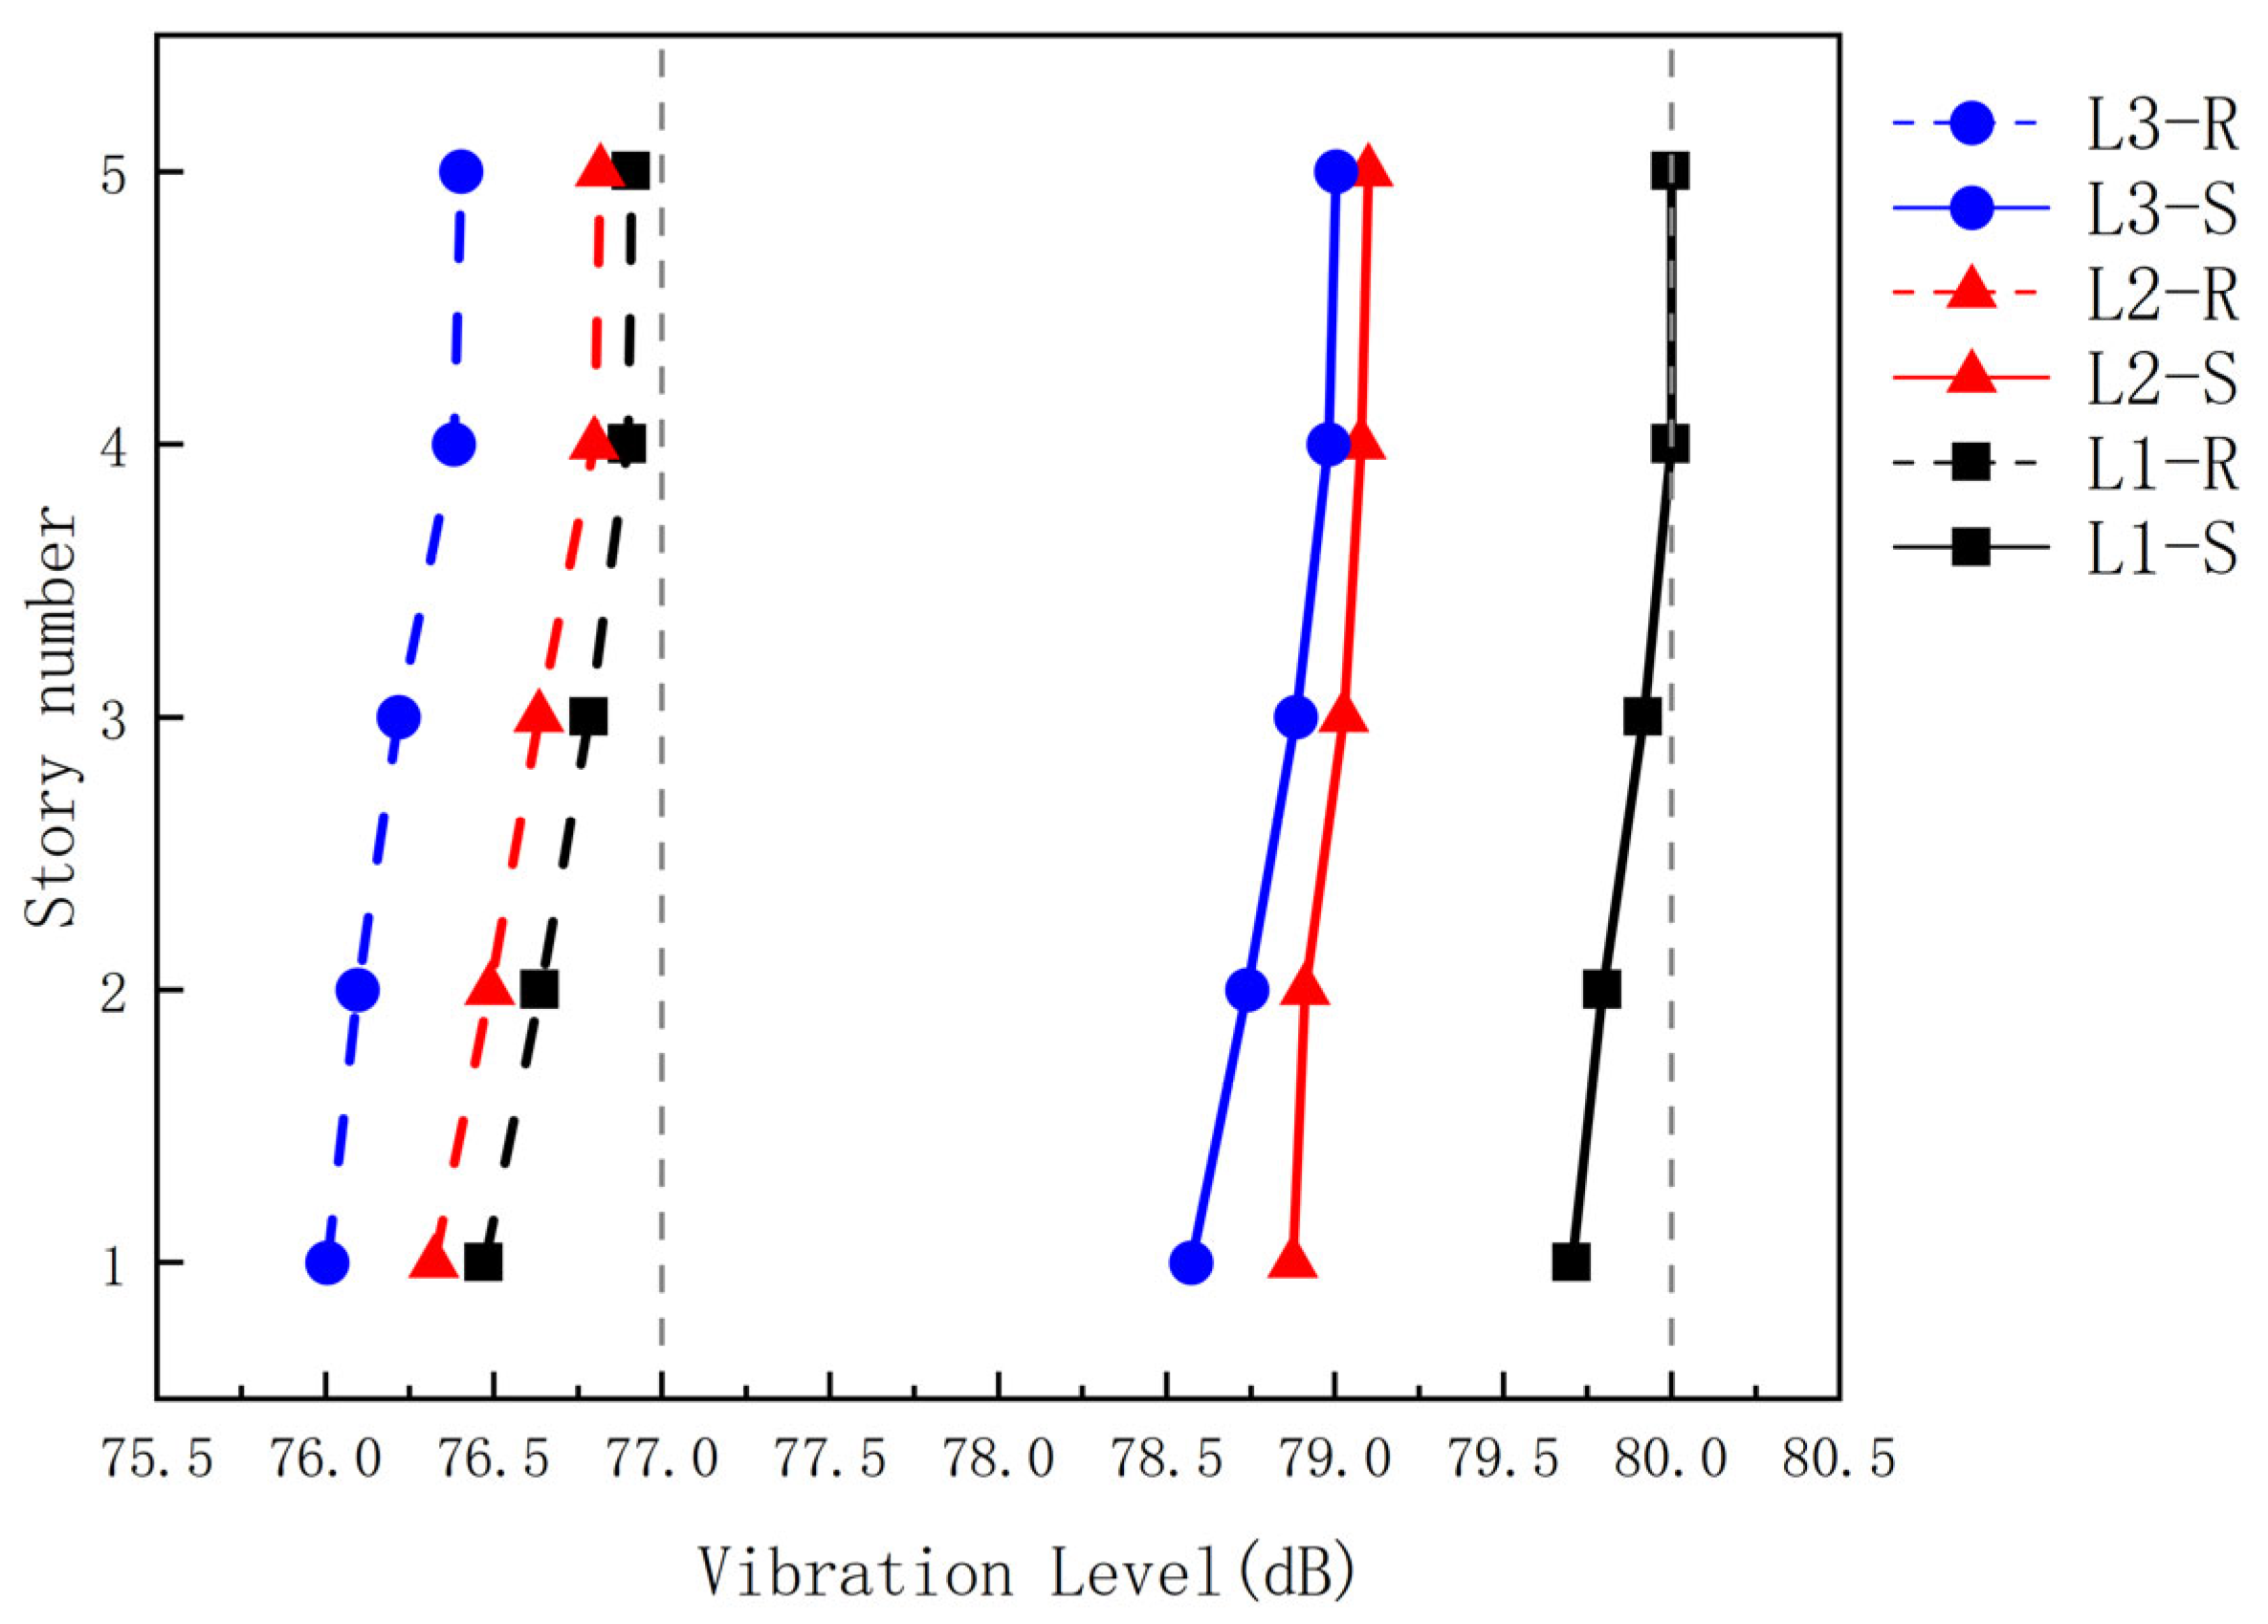
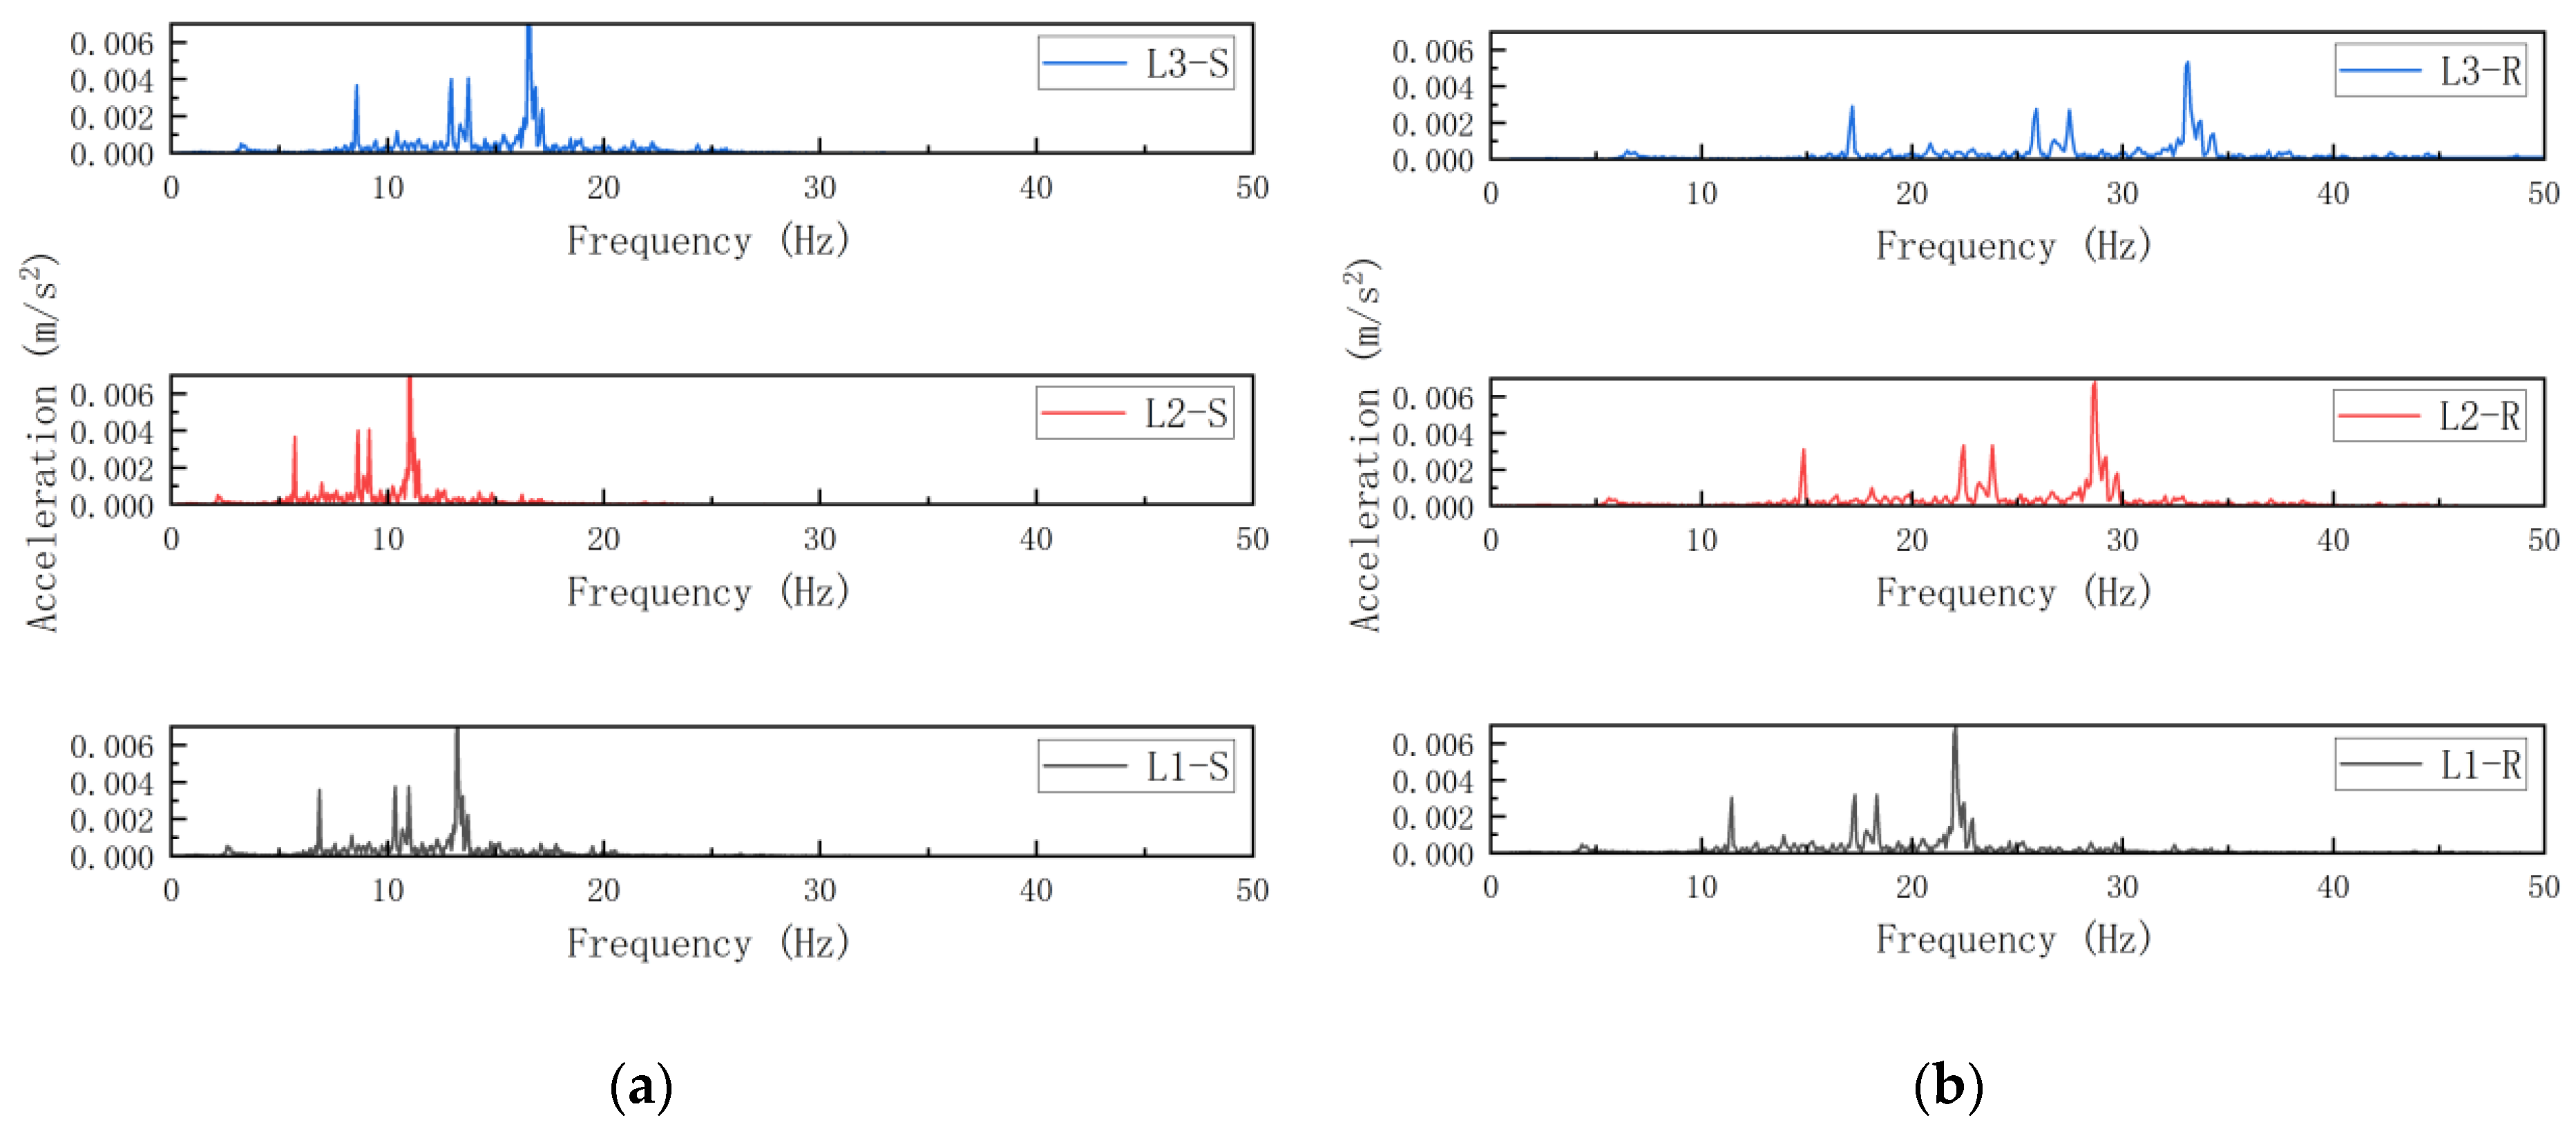
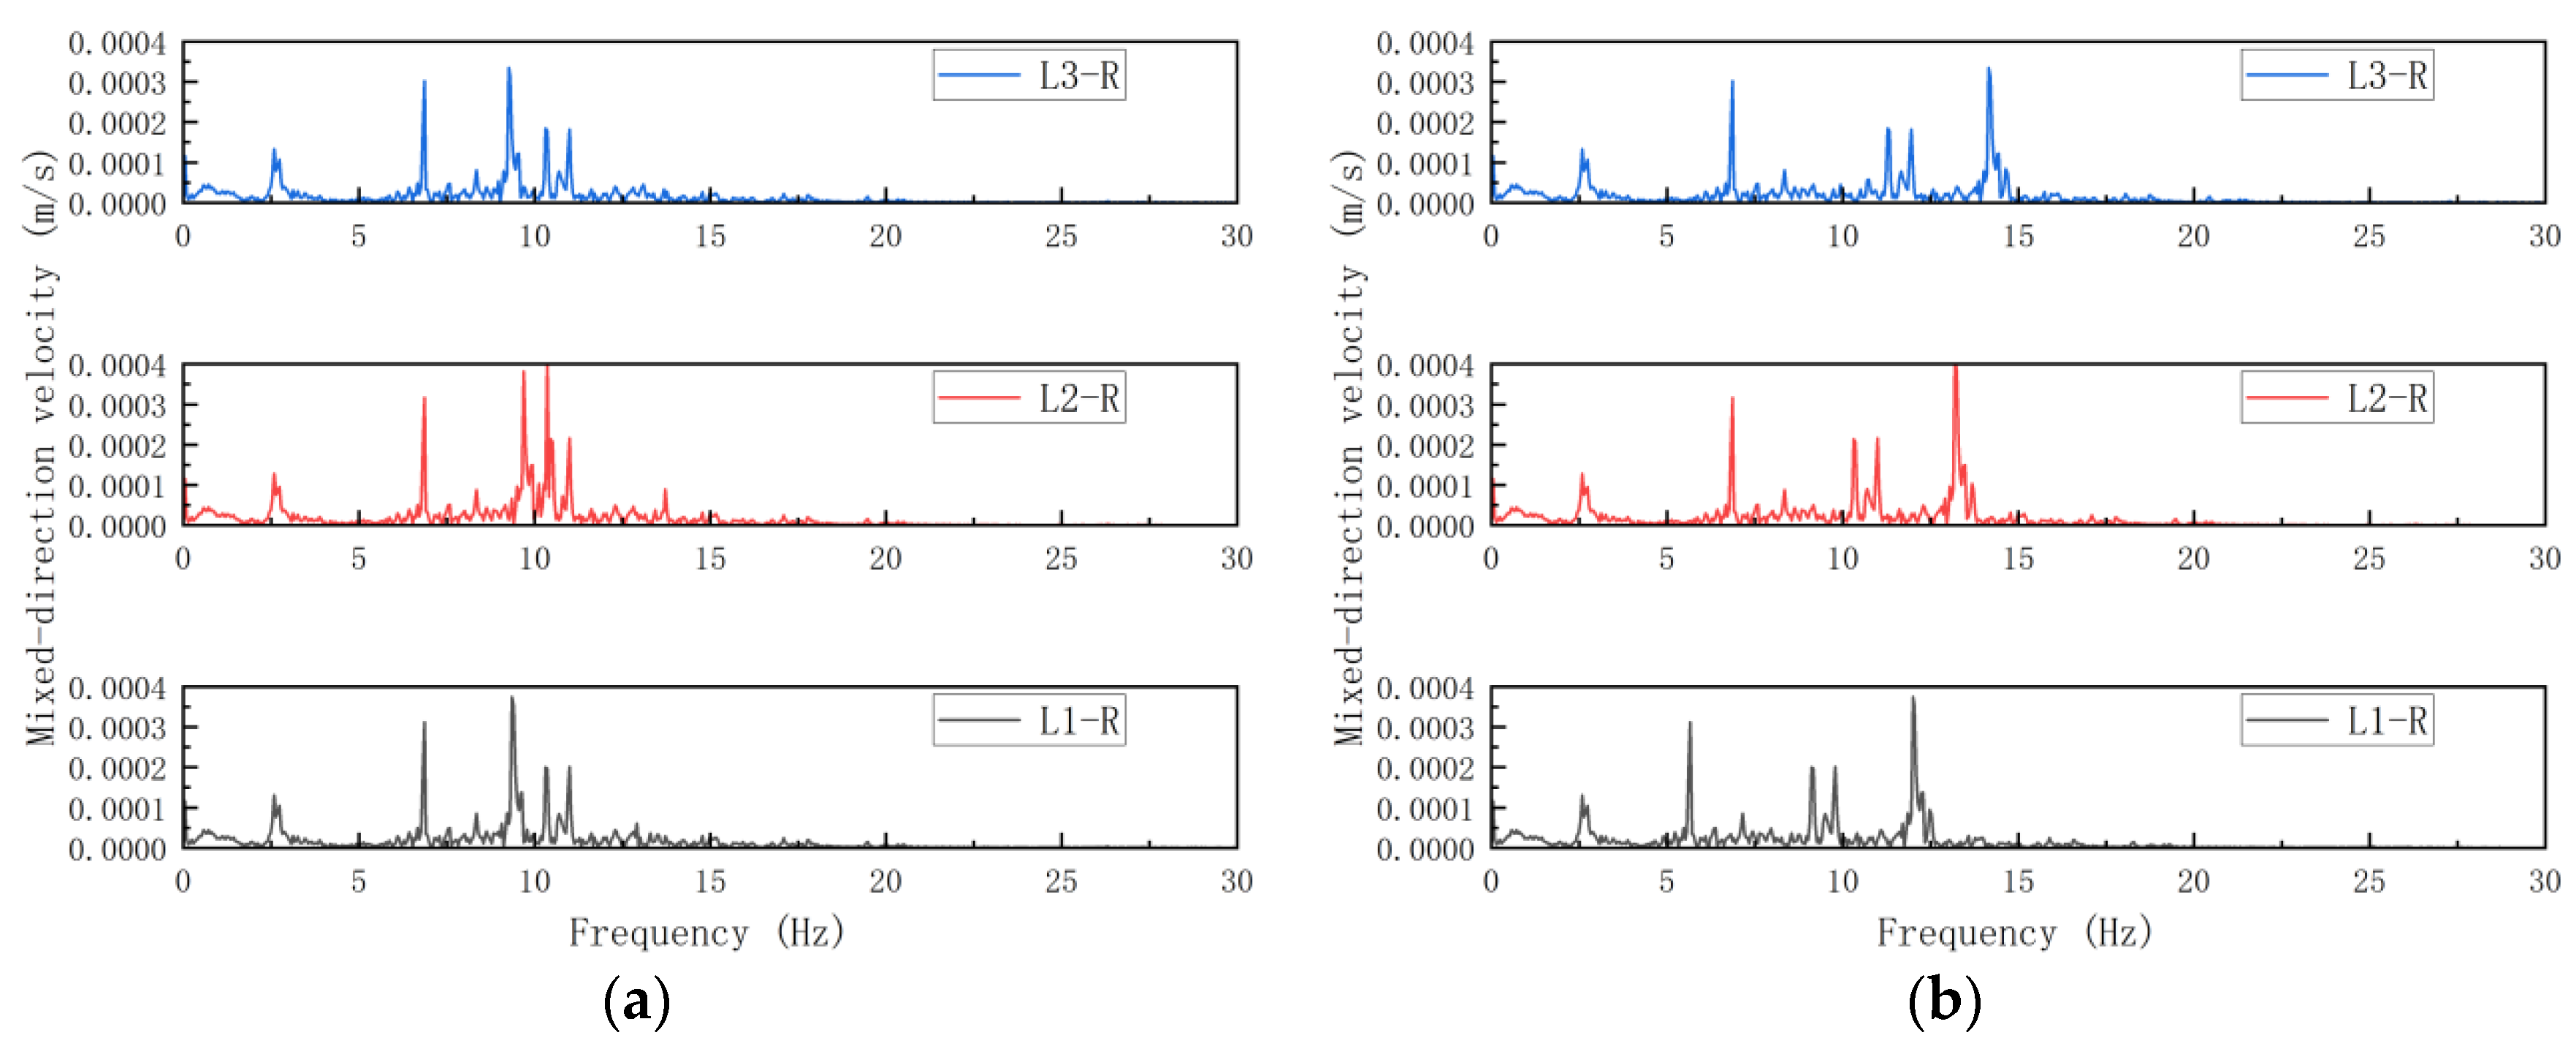
- Beam section modifications demonstrated complex vibration control mechanisms influenced by both height and aspect ratio. Increasing beam height or aspect ratio (at constant height) achieved moderate acceleration reduction. While velocity spectral characteristics remained stable, peak velocity attenuation through height enhancement benefited long-term structural safety. Rigid-jointed systems showed greater sensitivity to beam parameter changes than semirigid configurations.
- (2)
- Column section enlargement demonstrated superior acceleration control efficacy to that of beam modifications. However, semirigid systems exhibited weaker column size effects than their rigid counterparts, often exceeding code-specified acceleration limits. Joint stiffness enhancement should precede column sizing optimization. Column parameter adjustments achieved greater peak velocity reduction than beam changes, establishing column design as a primary velocity-control strategy.
- (3)
- Slab thickening achieved limited vibration reduction with critical thickness boundaries. Semirigid systems reached critical thickness thresholds earlier than rigid counterparts, making slab-based control unreliable for code compliance. While providing modest peak velocity reduction, slab optimization offered lower cost-effectiveness than beam/column modifications.
- (4)
- Structural heightening induced vibration attenuation with amplified roof-level responses, which were particularly pronounced in semirigid systems. Beyond a critical height (n = 11 stories), vibration distribution transitioned to initial attenuation followed by amplification. Frequency escalation impacts human comfort thresholds. Although reducing time-domain peak velocities, multispan nonresidential structures still require supplementary controls for strict compliance.
- (5)
- Span expansion significantly altered dominant frequencies and intensified edge effects in semirigid systems. Horizontal peak velocity reduction through span optimization provides effective safety assurance for metro-adjacent structures.
Author Contributions
Funding
Institutional Review Board Statement
Informed Consent Statement
Data Availability Statement
Conflicts of Interest
References
- Ma, M.; Xu, L.H.; Du, L.L.; Ma, M.; Xu, L.H.; Du, L.L.; Zhang, Q.; Huang, W. Prediction of building vibration induced by metro trains running in a curved tunnel. J. Vib. Control 2021, 27, 515–528. [Google Scholar] [CrossRef]
- Metrikine, A.V.; Vrouwenvelder, A.C.W.M. Surface ground vibration due to a moving train in a tunnel: Two dimensional model. J. Sound Vib. 2000, 234, 43–66. [Google Scholar] [CrossRef]
- Liang, X.; Wang, Y. Research progress on prefabricated semi-rigid connection nodes of steel structures. Prog. Build. Steel Struct. 2022, 24, 1–14. [Google Scholar]
- Zhao, B.; Lu, X.; Liu, L. Experimental Study on the Seismic Performance of Prefabricated Concrete Structure Beam-Column Assemblies in a Fully Assembled Manner. Earthq. Eng. Eng. Vib. 2005, 1, 81–87. [Google Scholar]
- Tian, Y.; Lv, X.; Zhao, B. Experimental study on vibration table of precast concrete frame structure. Struct. Eng. 2008, 1, 66–71. [Google Scholar]
- Zhu, H.; Zhao, B.; Lu, X. Numerical simulation of shaking table test on a fabricated precast concrete frame structure. Eng. J. Wuhan Univ. 2017, 50, 815–822. [Google Scholar]
- Bournas, D.A.; Negro, P.; Molina, F.J. Pseudodynamic tests on a full-scale 3-storey precast concrete building: Behavior of the mechanical connections and floor diaphragms. Eng. Struct. 2013, 57, 609–627. [Google Scholar] [CrossRef]
- Tosa, F.V.; Salha, R. The Behavior of Different Precast Concrete Structures Under Seismic Action. Procedia Technol. 2016, 22, 235–242. [Google Scholar] [CrossRef]
- GB50010-2010; Code for Design of Concrete Structures. China Architecture & Building Press: Beijing, China, 2011.
- Chen, J. Research on the Coherence and Prediction of Vibration and Secondary Noise of Buildings Along the Subway Line. Ph.D. Dissertation, Southwest Jiaotong University, Chengdu, China, 2019. [Google Scholar]
- GB50868-2013; Allowable Vibration Standards for Construction Projects. China Planning Press: Beijing, China, 2013.
- Coulier, P.; Lombaert, G.; Degrande, G. The influence of source–receiver interaction on the numerical prediction of railway induced vibrations. J. Sound Vib. 2014, 333, 2520–2538. [Google Scholar] [CrossRef]
- Vladimir, S.; Ilya, T. To the Question of Vibration Levels Prediction Inside Residential Buildings Caused by Underground Traffic. Procedia Eng. 2017, 176, 371–380. [Google Scholar] [CrossRef]
- Zhao, D.; Ding, Y. The influence of subway operation on the vibration of high-rise buildings varying with the horizontal distance between building and subway tunnel and its calculation and analysis method. Build. Struct. 2023, 53, 708–715. [Google Scholar]
- Zeng, Q.; He, L.; Wu, Y.; Zhang, W.; Liu, F.; Chen, H.; Wang, J.; Li, X.; Zhao, M.; Sun, Y. Distribution law and influencing factors of vibration inside high-rise residential buildings adjacent to subway. Noise Vib. Control 2024, 44, 242–248. [Google Scholar]
- Zou, C.; Moore, J.A.; Sanayei, M.; Wang, Y. Impedance model for estimating train-induced building vibrations. Eng. Struct. 2018, 172, 739–750. [Google Scholar] [CrossRef]
- Qu, S.; Yang, J.J.; Zhu, S.Y.; Wang, L.; Liu, X.; Chen, W.; Zhang, P.; Li, H.; Sun, J.; Zhou, F. Experimental study on ground vibration induced by double-line subway trains and road traffic. Transp. Geotech. 2021, 29, 100564.1–100564.14. [Google Scholar] [CrossRef]


| Vibration Mode | 1st Mode | 2nd Mode | 3rd Mode |
|---|---|---|---|
| Vibration direction | Translational Motion—Y | Translational Motion—X | Rotation |
| Simulated frequency Hz | 4.278 | 5.058 | 6.573 |
| Experiment frequency Hz | 4.319 | 5.258 | 6.573 |
| Error | 0.95% | 3.80% | 2.15% |
| 1.0 | 0.9 | 0.8 | 0.7 | 0.6 | 0.5 | 0.4 | 0.3 | 0.2 | 0.1 | |
N·m/rad | 3.66 × 10⁸ | 3.29 × 10⁸ | 2.93 × 10⁸ | 2.56 × 10⁸ | 2.19 × 10⁸ | 1.83 × 10⁸ | 1.46 × 10⁸ | 1.09 × 10⁸ | 7.32 × 10⁷ | 3.66 × 10⁷ |
| Soil Layer | Thickness m | Dynamic Elastic Modulus Mpa | Poisson’s Ratio | Density kg/m3 | Rayleigh Parameters |
|---|---|---|---|---|---|
| Layer 1 | 10 | 141 | 0.443 | 1650 | = 0.124 = 3.15 × 10⁻⁵ |
| Layer 2 | 12 | 175.3 | 0.439 | 1940 | |
| Layer 3 | 18 | 353 | 0.439 | 1985 |
| Area | Strict Area | Residential Area | Office Area | Production Line |
|---|---|---|---|---|
| Daytime | 74 | 80 | 86 | 92 |
| Nighttime | 74 | 77 | 86 | 92 |
| Models | L1-S | L1-R | L2-S | L2-R | L3-S | L3-R |
|---|---|---|---|---|---|---|
| γ | 0.5 | Rigid | 0.5 | Rigid | 0.5 | Rigid |
| Number of stories | 5 | 5 | 5 | 5 | 5 | 5 |
| Number of spans | 4 | 4 | 4 | 4 | 4 | 4 |
| Slab thickness mm | 100 | 100 | 100 | 100 | 100 | 100 |
| Column section mm × mm | 500 × 500 | 500 × 500 | 500 × 500 | 500 × 500 | 500 × 500 | 500 × 500 |
| Beam section mm × mm | 250 × 500 | 250 × 500 | 250 × 550 | 250 × 550 | 200 × 500 | 200 × 500 |
| Aspect ratio | 2 | 2 | 2.2 | 2.2 | 2.5 | 2.5 |
| Model | L1-S | L2-S | L3-S |
|---|---|---|---|
| N·m/rad | 1.83 × 10⁸ | 2.41 × 10⁸ | 1.51 × 10⁸ |
| Model | L1-S | L2-S | L3-S | L1-R | L2-R | L3-R |
|---|---|---|---|---|---|---|
| X mm/s | 1.635 | 1.574 | 1.598 | 1.484 | 1.347 | 1.375 |
| Y mm/s | 3.592 | 3.314 | 3.437 | 2.976 | 2.724 | 2.793 |
| Models | Z1-S | Z1-R | Z2-S | Z2-R | Z3-S | Z3-R |
|---|---|---|---|---|---|---|
| γ | 0.5 | Rigid | 0.5 | Rigid | 0.5 | Rigid |
| Number of stories | 5 | 5 | 5 | 5 | 5 | 5 |
| Number of spans | 4 | 4 | 4 | 4 | 4 | 4 |
| Slab thickness mm | 100 | 100 | 100 | 100 | 100 | 100 |
| Column section mm × mm | 450 × 450 | 450 × 450 | 500 × 500 | 500 × 500 | 550 × 550 | 550 × 550 |
| Beam section mm × mm | 250 × 500 | 250 × 500 | 250 × 500 | 250 × 500 | 250 × 500 | 250 × 500 |
| Models | Z1-S | Z2-S | Z3-S | Z1-R | Z2-R | Z3-R |
|---|---|---|---|---|---|---|
| X mm/s | 1.697 | 1.635 | 1.506 | 1.519 | 1.484 | 1.311 |
| Y mm/s | 3.692 | 3.592 | 3.254 | 3.187 | 2.976 | 2.624 |
| Models | B1-S | B1-R | B2-S | B2-R | B3-S | B3-R |
|---|---|---|---|---|---|---|
| γ | 0.5 | Rigid | 0.5 | Rigid | 0.5 | Rigid |
| Number of stories | 5 | 5 | 5 | 5 | 5 | 5 |
| Number of spans | 4 | 4 | 4 | 4 | 4 | 4 |
| Slab thickness mm | 100 | 100 | 110 | 110 | 120 | 120 |
| Column section mm × mm | 500 × 500 | 500 × 500 | 500 × 500 | 500 × 500 | 500 × 500 | 500 × 500 |
| Beam section mm × mm | 250 × 500 | 250 × 500 | 250 × 500 | 250 × 500 | 250 × 500 | 250 × 500 |
| Models | B1-S | B2-S | B3-S | B1-R | B2-R | B3-R |
|---|---|---|---|---|---|---|
| X mm/s | 1.635 | 1.541 | 1.497 | 1.484 | 1.417 | 1.379 |
| Y mm/s | 3.592 | 3.451 | 3.407 | 2.976 | 2.842 | 2.729 |
| Models | Beam Section mm2 | Column Section mm2 | Slab Thickness mm | |
|---|---|---|---|---|
| 8-story model | 1~5 story | 250 × 500 | 550 × 550 | 100 |
| 6~8 story | 250 × 500 | 500 × 500 | 100 | |
| 11-story model | 1~5 story | 250 × 600 | 600 × 600 | 110 |
| 5~8 story | 250 × 600 | 550 × 550 | 110 | |
| 9~11 story | 250 × 600 | 500 × 500 | 110 | |
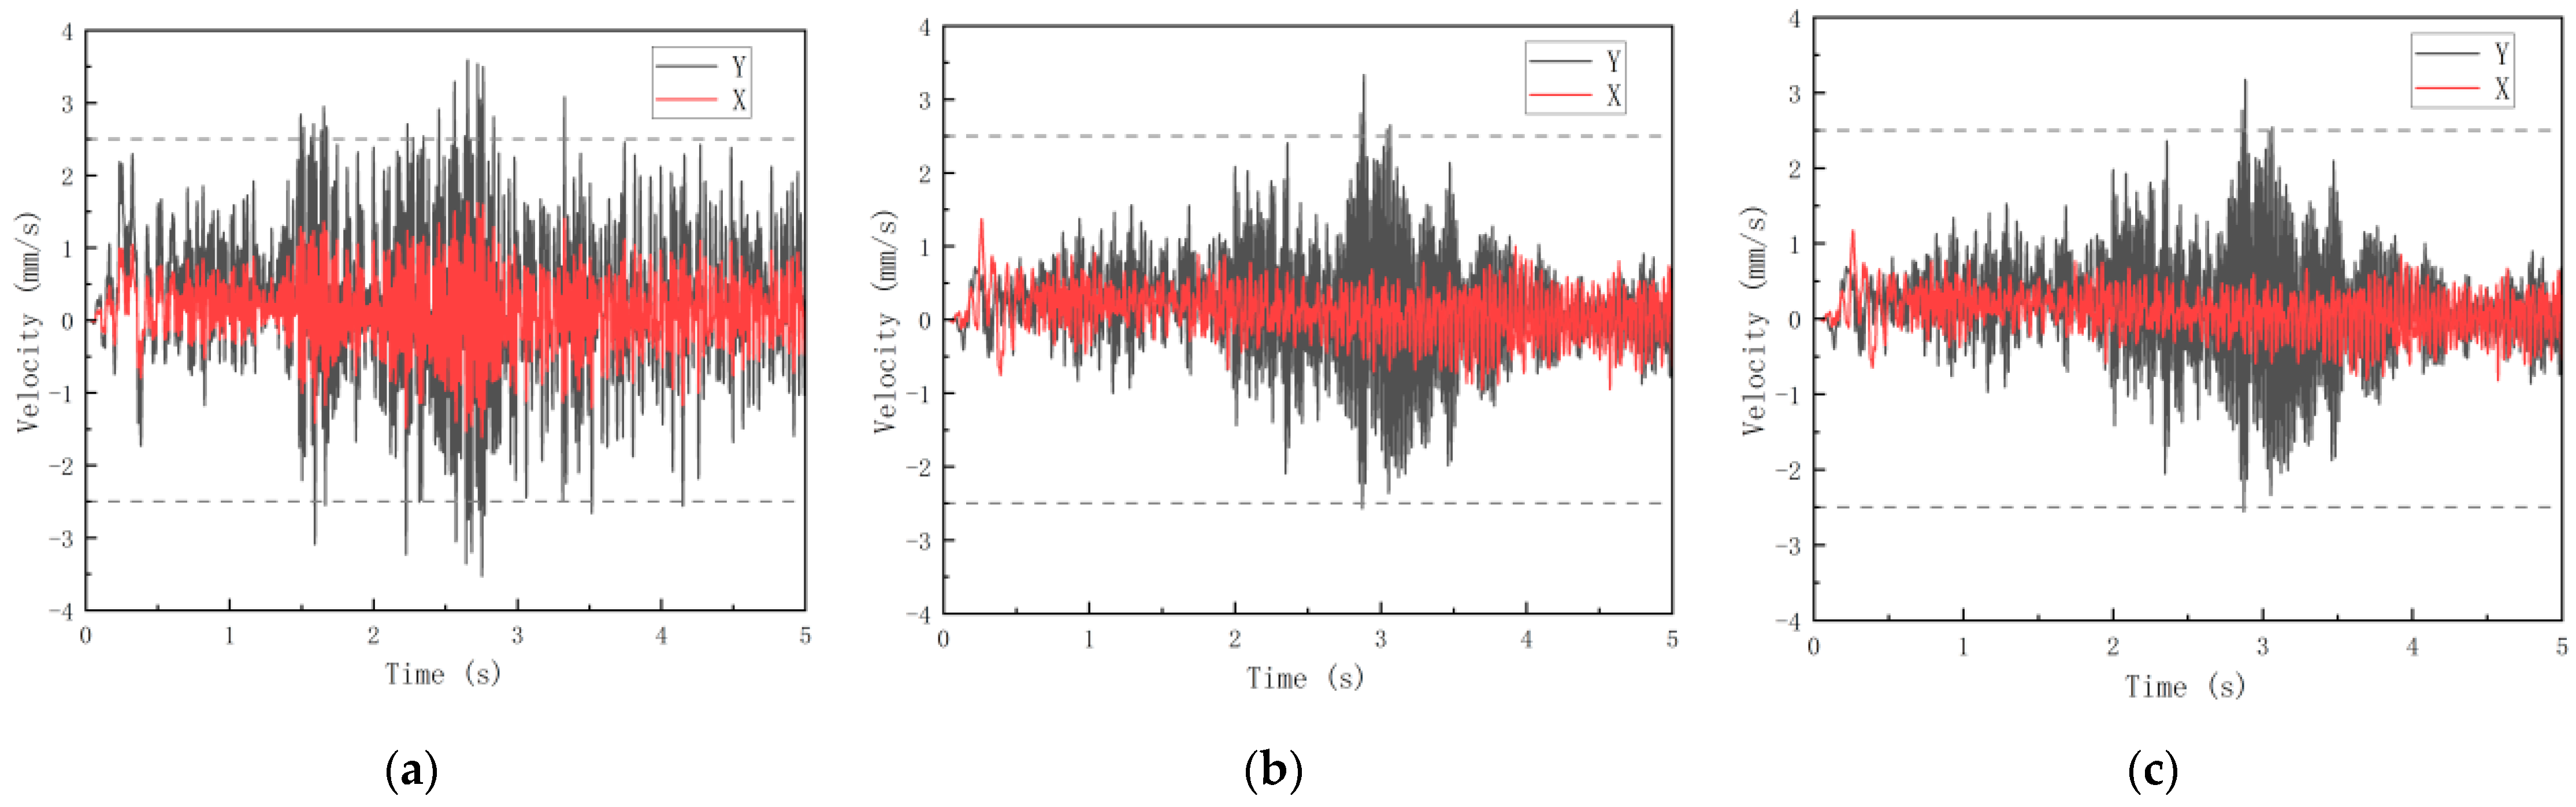
| Direction | Five-Story Model | Eight-Story Model | Eleven-Story Model | |||
|---|---|---|---|---|---|---|
| X | Y | X | Y | X | Y | |
| Peak velocity | 1.653 | 3.592 | 1.371 | 3.334 | 1.175 | 3.176 |
| Model | Γ | Number of Stories | Number of Spans | Slab Thickness mm | Column Section mm × mm | Beam Section mm × mm |
|---|---|---|---|---|---|---|
| S1 | 0.5 | 5 | 4 | 100 | 500 × 500 | 250 × 500 |
| S2 | 0.5 | 5 | 6 | 100 | 500 × 500 | 250 × 500 |
| S3 | 0.5 | 5 | 8 | 100 | 500 × 500 | 250 × 500 |
| Direction | S1 | S2 | S3 | |||
|---|---|---|---|---|---|---|
| X | Y | X | Y | X | Y | |
| Peak velocity | 1.653 | 3.592 | 1.241 | 3.139 | 1.020 | 2.612 |
Disclaimer/Publisher’s Note: The statements, opinions and data contained in all publications are solely those of the individual author(s) and contributor(s) and not of MDPI and/or the editor(s). MDPI and/or the editor(s) disclaim responsibility for any injury to people or property resulting from any ideas, methods, instructions or products referred to in the content. |
© 2025 by the authors. Licensee MDPI, Basel, Switzerland. This article is an open access article distributed under the terms and conditions of the Creative Commons Attribution (CC BY) license (https://creativecommons.org/licenses/by/4.0/).
Share and Cite
Huang, Z.; Yang, Y. Vibration Response Characteristics of Prefabricated Frame Structures Around the Subway. Appl. Sci. 2025, 15, 6419. https://doi.org/10.3390/app15126419
Huang Z, Yang Y. Vibration Response Characteristics of Prefabricated Frame Structures Around the Subway. Applied Sciences. 2025; 15(12):6419. https://doi.org/10.3390/app15126419
Chicago/Turabian StyleHuang, Zhenyu, and Youfa Yang. 2025. "Vibration Response Characteristics of Prefabricated Frame Structures Around the Subway" Applied Sciences 15, no. 12: 6419. https://doi.org/10.3390/app15126419
APA StyleHuang, Z., & Yang, Y. (2025). Vibration Response Characteristics of Prefabricated Frame Structures Around the Subway. Applied Sciences, 15(12), 6419. https://doi.org/10.3390/app15126419