Article

Investigating the Physical Mechanisms of Quicksand Using a Custom-Designed Experimental Apparatus

1
College of Geoscience and Survey Engineering, Taiyuan University of Technology, Taiyuan 030024, China
2
China Institute of Geo-Environment Monitoring, Beijing 100081, China
*
Author to whom correspondence should be addressed.
Appl. Sci. 2025, 15(12), 6415; https://doi.org/10.3390/app15126415
Submission received: 18 March 2025 / Revised: 17 April 2025 / Accepted: 29 May 2025 / Published: 6 June 2025
(This article belongs to the Section Civil Engineering)

Abstract

Featured Application

1. Custom-Designed Hydrodynamic Seepage Testing System: Developed a high-precision hydrodynamic seepage testing apparatus capable of precisely regulating hydrodynamic velocities (25–250 mL/min) and real-time monitoring of pressure variations at multiple elevations, providing a reliable experimental platform for investigating quicksand mechanisms. 2. The experiments systematically quantify the independent and coupled effects of particle gradation and hydrodynamic velocity on quicksand, including the critical median particle diameter (d50 = 0.71 mm) and the linear correlation (R2 = 0.96) between hydrodynamic velocity and seepage discharge. These findings provide a concrete addition to existing research. 3. Three-Stage Evolution Theory of Quicksand: The study describes the three-stage evolution process of quicksand (self-consolidation → reorganization → quicksand initiation), emphasizing the critical role of the reorganization stage. 4. Quantification of Quicksand Thickness: Experimentally determined the quicksand thickness (60 mm), providing a quantifiable indicator for engineering early-warning systems. 5. Granular-Scale Insights into Quicksand Mechanisms: Unlike most existing research that analyzes quicksand from a macroscopic mechanical perspective, this study reveals the intrinsic mechanisms of quicksand at the granular scale, offering a new theoretical perspective for understanding quicksand dynamics.

Abstract

Quicksand initiation in saturated sandy soils represents a critical geohazard with significant implications for geotechnical infrastructure stability. Despite its importance, the granular-scale mechanisms driving the physical state transitions during quicksand remain insufficiently understood. This study employs a custom-designed hydrodynamic seepage testing system to investigate these mechanisms, enabling precise regulation of hydrodynamic velocity and real-time monitoring of pressure variations. Through experiments on quartz sand specimens with varying particle gradations, we demonstrate that particle gradation primarily governs quicksand susceptibility, while hydrodynamic velocity controls its initiation timing and exhibits a linear correlation with seepage discharge. The quicksand process evolves through three distinct stages: self-consolidation, reorganization, and quicksand initiation, with the reorganization stage identified as the pivotal phase where particle rearrangement dictates system stability. These findings elucidate the intrinsic physical mechanisms of quicksand as a hydraulic failure phenomenon, offering valuable insights for predictive modeling and geohazard mitigation in granular media.

1. Introduction

Quicksand, as a widespread and hazardous geological phenomenon, significantly impacts foundational structures, superstructures, and infrastructure such as bridges and dams [1,2]. The formation mechanism of quicksand is rooted in hydrodynamic seepage theory [3] and the effective stress principle [4]. This phenomenon occurs when pore water pressure in saturated sandy soils progressively increases under multifactorial triggering conditions. Once the pore water pressure equals or exceeds the overburden pressure exerted by the overlying soil mass, the sand particles become suspended within the pore fluid, resulting in a fluid-like behavioral state.
Notably, naturally dry sandy soils cannot exhibit quicksand behavior [5], as its manifestation is governed by the combined physical properties of both granular matrices and interstitial water. Among the numerous contributing factors to quicksand formation in saturated sandy deposits, seismic loading stands as the primary trigger [6]. Since the 1960s, major global earthquakes have frequently induced liquefaction failures and quicksand events [7]. Under seismic excitation, saturated sand particles undergo continuous rearrangement, transitioning into a metastable fluidized state analogous to viscous liquids [8]. Arulanandan et al. [9] demonstrated that seismic loading induces microfabric reorganization in sandy soils, leading to the loss of interparticle contacts and creating preferential pathways for pore water drainage. Dashiti et al. [10] identified five causal mechanisms for seismic subsidence in saturated sandy soils: seepage drainage, particle deposition, post-earthquake consolidation, partial bearing capacity loss, and soil-structure interaction. Permeability characteristics of sandy soils constitute another critical factor influencing quicksand formation. Xenaki et al. [11] systematically investigated the impact of fine-grained constituents (clay and silt particles) on quicksand resistance. Their experimental results demonstrate that the anti-quicksand capacity of sandy soils exhibits a non-monotonic variation trend with increasing fines content, a phenomenon primarily governed by the proportional ratio between clay and silt particles [12,13]. Furthermore, particle size and gradation characteristics serve as additional contributing factors to quicksand susceptibility. Wang [14] conducted a series of studies on this phenomenon, revealing that fine particles and their content promote quicksand initiation in sandy soils, while coarse particles and their content inhibit quicksand behavior.
In summary, the primary factors inducing quicksand phenomena in sandy soils include hydrological conditions, seismic activity, permeability characteristics, material composition, and particle size gradation. Quicksand formation results from the synergistic effects of multiple contributing factors. While existing studies, both domestic and international, have extensively addressed the static effects of these factors on quicksand phenomena, the dynamic transition from stable seepage to quicksand failure under hydrodynamic conditions remains inadequately understood.
Traditional permeameters, such as the classical constant-head and falling-head devices [15,16], are predominantly designed based on Darcy’s law (Q = k·i·A), under the assumption of a static and uniform soil structure. Accordingly, their application has largely been limited to steady-state conditions, focusing on basic permeability parameter measurements [17]. However, these devices often fall short in simulating complex seepage processes encountered in real-world scenarios. Specifically, they lack the capability to accurately control variable hydraulic gradients, making it difficult to perform staged dynamic seepage tests [18]. Furthermore, most are not equipped with real-time, high-precision monitoring systems for pore pressure and seepage flow, resulting in an inability to capture the evolution of hydraulic responses within different soil layers. As a result, seepage behavior is typically inferred through visual observations of soil deformation, which fails to capture the underlying mechanisms of quicksand initiation and development [19], thereby hindering the precise design of engineering protection strategies. To address these limitations, this study introduces a self-developed dynamic water seepage apparatus, which allows for precise control of dynamic flow velocity and real-time monitoring of multi-layer pore water pressure. Using quartz sand with varying particle gradations, the apparatus simulates an unsteady seepage environment, unveiling the dynamic transition of sandy soil’s physical state before and after the quicksand phenomenon and investigating the influence of different flow velocities on the permeability characteristics of sandy soils. This research aims to provide new methodological support for the in-depth analysis of the coupling mechanisms of seepage and structural instability, as well as for the optimization of geological hazard early-warning models.

2. Experimental Materials and Methods

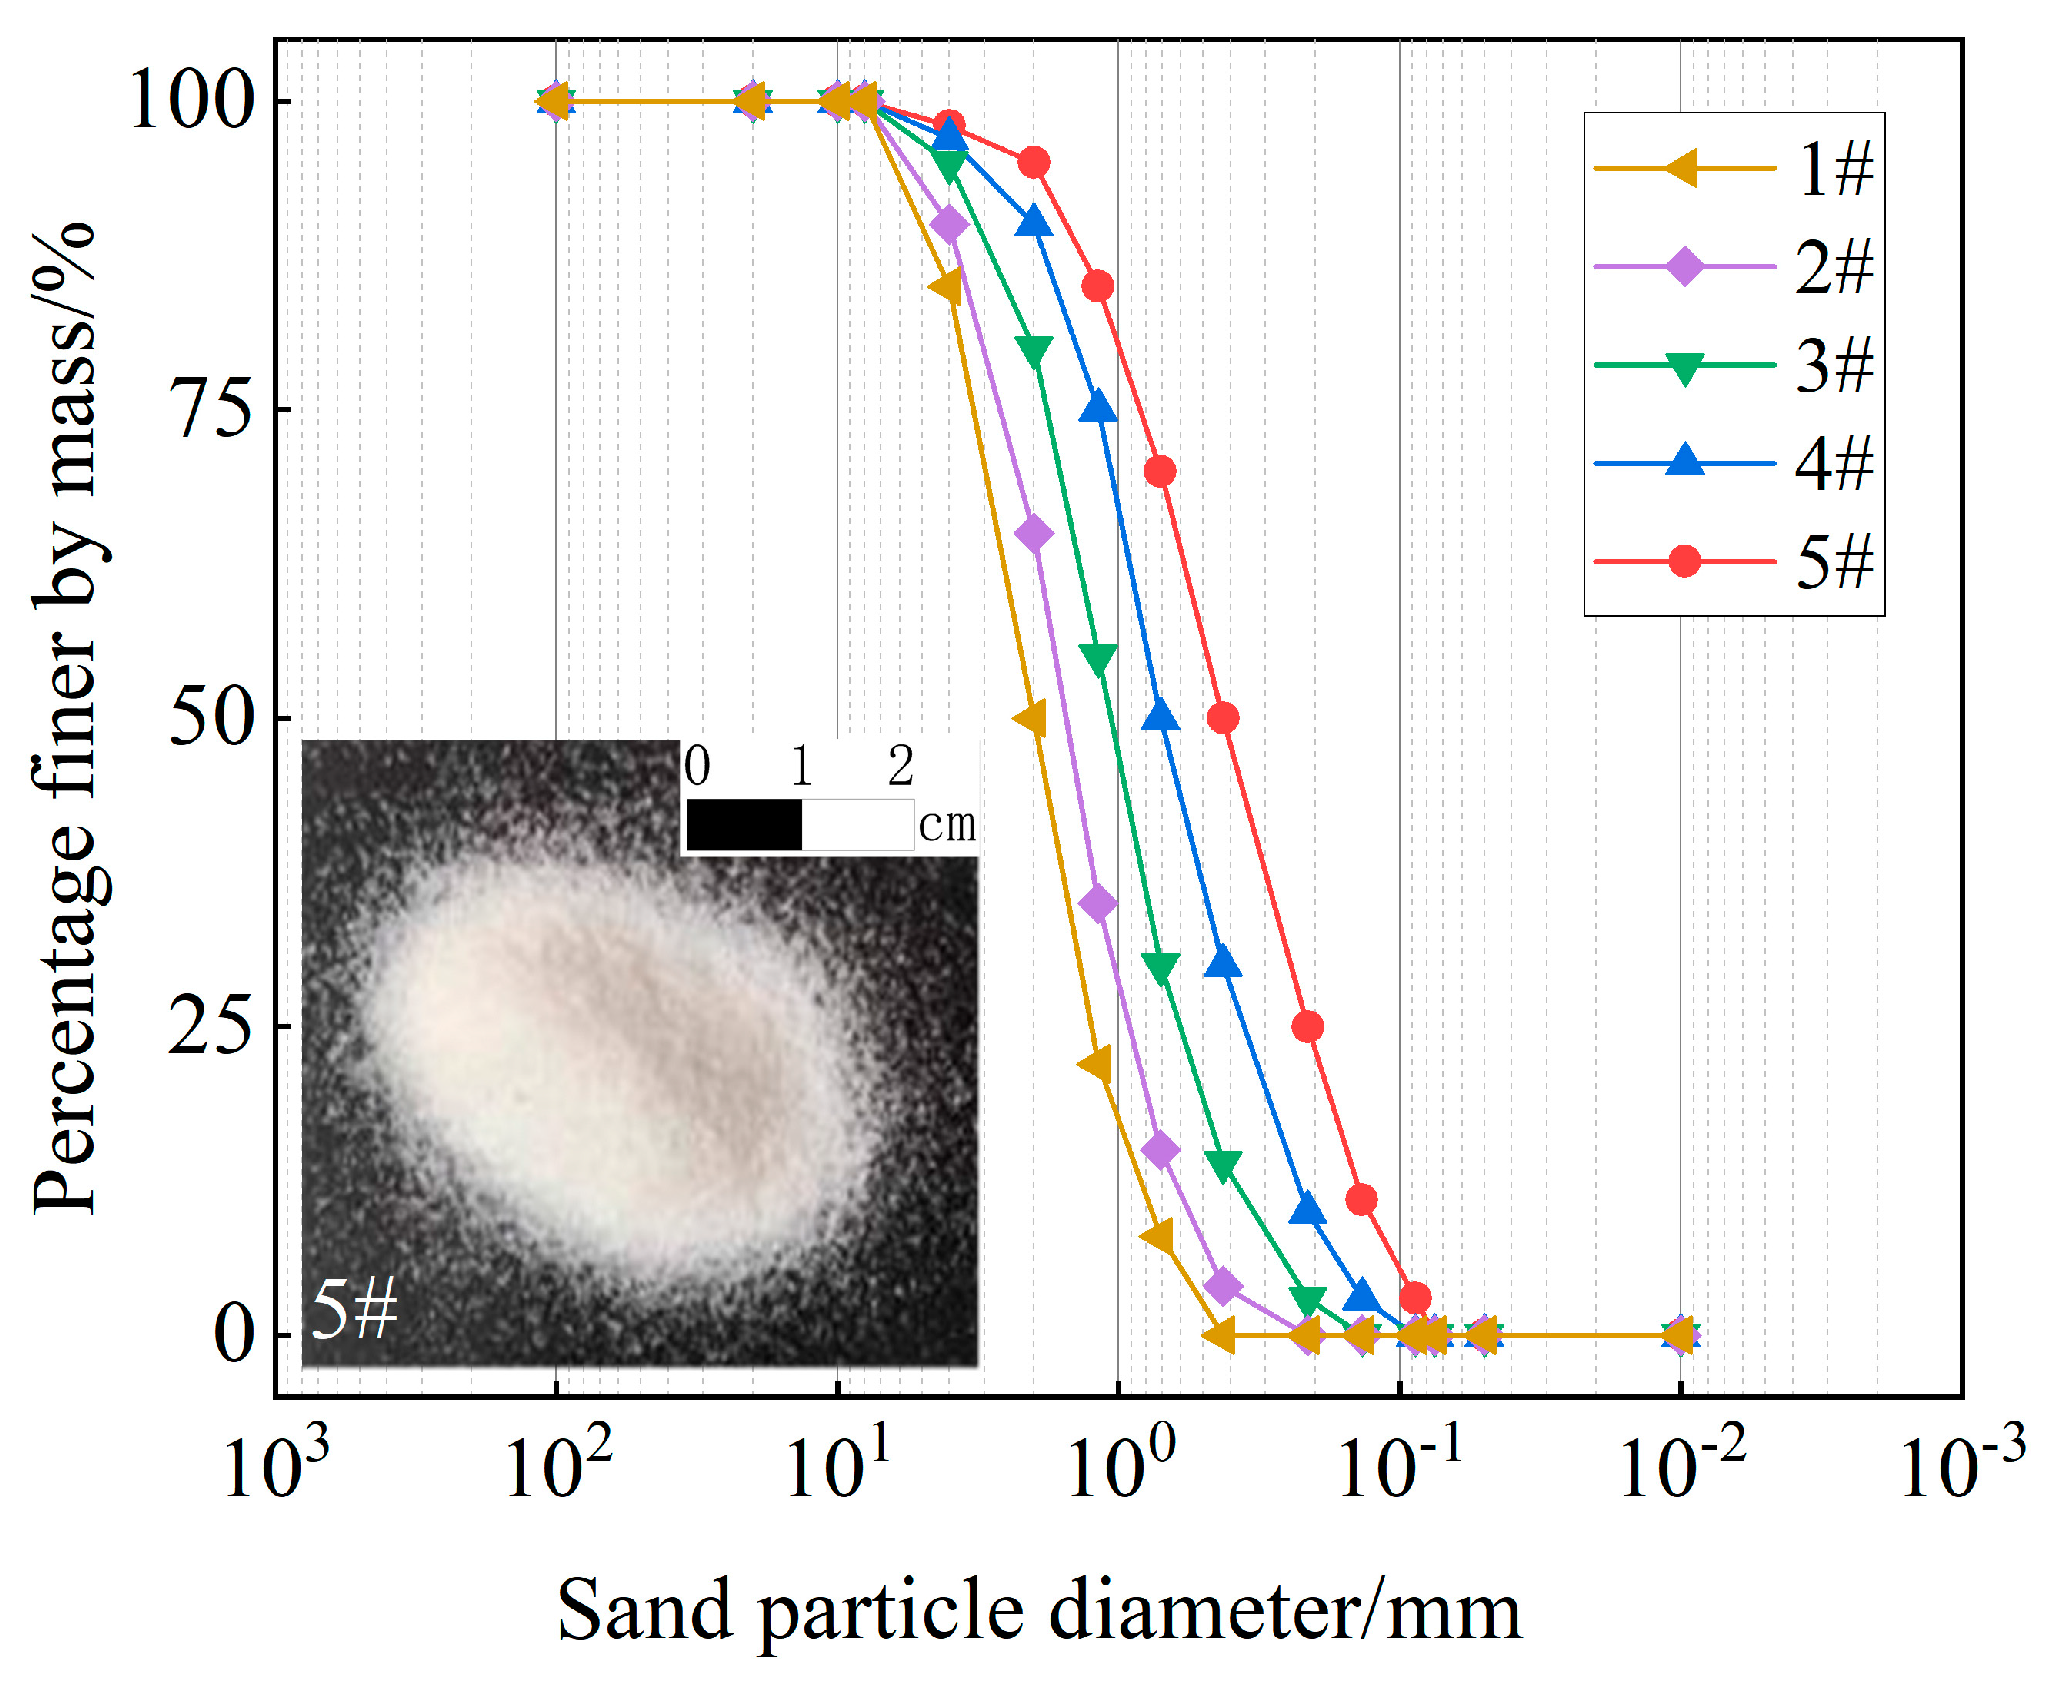
2.1. Experimental Materials

Approximately 20–30 common rock-forming minerals exist in the Earth’s crust, with silicate minerals (e.g., quartz, feldspar, mica) constituting 92% of crustal composition [20]. Considering availability and gradation controllability, high-purity quartz sand was selected as the experimental material. The quartz sand (SiO2 purity: 99.5%) exhibits semitranslucent milky-white coloration and subspherical morphology (Figure 1), with geometrically regular particle shapes across all size fractions to minimize shape-induced permeability artifacts [21].
Based on the established liquefaction resistance hierarchy, coarse sand (1.00–0.50 mm) > medium sand (0.50–0.25 mm) > fine sand (0.25–0.075 mm) > silt (0.075–0.063 mm) [22]—we employed quartz sand spanning 0.08–8.00 mm to systematically observe the full progression of quicksand physical state transitions.
To obtain quartz sand specimens with varying particle gradation, we proportionally blended predetermined percentage fractions of different particle sizes to fabricate five distinct test specimens (Table 1), designated as Specimens 1# through 5#. The particle size distribution curves for all specimens are presented in Figure 1, with median particle diameters (d50) measuring 2.01 mm, 1.59 mm, 1.15 mm, 0.71 mm, and 0.43 mm, respectively.

2.2. Experimental Apparatus

2.2.1. Principle of Design

A self-developed dynamic water seepage testing apparatus was employed to conduct the seepage experiments. The design of this apparatus is based on the principles of effective stress and dynamic water seepage. By continuously monitoring the variation in pore water pressure (u), the corresponding attenuation of effective stress (σ′) can be directly linked. When you approaches the total stress (σ), σ′ tends toward zero, at which point the soil loses its shear strength and quicksand is initiated. Moreover, the device enables dynamic regulation of the hydraulic gradient to induce changes in the seepage field, thereby simulating the dynamic intensification of hydrodynamic pressure observed in real engineering scenarios. The integration of these two mechanisms advances the study of quicksand from a “macroscopic failure description” to a “quantitative analysis of mechanical mechanisms”.
σ′ = σu,
where σ′ is the effective stress, σ is the total stress, and u is the pore water pressure.

2.2.2. Composition of the Testing Apparatus and the Operating Method

A custom-designed hydrodynamic seepage testing system was developed for this investigation, comprising three core components: a water injection unit, a permeameter, and pressure monitoring modules (Figure 2). The water injection unit integrates a heater and a water pump to regulate water temperature and flow rate. The heater maintains water temperature within a preset range throughout the experiment (operational range: 5–50 °C), while the pump adjusts flow via a reflux pipeline and valve system, ensuring stable injection velocities that meet hydrodynamic seepage requirements. As the core component, the permeameter houses the specimen and injects water upward through its basal inlet, simulating subsurface seepage processes to investigate soil permeability (flow direction indicated by arrows in Figure 2). The LZB-WB glass rotameter monitors real-time flow rates (25–250 mL/min range) to maintain target hydrodynamic velocities. SCYG 314 micro-pressure transducers (accuracy: ±0.1% FS) are installed at multiple specimen elevations to track pressure variations during seepage, elucidating physical state transitions during quicksand evolution. All operational parameters are recorded and monitored in real time by the data acquisition system, ensuring data integrity for subsequent analysis.
The operating method of the equipment is as follows: After preparing the quartz sand specimen and placing it in the permeameter chamber, the water injection system is connected, and the inlet valve is opened to allow water to flow into the chamber. The flow rate is adjusted using the control valve and rotameter. The outlet valve is then closed to ensure unidirectional flow through the specimen. During the experiment, pore water pressure is continuously monitored at three vertical positions (bottom, middle, and top) using pressure sensors. The data are logged in real-time to track pressure variations and observe the transition to quicksand behavior under varying water velocities. Once the experiment reaches the desired conditions or duration, both the inlet and outlet valves are closed, and the effluent is collected for measurement.

2.3. Experimental Steps

(1)
Specimen Preparation: Following the methodology of Ren et al. [17] for permeability testing of calcareous sand in island reef reclamation projects, this experiment conducted hydrodynamic seepage tests on quartz sand specimens under identical relative density conditions (Dr = 66%) to simulate natural sandy soil site conditions. The permeameter specimen chamber accommodates cylindrical specimens with a diameter of 60.000 mm and a height of 120.000 mm. A multi-layer loading protocol was implemented, ensuring uniform mass and compaction duration across all layers. Post-loading pressure measurements were acquired synchronously from all sensor tiers.
(2)
Specimen Saturation: The water reservoir of the supply unit was filled with distilled water, with pH effects on quartz sand permeability and quicksand behavior intentionally excluded. The water temperature was thermostatically maintained at 20.0 ± 0.5 °C to simulate typical in-situ sandy soil thermal conditions. Priming Phase: The water injection unit outlet was opened until bubble-free water discharged uniformly, then connected to the permeameter’s inlet. Controlled Saturation: Saturation permeation was conducted at a constant flow rate of 10 mL/min until uniform effluent was observed at the permeameter outlet. Process Monitoring: Multi-elevation pressure measurements (Bottom/Middle/Top) were recorded in real-time throughout saturation.
(3)
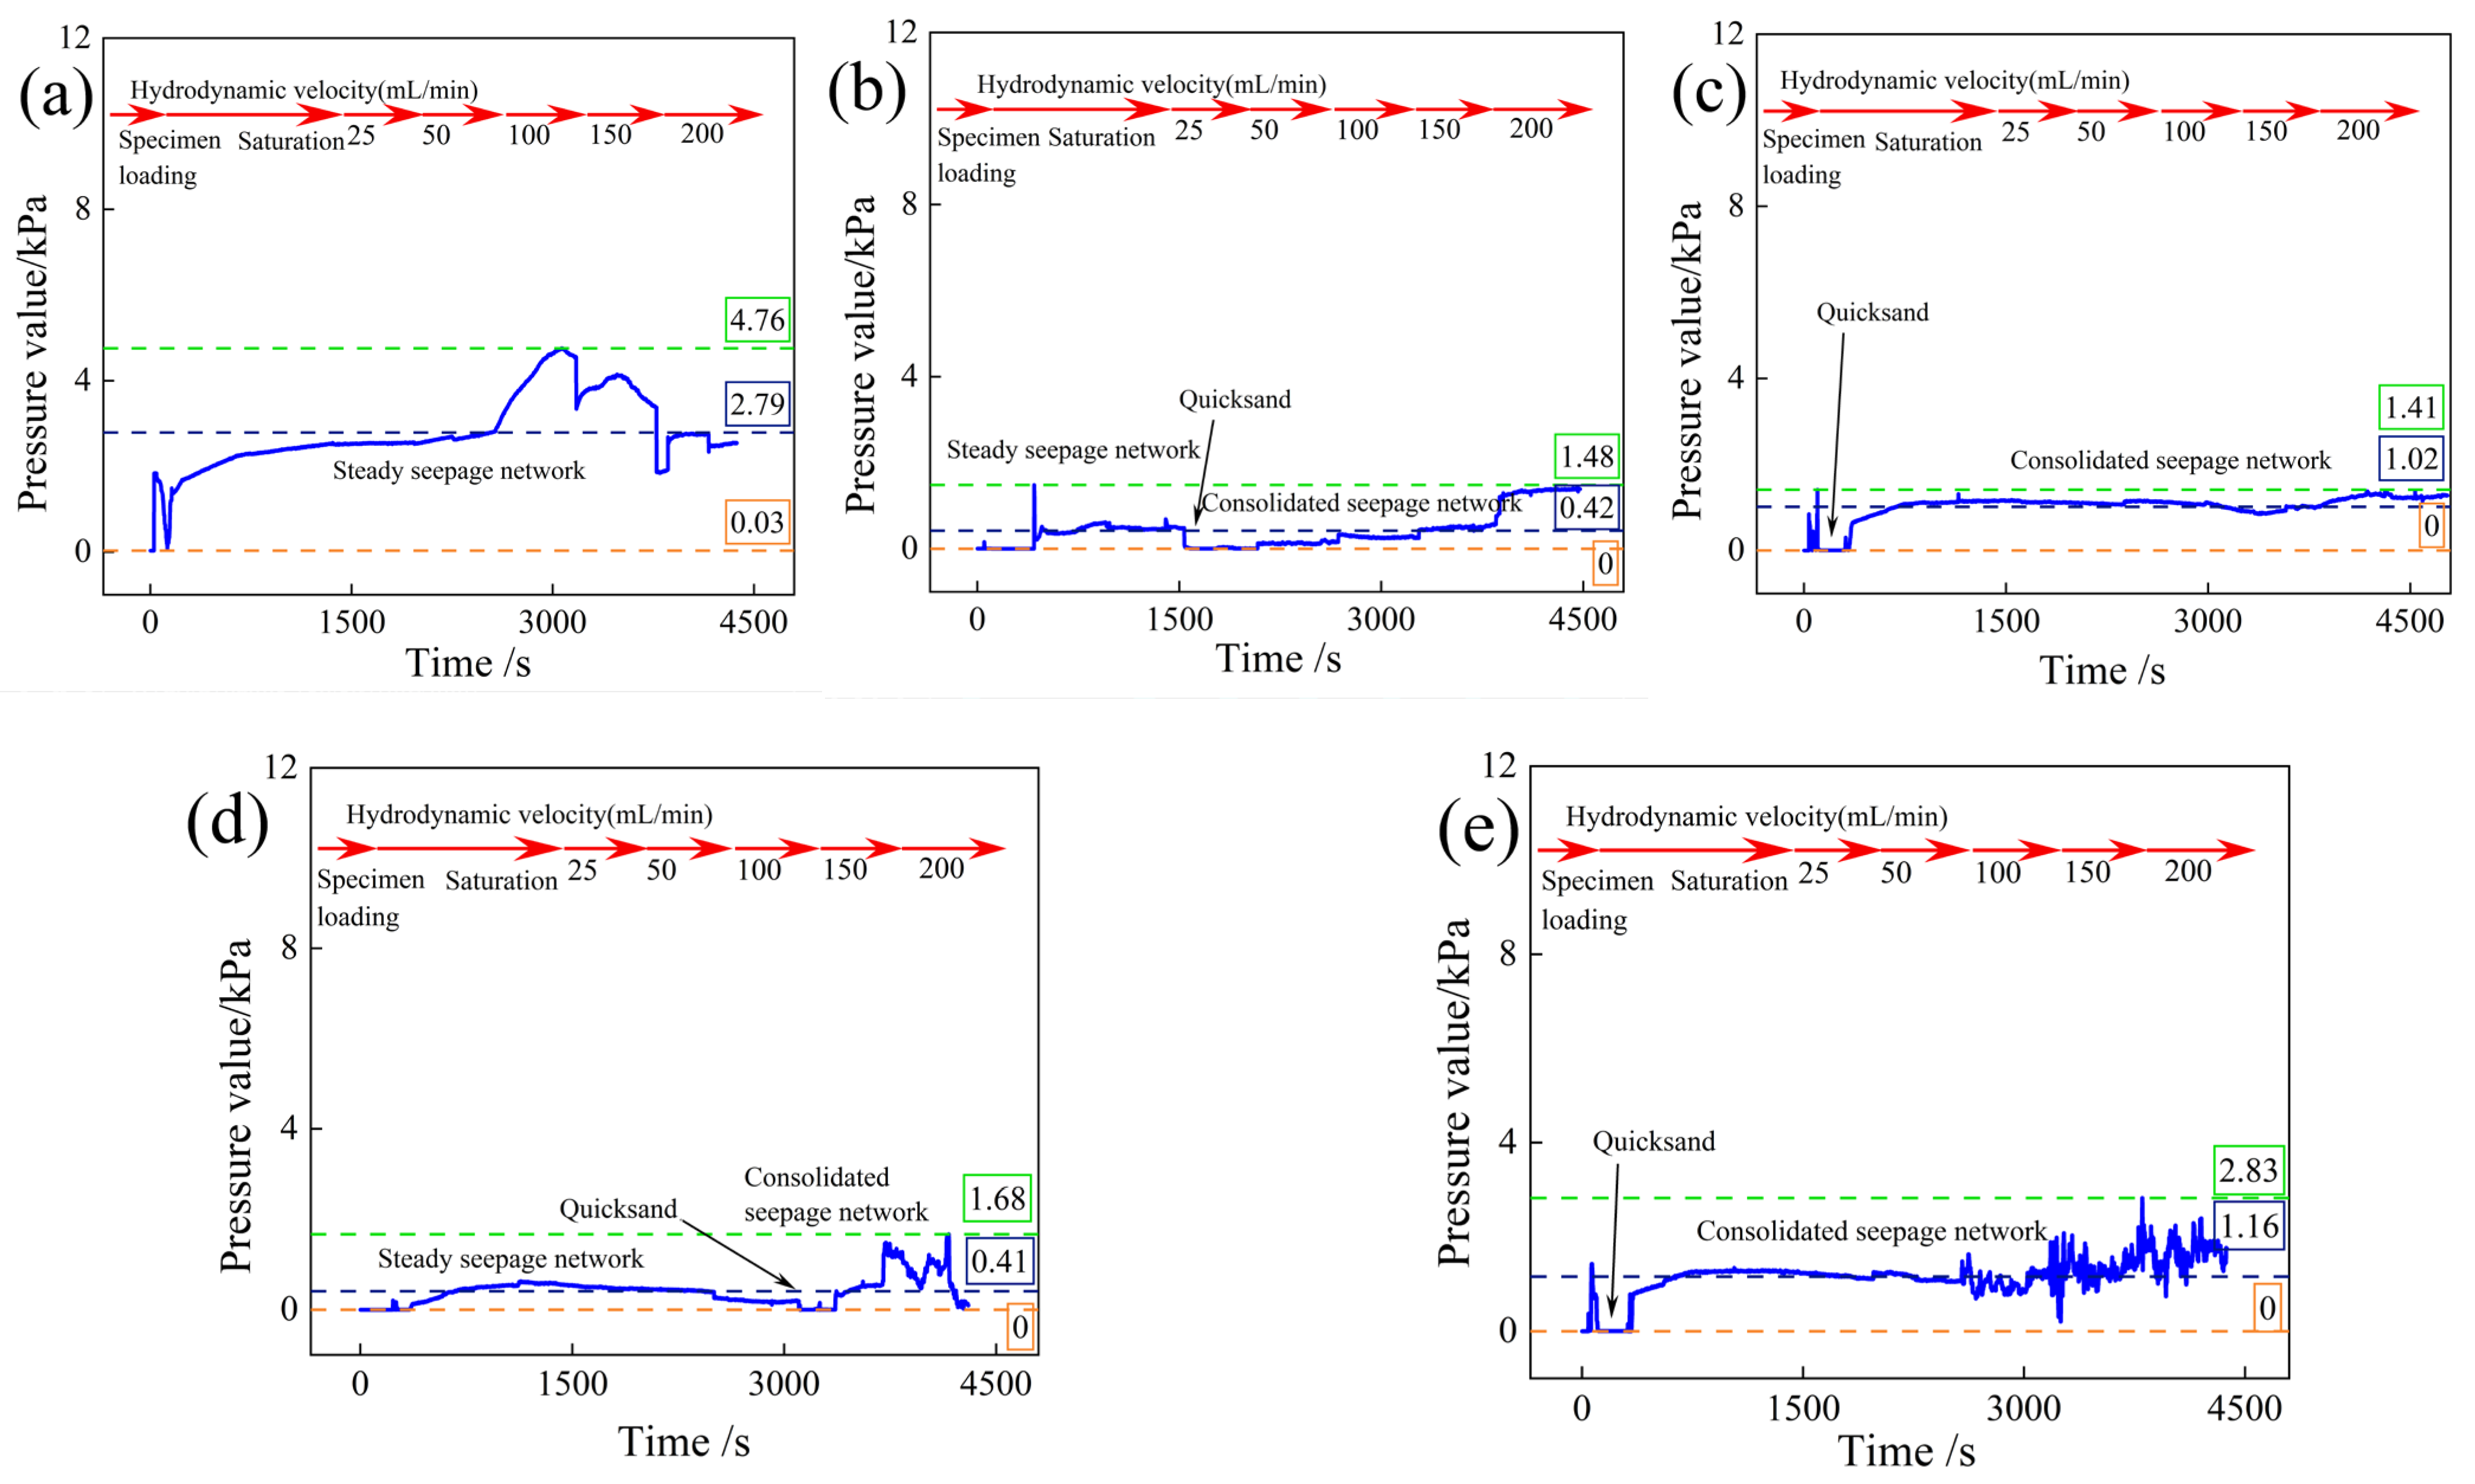
Flow Rate Regulation: This experimental series systematically investigates the permeability characteristics and quicksand evolution processes of quartz sand under varying particle gradation and hydrodynamic velocities. A controlled variable method was strictly implemented to gradually carry out the dynamic water permeability test under the various factor variable conditions, with a detailed experimental matrix provided in Table 2. To simulate the progressive dynamic evolution of hydraulic conditions in actual sandy soil foundation environments and systematically capture the full-process dynamics of quicksand from initiation to instability, each quartz sand specimen is subjected to five consecutive hydrodynamic seepage phases (10 min duration per phase): Low hydrodynamic pressure, initial seepage state → Enhanced hydrodynamic pressure, minor particle migration → Near-critical hydraulic gradient, quicksand precursor → High hydrodynamic pressure, localized quicksand → Extreme conditions, global quicksand initiation. Real-time pressure monitoring across vertical positions (Bottom/Middle/Top) was maintained throughout all permeation stages.
(4)
Seepage Monitoring: During hydrodynamic seepage testing, effluent discharged from the permeameter outlet was systematically collected and volumetrically quantified using graduated cylinders, with separate measurements recorded for each 10-min phase. This effluent volume dataset provides indirect characterization of porosity variation patterns during quicksand evolution in quartz sand specimens.

3. Result

3.1. Permeability Analysis of Quartz Quicksand

Experimental results delineate the permeability variation patterns of quartz sand under distinct particle gradation. The relationship between median particle diameter (d50) and seepage discharge is plotted in Figure 3a. Key findings reveal that seepage discharge remains independent of d50 across all hydrodynamic velocity conditions, indicating minimal influence of median particle size on porosity for the five specimen groups.
To ensure the accurate quantification of the seepage process, the outflow at the top of the permeameter was measured for each sample group under five different water injection rates. This allowed the total seepage for each stage to be determined. Theoretical seepage discharge values were calculated based on hydrodynamic velocity and duration, as shown in Figure 3a. Comparing the actual seepage flow with the theoretical seepage values helps reveal the impact of particle structure reconstruction on the changes in seepage channels while also quantifying the relationship between dynamic water rate and seepage response. The specific details are as follows: Experimental results demonstrate that when the hydrodynamic velocity ranges between 25 and 50 mL/min, interparticle flow resistance causes the actual discharge to be slightly lower than theoretical values. In the 50–150 mL/min range, particle reorganization in the quartz sand specimens accelerates water flow, resulting in actual discharge values that closely match theoretical predictions. At 200 mL/min, the actual discharge of all specimens exceeds theoretical values due to significant particle spatial rearrangement and the combined effects of capillary siphoning in interparticle pores, which collectively increase flow velocity.
Figure 3a clearly demonstrates that the seepage discharge of quartz sand specimens exhibits a marked increase with rising hydrodynamic velocities. The relationship between seepage discharge and hydrodynamic velocity is plotted in Figure 3b, revealing a distinct positive correlation that remains consistent across all particle gradations. This correlation primarily results from the linear, proportional increase in injection rates controlled by the water supply unit. These findings further validate that the median particle diameter (d50), as an indicator of different gradations, has limited influence on permeability characteristics. In civil engineering practice, the use of quartz sand with particle sizes ranging from 0.080 to 8.000 mm for fill applications does not significantly alter permeability behavior, aligning with the performance of natural sandy soil foundations.

3.2. Quicksand Mechanism Analysis

The physical state transition of sandy soils during quicksand formation, specifically, the gradual transformation from a solid to a fluidized state, remains insufficiently characterized. Quicksand behavior is governed by the combined effects of particle gradation and hydrodynamic velocity, with each factor contributing distinct mechanistic influences. Through repeated hydrodynamic seepage experiments grounded in hydrodynamic seepage theory and the effective stress principle, this study analyzes pressure variations recorded by micro-sensors at different elevations under varying flow velocities. Consistent pressure response patterns were observed across all specimen groups.
Quicksand initiation in quartz sand specimens exhibits distinct patterns based on median particle diameter (d50) as a gradation indicator. At the top layer, the specimen with d50 = 2.010 mm (1#) shows fluctuating pressure values over time (Figure 4a), primarily due to particle spatial reorganization induced by hydrodynamic forces acting on particles of varying sizes. These fluctuations stabilize after prolonged constant flow, as particle reorganization ceases and a steady seepage network forms, resulting in stable pressure readings. The specimen with d50 = 1.590 mm (2#) experiences quicksand initiation at 3000 s, lasting approximately 1000 s before stabilizing (Figure 4b). This transient behavior is attributed to ongoing particle reorganization, which eventually establishes a final stable seepage network. For the specimen with d50 = 1.150 mm (3#), quicksand initiates more rapidly under lower flow velocities (Figure 4c). The increased proportion of fine particles reduces quicksand resistance, yet a stable seepage network ultimately forms. The specimen with d50 = 0.710 mm (4#) also exhibits rapid quicksand initiation under low flow rates (Figure 4d). However, its higher fines content results in only a metastable seepage network, which fails completely under elevated flow velocities. The specimen with d50 = 0.430 mm (5#) forms a briefly metastable network (Figure 4e), with early-stage quicksand failure due to its limited stability. Experimental observations demonstrate that particle gradation governs the susceptibility of quartz sand specimens to quicksand initiation, while hydrodynamic velocity determines the timing and rate of quicksand occurrence.
Due to the occurrence of complete quicksand failure at the top layer, the pressure variation trends during specimen loading and permeation were further analyzed, as shown in Figure 4f. The maximum pressure values consistently occur during the loading and initial saturation phases, independent of gradation variations, thereby validating the accuracy of the specimen preparation protocol described in Section 2.3. The average pressure values decrease progressively with reductions in median particle diameter (d50), indirectly indicating a critical average pressure of 1.77 kPa for complete quicksand initiation in quartz sand. The minimum pressure values remain near 0 kPa, confirming the proper functioning of the pressure sensors and further verifying the reliability of the newly developed experimental apparatus.
Further investigation of quicksand evolution at the middle layer reveals behavioral patterns. The specimen with d50 = 2.010 mm (1#) exhibits only particle spatial reorganization during permeation, forming a steady seepage network without quicksand initiation (Figure 5a). In contrast, the specimen with d50 = 1.590 mm (2#) experiences quicksand at 1500 s (Figure 5b), occurring 300 s earlier than at the top layer due to temporal lag effects caused by vertical position differences, followed by stabilization into a consolidated seepage network. Similar lag behavior is observed in the d50 = 1.150 mm specimen (3#, Figure 5c). Anomalously, the d50 = 0.710 mm specimen (4#, Figure 5d) demonstrates delayed quicksand initiation compared to the top layer, attributed to experimental stochasticity, though rapid network consolidation ensues. The d50 = 0.430 mm specimen (5#, Figure 5e) confirms the inverse correlation between particle size and initiation timing, exhibiting early-stage failure. The absence of complete quicksand at the middle layer is attributed to the elevated overburden pressure at this elevation, which prevents quartz sand particles from entering a suspended state. As a result, the quartz sand at this layer remains in either a steady seepage network or a consolidated seepage network throughout the testing process.
Further investigation of quicksand evolution at the bottom layer reveals that no quicksand phenomena occur regardless of variations in median particle diameter (d50), as shown in Figure 6. This finding further confirms the reason for the absence of complete quicksand in specimens with d50 < 0.710 mm at the middle layer: excessive overburden pressure prevents quicksand initiation even at critical median particle diameters (d50). In summary, based on the vertical positioning of micro-sensors across different elevations, the quicksand thickness under coupled gradation and hydrodynamic velocity conditions is estimated to be approximately 60.000 mm.

4. Discussion

Soil is a three-phase system composed of solid particles, liquid water, and gas [23]. As a common natural soil type, sandy soil is highly susceptible to quicksand geohazards. Based on experimental results and theoretical analysis, the quicksand evolution process can be categorized into three distinct stages: self-consolidation, reorganization, and quicksand initiation. During the experiment, the self-developed dynamic water infiltration test apparatus, in conjunction with miniature pressure sensors, accurately monitored pore pressure variations at different depths, ensuring high precision and reliability of the data. Notably, under varying dynamic water velocities and particle gradation conditions, the equipment demonstrated excellent stability and consistency, providing a robust experimental foundation for investigating the physical mechanisms of quicksand state transitions. Integrating the findings with the visualized numerical simulations by Mansouri et al. [3], a schematic diagram of the quicksand evolution process is presented in Figure 7.
(1)
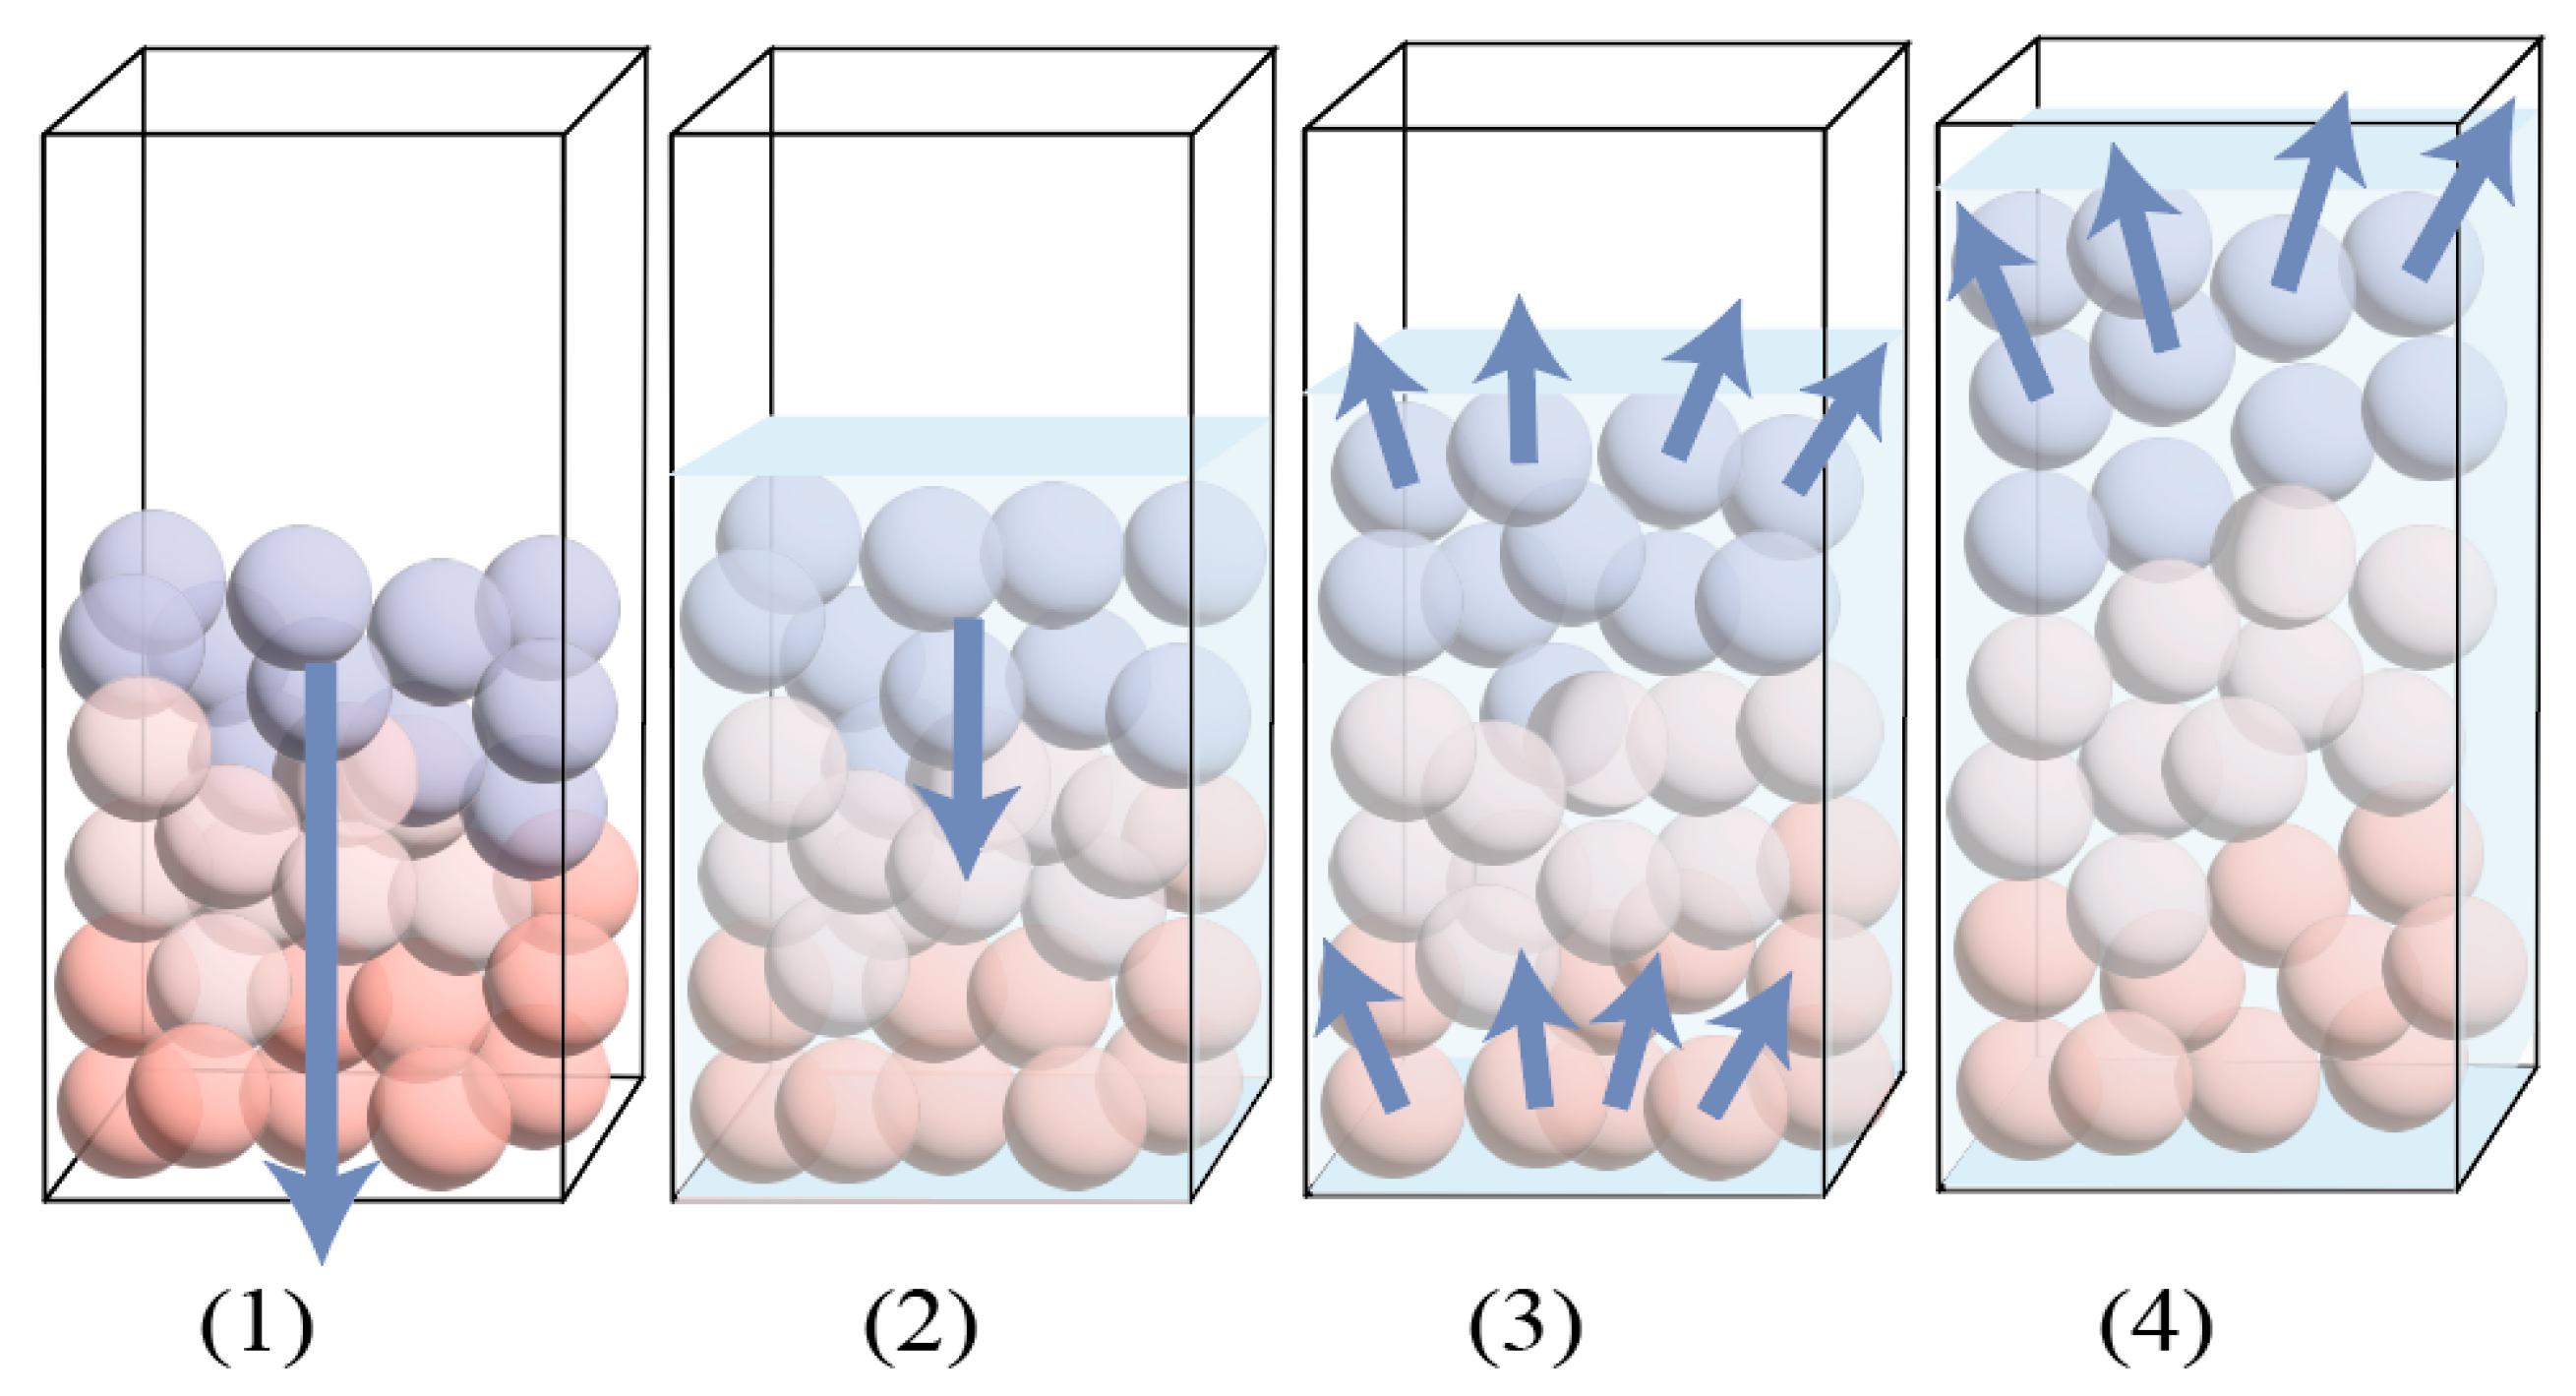
Self-Consolidation Stage:
During natural geological formation, sandy soils primarily composed of quartz sand, along with partial clay and fine particles, develop a tightly bound structure through processes such as geological sedimentation, crystalline salt cementation, and human engineering activities. This results in a stable, consolidated state. In this experiment, artificial consolidation was employed to establish the initial stable consolidation state of the quartz sand.
(2)
Reorganization Stage:
When subjected to seismic activity or rising groundwater levels, water infiltrates through the pores between solid particles in sandy soil, dissolving crystalline salts. Within the experimental variable range, the seepage discharge is primarily controlled by the water supply unit (Figure 2). The influx of water triggers spatial reorganization of solid particles, altering porosity and increasing seepage discharge (Figure 3). This process disrupts the stable consolidation state, transitioning the quartz sand specimen into a steady seepage network. Under sustained water infiltration and within specific ranges of gradation and hydrodynamic velocity, sandy soil may exhibit transient quicksand behavior, eventually re-establishing a consolidated seepage network and entering a pseudo-”self-consolidation” stage.
(3)
Quicksand Stage:
As pore water pressure progressively increases, the consolidated seepage network undergoes destabilization, reverting sandy soil to the reorganization stage. This marks the beginning of a cyclic interplay between the self-consolidation and reorganization stages, which remains confined within specific operational limits (Figure 5 and Figure 6). Complete quicksand initiation is contingent upon the simultaneous fulfillment of three critical conditions: a defined depth range, specific gradation characteristics, and adequate hydrodynamic pressure (Figure 4). Notably, in loose sandy soils, the hydrodynamic pressure required to trigger initial quicksand may fall below theoretical thresholds, whereas in dense sands, it often exceeds these values [24]. In this experiment, the quartz sand exhibited a moderate relative density, and the hydrodynamic pressure necessary for quicksand initiation aligned closely with theoretical predictions, demonstrating the precision of the experimental design.
The occurrence of quicksand is primarily characterized by reductions in viscosity and internal friction angle [25]. Engineering structures located within or near quicksand-prone sandy soil layers are subject to varying degrees of impact. In summary, the self-developed apparatus successfully reveals the staged evolution and physical mechanisms of quartz quicksand under controlled hydrodynamic conditions. However, the current system remains limited by its small scale, inability to simulate seismic-induced pore pressure buildup, and lack of visual monitoring, all of which constrain its capacity to fully replicate, monitor, and interpret the complex in-situ mechanisms of quicksand initiation and development. Preventing quicksand initiation and mitigating its effects on engineering projects remain critical scientific challenges requiring ongoing exploration [26].

5. Conclusions

This study investigated the effects of particle gradation and dynamic water velocity on the evolution of quartz quicksand using a self-developed dynamic water infiltration test apparatus. The key findings of the study are as follows:
(1)
The infiltration rate of quartz sand samples was found to be minimally affected by particle gradation (d50) and strongly influenced by dynamic water velocity. A positive correlation was observed between infiltration rate and water velocity, with infiltration increasing as the velocity increased.
(2)
Particle gradation determined the potential for quicksand formation in the quartz sand samples, with a median particle size (d50) of 0.710 mm marking the threshold for quicksand occurrence. The dynamic water velocity controlled the timing of quicksand initiation, with an approximate quicksand thickness of 60 mm observed.
(3)
The evolution of quicksand occurred in three stages: “self-consolidation”, “reconstruction”, and “quicksand”. Both particle gradation and dynamic water velocity significantly impacted the “reconstruction” stage and determined whether the sample transitioned into the “quicksand” stage.

Author Contributions

Conceptualization, J.L. and Z.Y.; Data curation, K.Z.; Formal analysis, R.D. and H.W.; Funding acquisition, J.L.; Investigation, R.D.; Methodology, Z.Y. and H.W.; Project administration, K.Z. and Z.Y.; Resources, J.L.; Software, H.W.; Supervision, J.L.; Validation, R.D. and Z.Y.; Visualization, H.W. and R.D.; Writing—original draft preparation, K.Z.; Writing—review and editing, J.L. and R.D. All authors have read and agreed to the published version of the manuscript.

Funding

This research was funded by the Science and Technology Department of Shanxi Province, grant number 202103021224112.

Institutional Review Board Statement

Not applicable.

Informed Consent Statement

Not applicable.

Data Availability Statement

Data generated or analyzed during the study are available from the corresponding author by request.

Acknowledgments

The authors would like to thank the reviewers, the experts and the editors for their serious and constructive comments.

Conflicts of Interest

The authors declare no conflicts of interest.

References

  1. Meng, Q.B.; Han, L.J.; Shi, J.R.; Liu, Z.J.; Lu, T.; Li, X.Y.; Shi, G.P. Study and application of construction technology for inclined shafts penetratingdrift sand strata in coal mine. Acta Geotech. 2015, 35, 900–910. [Google Scholar]
  2. Wang, K.W.; Gao, G.Y.; Yue, Z.Q.; Zhang, X.L. Study on risk assessment and division of quicksand in Shanghai. J. Eng. Geol. 2013, 21, 950–958. [Google Scholar]
  3. Mansouri, M.; Youssoufi, M.S.E.L.; Nicot, F. Numerical simulation of the quicksand phenomenon by a 3D coupled Discrete Element—Lattice Boltzmann hydromechanical model. Int. J. Numer. Anal. Methods 2017, 41, 338–358. [Google Scholar] [CrossRef]
  4. John, J. Conceptualmodels for describing the liquefaction and resolidification of quicksand One-dimensional vertical behavior of a saturated, loosely packed soil column. Grundwasser 2019, 24, 145–158. [Google Scholar] [CrossRef]
  5. Editorial Committee of Engineering Geology Manual. Engineering Geology Handbook, 3rd ed.; China Architecture & Building Press: Beijing, China, 2007. [Google Scholar]
  6. Gao, G.Y.; Yao, S.F.; Cui, Y.J.; Chen, Q.S.; Zhang, X.L.; Wang, K.W. Zoning of confined aquifers inrush and quicksand in Shanghai region. NHESS 2018, 91, 1341–1363. [Google Scholar] [CrossRef]
  7. Liu, H.L. Soil dynamics and geotechnical seismic engineering. In Proceedings of the 9th Conference on Soil Mechanics and Geotechnical Engineering of the Chinese Society of Civil Engineering (Volume I), Beijing, China, 1 October 2003. [Google Scholar]
  8. Sasaki, Y.; Towhata, I.; Tokida, K.I.; Yamada, K.; Matsumoto, H.; Tamari, Y.; Saya, S. Mechanism of permanent displacement of ground caused by seismic liquefaction. Soils Found. 1992, 32, 79–96. [Google Scholar] [CrossRef] [PubMed]
  9. Dashti, S.; Bray, J.D. Numerical simulation of building response on liquefiable sand. J. Geotech. Geoenviron. Eng. 2012, 139, 1235–1249. [Google Scholar] [CrossRef]
  10. Arulanadan, K.; Sybico, J. Post-liquefaction settlement of sands. In Proceedings of the Predictive Soil Mechanics: Proceedings of the Wroth Memorial Symposium Held at St. Catherine’s College, Oxford, UK, 27–29 July 1992; pp. 94–110. [Google Scholar]
  11. Xenaki, V.C.; Athanasopoulos, G.A. Liquefaction resistance of sand-silt mixtures: An experimental investigation of the effect of fines. Soil Dyn. Earthq. Eng. 2003, 23, 183–194. [Google Scholar] [CrossRef]
  12. Li, T.; Tang, X.W. Experimental study on effect of coexistence of clay and silt on static and dynamic liquefaction of sand. Acta Geotech. 2019, 41, 169–172. [Google Scholar]
  13. Zhang, X.L.; Li, X.Y.; Du, X.L. Hyperbolic model for estimating liquefaction potential of sand considering the influences of fine grains. Acta Geotech. 2021, 43, 448–455. [Google Scholar]
  14. Wang, N. Dynamic Triaxial Experiment of the Influence of Diameter and Gradation to Coastal Sandy Liquefaction. Master’s Thesis, Ocean University of China, Qingdao, China, 2015. [Google Scholar]
  15. Xu, Y.F.; Lan, S.Q.; Sun, D.A.; Xia, X.H.; Yang, H.J.; Xiao, Z.Y.; Wang, J.H. New apparatus for measurement of stress effect onpermrability of unsatuarted soil. Chin. J. Rock. Mech. Eng. 2005, 1, 160–164. [Google Scholar]
  16. Wang, B.Z.; Wang, Q.C.; Zhang, R.L.; Xue, Y.J.; Cui, X.N. An experimental study of the permeability of undisturbed and remoldedmudstones under the loading condition. Hydrogeol. Eng. Geol. 2019, 46, 123–128. [Google Scholar]
  17. Gao, Z.J.; Ding, Z.Q.; Liu, J.T.; Liu, W.Y. Experimental study on the influencing factors of permeability of sand media. Hydrogeol. Eng. Geol. 2024, 51, 8–17. [Google Scholar]
  18. Miao, F.; Zhao, F.C.; Wu, Y.P.; Li, L.W.; Xue, Y.; Meng, J.J. A novel seepage device and ring-shear test on slip zone soils of landslide in the Three Gorges Reservoir area. Eng. Geol. 2022, 307, 06–779. [Google Scholar] [CrossRef]
  19. Li, B.; Ju, Y.J.; Song, B.; Zhang, K.D.; Hao, J.F. Study on the effect of fissures in expansive soils on permeability andengineering effects of canal slopes. Chin. J. Geol. Hazard Control 2024, 35, 137–144. [Google Scholar]
  20. Shu, L.S. Physical Geology, 3rd ed.; Geology Press: Beijing, China, 2008. [Google Scholar]
  21. Goktepe, A.B.; Sezer, A. Effect of particle shape on density and permeability of sands. P I Civ. Eng-Geotec 2010, 163, 307–320. [Google Scholar] [CrossRef]
  22. Ren, Y.B.; Wang, Y.; Yang, Q. Effects of particle size distribution and shape on permeability of calcareous sand. RSM 2018, 39, 491–497. [Google Scholar]
  23. Zhang, K.G.; Liu, S.Y. Soil Mechanics, 3rd ed.; China Construction Industry Press: Beijing, China, 2010. [Google Scholar]
  24. Khaldoun, A.; Eisre, E.; Wegdam, G.H.; Bonn, D. Liquefaction of quicksand under stress—A person trapped in salt-lake quicksand is not in any danger of being sucked under completely. Nature 2005, 437, 635. [Google Scholar] [CrossRef] [PubMed]
  25. Koltuk, S.; Fernandez-Steeger, T.M.; Azzam, R. Investigations on hydraulic heave in foundation pits excavated in homogeneous soils. Grundwasser 2016, 21, 203–215. [Google Scholar] [CrossRef]
  26. Zhang, G.M.; Zhang, K.; Wang, L.J.; Wu, Y. Mechanism of water inrush and quicksand movement induced by a borehole and measures for prevention and remediation. Bull. Eng. Geol. Environ. 2015, 74, 1395–1405. [Google Scholar] [CrossRef]
Figure 1. Particle size distribution curve of quartz sand samples.
Applsci 15 06415 g001
Figure 2. Installation of dynamic water infiltration test device and monitoring element.
Applsci 15 06415 g002
Figure 3. Infiltration characteristics of quartz sand with different particle gradation.
Applsci 15 06415 g003
Figure 4. Sensor pressure values at Top height positions of quartz sand samples: (a) Specimen 1# (d50 = 2.010 mm); (b) Specimen 2# (d50 = 1.590 mm); (c) Specimen 3# (d50 = 1.150 mm); (d) Specimen 4# (d50 = 0.710 mm); (e) Specimen 5# (d50 = 0.430 mm); (f) Pressure variation summary during loading and permeation.
Applsci 15 06415 g004
Figure 5. Sensor pressure values at middle height positions of quartz sand samples: (a) Specimen 1# (d50 = 2.010 mm); (b) Specimen 2# (d50 = 1.590 mm); (c) Specimen 3# (d50 = 1.150 mm); (d) Specimen 4# (d50 = 0.710 mm); (e) Specimen 5# (d50 = 0.430 mm).
Applsci 15 06415 g005
Figure 6. Sensor pressure values at Bottom height positions of quartz sand samples: (a) Specimen 1# (d50 = 2.010 mm); (b) Specimen 2# (d50 = 1.590 mm); (c) Specimen 3# (d50 = 1.150 mm); (d) Specimen 4# (d50 = 0.710 mm); (e) Specimen 5# (d50 = 0.430 mm).
Applsci 15 06415 g006
Figure 7. Mechanism stage of quicksand of quartz sand [3]: (1) initial deposition state; (2,3) grain space reconstruction; (4) quicksand.
Applsci 15 06415 g007
Table 1. Percentage of grain size of each group of quartz sand samples.
Specimen NumberPercentage Content by Particle Size/%
0.08–0.090.09–0.140.14–0.210.21–0.430.43–0.710.71–1.181.18–2.002.00–4.004.00–8.00
1#0000814283515
2#00041120302510
3#00311162525155
4#0372020251583
5#38142520151052
Table 2. Design of water injection rates for various groups of quartz sands with different gradations.
Specimen NumberWater Injection Rate/(mL·min−1)Water Temperature/°C
Stage 1Stage 2Stage 3Stage 4Stage 5
1#255010015020020
2#2550100150200
3#2550100150200
4#2550100150200
5#2550100150200
Disclaimer/Publisher’s Note: The statements, opinions and data contained in all publications are solely those of the individual author(s) and contributor(s) and not of MDPI and/or the editor(s). MDPI and/or the editor(s) disclaim responsibility for any injury to people or property resulting from any ideas, methods, instructions or products referred to in the content.

