1. Introduction
1.1. Motivation and Context of Air Traffic Control Automation
The ATM industry is undergoing continuous integration of novel developments in line with global industry standards. This evolution is essential for maintaining and enhancing the safety, efficiency, and reliability of air traffic operations worldwide.
Air traffic differs fundamentally from other transportation modes, such as rail transportation with the lack of safe, low-kinetic-energy states. While automation in railway traffic control has advanced to a level where human intervention is no longer necessary to maintain system safety, certain scenarios—such as level-crossings—still require human judgement [
1].
In contrast, the human element in ATM remains a critical component. Large-scale initiatives like NextGen in the United States [
2] and SESAR Joint Undertaking in Europe [
3] have been launched to explore opportunities for ATM automation. Many SESAR solutions aim to reduce costs and improve capacity—through, for example, optimized information sharing [
4] or implementing of Deep Learning technologies [
5]—as the use of AI is one of the most actively researched areas in ATM [
6]. Despite these advancements, enhancing safety remains one of the key goals.
Although automation solutions increasingly address various ATC functions, human operations continue to play a key role. For instance, the AUTOPACE project assessed hazard and risk in two future ATC scenarios with varying levels of automation [
7]. As ATC automation evolves, researchers, industry stakeholders, and policymakers require robust simulation environments to evaluate the implications of new technologies, regulations, and procedures.
Section 1.2 provides an overview of simulation tools designed specifically for ATM applications.
Realistic and flexible simulation frameworks rely heavily on the use of real-world trajectory data, which is a key point not only in the air traffic domain, but many other domains of the transportation sector, so here we give a few examples of valuable research. Chen et al. [
8] successfully applied high-resolution data to study lane-changing behavior in ground traffic systems, identifying key trajectory points based on lateral displacement thresholds. This method offers valuable insights that can be adapted to the modeling of air traffic flows, where capturing dynamic movement is equally important.
A different approach comes from the maritime domain, where Chen et al. [
9] introduced an A*-guided Double Deep Q-Network. By combining heuristic path planning with reinforcement learning, their model was able to identify optimal routes under changing environmental conditions. Building on the idea of intelligent learning, Balogh et al. [
10] developed a sample prioritization strategy for supervised learning, helping the model focus on the most informative data to improve classification accuracy.
In a complementary direction, Rodríguez and Díaz Olariaga [
11] applied a Bayesian Structural Time Series model to better understand how system dynamics evolve over time. Their work highlights the value of probabilistic modeling in uncovering structural changes and temporal patterns. Taken together, these studies demonstrate the potential of combining data-driven learning with domain-specific insights to improve the performance and adaptability of transportation models.
1.2. Review of Existing Air Traffic Simulation Environments
A variety of simulation tools have been developed to support ATM research, enabling the evaluation of new technologies, procedures, and policies under realistic conditions.
BlueSky [
12] is an open-source, multi-platform simulation tool designed to facilitate the comparison of ATM research concepts with each other, rather than solely against the current operational state. Its development was driven by the need for high-fidelity simulations without reliance on proprietary data and to promote community adoption through a user-friendly interface. BlueSky focuses on agent-based simulation and modeling and is easily modifiable and operable on simple systems. It operates based on scenarios that can be preloaded with time-stamped commands, but in this system commands can be issued dynamically during execution. AirTrafficSim [
13] is another open-source, web-based simulation platform that enables microscopic analysis of air traffic movements. It supports visualization of historical data and performance evaluation of user-defined ATC algorithms. AirTrafficSim integrates weather data and provides an API for external aircraft control, supporting diverse ATM research areas such as conflict resolution, route optimization, and contingency management. The simulation mimics an autopilot system that follows a predefined flight plan while dynamically adopting ATC instructions including non-standard directives such as vectoring and holding. By computing aircraft performance metrics (e.g., fuel consumption, speed) at each time step, the system enables a detailed analysis of the impact of user-defined control algorithms on overall traffic flow. CASSIOPEIA [
14], developed within the SESAR program, uses an agent-based modeling approach to represent the socio-technical complexity of ATM. It simulates interactions among stakeholders—such as network managers, airlines, airports, and aircraft—based on their goals, beliefs, and decision-making processes. This framework supports policymakers in evaluating the potential implications of future concepts and regulatory measures. The ELSA project [
15] also adopts an agent-based approach, featuring agents such as aircraft operators, network managers, pilots, and controllers. It offers an open-source simulation environment focused on trajectory management. The network is modeled as a graph of navigation points. During the strategic phase, trajectories are de-conflicted by adjusting take-off times; in the tactical phase, conflicts are monitored and resolved dynamically, including directions based on sector capacities. Special conditions, such as the activation of Temporarily Restricted Areas or weather disruption are also incorporated. ELSA’s modular architecture allows for independent use of its components and is accessible for the research community to use and modify. The model was used to assess the impact of future SESAR scenarios [
15]. FACET [
16], developed by NASA Ames Research Center, aims to help researchers and service providers increase airspace capacity and flexibility by simulating and analyzing aircraft trajectories in the U.S. National Airspace System. It has been used to study concepts such as Distributed Air/Ground Traffic Management, advanced Air Traffic Flow Management, and new Decision Support Tools. FACET models en-route aircraft trajectories using kinematic equations considering both aircraft type performance and weather conditions. DYNAMO [
17], developed by the Universitat Politècnica de Catalunya, is a cloud-based simulation tool designed for 4D trajectory optimization. It is free to use and generates optimized flight trajectories by considering constraints related to aircraft operations, flight procedures, time, fuel, operating costs, and air navigation charges. Finally, AdAS [
18] is a hybrid gate-to-gate simulation framework focused on both landside and airside traffic flow, aiming to improve understanding of the operational dynamics of the European air traffic network.
EUROCONTROL provides a suite of simulation and validation tools free of charge for its Member States. One such tool is NEST [
19], a scenario-based platform available to registered users from ANSPs and the Network Manager. NEST allows users to access and analyze both historical and forecasted traffic data through filtering and visualization functionalities. While it primarily supports the design and capacity planning of European airspace, an enhanced version, R-NEST [
20], extends these capabilities to support research and innovation related to future ATM concepts. R-NEST enables network-level simulations and integrates SESAR future solutions, including 4D trajectory management (based on BADA), and the Integrated Advanced Emission Model for environmental sustainability assessments. For example, R-NEST was employed in the SIMBAD [
21] project, a SESAR Joint Undertaking initiative that explored how machine learning techniques could reduce the computational load associated with high-level performance analysis in macrosimulations of emerging ATM technologies. Another EUROCONTROL tool, eDEP [
22], is a lightweight real-time simulation environment intended for rapid ATM prototyping. It is particularly well suited for small-scale studies, such as human factor assessments, and supports both tower and en-route control scenarios. eDEP also features automated workspaces and can interoperate with its heavier version, ESCAPE [
23], which is a more comprehensive simulation platform designed for large-scale research, operational validation, and ATCO training. In addition, BADA [
24], developed by EUROCONTROL, is an aircraft performance model widely used in ATM systems. BADA uses a kinetic modeling approach to represent aircraft dynamics across a wide range of types, making it highly suitable for trajectory simulation and prediction. The model consists of a set of ASCII files containing operational performance parameters, airline procedures, and performance summary tables for over 300 aircraft types. Although access to BADA is license-restricted, it is provided free of charge. Many previously mentioned simulators—AirTrafficSim, BlueSky, DYNAMO, eDEP, and ESCAPE—utilize data from BADA for aircraft performance modeling.
Table 1 provides a comparative overview of the simulation environments discussed.
1.3. Identified Gaps in Current Simulation Frameworks
Our review of the literature has highlighted several important gaps in existing air traffic simulation frameworks:
Integrating Traffic Simulation with Real-World Traffic Data: Although many simulation environments can generate detailed outputs such as four-dimensional trajectories, integrating these simulations with real-world traffic data remains a challenge. A key issue lies in the reliance on flight plan data (such as ELSA, using flight plan inputs), which is subject to licensing restrictions. These limitations reduce accessibility and hinder real-time applicability. Moreover, using historical trajectory data as input is problematic because such trajectories typically reflect air traffic control interventions already made during those flights. As a result, they do not represent the unaltered, nominal flight paths, making them unsuitable for simulations that aim to model or test the impact of control actions.
Lack of Well-Defined Interfaces for Algorithm Integration: Many simulation environments offer limited flexibility for development and algorithm modification. Even when the source code is publicly available, these platforms may lack clearly defined interfaces for incorporating custom algorithms or adding new functional modules—such as the case for ELSA and BlueSky, where algorithm modification would require source code modification.
Limited Support for Programmable Controller Actions: In most existing systems, controller actions can be input manually via a human–machine interface or programmed through external languages (e.g., TrafScript in BlueSky or Auto-lead Data Format in CASSIOPEIA). However, native support for modifying flight data within the simulation environment itself is lacking. This limitation reduces the flexibility and the ability to seamlessly implement custom ATC algorithms.
To address these limitations the simulation environment proposed in this study is designed as an open-source framework comprising modular functions that support customizable applications. By leveraging open-access data interfaces, the framework significantly simplifies data acquisition and integration for end users. It uses ADS-B data as its primary traffic input, ensuring access to both historical and real-time air traffic information. This data is used to initialize the positions of all aircraft. However, within the designated control area real-world ADS-B trajectories are not used directly, as they typically reflect aircraft already under ATC guidance. Instead, aircraft positions in the controlled airspace are estimated and updated through the simulation framework, based on controller interactions. This approach ensures that the impact of automated ATC algorithms can be evaluated without being constrained by previously executed control decisions in the recorded data. This makes the environment particularly suitable for validating ATC automation solutions. Within the framework, traffic data can be manipulated using the simulation’s native language through well-defined interfaces. This allows for the flexible implementation and validation of automated controller algorithms and supports robust testing of automation strategies under realistic traffic scenarios.
The remainder of this article is structured as follows:
Section 2 presents the overall architecture of the simulation environment and the operational modes.
Section 3 describes the traffic prediction components, including both the microscopic position estimation and the macroscopic area-based update mechanism.
Section 4 details the interface structures.
Section 5 discusses the simulation’s time management model in relation to real-time operations.
Section 6 offers a case study demonstrating the performance of a sample controller algorithm. Finally,
Section 7 summarizes the findings and outlines directions for future research.
2. Proposed Architecture Framework
2.1. Architecture Requirements
The research gaps identified in
Section 1.3 inform the high-level requirements for the conceptualization of the simulation framework. These requirements are defined to support the independent development, testing, and validation of algorithms—such as those modeling the refined aircraft or controller behavior. The core architectural requirements are as follows:
Integration of real-world traffic data representative of the characteristics of a selected airspace;
Use of an agent-based modeling approach within a modular architecture that clearly separates functional components;
Provision of well-defined interfaces to ensure comprehensive control and visibility over data flows throughout the simulation;
Inclusion of basic traffic flow visualization capabilities to facilitate real-time monitoring during simulation runs;
Support for flight plan-based navigation, implemented at the agent level rather than the core simulation layer, to enable realistic trajectory handling without reducing framework flexibility.
2.2. Suggested High-Level Architecture
The simulation framework adopts a two-layered architecture, as depicted in
Figure 1. While the control agent and aircraft agent are integral components of the overall system, they are considered out of scope of this paper, which focuses specifically on the framework of traffic simulation. Nevertheless, a functional prototype of both agents is provided to test the simulation environment and illustrate the interface and data requirements. The traffic simulation layer is responsible for generating and updating simulated traffic data over time. This data is subsequently accessed and utilized by the other layers, collectively referred to as the upper layer further on.
The traffic simulation layer comprises multiple functions, each producing distinct outputs. These functions build upon one another and are detailed in
Section 2.3. The upper layer can draw on the output of one or more simulation functions, allowing for a wide range of applications and configurations. A prior version of this framework was introduced in [
25].
2.3. Operational Modes
The simulation environment supports three distinct operational modes, arranged in order of increasing complexity and functionality. The most advanced mode facilitates dynamic controller–pilot interactions, including the simulation of human errors and their operational consequences. The intermediate mode enables the prediction of future traffic flows in a selected area, representing traffic demand, serving as a valuable tool for flow management research. At the most fundamental level, the simulation supports data collection and logging, which constitutes a distinct mode of operation. Each mode is described in detail below.
2.3.1. Data Collection Mode
The foundational mode of the simulation environment is designed for the collection and storage of raw ADS-B data from a specified airspace. Each data point is timestamped using the UNIX format, ensuring the unique identification and chronological sequencing. This data recording capability is embedded in all subsequent operational modes, while also serving as in the primary function of this standalone mode. The ability to utilize pre-recorded historical data mitigates risks associated with disruptions in live ADS-B feeds, thereby enhancing simulation reliability. Moreover, it facilitates repeatable simulations by allowing consistent traffic scenarios to be replayed under varying parameter settings while preserving real-world data fidelity.
Given the growing interest in data science applications in ATM, the availability of large quantities of traffic datasets are essential. Aircraft trajectory prediction and optimization are among the most prominent use cases, often utilizing machine learning approaches. However, as shown in [
26], small changes in input data can mislead deep neural networks, resulting in incorrect predictions due to adversarial attacks. This is a significant concern for safety-critical applications. Moreover, while data-driven regression models can achieve high accuracy, they are particularly vulnerable to such adversarial attacks [
27]. By functioning as a standalone data collection module, the proposed framework provides a reliable and robust source of training and validation data for machine learning models. Beyond trajectory prediction, recorded traffic data can support a wide range of data-driven ATM applications. For instance, the machine learning methods described in [
28] utilize ADS-B data for flow management optimization.
2.3.2. Traffic Estimation Mode
In certain use cases, only a simplified prediction of future traffic is required. For example, sectorization decisions are often based on short-term forecasts—typically over a 20 min horizon. In such scenarios, the precise position estimates of individual aircraft are less critical than broader traffic metrics, such as the predicted sector load. Consequently, traffic prediction outputs should be available for a user-defined airspace and timeframe, serving as input for a range of downstream applications. Users configure this model through the following parameters:
Spatial boundaries: defined by latitude and longitude limits;
Prediction horizon (): the duration for which traffic is to be estimated;
Time resolution (): the granularity prediction output.
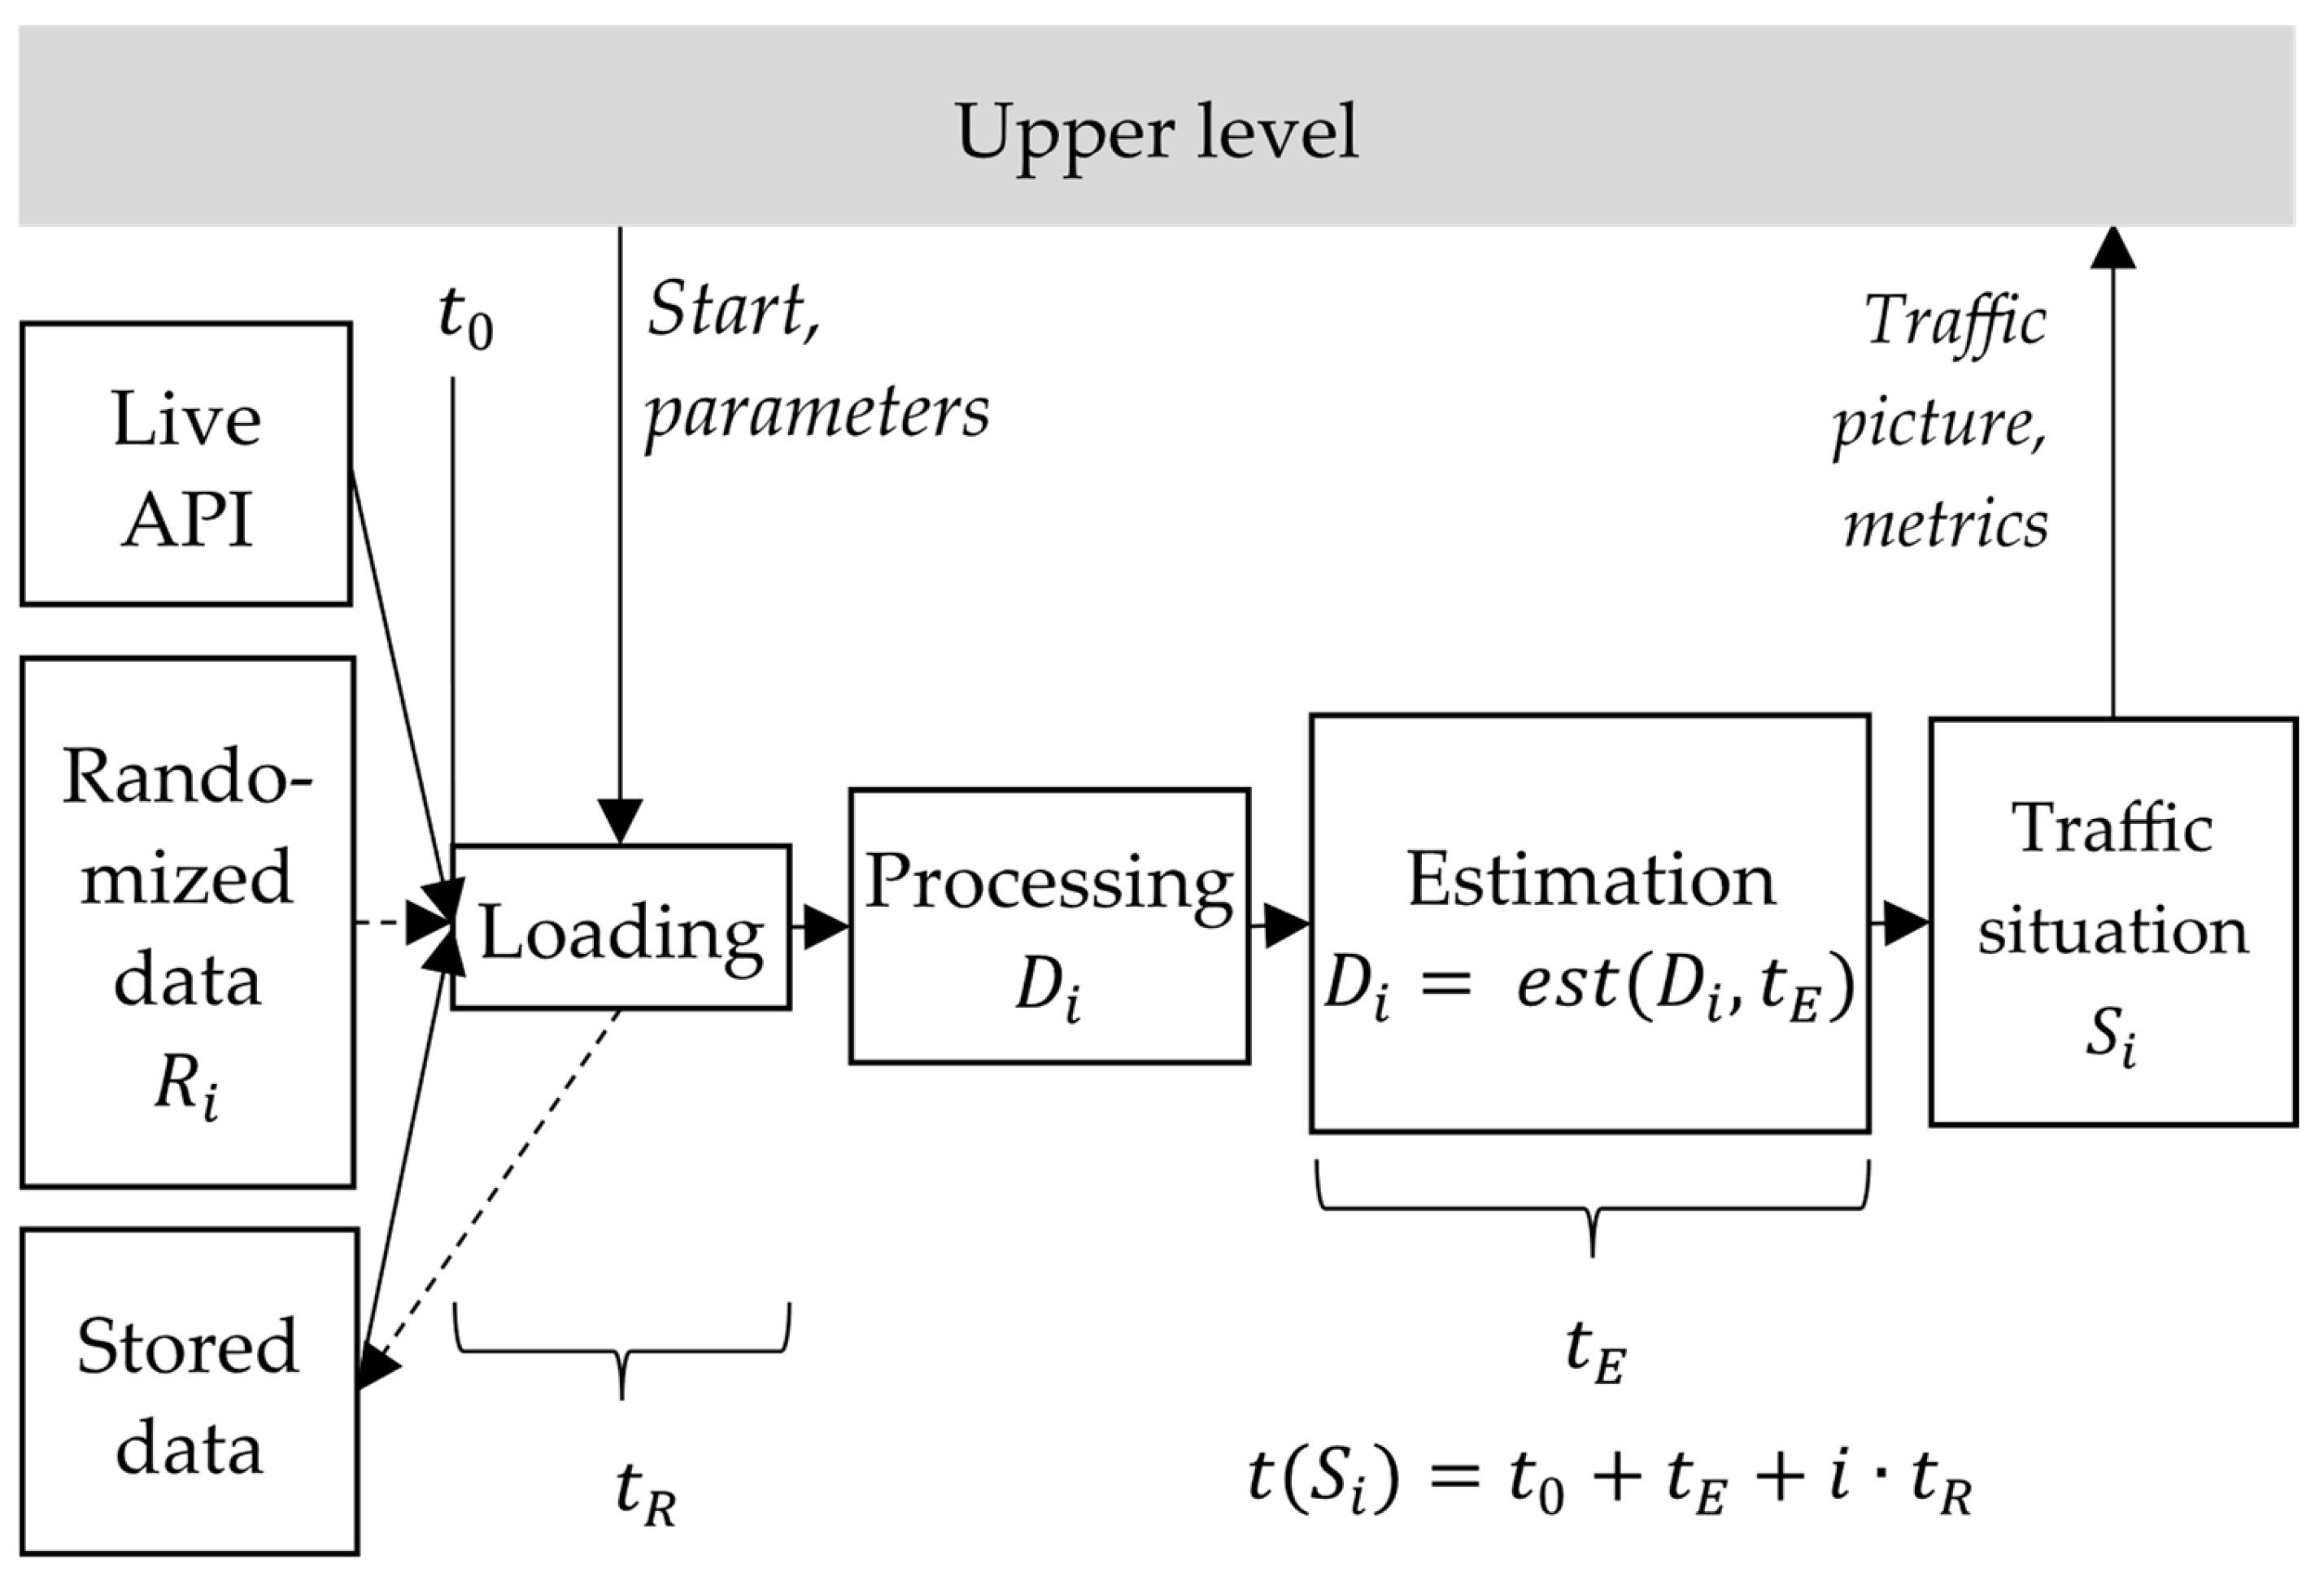
Figure 2 illustrates a single iteration of the traffic estimation process. The variables on the figure are listed below:
: start time of the simulation;
: API response time or loading time;
: estimation timeframe;
: dataset containing artificially generated (randomized) traffic;
: dataset containing the non-final traffic situation;
: dataset containing the predicted traffic situation;
: index of the current cycle;
Traffic input data may originate from either live API sources or stored historical datasets. Additionally, artificially generated (randomized) traffic may be included to simulate higher traffic volumes, although this feature is not implemented in the current version of the simulation environment. As indicated by the dashed arrow, the data collection functionality described in
Section 2.3.1 can be activated. At the beginning of each iteration (cycle
i), raw traffic data are loaded and processed into a structured form, denoted as
D, which serves as the foundation for all subsequent data manipulations. To simulate the increased traffic densities, the structure
D can be augmented with artificially generated data defined in a separate structure
Ri, parameterized by the upper simulation layer. The structure
D is then modified according to the estimation algorithm outlined in
Section 3.1. In practice, this involves appending predicted aircraft positions to
D. The result is a traffic snapshot for cycle
i, denoted as
, which reflects the estimated positions of all aircraft at a specific point in time. The timing of each cycle is determined by the user-defined estimation parameters, and the timestamp of snapshot
is calculated as
, where
is the simulation start time. The process then proceeds to the next iteration, following the methodology described in
Section 3.2.
The upper layer receives the predicted traffic information through an interface described in
Section 4. In addition to the spatial traffic representation, the simulation can also provide supplementary traffic metrics, such as the number of aircraft within a sector or the number of potential conflicts. These outputs enable a range of practical applications at the upper layer, including support for tactical flow management, workload estimation for ATCOs, and the evaluation and comparison of different sectorization strategies.
2.3.3. Control Mode
In the most advanced utilization scenario, the influence of ATCO behavior is modeled. To support this, an interface is implemented that enables the traffic simulation to perform the following:
These functionalities are governed by stochastic properties, with adjustable parameters. Such parameters include the following:
This configuration enables a controlled traffic flow simulation, illustrated in
Figure 3. Additional notations from those detailed at
Figure 2 are as follows:
: duration of controller–pilot communication and action implementation (traffic management);
: dataset containing the controlled traffic scenario;
C: dataset containing the pilot–controller communication;
: control function (manipulation of the traffic scenario as traffic management).
Pilot request generation is handled within the scope of the aircraft agent, but the simulation environment contains a simplified function for this purpose. For a predefined percentage of aircraft in the simulated traffic state , randomized pilot requests are generated. These requests can be bounded, according to the current implementation as follows:
Although the current application employs randomized pilot requests, the logic for request generation resides with the aircraft agent. This architecture also allows for the inclusion of en-route navigation features, such as waypoint-based routing.
The generated pilot requests are appended to the structure describing the traffic situation. This augmented structure, denoted as
, is then further extended to include controller responses—specifically, approvals or denials—and corresponding controller intentions, resulting in the complete structure
C. The process of extending of the traffic state structure
is described in detail in
Section 4.
Following this, the traffic management process generates a controlled traffic situation via the control function ctr. This controlled situation is assigned a dedicated time interval before the next simulation loop begins, during which the approved maneuvers are executed or initiated. Consequently, the simulation time of the controlled traffic situation is updated as , assuming a constant control interval across iterations such that .
3. Traffic Estimation Algorithm
The following sections detail the aircraft position estimation algorithm, with a particular focus on how position updates depend on the aircraft’s current state and location.
3.1. Position Estimation Algorithm
Due to the absence of destination and planned route data in ADS-B transmissions, a simplified estimation algorithm is necessary to infer short-term aircraft intent. Although the integration of flight plan data could improve prediction accuracy, maintaining independence from such data enhances the algorithm’s ability across diverse use cases. This is particularly valuable where access to flight plans is restricted or inconsistent. The estimation algorithm is initially based on a uniform linear motion model, which can be readily extended or refined due to the modular design of the simulation environment. Notably, in many applications—such as airspace sectorization—key performance metrics depend more on aggregate traffic characteristics than on precise aircraft positions. Furthermore, the area-based upgrade mechanism described in
Section 3.2 enhances the effectiveness of the estimation process.
The algorithm estimates the three-dimensional position of an aircraft over a specified prediction interval. The position of aircraft
j at time
in the scope of this work is defined by the authors in Equation (1):
The following definitions are used above:
, is the latitude and longitude coordinate of aircraft j in time in WGS84 decimal degrees;
is the altitude of aircraft j in time in meters;
is the heading of aircraft j at time , in decimal degrees clockwise from true north (north = 0°);
is the ground speed of aircraft j in m/s;
is the vertical rate in m/s, where a positive value indicates climbing, a negative value indicates descent.
For estimating horizontal motion, the model assumes uniform linear motion. Latitude and longitude updates depend on heading and velocity vector, with adjustments made for Earth’s curvature according to Equations (2) and (3). In the current realization MATLAB’s
deg2km and
km2deg functions (part of the Mapping Toolbox) are responsible for this task. In Equations (2) and (3) a km2deg function is used as a notation of a function that converts the distance in kilometers to degrees. Note that the source code of the simulation also employs conversion between distance units to align with those presented in Equation (1) and
Table 2.
For vertical motion, a similar linear assumption is made using the aircraft’s vertical rate. The altitude is updated as Equation (4) and then converted to flight level.
3.2. Area-Based Upgrading
During the simulation, a specific region is designated for control operations, which may correspond to an entire FIR or a particular sector within it. This region is referred to as the “inside area”. The “outside area” comprises the airspace beyond this boundary and is defined dynamically by extending the average distance an aircraft can travel within the user-selected prediction timeframe. This distance is computed by multiplying the average commercial aircraft speed by the timeframe parameter
. A visual representation of the data refreshment process based on this spatial segregation is provided in
Figure 4. At simulation start, the positions of all aircraft are initialized using real-world traffic data, which can be sourced either from live API or archived historical datasets. Following initialization, the estimation process overwrites the real aircraft positions within the specified timeframe to construct an estimated traffic demand scenario. As described in
Section 2.3.2, this estimated traffic may serve as a sufficient output for certain applications. Alternatively, it may trigger control mode, as outlined in
Section 2.3.3. In control mode, the positions of aircraft within the inside area are iteratively updated based on interactions with simulated ATCOs. As the simulation advances, these interactions increasingly diverge from the original traffic data, meaning that the inside area is no longer governed by real data, but instead reflects the effects of controller decisions and responses. For aircraft in the outside area, traffic is initially estimated using the same timeframe of
to project near-future positions, ensuring integration with the controller region. Once controller interactions conclude, the data for the outside area data can be refreshed using either live API data (in which case the estimation must be recalculated, considering the updated timestamp (
adjusted for elapsed time)), archived data (which may eliminate the need for further estimation if accurate timestamps are available), or a simple interpolation can be used between the two nearest points.
4. Interfaces
The interfaces of the simulation are defined in accordance with the selected operational mode, particularly in scenarios involving ATC functionality.
4.1. Interface for Traffic Simulation
The traffic prediction can be performed internally using the estimation algorithm described in
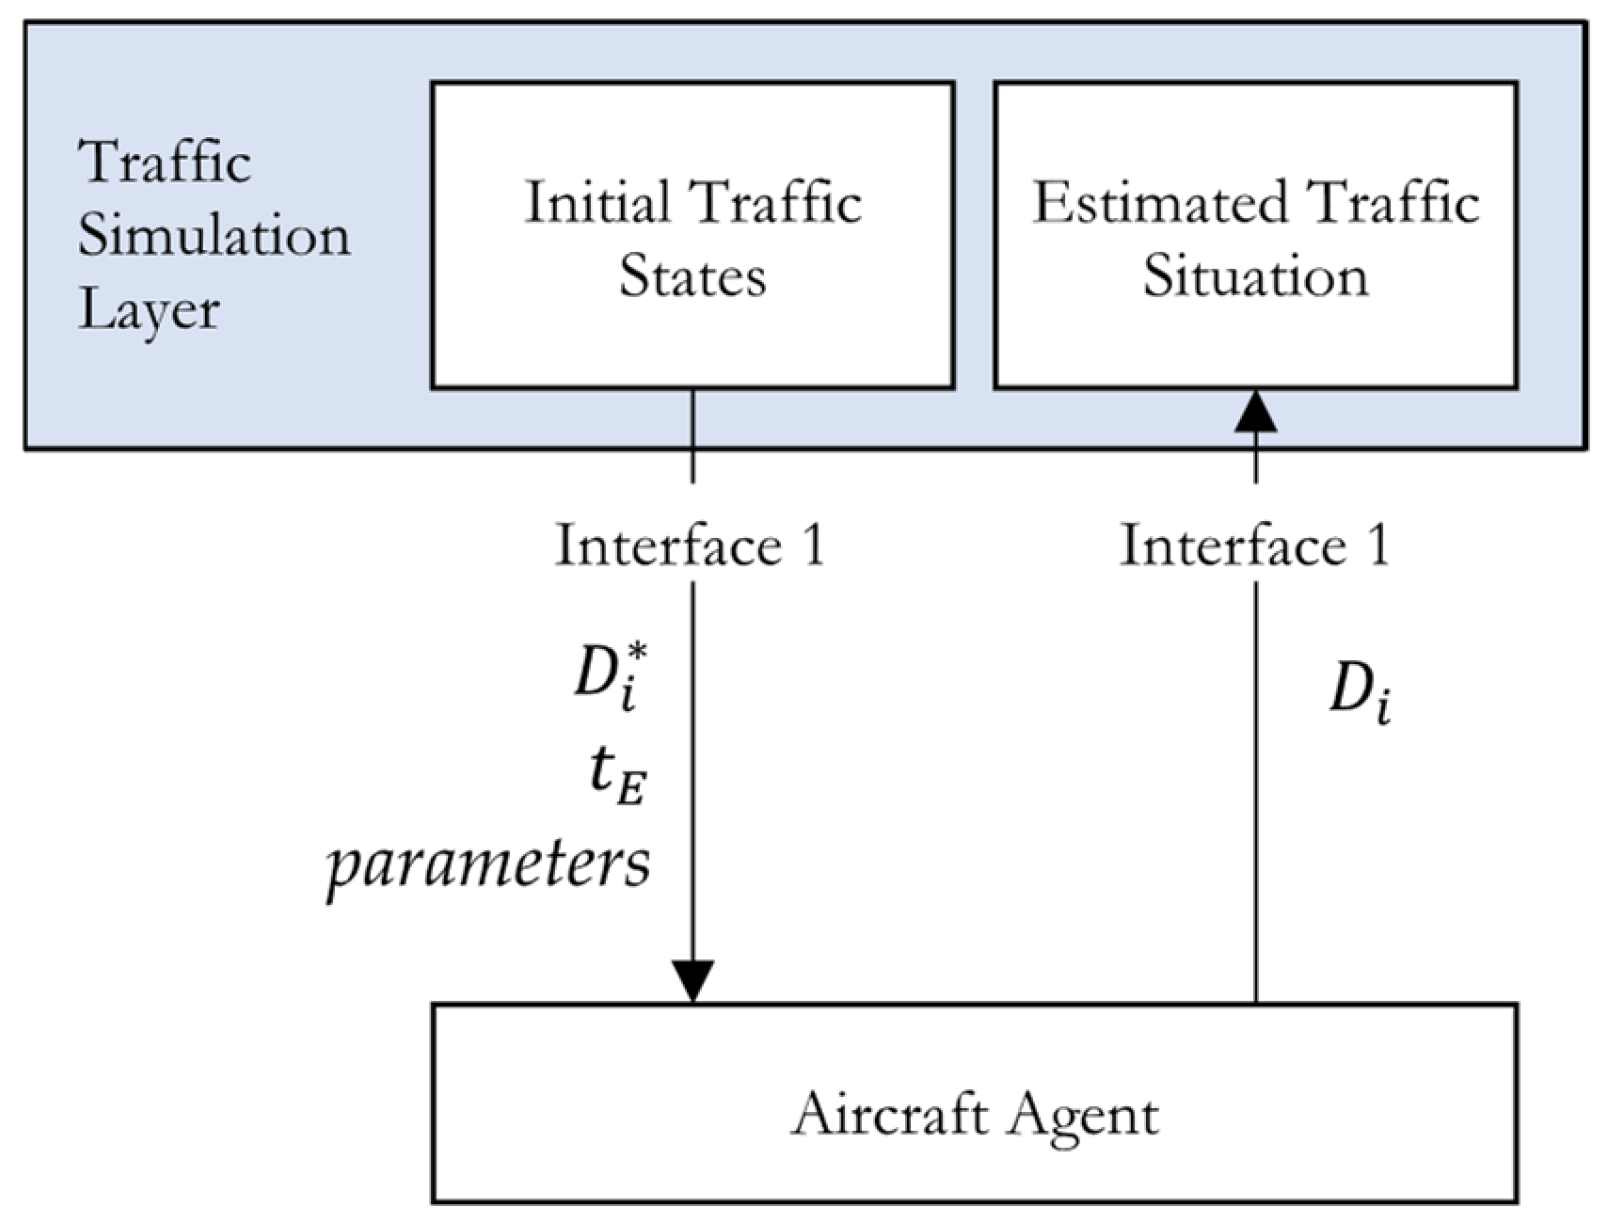
Section 3.1. In this case, the simulation engine directly generates predicted aircraft positions. However, the simplicity of this built-in algorithm may limit the fidelity of the predictions, thus constraining its suitability for certain high-accuracy applications. To address this limitation, the modular architecture of the simulation framework supports the delegation of the aircraft behavior modeling to an external component. This allows for the integration of more sophisticated models—such as those that account for aircraft type, which is available via ADS-B message fields.
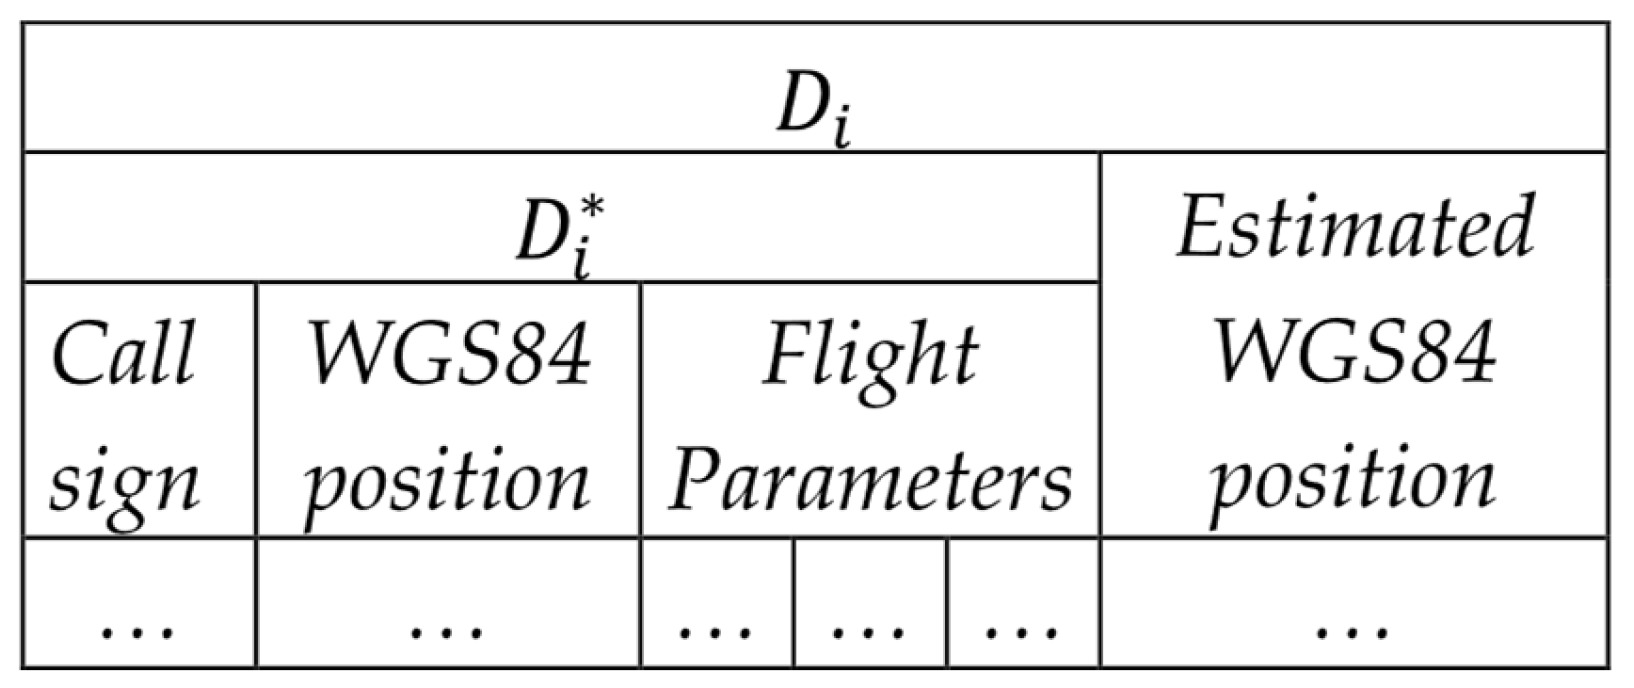
When using an external aircraft agent, position estimation is carried out through Interface 1. This interface supports bidirectional data exchange, using a unified data structure, which is the same as the one used by the built-in estimation algorithm. The primary difference lies in how the position data are derived: in this case, the aircraft agent is responsible for generating the estimated positions.
Figure 5 and
Figure 6 illustrate the data flow and the structure of exchange information, respectively. A detailed explanation of the data fields used in this interface is provided in
Table 2.
4.2. Interface for Pilot–Controller Communication
The pilot–controller communication interface enables changes in aircraft trajectories, directly influencing the traffic situation and providing a valuable foundation for evaluating controller workload. Numerous systems estimate controller workload through specific properties of the traffic, such as coordination tasks. A widely used example of such task-based methodology is EUROCONTROL’s CAPAN studies [
30]. In real-world applications, pilot–controller communication is typically triggered by events necessitating trajectory changes—such as adverse weather, flight parameter optimization, emergencies or non-nominal situations, frequency handoffs, or misunderstandings in issued clearances.
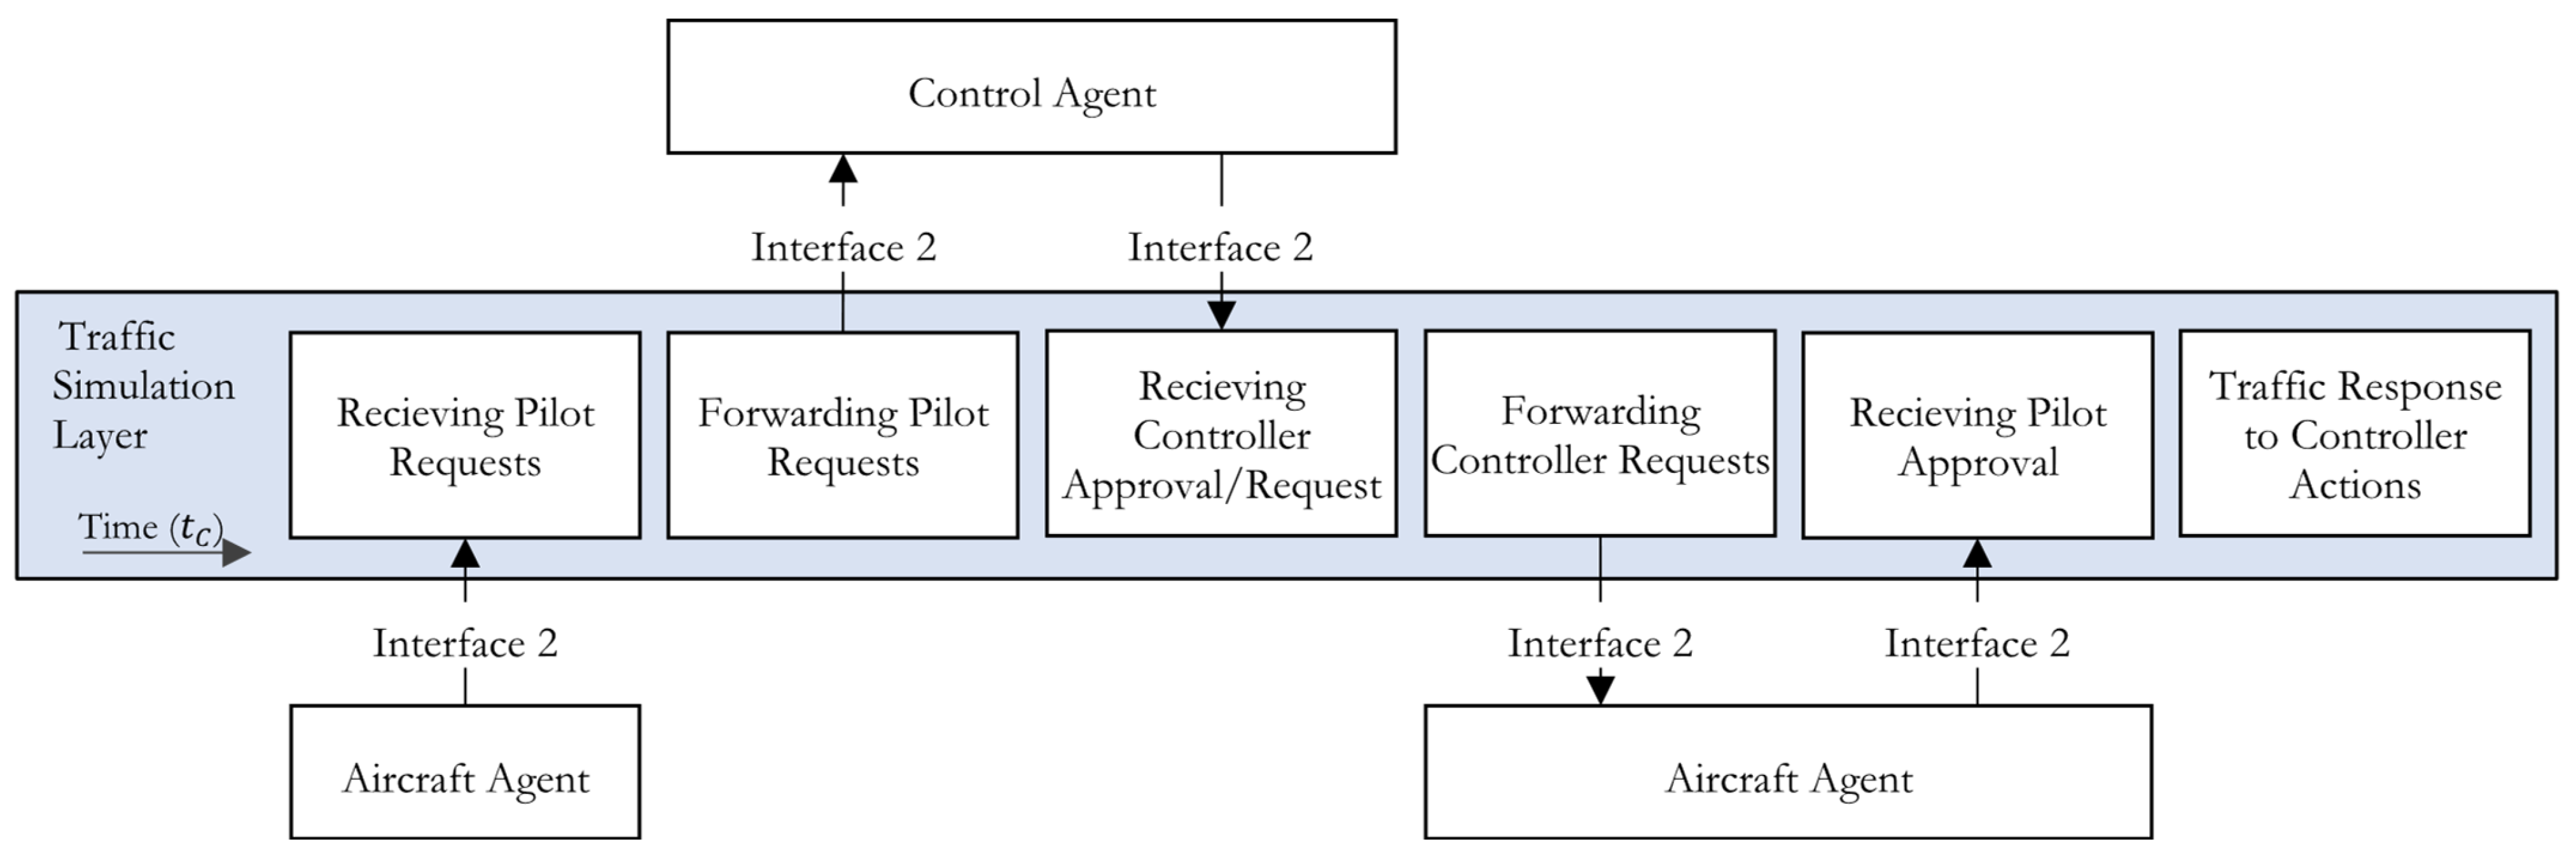
This communication interface involves three interconnected layers: the aircraft simulation layer, the traffic simulation layer, and the controller layer. This architecture is illustrated in
Figure 7, while the detailed interface structure is shown in
Figure 8.
Pilot requests can be generated in a simple, randomized manner. The simulation accepts a user-defined parameter that specifies the proportion of the aircraft generating requests, allowing traffic complexity to be adjusted. Both the selection of aircraft and the content of the requests are randomized.
Alternatively, the aircraft simulation layer can be assigned the responsibility of request generation, aligning with its role as an aircraft behavior model. This is facilitated via Interface 2, which defines communication between aircraft agent and controller agent. In this arrangement, the traffic simulation layer functions primarily as a messenger, relaying information between layers.
The process initiates with pilot requests, which are transmitted to the controller agent. Based on the controller’s decisions, new instructions or approvals/denials are returned. Given that the simulation assumes class C airspace [
31], aircraft are expected to follow ATC instructions. However, non-compliance or alternate proposals from the pilot side are possible in the subsequent iteration. Here the memory between iterations has to be maintained by the aircraft layer. Time progression is modeled via successive loop iterations, during which the aircraft positions are updated and new communication rounds are triggered.
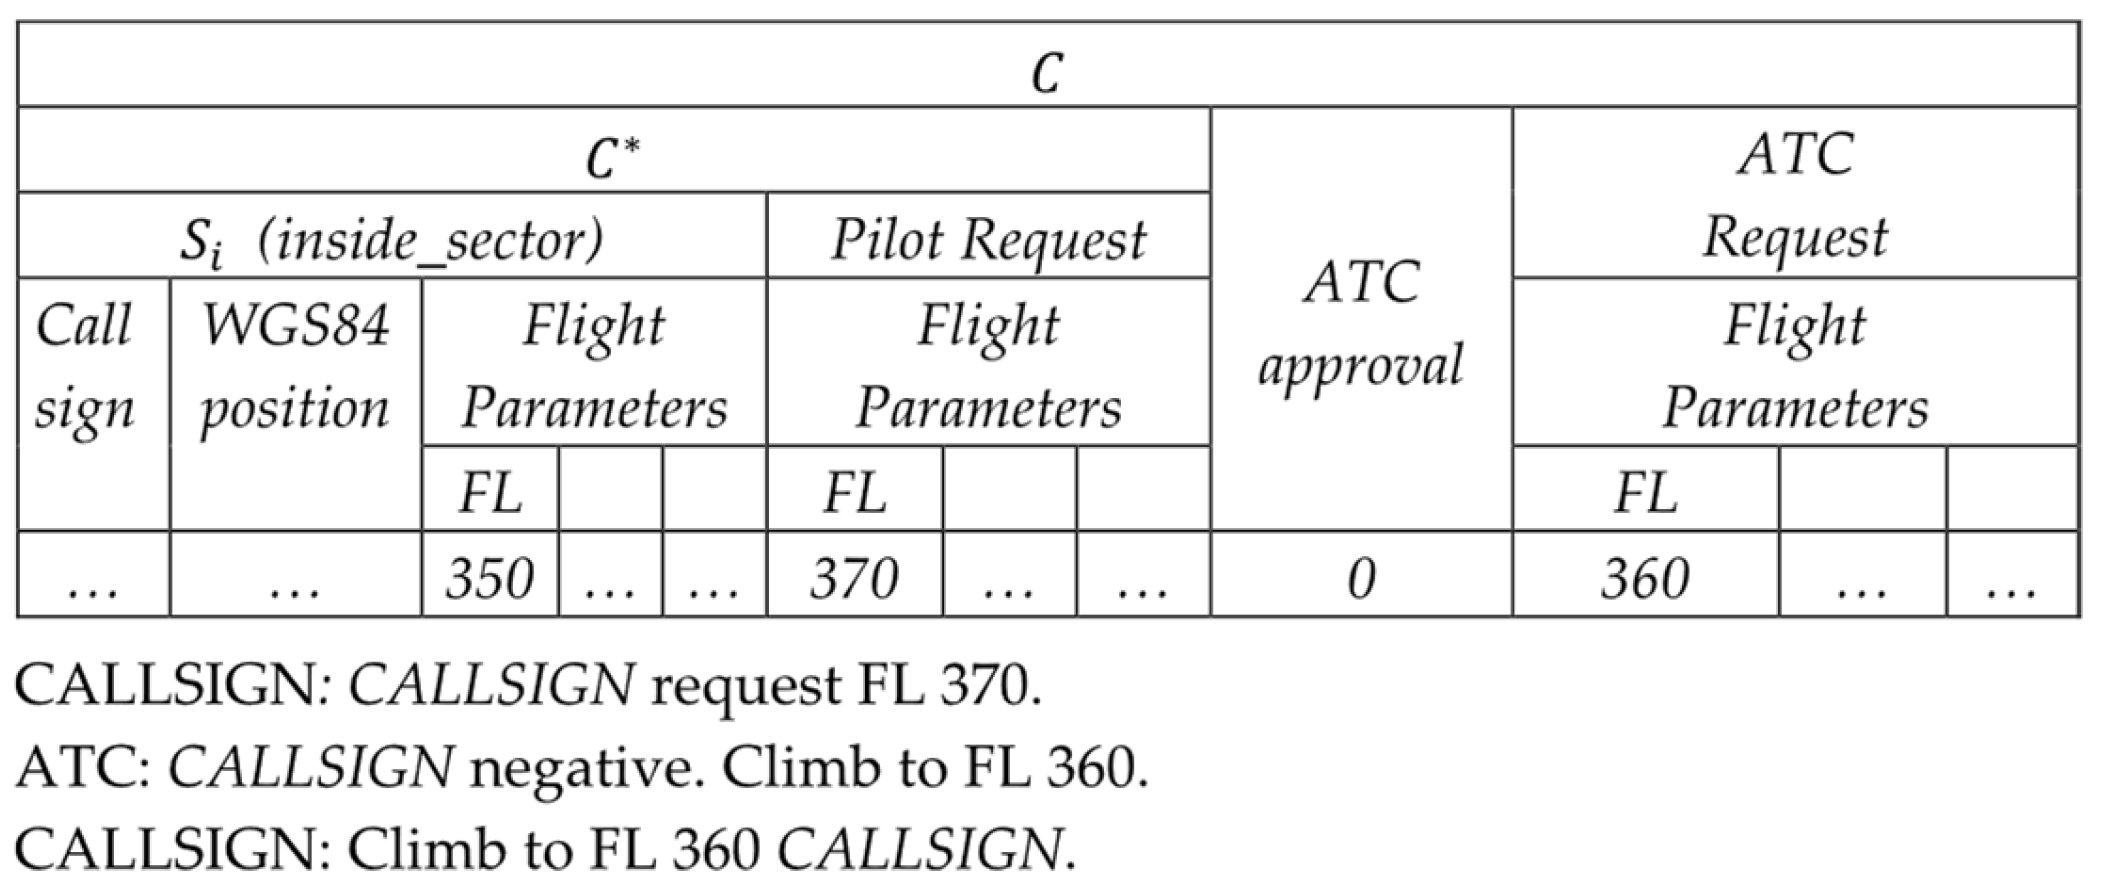
The data structures used for this communication are described in
Figure 9. The relevant fields associated with Flight Parameters are explicitly marked in
Table 2.
An example scenario illustrating the use of Interface 2 is provided in
Figure 9, demonstrating how the simulation framework captures communication between ATC and aircraft crew over time.
5. Time Management
Temporality is a key consideration in both traffic estimation and control mode operations. The simulation operates in an event-driven manner, where synchronization plays a critical role in maintaining coherence between traffic management and the interacting agents. Key events—such as the completion of data processing, communication exchanges, or data refresh cycles—serve as triggers for subsequent actions within the simulation. This event-driven architecture ensures that all components remain aligned in time and behavior, supporting accurate and responsive system behavior.
Figure 10,
Figure 11 and
Figure 12 illustrate three separate but interrelated time axes:
API time: representing real time for real-time functionality (particularly relevant when using live ADS-B data);
Simulation time: indicating the time of the modeled traffic situation, incorporating estimation timeframe;
Running time: tracking the simulation’s actual processing duration, reflecting how operations map to real time.
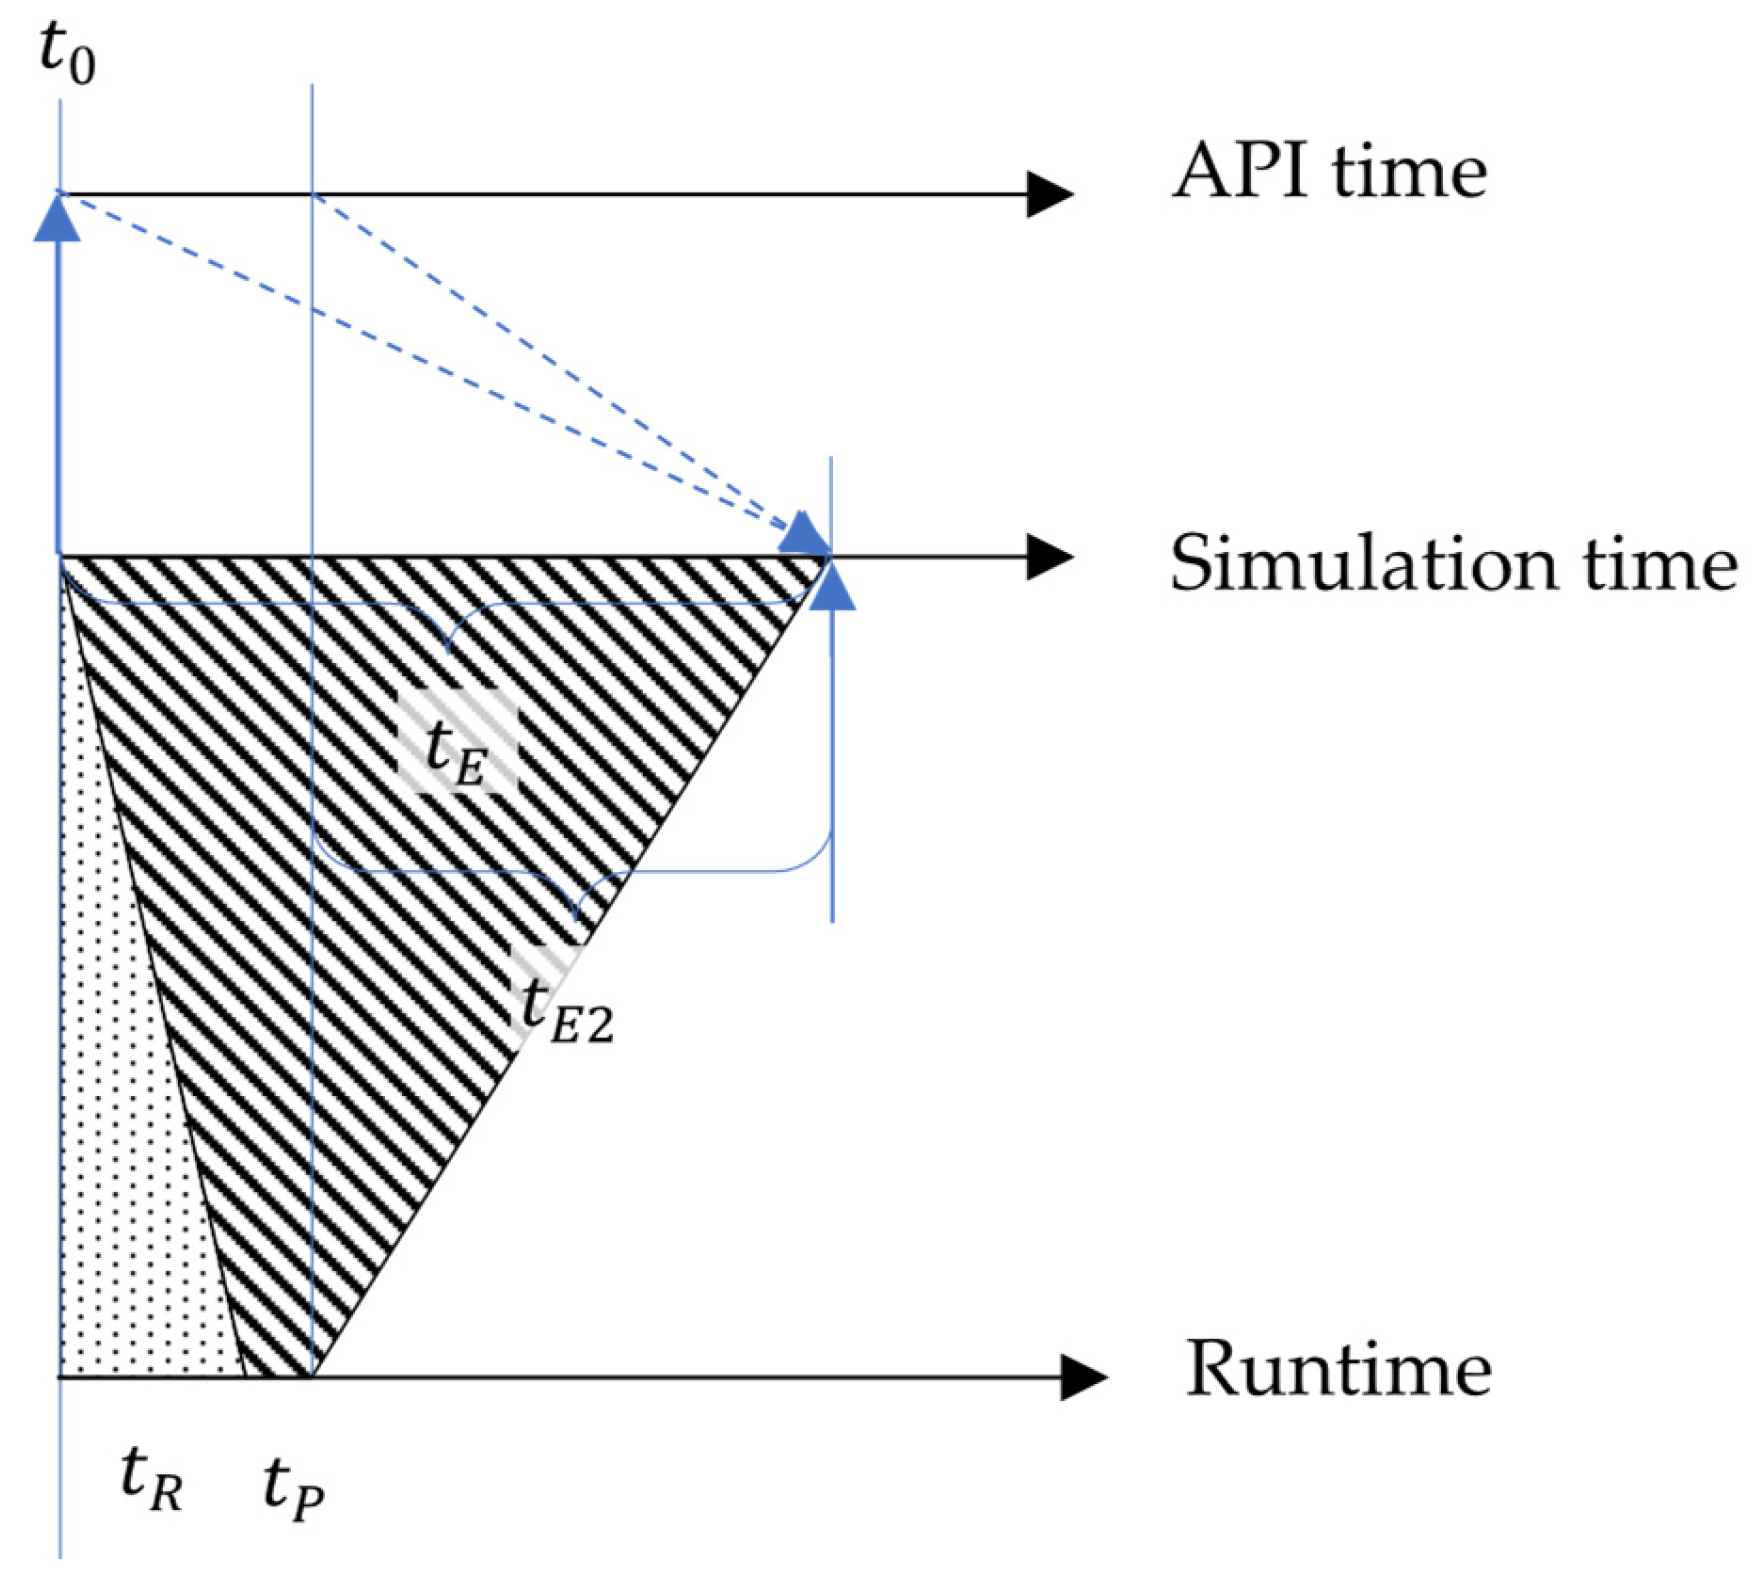
This mapping is shown in the form of rectangles. Note that the axes are not drawn to scale but are presented to highlight the underlying logic behind temporality.
The simulation begins at a defined start time
. The first step involves retrieving data from the API, which may incur variable response times. This is denoted as
. Following this, the simulation performs a data processing step, combined with the estimation process and represented together as
. Subsequently, the traffic estimation stage commences, during which simulation time advances by a defined value
. The time required for processing and estimation is considered negligible compared to
, but is accounted for using the right sloping hatch area on
Figure 10. To maintain temporal consistency in cyclic estimation, the timeframe for each subsequent estimation cycle is adjusted to compensate for elapsed real time by introducing
, which can be expressed as
. This adjustment ensures that the simulation provides an updated traffic picture. This allows for refreshing the data in the outside area (according to
Section 3.2) with a traffic demand based on real data.
In control mode, additional time elements must be considered, as the simulation now includes controller actions. This mode extends the time logic by incorporating the following sequential steps:
Pilot request generation (by either the traffic simulation layer or the aircraft agent);
Controller intention generation (by the controller agent);
Traffic management (handled by the traffic simulation layer).
The total runtime required for these operations is denoted as
. As some components depend on agent responses, runtime is measured by observing elapsed time between interface communication. Furthermore, these control actions influence not only runtime but also advance simulation time by a defined timestep
, representing the simulation’s progression during controller interactions. As shown in
Figure 11, a subsequent API request can only occur after a total of
from
. To maintain synchronization with simulation time, the second estimation cycle must then use
. This ensures that the simulation remains temporally consistent during complex control sequences.
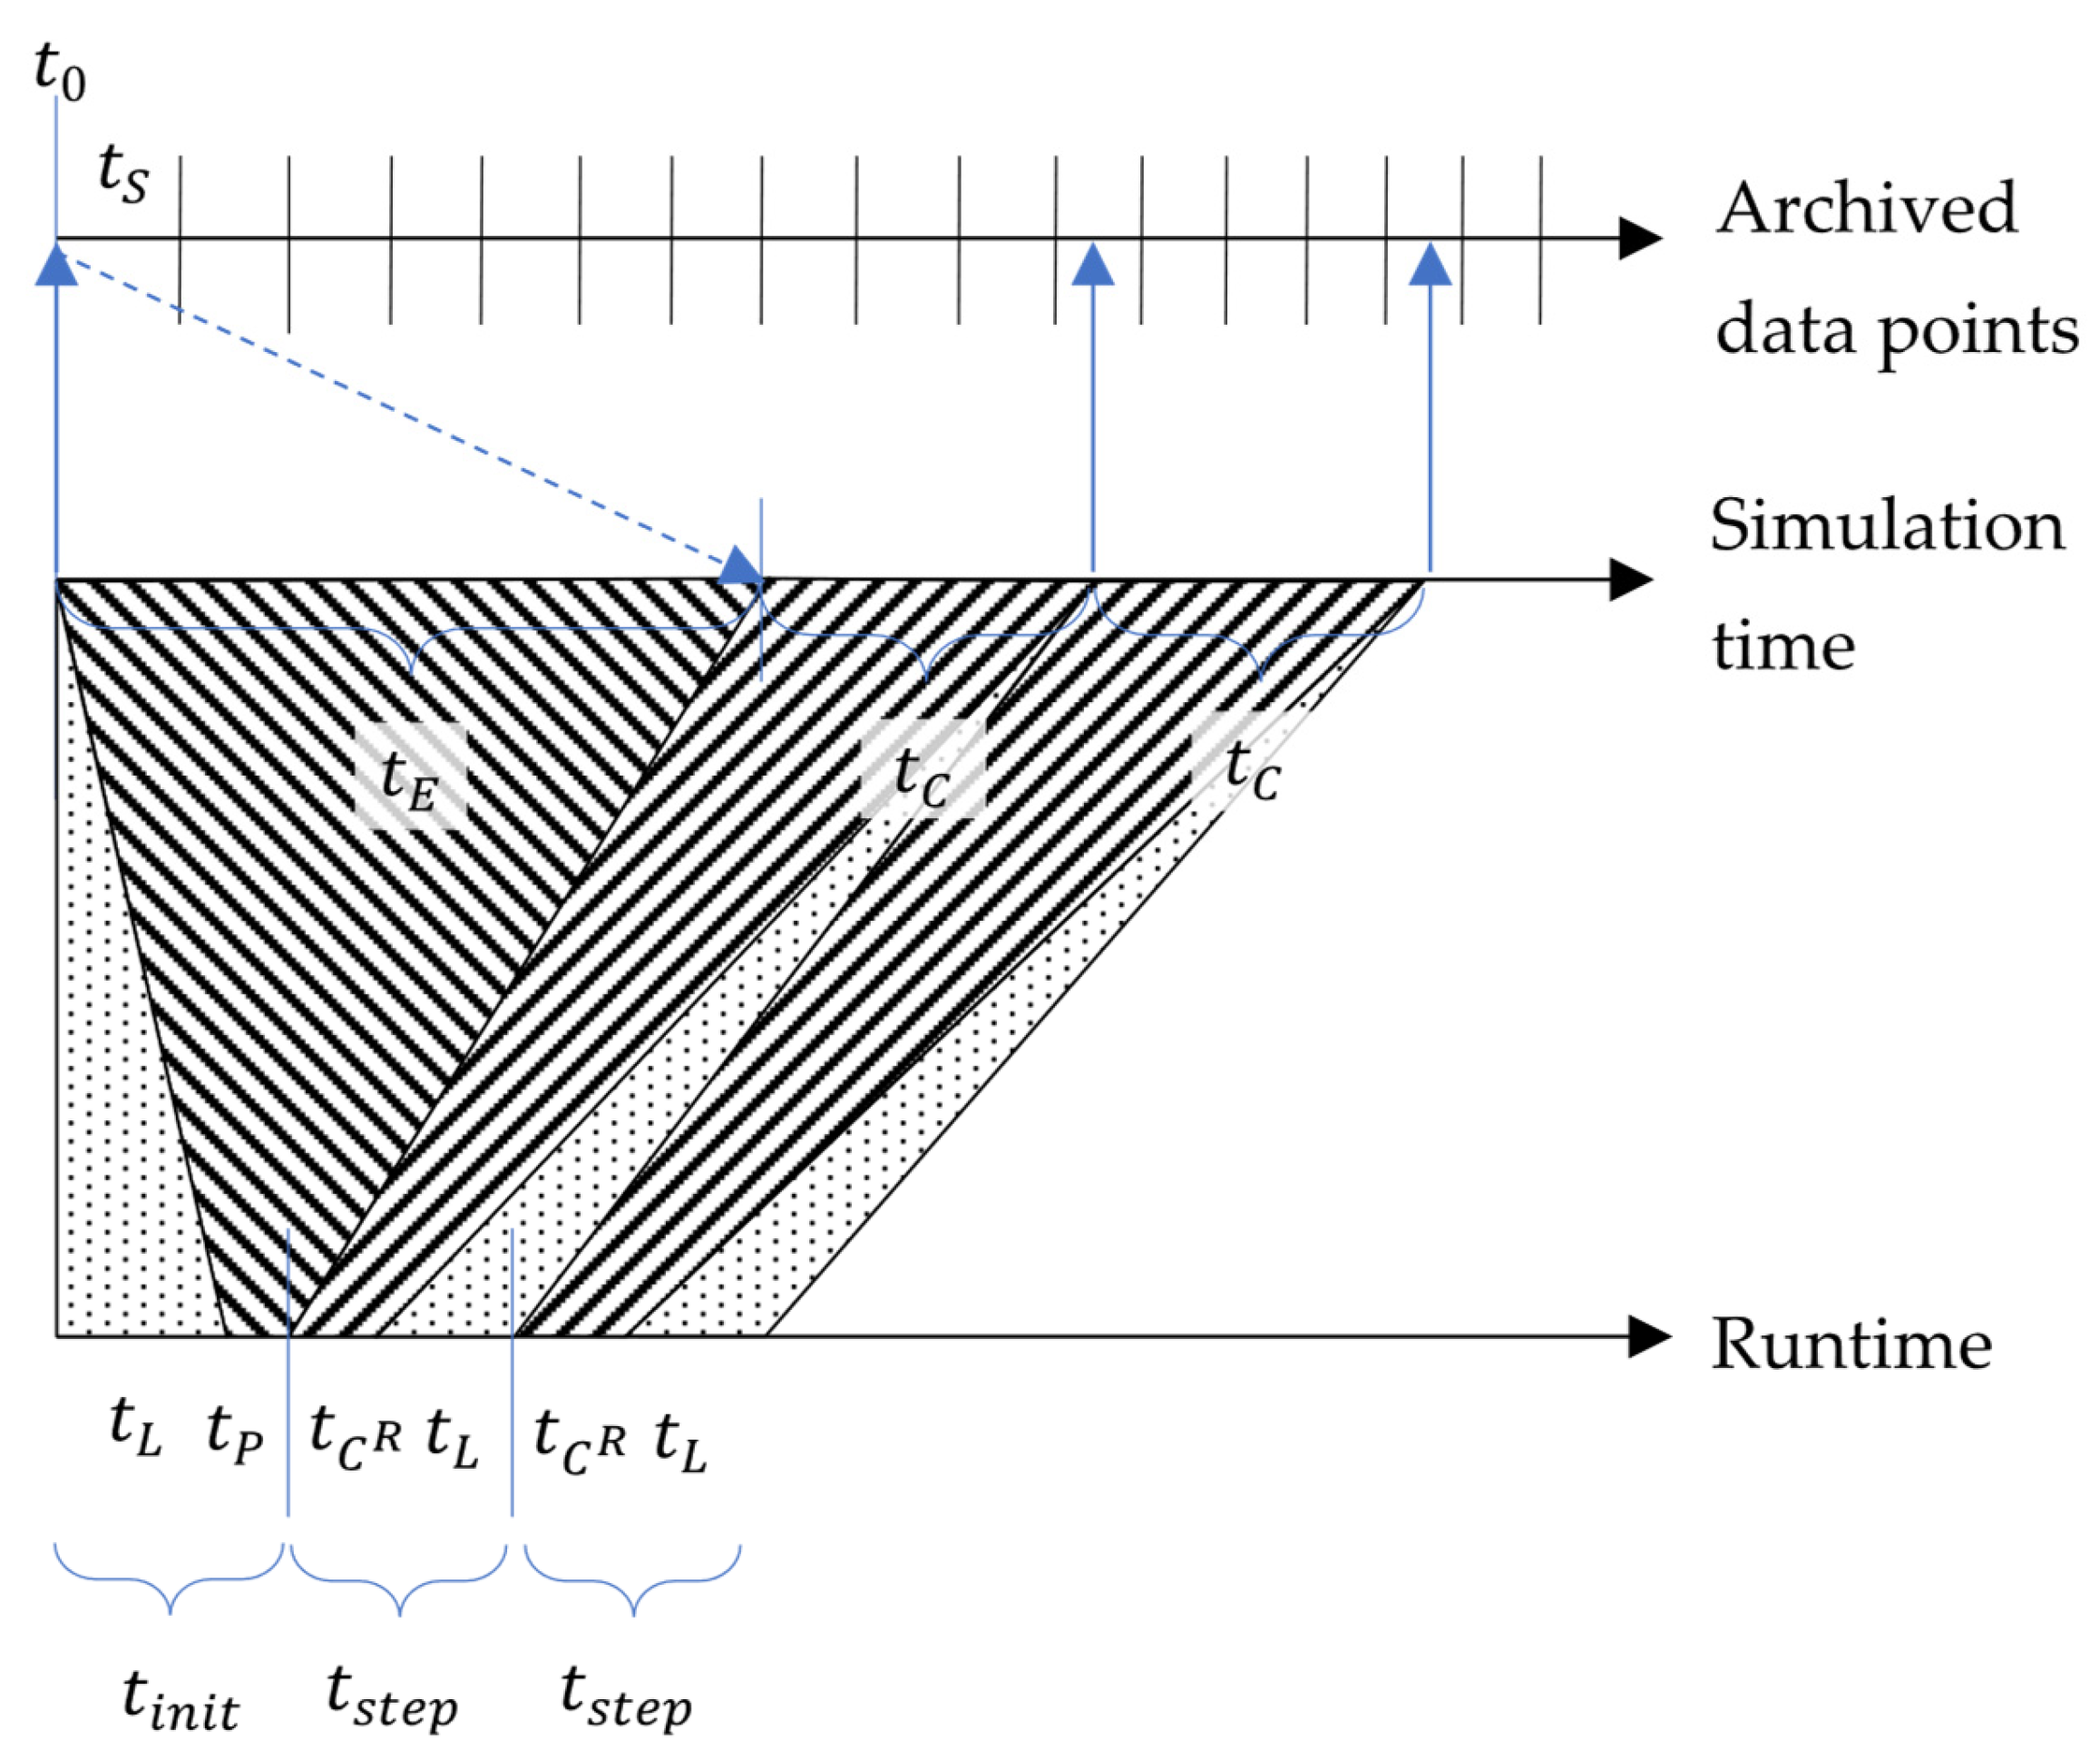
A more reliable approach, particularly suitable for offline analysis, involves using pre-recorded ADS-B data rather than relying on real-time feeds. This method eliminates uncertainties caused by API availability and response times.
In this scenario, shown in
Figure 12, archived data is sampled at intervals of
. While exact uniform sampling may be difficult due to operational API constraints, interpolating between two nearest data points provides a sufficiently accurate traffic picture.
Given these benefits, using archived ADS-B data is suggested for most applications.
6. Implementation
The simulation framework described in the previous chapters has been implemented in the MATLAB environment. The current version of is capable of retrieving aircraft surveillance data from the following sources:
OpenSky REST API [
32] live API;
ADS-B Exchange [
29] live API or historical data archive.
In practical applications, the OpenSky REST API has been identified as a suboptimal data source due to the frequent omission of the “Aircraft Category” field. Consequently, the simulation framework is designed to process any ADS-B data source formatted in the ADS-B Exchange v2 standard. The OpenSky Network API remains a viable option when an external aircraft agent is not connected, and the simulation relies on its internal position estimation algorithm, which does not incorporate aircraft type information.
Airspace data can be retrieved from AIPs, ensuring access to up-to-date information. Platforms such as OpenAIP.net facilitate the export of airspace data in various geospatial formats, including OpenAir, a file format specifically designed for AIPs. While this data can be readily converted into any geospatial format compatible with MATLAB, such as GeoJSON, the responsibility for executing these conversions is delegated to the user.
The simulation requires the following toolboxes:
Mapping Toolbox;
Aerospace Toolbox.
The case study implemented here is a simple examination of the performance of a very basic controller agent. Note, that the controller algorithms are not part of this study; now purely the characteristics of the traffic simulation are in focus. This simple controller agent has the following properties:
Accepts all requests;
If aircraft are in conflict horizontally, rotates all aircraft by 30° to the left;
If aircraft are in conflict vertically, the upper one is instructed to climb.
The following performance indicators are selected to gain a basic understanding of the effectiveness of the sample controller agent. KPIs are to be measured in each iteration and summed for the simulation:
The number of separation minima infringements (separation minima values are considered assuming RVSM airspace based on ICAO Annex 11);
The number of aircraft receiving ATC instructions;
The total number of aircraft in the sector.
Flight data were obtained from the ADS-B Exchange historical dataset [
29], specifically for 1 April 2025. The simulation period was defined between 06:56 GMT and 12:11. The resolution was set to 5 s to match the resolution of historical data. It is important to note that the outcomes of the simulation are not strictly reproducible due to the use of randomized decision-making processes at multiple points within the simulation.
The area of interest was the FIR over Hungary. The performance metrics following the simulation are depicted in
Figure 15. As traffic density increased throughout the morning hours, the controller algorithm successfully maintained safe separation up to a threshold of approximately 60 aircraft within the FIR. Beyond this level, violations of separation minima began to occur and increased in frequency.
Further analysis of the simulation’s visual output suggests that the algorithm’s strategy of resolving conflicts by applying repeated heading changes led to prolonged occupancy of the sector. This behavior contributed to an increase in traffic volume and was reflected in a growing number of ATC instructions issued during the simulation.
7. Conclusions
The air traffic simulation environment presented in this paper offers a versatile and modular framework for testing automated ATC solutions, with an emphasis on real-world applicability and data-driven validation. By integrating either real-time or recorded ADS-B data, the framework ensures realistic traffic scenarios, which are essential for the accurate assessment of automated control algorithms. Within the controlled sector, the impact of controller decisions is simulated and preserved, while surrounding traffic is continually updated from external sources to maintain contextual relevance.
A central feature of the environment is its clearly defined and flexible interfaces, which enable seamless integration of external components. These include the following:
Traffic prediction for a selected area for flow management applications;
Controller agents for algorithm development and validation;
Implementing complex agents for modeling aircraft performance or traffic prediction.
The simulation is implemented in MATLAB and offers an open-source structure, fostering customization and adaptability. Its modularity enables users to define their own control algorithms, measure performance indicators, and manipulate simulation complexity—such as by introducing randomized traffic or modeling human errors. The clarity and the control over the data flow in the simulation also enables flexible measurements of KPIs, which is suitable for many applications.
The simulation is capable of forecasting air traffic within a timeframe specified by the user. While the prediction algorithm is initially presented in a simple, straightforward form, the simulation’s modular architecture facilitates the implementation of upgrades that enhance the algorithmic sophistication. Additionally, the implementation of area-based segregation contributes to the refinement of prediction accuracy, while many of the proposed applications do not require precise forecasted aircraft positions but rather certain metrics of the sector, e.g., the expected traffic density for sectorization.
Crucially, the simulation allows for the recording and replaying of traffic scenarios, which not only improves reproducibility but also eliminates dependency on live API availability. This facilitates robust testing under consistent conditions—an essential requirement for validation studies.
The simulation output comprises a comprehensive traffic depiction under the control of the air traffic controller, alongside traffic metrics describing airspace complexity and the efficacy of control actions. These metrics include parameters such as the number of aircraft within a sector and instances of separation minima infringements.
An example study was conducted to validate the workflow within the simulation environment using a sample controller algorithm. The results enabled the determination of an upper threshold for aircraft density within the airspace that allows for conflict-free operation. The complexity and effectiveness of conflict resolution are entirely dependent on the control agent, which is responsible for manipulating the traffic through the defined interface. The network layout—comprising waypoints as well as sector entry and exit points—defines how flights are guided through the airspace. In this architecture, flight plans are not directly known by the traffic simulation layer; instead, this information can be handled by the agents. For instance, if the controller agent is aware of an aircraft’s flight plan and associated waypoints, it can issue instructions that consider the aircraft’s intended trajectory and maintain network efficiency. If flight plans are known by the aircraft agent, it can generate requests for route shortening. Furthermore, the controller agent can represent more than one ATCO, as sectorization is implemented at the control agent level. From the perspective of the traffic simulation layer, it is irrelevant which specific controller issues a clearance. However, by implementing sectorization at the controller agent level, it becomes possible to study additional performance characteristics, such as the workload of individual controllers based on traffic complexity within each sector. This design highlights the modularity of the framework, allowing various control strategies to be tested without altering the core traffic simulation layer.
Potential future work can focus on the enhancements of agents from current limitations, including the following:
Enhanced modeling of aircraft movements, e.g., considering states between flight level changes through rate of descend/climb, refining position estimation with aircraft dynamics;
Advanced aircraft agent modeling, where the aircraft agent has a “memory” between iterations, where the intention of following a flight plan is modeled;
Handling the special traffic characteristics of arriving and departing traffic;
Incorporating weather data to induce aircraft deviation requests;
Traffic generator agent for generation of random traffic for customization of traffic scenarios.
Ultimately, while the upper layer’s functionalities are task-specific—tailored, for example, to sectorization studies or conflict resolution testing—the framework’s adaptability, data transparency, and open integration interfaces make it a robust and scalable platform for future ATC automation research.


