1. Introduction
In recent years, European energy markets have seen significant changes in electricity price levels and dynamics. While wholesale prices were relatively stable and predictable in the past, today, we are increasingly faced with significant fluctuations, outliers, and negative prices. This trend is particularly pronounced after 2021, when several crisis factors hit the markets: rising fuel prices, geopolitical tensions, as well as the rapid increase in renewable energy generation (RES).
Foundational theories of electricity market pricing are grounded in microeconomic principles, particularly supply–demand equilibrium models, where prices are determined by the intersection of generation costs and consumer demand. Unlike traditional commodities, electricity cannot be economically stored in large quantities, which makes prices extremely sensitive to real-time changes in supply and demand. One of the most frequently cited mechanisms in explaining price formation is the merit-order effect. This principle describes how electricity generators are dispatched in ascending order of their marginal costs. The increasing share of renewable energy sources, such as wind and solar, which have near-zero marginal costs, shifts the supply curve to the right and typically leads to lower average market prices. However, this also contributes to higher price volatility, especially when renewable output fluctuates due to weather conditions. In periods of high demand or low generation capacity, prices can rise sharply due to limited supply—reflecting the high value of available electricity. This is particularly visible in “energy-only” markets. Market design also plays a central role. In the European context, electricity is largely traded in day-ahead markets (DAMs) and intraday markets (IDMs), where short-term forecasts, bidding strategies, and grid constraints influence pricing dynamics. The volatility in such markets is further exacerbated by the increasing integration of variable renewables, creating a need for flexible balancing mechanisms and demand-side participation. Comparative studies from other regions provide valuable insights. In the Nord Pool market, price volatility has been linked to hydrological conditions and interconnector constraints. In the Australian National Electricity Market (NEM), research has emphasised the role of peak demand, lack of reserve margins, and the influence of extreme weather events on price spikes. Meanwhile, North American markets like PJM and ERCOT have shown how capacity markets, strategic reserves, and regulatory oversight can help mitigate extreme volatility while maintaining investment signals [
1,
2,
3,
4,
5,
6].
Table 1 presents the development of the share of electricity production from renewable energy sources (RES) in selected European countries between 2015 and 2025. The data highlight significant differences in both the initial levels and growth trajectories among the countries. Germany shows the most pronounced and consistent growth in RES share, increasing from 32.3% in 2015 to a peak of 62.3% in 2024, before a slight decline to 55.5% in 2025 (however, it is only May—high production from photovoltaics is expected in the summer). This trend reflects strong national policies supporting wind and solar deployment, as well as high investment in grid integration. France, despite its large nuclear fleet, has gradually increased its RES share from 15.7% in 2015 to around 26% in recent years, with moderate year-on-year growth. In contrast, Central and Eastern European countries started from much lower levels. Poland, for example, had only a 9.4% share in 2015 but demonstrated rapid growth in recent years, reaching 29% in 2024, largely driven by the expansion of wind and solar installations. Slovakia and the Czech Republic showed slower progress, with relatively stable shares at around 20% and under 18%, respectively, by 2025, reflecting a more gradual energy transition and limited support mechanisms in the earlier years. Estonia stands out among smaller markets, increasing its RES share from 14.8% in 2015 to over 50% in 2024. This surge reflects a combination of biomass, wind, and solar integration, supported by favourable local policies. Overall, the table illustrates a strong West–East divide in RES development, with Western countries like Germany leading the transition, while Central and Eastern European countries are catching up more rapidly in the last few years of the observed period. The selected time period (2015–2025) was chosen to capture a full decade of market evolution, including major shifts in the energy mix, renewable energy expansion, and geopolitical influences. The starting point (2015) aligns with the EU’s post-2020 climate and energy framework and the implementation of the first Renewable Energy Directive (RED I), while the endpoint (2025) allows for an assessment of more recent developments such as the REPowerEU strategy, post-COVID demand recovery, and market reactions to the energy crisis following the war in Ukraine.
One of the key indicators of these changes is price volatility, the degree to which prices fluctuate over time. While volatility has been limited in a stable market with a high share of conventional resources, the growing share of solar and wind energy is introducing more uncertainty into the system. These resources are weather-dependent and do not have the same controllability as fossil or nuclear power plants. As a result, energy supply fluctuates more significantly in short time frames, which is directly reflected in prices.
The main drivers of increasing volatility include the following:
Fluctuations in RES generation, especially sharp changes in solar radiation and wind;
Insufficient capacity for energy storage, with excess production pushing prices down (into negative territory);
Rigidity of consumption—if demand does not match supply, the market reacts with extreme prices;
Lack of network flexibility, especially at times of high load or transmission constraints.
These phenomena are not just a technical problem of the market—they have major implications for different actors:
Producers face increased profit uncertainty;
Network operators need to address deviations and congestion more frequently;
Customers are experiencing price shocks that can be reflected in end prices.
Scientific volatility analysis is therefore a key prerequisite for modern energy management. An accurate understanding of how volatility changes over time, what causes it and how it relates to renewables provides important inputs for the following:
Design of market mechanisms;
Planning of storage capacities;
Development of demand management systems.
Energy markets are undergoing a fundamental transformation as a result of the development of renewables, and the importance of accurate analysis of electricity price developments is increasing. The academic literature relies heavily on aggregated indicators, particularly for long-term average prices, monthly or annual production averages, and captured prices for different types of resources (e.g., ‘mean capture price’ for solar). While these indicators provide a general overview, they fail to capture short-term market fluctuations, temporal patterns of market behaviour, or the growing impact of extreme events such as negative prices or excessive volatility.
This type of analytical approach therefore has several limitations: [
1,
7]
It distorts the perception of market variability as the average value masks the extent of fluctuations.
It masks the occurrence of critical market moments, such as negative prices, which have a major impact on the strategy of both producers and network operators.
It ignores temporal dimensions such as daily production and consumption profiles, which are increasingly important for a low-carbon system.
This thesis aims to bridge this research gap. The aim is to analyse disaggregated data with high temporal resolution (15 min to hourly), with an emphasis on the following:
Price volatility dynamics;
Correlations between price and renewable generation;
Occurrence and timing of negative prices;
Development of seasonal or diurnal patterns.
This approach can provide a deeper understanding of market mechanisms and provide the basis for more effective instruments of flexibility, accumulation, and regulation in energy transition.
2. Background for Own Research
The significant growth in renewable energy shares across various European countries, as illustrated in
Table 1, has been largely driven by comprehensive EU-level policies and national initiatives aimed at promoting renewable energy development. A cornerstone of this policy framework is the Renewable Energy Directive (RED), initially established in 2009 and subsequently revised to set targets that are more ambitious. The latest amendment, Directive (EU) 2023/2413, enforces a binding target of at least 42.5% renewable energy in the EU’s overall energy consumption by 2030, with an aspirational goal of reaching 45%. This directive also introduces sector-specific targets and streamlines permitting procedures to accelerate renewable energy deployment. Complementing the RED, the European Green Deal, launched in 2019, serves as the EU’s overarching strategy for achieving climate neutrality by 2050. It emphasises the decarbonisation of the energy sector, which accounts for over 75% of the EU’s greenhouse gas emissions, by promoting energy efficiency, developing a fully integrated energy market, and prioritizing the use of renewable sources. In response to the energy market disruptions following geopolitical events, the EU introduced the REPowerEU plan in 2022. This initiative aimed to reduce dependence on fossil fuel imports, particularly from Russia, by accelerating the deployment of renewable energy, enhancing energy savings, and diversifying energy supplies. Financial mechanisms have also played a crucial role. The EU Clean Industrial Deal, proposed in 2025, includes a €100 billion fund to support clean manufacturing and reduce energy costs. Key elements of this plan involve launching a €500 million pilot programme with the European Investment Bank for renewable power purchase agreements, providing a €1.5 billion package to support power grid component manufacturers, and simplifying state aid rules to facilitate clean energy investments. Collectively, these policies and initiatives have created a conducive environment for renewable energy growth, leading to the observed increases in renewable energy shares across EU member states [
8,
9].
As the share of renewable energy sources (RES) in European electricity systems grows, their impact on price dynamics—particularly on the volatility of wholesale electricity prices—is receiving more and more attention. Research in this area has been significantly updated in recent years, mainly due to a combination of geopolitical events and the increasing penetration of RES.
An IMF study [
1,
7] analyzed data from 24 European countries over the period 2014–2021 and showed that a higher share of RES has a statistically significant impact on reducing the average electricity price. However, it also identified that the effect on volatility is not clear-cut; in some quantiles, the price distribution volatility increases, while it decreases in others.
According to [
10,
11,
12,
13,
14,
15], when a certain share of RES is exceeded, there is an increase in extreme price volatility, which has major implications for the market and system operators. These fluctuations are particularly concentrated in the hours of high production from solar and wind resources, when prices can suddenly drop to negative values. They found that when a certain RES share threshold is crossed, there is a significant increase in extreme price fluctuations, especially in hours with high generation from solar and wind resources. These fluctuations can lead to negative electricity prices. Volatility remains stable at low RES shares, but volatility increases rapidly when a certain threshold is crossed, especially in hours with extreme generation. Solar energy has a stronger impact on daily price fluctuations as its production is concentrated around midday. Wind power, on the other hand, causes volatility in the evening and night hours. In most OECD countries, the incidence of negative and very low prices has increased precisely during the hours of highest RES production. This phenomenon is most present in markets with higher integration of renewables and with less consumption flexibility or insufficient storage capacity. The impact of RES on volatility is not the same in every country—it depends on the following factors:
Measures of connectivity with neighboring markets (interconnectivity);
The existence of support services;
The degree of market liberalisation and regulatory instruments.
From 2015 to 2022, overall volatility will increase by 30–50%, especially in countries such as Germany, Denmark, Spain, and Australia. This trend is directly linked to the increasing penetration of RES and changes in demand patterns. The authors recommend the implementation of dynamic pricing, flexibility support (e.g., batteries), and time-sensitive demand response as the main tools to dampen volatility. Without these measures, there is both a risk of diminishing economic returns for producers and a risk of price uncertainty for consumers.
According to a 2022 study [
16], increasing the share of RES in Europe leads to a decrease in the average price of electricity. However, the impact on price volatility is not clear. In some cases, volatility increases, in others it decreases, depending on the specific market conditions. The authors analysed 31 European countries over the period 2010–2021 and showed that the increasing share of RES (particularly solar and wind) is fundamentally changing the price dynamics in electricity markets. Solar has a significantly higher impact on intraday volatility than wind, mainly due to its concentrated production during the day. Solar energy, unlike wind energy, has clearly defined times when it can be used—PV plants do not produce at night. In contrast, wind power plants can generate electricity at virtually any time during the day. Statistically significant results show that every 1% increase in the share of RES leads to an increase of price volatility (standard deviation) from 0.4 to 0.6% on average. Countries such as Germany, Spain, Denmark, and Italy experience the highest fluctuations. Due to the lack of demand flexibility and weak energy storage infrastructure, the increasing share of renewables leads to more frequent occurrences of negative prices, especially during weekends and sunny days. Although RES reduce the long-term average energy price, they increase short-term volatility, leading to cost unpredictability for both households and businesses. Markets that are poorly interconnected (e.g., in Eastern Europe) cannot efficiently absorb production fluctuations, which results in local price extremes. Improving cross-border capacity and coordinating prices between countries appears to be a key way to stabilise the market. The authors recommend that demand flexibility, development of storage capacity (e.g., batteries), smart grids, and cross-border integration are essential pillars to mitigate volatility. Without accompanying measures, paradoxically, green transformation can reduce price stability, which reduces investor confidence and prolongs the return on investment.
A [
17] 2025 study examined the transmission of electricity price volatility between 24 European countries. They found that volatility spillovers have increased significantly after 2022, meaning that price shocks in one country are increasingly transmitted to other countries. Renewables, particularly wind and solar, contribute to unpredictable fluctuations that spread further across border interconnections. Negative ‘shocks’ from wind generation in Germany, for example, had an impact on prices in Poland, the Czech Republic, and Slovakia within 48 h. The authors also found that large downward price changes (declines) have a stronger transmission effect than upward price shocks. This has important implications for market stability and production planning. Countries with better network connectivity (e.g., Western Europe) are better able to absorb fluctuations. Conversely, countries with limited network infrastructure and divergent pricing mechanisms face greater volatility. The authors also recommended the following:
Improve the predictability of RES through more accurate prediction systems.
Invest in flexible resources and storage.
Introduce coordinated risk management policies at EU level (e.g., common capacity markets, risk insurance).
In a study published in [
18], the authors introduced the concept of the “insurance value” of renewable technologies—i.e., the ability to reduce the exposure of consumers and economies to price fluctuations. Compared to fossil resources, whose prices are linked to volatile commodities (oil, gas, coal), RES offer greater cost stability. Analysis of EU countries over the period 2008–2023 has also shown that a higher share of solar and wind power is associated with lower year-on-year volatility in household electricity prices. This effect is most pronounced in well-connected markets and where long-term investment schemes for RES are in place (e.g., CfD—Contracts for Difference). Simulation models have shown that scenarios with a high share of RES are much less likely to have extremely high prices—especially during geopolitical or commodity crises (e.g., 2021–2022 crisis). The authors also criticised the oversimplified view that RES only cause volatility. They argued that a well-designed system with the right policies (e.g., capacity markets, support for flexibility) can make RES a key instrument for price stabilization.
A study published in [
19,
20] highlights another paradox. The study shows that the expansion of renewable energy sources (RES) tends to lower wholesale electricity prices. However, this effect is overlaid by other factors such as
- -
Decommissioning of nuclear power plants;
- -
Rising coal prices;
- -
Increased electrification (e.g., electromobility);
- -
High gas prices.
Together, these factors are pushing up electricity prices, despite the growing share of RES. Models predict that wholesale electricity prices in Germany in the coming years will be significantly higher than before the energy crisis. For example, at the beginning of 2025, prices were between 94 € and 114 €/MWh, more than six times that of the pre-crisis period. The study again highlights the increasing volatility of electricity prices caused by the combination of the following:
- -
Unstable, rapidly changing RES generation;
- -
Lack of flexible resources (e.g., batteries);
- -
Inadequate infrastructure for energy transmission and storage.
These factors lead to more frequent extreme price fluctuations, including negative prices during overproduction and very high prices during shortages. High and volatile electricity prices pose a challenge for households and industries, increasing costs and reducing competitiveness. This can have negative socio-economic consequences, especially for energy-intensive industries. The authors recommend:
- -
Investment in flexible resources (e.g., battery storage);
- -
Improving energy transmission and storage infrastructure;
- -
Introducing dynamic pricing mechanisms to better reflect current supply and demand.
These measures could mitigate price volatility and ensure more stable and affordable electricity prices for all consumers.
The authors in [
21,
22,
23] developed a simplified model of New York State’s electric grid that integrates wind and solar resources to meet the state’s 2030 energy goals. The model allows analysis of how electricity generation from renewable sources varies over time and space, and to what extent it matches temporal and local patterns of electricity consumption. They found that renewables can exhibit variations of up to 17% from the annual average, while combining different sources reduces this variability to about 8%. On an hourly basis, RES variability can be up to 100% above or below average, leading to a variation in annual average electricity prices and up to a 56% increase in the number of price peaks. Annual price volatility is mainly influenced by the availability of hydropower, while daily and hourly volatility are mainly influenced by the availability of solar and wind power.
The literature review clearly shows that the impact of renewables on electricity price volatility is complex, dynamic, and dependent on a number of factors—technical, market, and regulatory. While the long-term trend suggests that RES reduce average electricity prices, their short-term variability contributes significantly to the increase in volatility, including increasingly frequent extreme spikes. This phenomenon is most pronounced during hours of high generation from solar and wind resources, when the market often responds with negative or very low prices. The literature also shows that volatility is not just a local phenomenon—it is increasingly being transmitted between countries, underlining the importance of cross-border coordination and flexibility in the energy system.
At the same time, it appears that there is no one-size-fits-all solution—the effect of RES on price stability is strongly conditioned by local characteristics of the market, grid infrastructure, and regulatory environment. At the same time, several studies underlined the need to strengthen flexibility on the consumption side, to introduce more accurate forecasting models, and to invest in energy storage as prerequisites for coping with this volatility [
24,
25,
26].
3. Research Objectives and Methodology
3.1. Research Objectives
The primary objective of this manuscript is to examine and quantify the evolution of wholesale electricity price volatility in the context of the increasing integration of renewable energy sources (RES), with particular attention to its temporal, seasonal, and inter-annual patterns. Previous research in this area has shown that, although the increasing share of RES generally leads to a decrease in the average market price of electricity, it also causes an increase in its short-term volatility, mainly due to the natural variability of generation from solar and wind sources. This increased volatility poses a significant challenge to the stability of energy markets, generation and distribution planning, as well as energy policy making.
The manuscript focuses on a detailed assessment of electricity price volatility in the day-ahead market (DAM) at different time scales—from hourly to daily to monthly—in order to identify seasonal and structural changes in price behaviour. An important part of the research is also to assess the temporal correspondence between extreme price fluctuations (including negative prices) and the intensity of generation from RES, particularly from solar and wind power plants. The highest fluctuations are assumed to occur during periods of high production from these sources, which will be the subject of separate analytical attention.
In addition to a basic analysis of volatility, the study aims to compare year-on-year trends and track how volatility has evolved over time, particularly in the period before and after the energy crisis of 2021–2022. In this way, it will be possible to address the question of whether this is a temporary phenomenon or a long-term structural change resulting from the increasing share of RES in the energy mix.
The research also includes the development of user-friendly analytical tools that allow flexible data processing and interpretation without the need for complex statistical platforms. These tools provide the ability to dynamically select and aggregate input data by energy source type, time period, or desired temporal granularity (e.g., hourly, daily, monthly). Such an approach significantly enhances the practicality of the analyses in terms of routine operational practice, whether by regulators, transmission and distribution system operators, or market analysts dealing with electricity price developments.
From a research perspective, the proposed analytical framework allows testing hypotheses about the relationships between renewable generation and price volatility over time. Thanks to the possibility of fast data aggregation and visualisation, seasonal effects, temporal patterns of extreme price fluctuations, or impacts of specific policies (e.g., flexibility support, capacity deployment mechanisms) can be efficiently identified. The tools can also be used to verify outputs from advanced models or as an entry point for further modelling (e.g., volatility prediction models, extreme price classification models).
In the field of energy policy, this approach is a way to make complex analyses accessible to a wider range of actors such as regional regulators, municipalities, or organisations monitoring the implementation of climate commitments. This allows policy makers to better assess the effectiveness of measures taken, analyse the risks associated with shortfalls or overproduction of RES energy, and design targeted interventions for specific periods or regions based on real data.
The potential for cross-border comparisons is also an important aspect. Thanks to the easy customisability of the input data, the tools can be applied to different countries or regions and compare how price volatility varies depending on the type of energy mix, the regulatory framework, or the degree of market interconnection. Such comparisons are particularly valuable in the design of harmonised European policies aimed at reducing price uncertainty in a period of increasing RES share.
3.2. Research Questions
The increasing integration of renewable energy sources (RES) into electricity systems in Europe is changing the pricing characteristics of wholesale electricity markets. Although there is a large body of research examining the impact of RES on the average electricity price, less attention has been paid to analysing their impact on price volatility, with an emphasis on detailed time granularity and regional differences. In this context, there is a need for a deeper analysis of short-term price fluctuations, their temporal distribution, and links to generation from specific types of RES.
Therefore, the central question of the present research is to investigate how electricity generation from RES affects short- and medium-term price volatility in the daily electricity market. Particular attention is paid to the identification of time periods in which high production from solar or wind resources and low, possibly negative, wholesale prices occur simultaneously. The aim is to investigate whether these phenomena are random or are systematic patterns that can be quantified and, if so, what production thresholds lead to the onset of extreme volatility.
At the same time, the ambition of the research is to see to what extent these relationships change across countries and time horizons. An important area of interest is also the predictive power of historical and meteorological data, which could help to estimate the occurrence of price extremes in hours of predicted high RES generation. In this way, the research aims at identifying patterns that can serve as a basis for designing market or regulatory mechanisms to mitigate volatility, thus responding to the real needs of market participants, system operators, and energy policy makers.
3.3. Research Hypotheses
Based on previous studies, literature search, and preliminary data analyses, it is possible to formulate several hypotheses that will be tested in the proposed research. The present scientific research is based on the assumption that the increasing share of electricity generation from renewable sources—particularly solar and wind—has a fundamental impact on the market dynamics in the daily wholesale market. Based on the analysis of previous studies, the continuous processing of historical data and the current developments in European power systems, the following hypotheses were formulated:
Hypothesis 1 (H1). It is assumed that there is a systematic negative relationship between hourly generation from wind and solar resources and the price of electricity that is statistically significant and replicable across multiple countries and time periods. Hours with high RES generation are expected to experience a decrease in market price, with this effect being most pronounced in countries with higher penetration of variable resources.
Hypothesis 2 (H2). It is assumed that there is a threshold level of combined wind and solar generation beyond which the probability of price extremes, especially negative ones, increases significantly. This non-linear dynamic should be identifiable by frequency analysis and segmentation of the data by production intervals. The effect is also expected to depend on the season and time of day.
Hypothesis 3 (H3). The predictive ability of simple linear trends between daily RES generation (solar and wind) and electricity price is assumed to vary significantly between years. In years with extreme price developments (e.g., during an energy crisis) or with an increasing share of RES, the value of the coefficient of determination R2 is expected to be higher, while in stable years the relationship is expected to be weak or statistically insignificant. The analysis of annual regression models should reveal the temporal variability of the predictive power of these relationships.
Hypothesis 4 (H4). Significant regional differences in the impact of RES generation on price volatility are assumed to exist, conditioned by the degree of system flexibility and the interconnectedness of individual national markets. Countries with better developed flexibility measures (e.g., accumulation, demand management, cross-border exports) are expected to show lower volatility even at comparable levels of RES generation.
Hypothesis 5 (H5). We believe that it is possible to statistically identify predictive patterns of negative price incidence based on a combination of production and time factors. It is assumed that multivariate analysis (e.g., regression models and decision rules) can be used to identify rules such as “if RES generation exceeds a certain threshold during a weekend in the summer, the probability of negative prices is XX%”. These prediction schemes can serve as a basis for developing pricing strategies and optimising trading behaviour in the daily market.
3.4. Methodology Used
Given the complexity of the relationship between renewable energy sources (RES) and electricity price development, as well as the diversity of market and system factors (e.g., consumption flexibility, cross-border interconnections, seasonality of demand), a multi-level methodological strategy was chosen in this paper. This strategy combines quantitative time series processing, multiple regression analyses, correlation modelling, and segmentation approaches based on the identification of threshold effects. The analysis also includes cross-country comparisons, taking into account structural differences in power systems.
The analysis is based on historical data for selected Central and Western European countries, with high temporal resolution (15 min and hourly data) on electricity prices, wind and solar generation, residual load, meteorological variables (sun, wind, temperature), and consumption. The data have been aggregated into daily and monthly profiles, allowing intraday, seasonal, and inter-annual effects to be examined.
In the first stage, basic statistical indicators of prices were calculated, including mean, minimum, maximum, and standard deviation. These metrics were also evaluated in year-on-year and month-on-month comparisons. Subsequently, a multi-year regression analysis was performed to model the evolution of electricity prices in relation to daily RES production. Regression models were built for individual years and for several combinations of input variables (Solar, Wind, Wind + Solar), while R2 values were also evaluated as an indicator of the quality of the models and their predictive ability.
An important part of the methodology was a segmentation analysis of the occurrence of negative prices depending on the level of RES production. The generation was divided into output bins and, for each bin, the probability of negative prices was determined, thus identifying the so-called threshold effects. For this purpose, rule schemes were also created to formulate conditions leading to a high probability of extreme prices (e.g., “on a summer weekend when generation > X MW, the probability of negative prices is Y%”). These rules were derived from empirical distributions without the use of machine learning.
Furthermore, correlation matrices between the variables (wind generation, solar generation, residual load, and price) have been calculated—both for the whole period and for individual years—allowing the assessment of the temporal stability of the relationships. The cross-country comparative analysis was based on a comparison of volatilities, outliers and correlations between countries with different levels of demand flexibility, storage technologies, and interconnections with neighbouring markets.
The entire analytical apparatus has been implemented in an environment that supports transparency, replicability, and a high degree of parameterisation, allowing for easy extension of the analyses to other variables or countries. A summary overview of the analytical tools used, their research objective, outputs, and assignment to each hypothesis tested is presented in
Table 2.
3.5. Description of Input Data and Data Sources
The research is based on a detailed dataset covering several European countries with a high share of renewable energy sources (RES). The input data (
Table 3) includes time series of electricity prices (Day-Ahead Auction Prices) as well as generation values from individual sources (PV, wind, nuclear, and fossil). Complementary variables are environmental factors such as air temperature, wind speed, and the intensity of direct solar radiation, which have a direct impact on RES generation.
The data have a high temporal resolution (in the range of 15 min to 1 h), which makes it possible to capture short-term fluctuations in prices and output. In particular, official sources such as national operating grids (e.g., ENTSO-E Transparency Platform), aggregated market portals, as well as publicly available datasets with environmental and meteorological data are used. The temporal scope of the data covers the last 8 to 10 years, with a particular focus on periods with a significant increase in the share of RES (e.g., 2022–2024). The data are preprocessed and structured in a uniform format, allowing dynamic analysis, filtering by months and source types, as well as aggregation by time levels (hourly, daily, monthly). Emphasis is placed on the representativeness of the input data for the countries of interest and consistency across variables.
This data analysis is key to quantifying price volatility, modelling trends, analysing the occurrence of outliers (e.g., negative prices), and assessing relationships between sources. Given the structure of the data, it is possible to replicate the same methodology to other regions or to extend the analysis to other factors (e.g., energy imports/exports, support services, etc.).
4. Analysis and Interpretation of Results
The analytical processing of the data was aimed at verifying the stated hypotheses and answering the research questions through a combination of descriptive statistics, regression methods, correlation calculations, and visualisation tools. Emphasis was placed on the high temporal resolution of the input data (15 min and hourly intervals) and its consistent treatment across the countries and time periods analysed.
The aim was to identify trends in the volatility of wholesale electricity prices, their relation to the growing share of renewable energy sources, as well as to map the occurrence of extreme price events (including negative prices). The outputs presented include quantitative indicators (e.g., average volatility, regression coefficients, R2 values, correlation coefficients) as well as graphical outputs, allowing for a visual capture of the identified patterns.
The results are arranged to correspond with the formulated hypotheses H1–H5 and reflect the relevant links between price dynamics and renewable electricity generation, demand, and external conditions. Each subsection also includes a discussion of the practical implications of the identified phenomena in the context of electricity policy and market operation.
4.1. Year-on-Year Dynamics of Electricity Price Volatility
Electricity price volatility is now becoming one of the key indicators of market stability and risk, especially in the context of the increasing integration of variable renewable energy sources (RES). A comparative analysis of average price volatility (in EUR/MWh) has been carried out for six European markets: Germany (GE), France (FR), Poland (PL), Slovakia (SK), Czech Republic (CZ), and Estonia (ES) for the period 2015–2025.
Between 2015 and 2020, most countries showed relatively stable volatility in the range of around EUR 6 to 15/MWh. The exceptions were Poland and Estonia, where values were significantly higher in the early years, which may be related to lower interconnection with surrounding markets and lower consumption flexibility.
From 2021 onwards, a sharp increase in volatility can be observed in all countries analysed. In 2022, average daily volatility reaches record highs—up to 59.37 EUR/MWh in Slovakia, 56.39 in Germany, and up to 72.81 EUR/MWh in Estonia. This increase is closely related to geopolitical events (particularly the energy crisis after the invasion of Ukraine), the significant volatility of fossil fuel prices, and the ongoing expansion of RES without adequate flexibility mechanisms.
While there is a slight decline in volatility in 2023 and 2024, values remain significantly higher than before 2021. In 2025, a slight increase reappeared in some countries, which may reflect continued structural tensions in the supply–demand balance.
The findings confirm the conclusions from the literature [
1,
2,
3,
4] that
Once a certain share of RES is exceeded, there is an increase in extreme price volatility. Most countries have introduced support mechanisms for building RES.
The impact of volatility depends on the degree of connectivity with surrounding markets, the availability of storage, and the ability to flex demand.
These results point to the need to implement flexibility-enhancing tools, such as battery storage, dynamic demand management, or more accurate prediction systems. Long-term volatility without accompanying measures can jeopardise the investment climate, increase risk for consumers, and worsen the operating conditions of electricity systems.
The evolution of the year-on-year volatility is shown in
Table 4, where it is clear that 2022 represents the most significant break in all the regions analysed.
Percentage analysis of year-on-year changes in electricity price volatility (
Figure 1) shows significant variability in dynamics over time and across countries. In the initial years (2015–2020), changes were relatively moderate, moving mostly within ±20%. Exceptions are cases of sharp declines such as −45.1% in Poland between 2016 and 2017 or, conversely, increases such as +62.6% in Slovakia between 2016 and 2017. These fluctuations are likely to reflect specific local factors—e.g., changes in generation patterns or fluctuations in electricity demand.
The year 2021 brought a dramatic turning point, with volatility rising by more than 130% year-on-year in all countries surveyed due to geopolitical and market tensions, with increases of more than 159% in Germany and 185.2% in France. These developments clearly document the onset of a period of extreme market volatility.
In 2022, the volatility is even more pronounced, with increases in Poland and more than in France, Slovakia, the Czech Republic, and Estonia. This confirms that the crisis was multi-year and systematic, and not a one-off blip.
In contrast, 2023 and 2024 brought a gradual moderation of volatility, although values remained well above pre-2021 levels. In some countries (e.g., Poland in 2024: +56.4%), volatility rose again, suggesting a possible return of cyclical volatility.
In conclusion, percentage changes in volatility are a useful indicator for detecting both market shocks and longer-term trends. The significant increases in 2021–2022 create a clear dividing line between the stable pre-crisis period and a new era of increased price volatility.
4.2. Dependence of the Occurrence of Negative Prices on RES Generation
The analysis was based on the calculation of the proportion of hours, with negative electricity prices (%) depending on the sum of the output of wind and solar resources, which were divided into intervals of 100 MW. The hourly values were aggregated in some cases from 15 min data. The output is the relative proportions of negative prices in each power interval. The objective of this section was to analyse the relationship between hourly aggregated generation from renewable energy sources (RES)—specifically wind and solar—and the occurrence of negative electricity prices in the daily market. The generation was divided into power intervals and, for each interval, the proportion of hours in which a negative price occurred was calculated. The analysis was carried out for six selected European countries—Germany, France, Poland, Slovakia, the Czech Republic, and Estonia.
4.2.1. Germany: Quadratic Growth and Breaking Point—Figure 2
An analysis of the relationship between aggregated hourly generation from renewable energy sources (wind and solar) and the occurrence of negative wholesale electricity prices on the daily market in Germany showed a systematic and non-linear dependence. Germany, as Europe’s largest economy and at the same time one of the leaders in the integration of RES, provides a good case for analysing the impacts of high penetration of fluctuating sources in the electricity system. The resulting graph shows that at low levels of RES cogeneration (up to about 60,000 MW), the incidence of negative prices is negligible, with values close to 0%. In this band, the market absorbs renewable production without a significant price response, indicating the presence of sufficient regulatory capacity, surplus exchange possibilities, or demand flexibility. After a threshold of about 65,000 MW is crossed, significant non-linearity occurs, with the proportion of hours with negative prices starting to increase sharply. This dynamic is even more pronounced in the 195,000 MW band, where the incidence of negative prices gradually approaches 100%. The resulting dependence is quadratic, with each additional increase in output associated with a disproportionately higher risk of negative prices. This non-linear nature suggests that the electricity system reaches a regulatory limit at a certain capacity band, after which it can no longer absorb excess generation without significant price distortions. The high incidence of negative prices for generation above 170,000 MW is likely due to a combination of several factors:
Limited flexibility of basic resources (e.g., coal, nuclear)—shutdown of nuclear power plants. Negative prices mostly start to emerge in 2023.
Capacity limits on cross-border transmission lines that make it impossible to export surplus power.
Lack of demand response or absence of consumption systems for surplus (e.g., Power-to-X technologies).
Asymmetry between the geographical distribution of production and consumption, leading to internal transmission constraints (re-dispatch). Re-dispatch (or generation realignment) is a process used in the electricity industry to deal with situations where electricity cannot be transported from where it is generated to where it is consumed due to congestion on the transmission system.
The results show that Germany is at a stage where the sheer amount of generation from RES is enough to create recurrent distortions in electricity prices. Negative prices lose the character of exceptional events and become a normal concomitant of surplus RES generation. In terms of methodology, this section demonstrates the effectiveness of the analysis to locate power bands with extreme occurrences of negative prices. In contrast to the average monthly or annual price analysis, this method allows a more precise identification of critical points of power stress.
Germany is at an advanced stage of energy mix transformation, but the results of the analysis suggest that without adequate flexibility elements (storage, demand response, export capacity), the system will increasingly run into price anomalies. This trend may undermine Germany’s investment strategy and market stability. The results thus point to the need for a redefinition of market rules and complementary mechanisms that will allow a high share of RES to be managed efficiently without disturbing the price equilibrium.
Figure 2.
Share of negative price in % in Germany.
Figure 2.
Share of negative price in % in Germany.
Analysis of the French market reveals a markedly different pattern of negative price incidence depending on the hourly combined generation from vintage and solar resources. In contrast to Germany, where a strong and systematic non-linearity was observed, the French case shows a more multidimensional and less predictable pattern of occurrence of negative prices, while the dependence itself is less clear-cut. In most generation bins in the range 0 to around 10,000 MW, the share of hours with negative prices remains very low (up to 0.5%), which shows the high capacity of the French system to absorb variable generation from RES in the low to medium ranges without market distortions. Only after the threshold of around 8500 MW is there a more marked increase, with peaks in the 12,000–17,000 MW bands, where the share of negative prices increases by up to 4–5%. The occurrence of negative prices occurs in several isolated power bands, sometimes without continuity or discontinuity, which may indicate that the occurrence of negative prices in France is not exclusively determined by the level of RES generation.
The diversity of results in France is related to several specificities of its energy system:
France has a strong presence of nuclear power plants, which generate most of its electricity. However, it is not easy to quickly adapt their output to current demand. If solar or wind generation is added, which cannot be accurately predicted, it can create a surplus of electricity in the short term.
Another factor is that France does not have such a high volume of immediate electricity exports, so excess generation often remains in the country.
Compared to other countries such as Germany, France has a smaller share of solar and wind resources. Therefore, the total amount of energy produced from these sources tends to be lower, which reduces the likelihood of surpluses.
France, on the other hand, has slightly better conditions for adapting consumption. For example, by using heat pumps, electric heating or automatic consumption control in public buildings.
Negative electricity prices in France do not arise regularly or systematically. Rather, they are exceptional situations that occur, for example, on weekends when demand is lower or when electricity exports abroad are temporarily not working. They can also be caused by sudden surpluses in wind or solar generation in certain parts of the country, such as Occitanie or Nouvelle–Aquitaine. This is also why negative prices sometimes occur at unexpected times, outside the main trends. The analysis shows that it is not possible to simply predict the occurrence of negative prices in France on the basis of the amount of electricity generated from renewable sources alone. It is much more likely to be a combination of several factors—such as overall consumption, the set-up of nuclear plants, problems in the transmission system, and the ability to export electricity out of the country.
Figure 3.
Share of negative price in % in France.
Figure 3.
Share of negative price in % in France.
4.2.3. Poland: Intermittent Growth and Stable Extremes—Figure 4
In Poland (
Figure 4), the impact of renewable energy sources (especially wind) on the occurrence of negative prices has been gradual but increasingly evident over the period analysed. Until 2021, these phenomena were very rare or completely absent, but after 2022, they start to appear prominently at higher levels of RES production—especially above the 12,000 MW threshold of combined solar and wind production.
The Polish electricity system is undergoing a transformation. On the one hand, the share of wind power plants is increasing (especially in the northern regions of the country). On the other hand, the grid is still facing limits in transmission capacity and flexibility of consumption. As a result, when RES production increases (especially on weekends or holidays with low consumption), surplus situations can occur, resulting in negative spot market prices. A characteristic feature of the Polish market is the strong dominance of coal and the slower integration of flexible mechanisms—such as battery storage, demand-side management, or export capacity. This makes the system more vulnerable to sudden fluctuations in supply. In contrast to Germany, where negative prices appear even at intermediate levels of RES generation, this phenomenon is concentrated only at extreme production peaks in Poland.
The results of the research suggest that Poland is fast approaching the point at which negative prices will become more common—especially if the construction of wind and solar farms continues without corresponding grid upgrades. It is therefore important to monitor developments not only in absolute terms, but also in the context of RES integration policy, pricing, and cross-border flows.
Figure 4.
Share of negative price in % in Poland.
Figure 4.
Share of negative price in % in Poland.
4.2.4. Slovakia: Low Values but Linear Trend—Figure 5
In the case of Slovakia, the phenomenon of negative prices has started to manifest itself especially in the last three years, and its occurrence corresponds to the increasing share of renewable energy sources (RES) in combination with limited flexibility of consumption and transmission networks. The highest incidence of negative prices has been observed at levels of combined solar and wind generation exceeding 300 MW, corresponding to peaks of generation during sunny weekends or holidays with low demand. While negative prices were virtually unknown in Slovakia during the 2015–2020 period, they appear more frequently in 2021–2025. Slovakia’s electricity mix has long been characterised by a high share of nuclear power, complemented by hydroelectric plants and a growing but still relatively small share of wind and solar resources. However, the key factor is not only the size of the RES share, but their peak production combined with limited consumer flexibility. Slovakia has a limited ability to export surplus energy in real time, which increases the likelihood of negative prices during peak periods. As in other Central European countries, the Slovak market faces challenges of insufficient storage capacity and limited development of flexible technologies. In addition, lower levels of digitalisation of consumption (e.g., smart metering) hinder effective demand-side management.
A methodology based on a cross analysis of RES cogeneration power bands and the occurrence of negative prices showed that the risk bands for Slovakia range between 13,000 and 18,000 MW. Within these ranges, the incidence of negative prices, although still relatively low, is clearly increasing. This trend suggests that the Slovak market is approaching a threshold beyond which negative prices will become more frequent. The results for Slovakia suggest the need for a proactive approach to market flexibility, such as investment in storage, digitisation of consumption, and the introduction of tariff incentives for consumption in times of surplus (e.g., cheap charging of EVs on sunny days).
Figure 5.
Share of negative price in % in Slovakia.
Figure 5.
Share of negative price in % in Slovakia.
4.2.5. Czech Republic: Significant Fluctuations and Repeated Extremes—Figure 6
The results (
Figure 6) for the Czech Republic show a clear increase in the incidence of negative electricity prices in recent years, especially in cases where the cumulative generation from renewable sources (solar and wind) exceeds 5500 MW. This phenomenon has been most pronounced since 2021 and corresponds to the overall trend of increasing price volatility in Central Europe.
Power interval analysis shows that once a certain threshold level of combined solar and wind generation is exceeded, the probability of negative prices increases significantly. For example, ranges from 12,000 MW onwards already show a consistent occurrence of extremely low prices, including negative values.
The Czech electricity system has long relied on generation from nuclear and coal-fired power plants, which provide stable baseload power, but with low flexibility. However, the rapid growth of generation from solar plants, especially in the summer months, combined with limited storage infrastructure, leads to surplus energy during peak daily generation. Unlike some neighbouring countries, the Czech Republic has not yet implemented demand-side management or dynamic end-user pricing on a large scale. This means that the market has a limited ability to respond flexibly to supply surpluses, which increases the likelihood of negative prices.
The methodology used, based on a cross analysis of production bands and the frequency of negative prices, confirmed that the occurrence of extreme prices in the Czech Republic is not random, but systematically linked to the combined high values of solar and wind production. The results show that while in the lower power bands (up to 4000 MW), the occurrence of negative prices was negligible, in the bands above 5000 MW, a more systematic occurrence of negative prices is starting to appear. This trend is most pronounced in 2022 and 2023, which were also marked by a high share of renewable generation and lower demand during the spring and summer months.
The findings for the Czech Republic suggest that the market has reached a level where, without the introduction of additional measures (e.g., flexible appliances, storage, real-time cross-border trading), the incidence of negative prices will continue or even increase. This trend may jeopardise the economic return of investment in renewables and reduce price stability for consumers.
It is crucial for market stabilisation to
Introduce flexible price signals to incentivise consumption in times of surplus;
Strengthen storage capacities (e.g., battery storage);
Deepen cross-border cooperation with Germany and Slovakia, which face similar challenges.
Figure 6.
Share of negative price in % in the Czech Republic.
Figure 6.
Share of negative price in % in the Czech Republic.
4.2.6. Estonia: Small Market but Sensitive Response
The graph for Estonia (
Figure 7) shows a clear dependence of the share of negative prices on the combined production of wind and solar resources. Although the range of capacities is considerably smaller than in the other countries analysed (maximum ~1000 MW), negative prices appear relatively frequently in certain bands. The share of negative prices increases significantly between 400 and 700 MW, peaking in the 700–800 MW band, where negative prices accounted for more than 7% of the cases. This increase may be due to a combination of low demand, limited system flexibility and occasional surpluses at times of low load. In the bands above 800 MW, there is a sudden drop in the share of negative prices to zero, which is probably not related to market stabilisation, but rather to the low data sample (specifically, only 9 times)—i.e., such generation values occurred rarely or not at all during the period analysed.
Estonia has limited generation and transmission capacity, which means that even a modest increase in RES production may hit system limits. Low export volumes and less connectivity to larger markets mean that surpluses from RES have to be mostly consumed in Estonia. Even for a small market like Estonia, an increase in RES generation may be associated with an increased risk of negative prices. The results show that already at 700–800 MW there is significant price pressure, indicating low system flexibility and the absence of effective mechanisms to smooth out surpluses. This case highlights the importance of local flexibilities, cross-border interconnections and active demand management to absorb fluctuations in RES generation without price extremes.
The research results show that the extent of negative electricity prices is strongly correlated with the extent of generation from renewable sources, namely wind and solar. In large systems with high absolute RES production, such as Germany and Poland, there is a significant increase in the probability of negative prices when a certain capacity threshold is exceeded. In the case of Germany, this threshold is situated at around 65,000 MW, while above 195,000 MW the share of negative prices is already as high as 100%. A similar effect, albeit with different dynamics, is observed in Poland. Conversely, in smaller systems such as Slovakia or Estonia, negative prices arise even at significantly lower capacities (as low as 300 MW). Another important observation is the shape of the relationship between generation and the occurrence of negative prices. In the case of Germany, we observe an exponential increase, indicating a strong non-linear load on the system in times of high surplus. In contrast, Slovakia and Estonia, as small and less complex systems, exhibit either a monotonically increasing trend (Slovakia) or a steep increase (Estonia).
4.3. Correlation Links Between Individual Production Sources and Residual Load
The increasing penetration of renewable energy sources (RES) is fundamentally changing the short-term dynamics of wholesale electricity markets and leading to a change in electricity price volatility. In order to better understand these mechanisms, this section focuses on the analysis of the correlation between the main renewable generation variables—solar generation, wind generation and residual load—and the wholesale electricity price. The correlation analysis is performed on time series with hourly or 15 min resolution over the period 2015 to 2025 and includes six countries with different levels of renewable integration and market interconnectedness. Correlation coefficients are calculated separately for solar generation, wind generation and residual load in relation to electricity prices, allowing a detailed assessment of the impact of each resource. A table with the correlation values for the whole period under study is shown in
Table 5. The specific years and their comparison are described in the individual
Section 4.3.1,
Section 4.3.2,
Section 4.3.3,
Section 4.3.4,
Section 4.3.5 and
Section 4.3.6. These outputs provide empirical evidence on how variable generation affects market prices, what role residual load plays in stabilising or in price fluctuations, and what differences exist between countries depending on their structural and regulatory conditions. These insights contribute to a deeper understanding of the challenges associated with RES integration and provide a basis for designing effective strategies to increase the flexibility and stability of energy markets.
4.3.1. Analysis of the German Market
Germany, as the country with the most advanced RES integration in Europe, represents a key case study country for studying the structural links between RES generation, pricing and residual load. The overall correlation analysis provides a consistent picture of the negative relationships between renewable generation and electricity market prices.
The negative correlations between wind power and residual load (r = −0.49), as well as between wind and price (r = −0.41), suggest that increased wind generation significantly reduces the need for conventional generation (residual load) while also leading to a decrease in the market price of electricity. This relationship has become even stronger over the years, with the correlation between wind and residual load reaching −0.62 in 2025.
Solar shows weaker but still negative links to both prices and residual load (r = −0.16 and −0.09, respectively). A more pronounced drop in the correlation is noticeable especially from 2020 onwards, when the Solar/Residual Load correlation reaches values as high as −0.42 (2024), which is related to seasonal surpluses in the summer months when demand is low. The strong positive correlation between residual demand and price (r = 0.82) underlines the importance of conventional resources for price stabilisation—the larger the difference between demand and RES generation (i.e., higher residual load), the higher the price. In 2015–2018, the structure of the relationships is relatively stable. However, from 2019 onwards, there is a deepening of negative correlations between RES and prices, which is a consequence of the increasing saturation of the grid with RES generation. For example, the Wind/Price correlation reaches as high as −0.57 in 2022. Similarly, the Solar/Price correlation gradually declines to −0.39 in 2025.
4.3.2. Analysis of the Fracture Market
The French electricity system is characterised by a high share of nuclear power and a relatively low penetration of wind and solar compared to a country like Germany. This structure is also reflected in the correlations between RES generation, residual load and electricity prices.
Overall, correlations between wind and other variables are low:
- -
Wind/Residual Load: r = +0.07
- -
Wind/Price: r = −0.10
The weak positive correlation of wind with residual load suggests that wind generation in France only moderately affects residual load. This effect can be attributed not only to the limited capacity of wind power plants, but also to the dominance of stable nuclear generation, which minimises the impact of short-term changes in wind conditions on the demand for other resources. The negative but weak correlation between wind generation and prices confirms that the impact of wind on pricing is limited and less pronounced than in countries with higher RES penetration.
Correlations with solar generation are even weaker:
- -
Solar/Residual Load: r = −0.09
- -
Solar/Price: r = −0.04
The weak negative correlation between solar generation and residual load shows that solar generation has some, but small, direct effect on the decline in the need for conventional generation. The correlation between solar and electricity prices is almost zero and even goes positive in some years (e.g., in 2022 Solar/Price = +0.08), which may be due to specific seasonal or meteorological conditions.
The most significant and consistent relationship is the correlation between residual load and electricity price:
- -
Residual Load/Price: r = +0.58 (total)
This relationship is expected as higher residual demand increases the need to deploy more expensive resources and hence prices. However, in some years there is a decrease in this relationship (e.g., in 2022 Residual Load/Price = +0.15), which may be related to increasing network flexibility, more cross-border flows or changes in demand patterns.
Between 2023 and 2025 there is a significant change in correlation patterns:
- -
Wind/Solar: r = −0.19 (2023), r = −0.18 (2024), r = −0.18 (2025)
- -
Wind/Residual Load: r = −0.18 (2023), r = −0.09 (2024), r = −0.43 (2025)
- -
Wind/Price: r = −0.34 (2023), r = −0.19 (2024), r = −0.42 (2025)
The negative correlations between wind and residual load, as well as between wind and price, are deepening during this period. In particular, there is a sharp increase in the absolute value of the negative correlation in 2025 (Wind/Residual Load = −0.43; Wind/Price = −0.42). This trend suggests an increasing influence of wind on the decline in residual demand and prices, which may be due to faster wind capacity development, technological changes or enhanced flexibility of the electricity system.
Also significant is the deepening negative correlation between solar generation and price in 2024 and 2025:
- -
Solar/Price: r = −0.34 (2024), r = −0.35 (2025)
This development shows that solar generation is also starting to have a more noticeable impact on market prices, especially during sunny hours with low demand.
4.3.3. Analysis of the Polish Market
The Polish electricity system in the analysed period is characterised by a dynamic development of renewable energy sources, especially wind power. Nevertheless, market pricing remains closely linked to the development of residual load. The impact of solar generation has only become more significant in recent years, from 2020 onwards.
The average correlation between wind and price was −0.135, indicating that as wind generation increases, prices fall—a typical effect for heavily subsidised and prioritised connected RES. However, this relationship is volatile over time—it was strongest between 2022 and 2024 (e.g., 2023: r = −0.468), which is related to the increase in installed wind capacity in northern regions and its more frequent spillover into surplus.
Data on solar generation is only available from 2020 onwards, reflecting the later development of this technology in Poland. Since then, the Solar/Price and Solar/Residual Load correlations are slightly negative, but their value (e.g., in 2024: r = −0.32 to −0.47) shows that solar generation is starting to have a dampening effect on prices, especially in summer months with low demand.
The Residual Load/Price correlation is strong throughout the period (r = +0.56 overall), peaking in 2019 and 2025 (r = +0.78 to +0.90). This consistent link reflects that electricity prices in Poland are still largely shaped by the classical equilibrium mechanism between available conventional generation and consumption, net of RES.
The correlation Wind/Solar = +0.005 indicates that these sources are not seasonally or diurnally aligned—which is to be expected, given the different climate profiles.
In Poland, wind power plays a key role and has already been a major price influencer, especially in recent years. Solar generation has been negligible for a long time, but after 2020 it starts to become statistically significant, especially in terms of the risk of negative prices in the summer months. Residual load remains the main determinant of market price, reflecting a market structure still oriented towards conventional resources.
4.3.4. Analysis of the Slovak Market
The Slovak electricity system is characterised by a low share of wind resources, therefore the available correlations are limited to the relationships between solar generation, residual load and prices. Despite this limited data structure, the research results provide important insights into the market sensitivity to solar energy and the structural factors influencing price dynamics.
The overall Solar/Price correlation is +0.0738, which is a very weak positive correlation. This means that increased production from solar is not consistently associated with a decrease in prices—on the contrary, in some cases there is even a slight increase. The year-on-year development of the correlation shows large fluctuations, e.g., in 2017: +0.122, in 2024: −0.358. These changes suggest that in some years solar generation occurred at times of higher demand, thus not reducing prices, or that its impact was overshadowed by other conventional sources that met a significant amount of demand, namely nuclear, coal, and hydro.
The overall Solar/Residual Load correlation is −0.0034, indicating no systematic link. This confirms the hypothesis that Slovak solar generation is low (little installed capacity), concentrated for a few hours a day (around noon) and not synchronised with changes in demand.
In some years the correlation is positive (e.g., 2021: +0.061), in others negative (2025: −0.075), confirming the low integration of solar energy into the system in terms of demand balancing. On the other hand, the year 2025 is not yet complete.
The Residual Load/Price correlation is +0.61 (overall), which is a moderate to strong positive relationship. The results suggest that prices in Slovakia are dominated by residual demand, i.e., the demand for conventional resources net of RES. This link is very strong in 2015–2020 (e.g., 2019: +0.708), weakens in 2021–2022 (e.g., 2022: only +0.0877), may indicate higher price volatility from external factors (e.g., imports, market uncertainties, fuel costs).
In Slovakia, the impact of solar generation on prices is marginal and lacks the ability to systematically influence residual load. The electricity market is heavily dependent on traditional demand-based pricing for conventional generation, which is typical for systems with low RES penetration.
4.3.5. Czech Market Analysis
In the case of the Czech Republic, correlation analyses between the main variables show several significant trends related to market dynamics and the integration of renewables. The correlation between wind and solar generation is consistently negative throughout the period under consideration, with an overall Pearson correlation coefficient of approximately −0.165. This result suggests that higher wind generation generally corresponds to lower solar generation and vice versa. However, this effect is relatively modest, which is consistent with the seasonal and diurnal variation in the production profiles of these resources.
The relationship between wind generation and residual load shows a slightly positive correlation (on average about +0.12), which is an interesting result since in most of the other countries analysed this relationship was negative. This phenomenon can be explained by the specificities of the Czech market, where wind power accounts for only a small share of total generation and often occurs during periods of higher overall demand, such as cold months.
The correlations between wind generation and electricity prices are mostly negative (−0.27 on average), suggesting that increased wind generation tends to push wholesale prices down. This effect is strongest in 2022 (−0.44), which corresponds to a period of higher market volatility. In the case of solar generation and residual load, the correlation is consistently negative (around −0.13), while the relationship between solar generation and electricity prices is very weak and slightly positive on average (+0.03). This suggests that solar generation has a less pronounced price-setting effect than wind in the Czech Republic.
The relationship between residual load and electricity price shows the highest stability and consistency, where the Pearson coefficient reaches approximately +0.55 in the long-term average. This strong positive relationship is in line with expectations, as residual demand reflects the need to cover consumption from conventional sources that have higher marginal costs, which directly affects pricing.
Also notable are the year-to-year fluctuations in these correlations, with the negative impact of wind generation on price amplified in recent years (especially 2023 and 2024), while the correlation between residual load and prices weakens. This development may be an indicator of increasing market dynamics caused by higher RES variability, but also by increased reliance on cross-border flows.
From the results of the research it can be concluded that the Czech electricity market has a structure where renewables, in particular wind and solar, play a secondary role in pricing for the time being. However, the evolution over time indicates a gradual increase in the influence of RES on the market dynamics, especially in the last years of the analysed period.
4.3.6. Analysis of the Estonian Market
In the case of Estonia, the correlation analysis shows interesting and, in some respects, different results compared to the other markets studied. The values of the Pearson correlation coefficient indicate weak to moderate relationships between the variables analysed.
Considering the overall analysis over the entire period (2015–2025), it appears that wind generation (Wind) has a very weak negative correlation with solar generation (Solar) (−0.056) and with residual demand (residual load) (−0.139), reflecting the low degree of synchronisation of generation between these resources. The correlation between wind generation and electricity price is also low (−0.125), indicating that the impact of wind on pricing is relatively limited in Estonia.
Solar generation (Solar) shows a very weak negative correlation with residual load (−0.031), while the relationship between solar generation and electricity price is only slightly positive (0.055). This result is contrary to expectations and is probably related to the low absolute share of solar in the Estonian energy mix, which minimises its ability to influence prices.
On the other hand, residual load shows a stable and relatively strong positive correlation with electricity price (0.580), which is consistent with the assumption where higher residual load pushes up electricity prices.
When analysed year-on-year, there is significant variability. In 2015–2019, correlations between RES generation and prices were generally low or insignificant. However, we observed some interesting changes in the period 2020–2025. In 2023 and 2024, the negative correlations between solar generation and residual load deepen significantly (up to −0.687 in 2024), signalling that there is a significant decline in the need for traditional resources in periods of high solar generation.
At the same time, the negative correlation between solar generation and price is increasing, although it remains relatively small. This may indicate an incipient influence of solar power on price dynamics, which is not yet dominant.
Wind generation maintains a consistently weak relationship with the other variables, but the negative correlation between wind and electricity prices deepened in 2025 (−0.343), which may be due to increased wind capacity.
Overall, the analysis confirms that in the Estonian electricity system RES plays only a minor role in pricing so far. The dominant factor remains the residual load, which has a stable positive correlation with price. The results thus show that despite the gradual development of RES, their ability to dampen or induce price volatility is still relatively small in Estonia during the period under review.
4.4. Extreme Price Dynamics: Highs and Lows
Electricity price fluctuations are significantly influenced not only by RES generation, but also by the dynamics of extreme events such as daily price peaks and troughs. This section focuses on the characterisation of the evolution of maximum and minimum prices over the course of the day, month, and year, with particular attention on their relationship with the intensity of RES generation and the daily profile of solar radiation and wind conditions. The aim is to identify systematic patterns in the timing and intensity of the extremes across different geographical areas and seasons.
The analysis is based on hourly or 15 min data and uses quantitative indicators such as the range of prices during the day (the difference between the maximum and minimum), the frequency of occurrence of outliers in specific time windows, and statistical characteristics of the price distribution. These indicators make it possible to assess the non-linear effects of variable production on price dynamics and to identify periods of increased risk of extreme fluctuations.
The results presented in this section offer an empirical basis for a better understanding of the mechanisms leading to the emergence of extreme prices and provide valuable information for the design of market strategies, the optimisation of resource flexibility, and the design of support mechanisms under conditions of high RES penetration.
A scientific analysis of the maximum and minimum electricity prices in the European countries studied between 2015 and 2024 reveals significant changes in the range of daily price volatility, with the most extreme values recorded during the energy crisis in 2022. The scientific treatment of the data shows that prior to 2022, the absolute daily difference between the minimum and maximum price was relatively stable, ranging from around 100 to 180 €/MWh. The lowest price spread values identified by this study were recorded between 2015 and 2019: in Germany 179.7 €/MWh (2015), in France 123.5 €/MWh (2015), in Poland 113.97 €/MWh (2019), in Slovakia 121.7 €/MWh (2016), in the Czech Republic 110.0 €/MWh (2015), and in Estonia 127.1 €/MWh (2017). These scientific results reflect the stability of market conditions before the onset of significant external shocks.
In terms of scientific analysis, 2022 represents a major turning point, with a sharp increase in peak prices and total daily price spreads in all markets analysed. The scientifically processed data shows extreme peak prices in France (2989 €/MWh), Germany (2325 €/MWh), and Estonia (4000 €/MWh). Significant increases in volatility were also evident in Poland (754.7 €/MWh), Slovakia (910.2 €/MWh), and the Czech Republic (893.5 €/MWh). These results clearly confirm the impact of a number of concurrent factors, including the military conflict in Ukraine, the disruption of natural gas supplies, escalating commodity prices, and growing market uncertainty. Compared to previous years, the measured differences represent a several-fold increase in maximum daily price fluctuations, a scientifically significant phenomenon.
Further scientific analysis of post-2022 developments suggests that although most markets are showing signs of stabilisation, volatility remains at a significantly higher level than before the COVID-19 outbreak. In Germany, the second-highest daily price difference was identified in 2023 (1024 €/MWh), with volatility escalating again in 2024 to 2461 €/MWh. Similar trends were scientifically confirmed in France, where increased volatility was already observed in 2021 (686 €/MWh). Slovakia and the Czech Republic recorded the second-highest absolute price differences in 2024 (996 €/MWh and 983 €/MWh, respectively). In Estonia, despite a decline after the extreme peak in 2022, the difference in 2024 remains at an extremely high level (1916 €/MWh), confirming the persistent market instability.
The scientific results of this analysis (
Table 6) show that electricity price volatility in Europe after 2022 has reached a new, significantly higher base level. Although there has been some reduction in absolute differences for some countries after 2022 compared to the peak of the crisis, markets remain much more volatile than in previous periods. This trend points to a sustained increase in the risk of price extremes, which can be explained scientifically by a combination of geopolitical factors, increasing integration of variable renewables, lower availability of traditional back-up capacity, and changes in market participants’ behaviour.
The results of the scientific research confirm that the magnitude of the daily price fluctuation in the European countries surveyed shows a clear upward trend over the period 2015–2025. While the absolute daily difference between the minimum and maximum electricity price was relatively stable and ranged from around 100 to 180 €/MWh between 2015 and 2019, there is a clear increase in volatility after 2020. This trend increases significantly in 2022, which represents a tipping point due to the impact of geopolitical events, particularly the war in Ukraine, and related fundamentals. After this peak, volatility in 2023 and 2024, although slightly lower than after the start of the war, remains well above pre-crisis levels. Thus, the scientific analysis clearly shows that the magnitude of the daily price volatility increases systematically over the period under review.
In terms of the impact of energy mix on the occurrence of price extremes, the research results suggest that countries with a higher share of renewables exhibit more pronounced price extremes. Germany and Estonia, as markets with a higher degree of integration of solar and wind generation, achieved the largest absolute daily price differences in the period analysed, with a peak in Estonia in 2022 of up to 4000 €/MWh. It should be said, however, that this peak did not occur more than once. Germany showed similarly high values in 2022 and 2024, which was due to the impact of variability in renewable electricity generation. In contrast, markets such as Poland, Slovakia, and the Czech Republic, where the share of renewables is significantly lower, did experience increased volatility, but the absolute values of the fluctuations remained relatively lower. It should be noted, however, that price extremes in 2022 were significant in all countries, regardless of the structure of their energy mix, indicating the strong influence of factors such as gas prices, fuel availability, or the geopolitical situation. Scientific results suggest that a high share of renewables increases the likelihood of higher electricity price volatility.
4.5. Regression Analysis of Price Trends
Following previous analyses of price volatility and outliers, a regression analysis of electricity price development over the time horizon from 2015 to 2025 was carried out separately. The aim of the research was to identify long-term trends in price behaviour and their possible link to seasonal or structural changes in electricity markets, especially in the context of increasing penetration of renewables. For each year separately, a linear regression of the average electricity price was performed, looking at the regression line (indicating a rise or fall in price) and the coefficient of determination R2 (assessing the quality of the model). The results of the regression models provide important information for testing Hypothesis H5. They also allowed a more comprehensive assessment of whether the increasing variability of RES production leads to stronger or, on the contrary, more subdued trends in different seasonal periods. The regression analysis was carried out to quantitatively model long-term trends in average electricity prices and to detect possible seasonal variations in market dynamics.
4.5.1. Results of the Daily Regression Analysis
The selection of variables in the regression analysis was based on both theoretical foundations and practical considerations reflecting the functioning of electricity markets. The main objective was to examine how the increasing share of renewable energy generation—specifically from solar and wind sources—affects the development of electricity prices. Therefore, in the simple linear regression model, the independent variable was the daily generation from renewables—specifically solar, wind, and combined solar + wind sources. This choice reflects the crucial role of these technologies in price formation due to their near-zero marginal costs, high variability, and limited predictability, all of which directly influence short-term price levels and volatility. The dependent variable was the average daily electricity price on the day-ahead market, which is highly sensitive to changes in renewable output and reflects their impact on market equilibrium. Each regression resulted in a regression equation expressing the trend and a coefficient of determination (R2), which indicates the extent to which price variability can be explained by the chosen type of RES generation. This approach allows for a quantitative comparison of the influence of different RES types on prices across countries and over time.
In addition to assessing the quality of the models, special attention was paid to the sign of the regression line directive, which indicates whether there is a long-run increase or decrease in electricity prices in a given month over the period analysed. A positive directive with a sufficiently high R2 would indicate a systematic price increase, while a negative directive would indicate a long-term downward trend in prices, potentially associated with an increased share of renewables and market dynamics.
Given the structural changes in the electricity sector, including the 2022 energy crisis, the regression results were also interpreted in the context of contingencies that may have affected the linear trends. The results of the regression analysis (In
Appendix A) show different trends in the average generation from solar and wind sources in the countries analysed over the period 2015–2025.
In the case of Germany, very stable values of the regression guidelines close to zero were observed in the Solar category, with very low R2 values (mostly below 0.1), which suggests the absence of a systematic trend in solar generation. In contrast, generation from wind and the sum of Solar + Wind showed slightly higher R2 values, reaching as high as 0.4–0.5 in some years (e.g., combined Wind + Solar generation in 2025: R2 = 0.518), indicating a moderate trend. This suggests that coordinated renewable generation is gradually increasing in Germany.
In France, the trend lines were in most cases characterised by a slightly negative Solar directive and very low R2 values, indicating weak and statistically insignificant trends. More significant trends were observed in the combined Wind + Solar category, where the R2 value reached up to 0.437 in 2025, indicating a slightly systematic dynamics of production growth or decline.
In the case of Poland, data for solar generation was not available for 2015–2019, but wind generation and combined solar/wind generation showed relatively moderate trends in later years. For example, the combined generation in 2023 had R2 = 0.419, indicating a clear trend in the change in generation. This trend mainly reflects the increasing integration of wind farms in Poland during the last decade.
Slovakia shows significantly weaker trends than other countries, with most models showing very low R2 values (<0.1) and very small or fluctuating directives. The only exception is 2020, where a directive of −0.0075 and a relatively higher R2 = 0.237 was identified in solar production, which may indicate a transient structural change in production or consumption behaviour.
In the Czech Republic, relatively low R2 values have been observed for stand-alone sources (Solar, Wind), but in the case of Wind + Solar combined generation, R2 values have been higher, especially in recent years (e.g., 0.344 in 2025). These results suggest that although solar and wind generation alone do not show significant trends, their combined effect is statistically stronger.
In the case of Estonia, overall generation trends have been very weak, with most R2 values below 0.1. The exception is in recent years, particularly 2025, where combined Wind + Solar generation has reached R2 = 0.407, indicating incipient structural changes in generation dynamics.
Overall, the combination of wind and solar generation (Wind + Solar) shows more systematic trends than the individual sources alone. The results of the regression analysis support the assumption that with increasing integration of RES, there is more organisation and predictability of production profiles, although the extent of this effect varies significantly between the countries analysed. Significant trends are found particularly in countries with high levels of renewable investment and infrastructure flexibility.
4.5.2. Interpretation of Regression Analysis Results
In order to evaluate the predictive power of simple linear trends between daily renewable generation and wholesale electricity price, an analysis of the evolution of annual values of the coefficient of determination for R2 was performed. This metric was calculated for each calendar year and separately for wind, solar, and combined generation, providing insights into the year-to-year variability in model quality.
The results show significant differences between years and countries. For example, the R2 for wind generation for Germany in 2025 was 0.351, while in 2018, it was only 0.283. In the case of combined Wind + Solar generation, R2 rose above 0.5 in some years, indicating an increasing degree of explanation of price variability precisely through the combined impact of both technologies. In contrast, in countries with lower RES penetration, such as Slovakia or Estonia, R2 remains low in most years (e.g., only 0.075 for solar generation in Slovakia in 2025), confirming the weaker structural link between generation and pricing.
These results support Hypothesis H3, according to which the predictive power of simple trend models varies over time and is related to structural changes in energy systems and to specific market events.
5. Hypothesis Testing and Discussion
This chapter presents the main empirical findings of the research and systematically tests the five research hypotheses formulated in
Section 3.3. The analyses are based on multi-year data of selected European electricity markets and are structured in line with the analytical methods described in
Section 3.4. Each subchapter corresponds to a specific hypothesis or a combination of them and examines the impact of renewable energy generation (RES) on the price level, volatility, the occurrence of extreme events, and the predictability of market behaviour. Cross-country comparisons allow for identifying systemic differences resulting from different levels of RES integration and consumption flexibility.
5.1. Testing Hypothesis H1
Proof of Hypothesis 1 (H1). In hours with high generation from solar and wind resources, there is a systematic decrease in the market price of electricity and an increase in price volatility. □
The results of the analyses show that increased generation from renewable sources—mainly wind and solar—is associated with a decrease in average electricity prices and a concomitant increase in their short-term volatility. This effect has been particularly observed in countries with high RES penetration (e.g., Germany, Estonia), where significant price fluctuations, including negative prices, have been observed during 2022 and 2024. At the same time, during periods of high demand and low RES generation (e.g., winter 2021), average prices were found to increase significantly, indicating a strong link between variable supply and market equilibrium.
This behaviour of markets is consistent with Hypothesis H1, which is supported by available data across multiple countries and time periods.
5.2. Testing Hypothesis H2
Proof of Hypothesis 2 (H2). Once a certain level of RES production is exceeded, price volatility increases and outliers become more frequent. □
A year-on-year analysis of the daily price spread (the difference between the maximum and minimum price) showed a significant break in 2022, when all the countries studied experienced a sharp increase in both prices and their daily fluctuations. While before 2022, price spreads were in the range of around 100–180 €/MWh, during the crisis year 2022, they rose to 900–4000 €/MWh. In Germany and Estonia, these extremes were most pronounced, while in countries with lower RES integration, the fluctuations remained more moderate.
These results show that price volatility increases not only in the absolute sense but also in the frequency of occurrence of outliers, thus empirically confirming the validity of Hypothesis H2.
5.3. Testing Hypothesis H3
Proof of Hypothesis 3 (H3). The predictive power of simple trends between RES generation and electricity price varies significantly between years and is higher in periods of market volatility. □
The regression analyses, which were carried out separately for each year and each country, showed that the coefficient of determination R2 varies significantly between years. In Germany, R2 for wind and combined generation reached values above 0.4 in some years (e.g., 2025), while in stable years (e.g., 2018), it is below 0.2. In countries with lower RES penetration, R2 values are generally low, indicating weaker predictive power of these simple models.
Increased R2 values during 2022 and 2024 in some countries (e.g., Poland, France) indicate that the market is more sensitive to RES variability in times of crises or increased load. These results are in line with Hypothesis H3, which is therefore considered to be confirmed.
5.4. Testing Hypothesis H4
Proof of Hypothesis 4 (H4). Countries with higher levels of consumption flexibility or greater cross-border interconnection capacity exhibit weaker RES-price correlations or lower volatility. □
The correlations between solar and wind generation, residual load, and electricity prices vary across countries and over time. In countries such as France and Poland, the negative correlations between wind and price deepen in 2023–2025, while in countries with a more flexible system structure (e.g., Germany, where large export/import volumes and high interconnectivity are combined), these links are weaker or more stable. In Slovakia and the Czech Republic, correlations are in the weak to insignificant range.
These findings support Hypothesis H4 and suggest that the structure of the system, particularly its flexibility, affects the sensitivity of prices to fluctuations in RES generation.
5.5. Testing Hypothesis H5
Proof of Hypothesis 5 (H5). Negative prices occur primarily when the combined RES generation exceeds a certain threshold at a specific time (e.g., weekend afternoons), and this phenomenon is deterministically predictable. □
Clear patterns were identified by analysing the occurrence of negative prices as a function of hourly solar and wind generation, month, and day of the week. In Germany, Estonia, and France, negative prices regularly appear during spring and summer weekend afternoons when combined RES generation is high and demand is low. In countries like Slovakia, these phenomena are rare and do not show a stable pattern.
The rules developed (e.g., “if solar + wind generation is >35 GW on Saturday between 13:00–15:00, probability of negative prices > 30%”) provide a practical and interpretable basis for decision making by market actors. These results clearly confirm Hypothesis H5.
6. Discussion
The results presented in this research paper confirm that the increasing integration of renewable energy sources (RES) into European electricity systems is fundamentally changing the dynamics of wholesale electricity prices. The verification of Hypothesis H1 showed that higher hourly generation from solar and wind sources leads to a systematic decrease in the market price, while at the same time increasing short-term volatility. This relationship was most pronounced in countries with high levels of variable generation, such as Germany and Estonia, while it was less pronounced in countries with lower RES penetration.
The year-on-year price spread analysis (Hypothesis H2) revealed a significant increase in volatility after 2021, with a spike in peak prices and extreme daily differences in 2022. These changes cannot be explained only by the increase in RES, but also by the effect of external fundamentals, particularly geopolitical crises and gas market tensions. The results show that while variable RES generation contributes to increased price volatility, the occurrence of extreme price extremes (year 2022) is primarily influenced by a combination of external factors such as geopolitical events and the like.
Regression analyses performed separately for each year (Hypothesis H3) showed that the predictive power of the relationship between RES generation and price is not stable. In years marked by crises, the relationship between RES generation and electricity price has been shown to be stronger and more predictable, as confirmed by the higher values of the R2 coefficient. On the contrary, during stable years, the predictive accuracy of the regression models was lower, indicating that this relationship changes over time, depending on market conditions.
The correlation analysis (Hypothesis H4) revealed significant regional differences in the interaction between RES, residual load, and electricity price. Stronger negative correlations between RES generation and price were observed, especially in Germany and France, while in countries with less market flexibility, these links were weaker. The observed differences point to the importance of the regulatory environment, the availability of storage capacity, and the ability of the system to absorb variable generation.
An analysis of the incidence of negative electricity prices as a function of the level of generation from solar and wind resources confirmed the existence of repeatable generation thresholds, beyond which the probability of negative market prices increases significantly. This relationship was most pronounced in countries such as Germany and France, where the proportion of negative values increased sharply at high combined RES production volumes. The results show that the occurrence of extremely low prices is not random but related to a clearly quantifiable dominance of renewable generation over consumption. This empirical dependence allows the formulation of practically applicable decision rules for market operators and producers. The results therefore support the validity of Hypothesis H5.
The observed non-linear relationship between renewable energy generation and the occurrence of negative electricity prices is the result of a combination of technical, market, and regulatory factors. In lower output ranges, the system typically has sufficient tools to absorb the generated energy—whether through dispatchable generation, exports to neighbouring grids, or limited demand-side flexibility. However, once a certain production threshold is exceeded (e.g., approximately 65,000 MW in Germany), these balancing mechanisms gradually become saturated.
From a technical perspective, conventional power plants (e.g., nuclear or coal-fired) often have limited ramping capabilities and high costs associated with shutdown and restart operations. As a result, they remain in operation even during periods of electricity surplus. At the same time, the ability to export excess electricity to neighbouring countries is constrained, for instance, by the physical capacity of transmission infrastructure.
If the system is unable to absorb surplus production through exports, increased consumption, or generation curtailment, prices begin to fall sharply. In extreme cases, they fall into negative territory; producers become willing to “pay to produce”, either due to technical constraints or because they are incentivised by subsidies (e.g., guaranteed purchase schemes, feed-in tariffs, or contracts for difference).
This price response is not linear, as the marginal utility of each additional megawatt of RES generation decreases once absorption capacity is exceeded. The result is a quadratic or even exponential increase in the frequency of negative prices beyond a certain tipping point. This non-linear effect is particularly pronounced in systems with
- -
Weak storage infrastructure;
- -
Low demand-side flexibility;
- -
Regulatory barriers that prevent rapid generation curtailment and demand response.
For these reasons, the relationship between RES generation and negative price occurrence differs across countries. In smaller and less interconnected systems such as Estonia or Slovakia, negative prices appear at relatively low generation levels (300–800 MW) due to very limited export capacity. In contrast, in France—where nuclear power plays a dominant role and the share of RES is moderate—such events are less systematic and depend on a combination of several variables (e.g., demand levels, export conditions, and grid configuration).
Overall, the non-linear linkage between RES output and negative prices represents a structural consequence of the energy market transformation. It highlights the need to strengthen system flexibility, develop intelligent demand-side management, expand cross-border trading capabilities, and improve the prediction of risk periods associated with high RES output.
From a scientific point of view, these results point to the need for more research into the non-linear and threshold relationships between RES supply and market behaviour. At the same time, the scientific results support the case for systematically increasing system flexibility and better planning of regulatory interventions. This paper contributes to deepening the understanding of how variable generation shapes market risks under conditions of increasing RES penetration.
7. Conclusions and Policy Recommendations
The results of this research demonstrate that the growing integration of renewable energy sources (RES), particularly wind and solar generation, significantly affects electricity price dynamics in the European day-ahead wholesale market. High-resolution data from the period 2015 to 2025 revealed systematic relationships between RES generation intensity, the occurrence of extreme price events (including negative prices), and year-on-year changes in the predictive power of statistical models. The findings confirm that the relationship between hourly RES generation and electricity prices is clearly negative in several countries. This supports Hypothesis H1. The strongest effects were observed in Germany and Poland, where the correlation coefficients between wind generation and price reached −0.57 and −0.47, respectively, during years with a high share of renewables.
Hypothesis H2, which assumed the existence of a threshold level of RES generation beyond which the likelihood of extreme prices sharply increases, was also confirmed. In Germany, for instance, negative prices began to appear frequently once the combined RES output exceeded 65,000 MW, and in ranges above 195,000 MW, the share of hours with negative prices approached 100%. This non-linear trend indicates that the system reaches structural limits under certain conditions, resulting in a breakdown of price equilibrium. The analysis of annual regression models confirmed Hypothesis H3: In crisis years such as 2022, the coefficient of determination (R2) increased significantly, meaning that the relationship between RES generation and electricity prices becomes more predictable during periods of market stress.
Hypothesis H4 was confirmed through comparison between countries with different levels of system flexibility. Nations such as France, which benefit from higher demand-side responsiveness or stronger interconnections with neighbouring markets, showed lower price volatility at comparable levels of RES generation compared to more isolated countries such as Estonia or Slovakia. The final Hypothesis H5, concerning the statistical identification of predictive patterns for negative price events, was also validated. Using segmented production intervals, it was demonstrated that the combination of high RES output with temporal factors (e.g., summer weekend afternoons) significantly increases the probability of negative prices.
These findings confirm that electricity price volatility is becoming a feature of evolving generation mixes. This transformation calls for fundamental changes in energy policy and market design. It is essential to strengthen system flexibility through targeted investments in energy storage technologies, support for flexible consumption (e.g., dynamic pricing schemes), and expansion of cross-border transmission capacity. Regulators should also introduce tools that allow market participants to proactively identify risk periods with a high likelihood of price extremes. This may include the mandatory publication of short-term RES generation forecasts, the implementation of adaptive auction mechanisms, and the development of shared European capacity reserves.
The findings of this study are consistent with previous research that highlighted the correlation between increased RES penetration and greater price volatility, including more frequent occurrences of extreme pricing. For example, Schittekatte and Meeus in [
27] emphasised the need to reform market mechanisms as price signals increasingly decouple from underlying costs due to zero-marginal cost generation. Similarly, [
27,
28] reported over 200 h of negative prices in Germany in 2020, which aligns with our observed frequency of negative pricing above 195,000 MW of RES generation.
From a market perspective, such dynamics present significant investment uncertainty and challenge the functioning of existing pricing frameworks. These results reinforce the need for flexibility-enhancing capacity mechanisms, real-time retail pricing, and possibly curtailment policies for subsidised generators during overproduction periods. The association rules derived in this study (e.g., weekend + high RES → negative price) could support early-warning systems for system operators and traders, enhancing market stability. Furthermore, the fact that negative prices occur even at modest RES levels in smaller markets (e.g., Estonia, Slovakia) underscores the importance of cross-border cooperation and shared balancing resources, as already recommended by recent Rosslowe, et al. 2025 and ENTSO-E (2023) reports [
28,
29].
Moreover, the manuscript demonstrates that political support for RES deployment must be intrinsically linked with infrastructure development and regulatory mechanisms that mitigate associated effects such as increased price volatility. The green transition is not only a technological challenge but also a structural test for existing market mechanisms. Therefore, volatility analysis and the prediction of extreme price events should become a standard component of RES policy evaluation and part of the evidence base for decision making by all electricity market stakeholders.


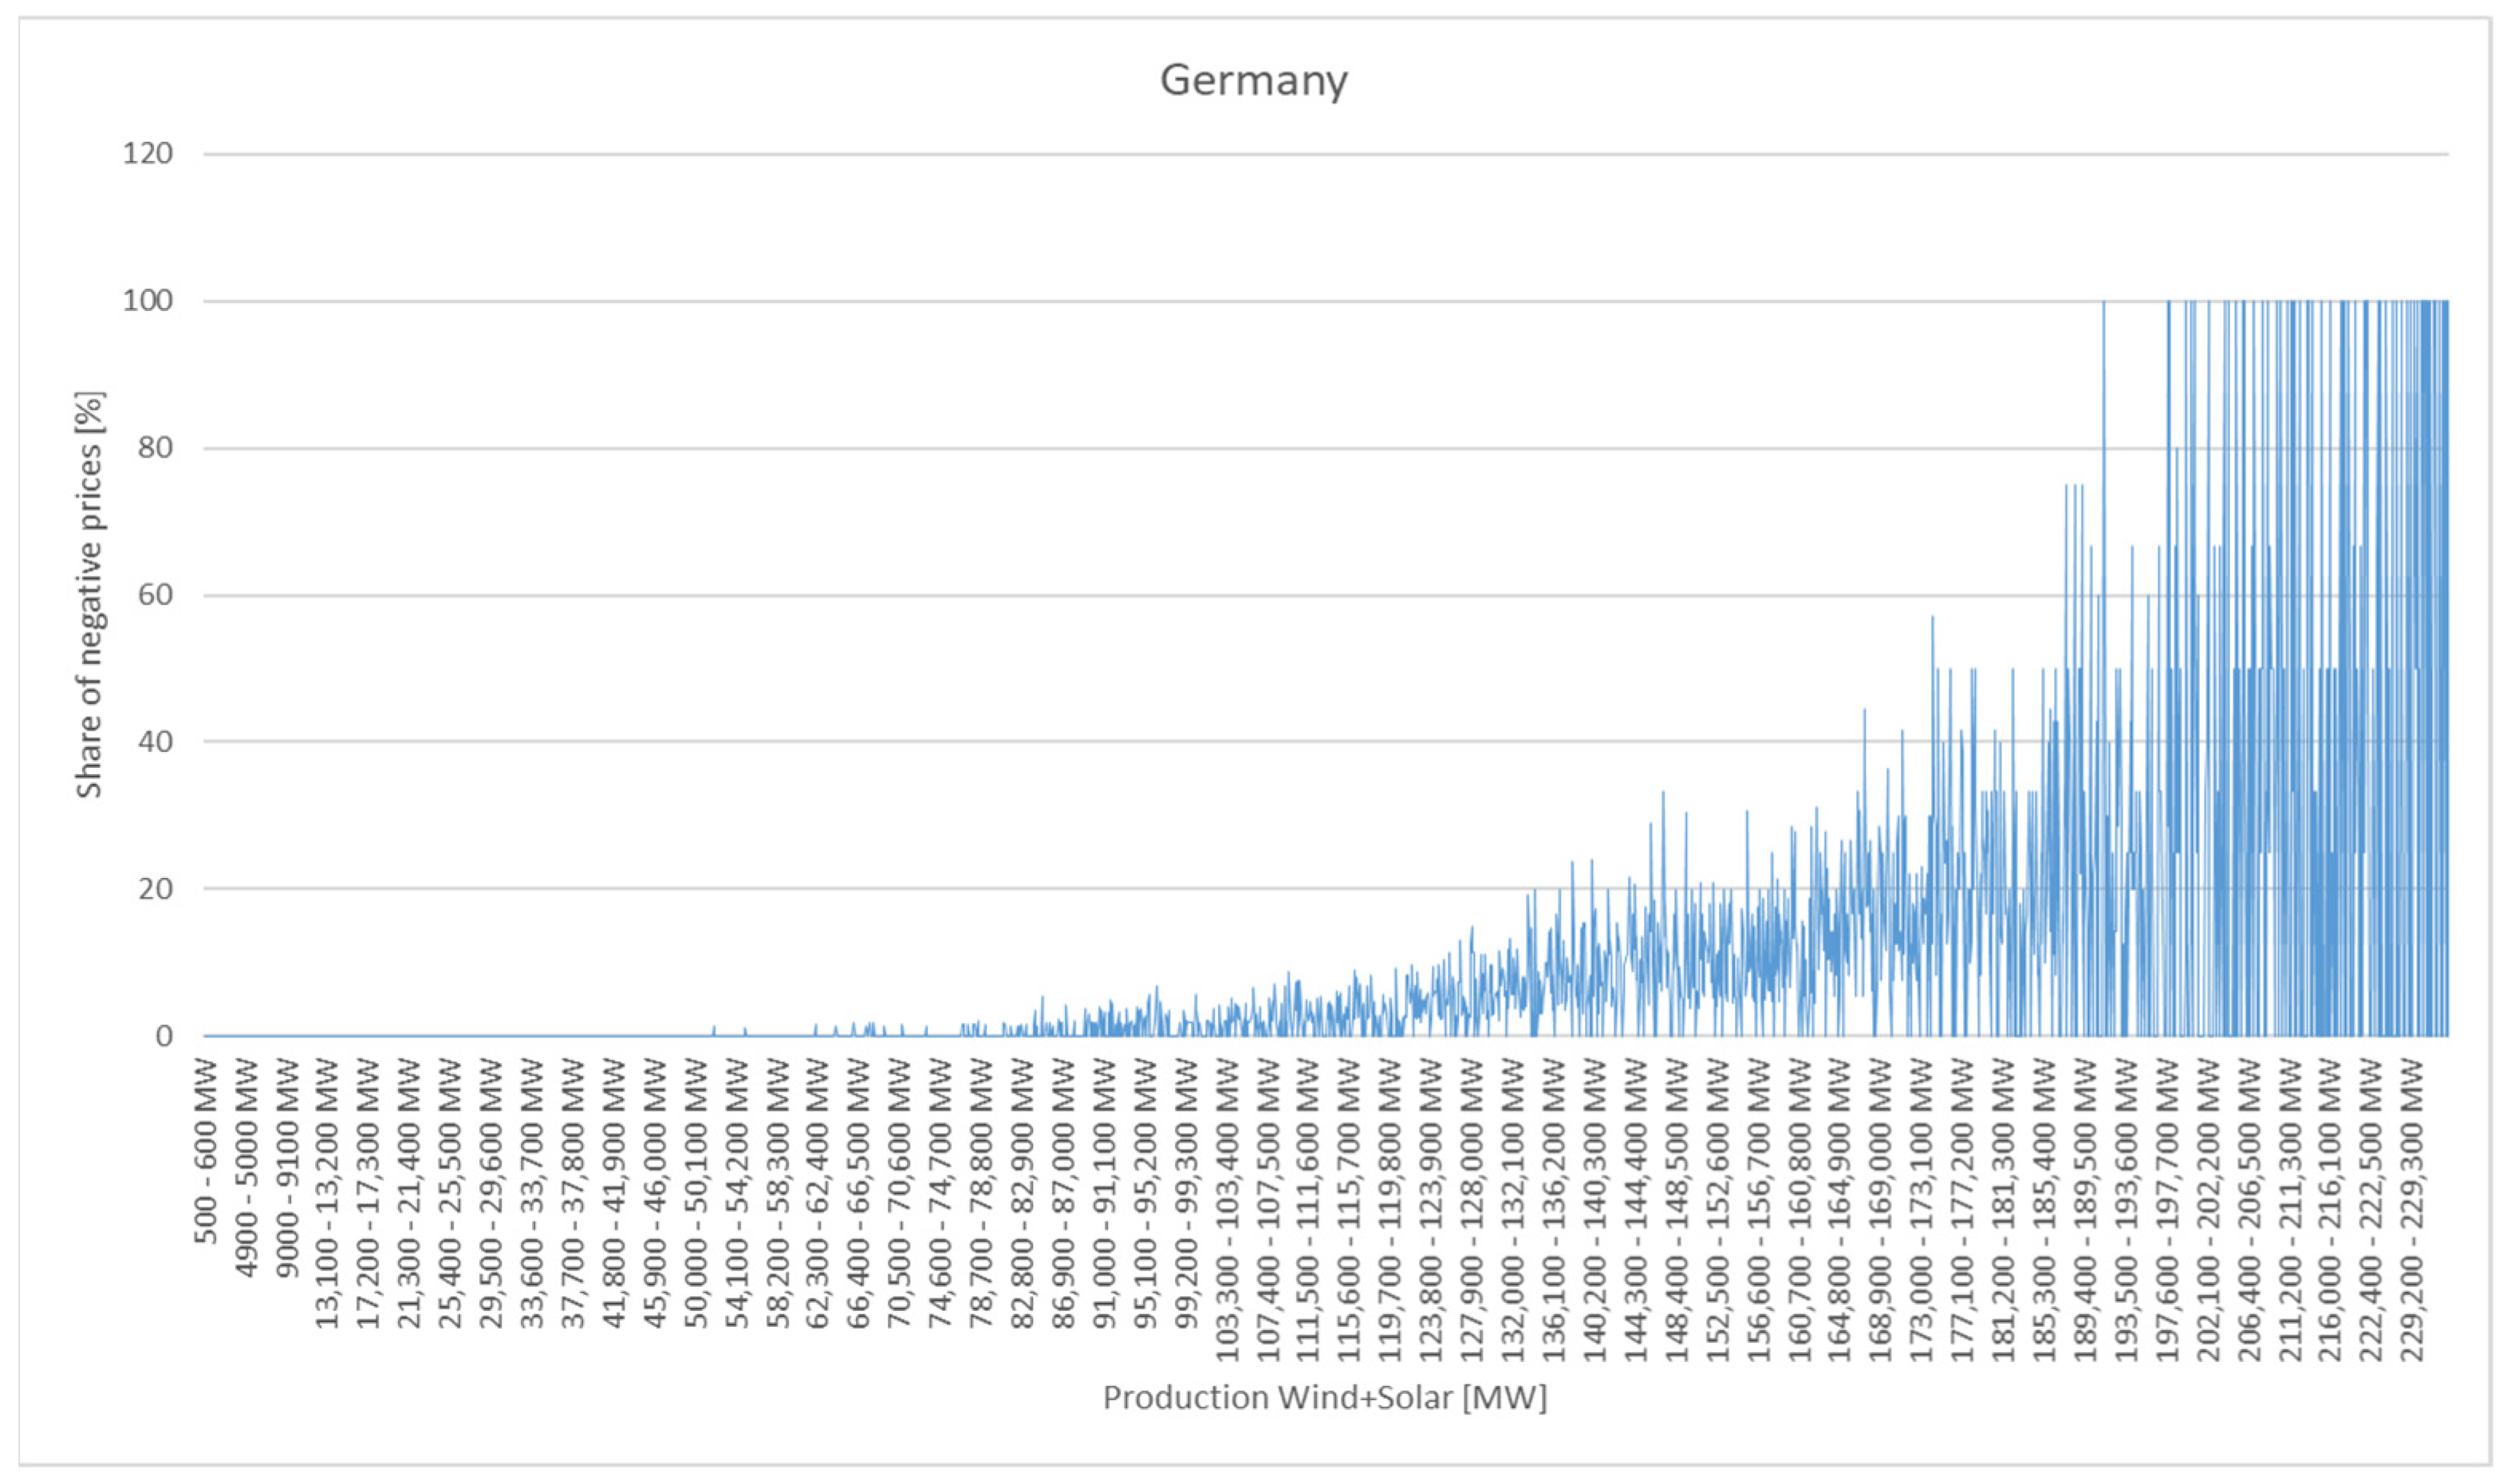
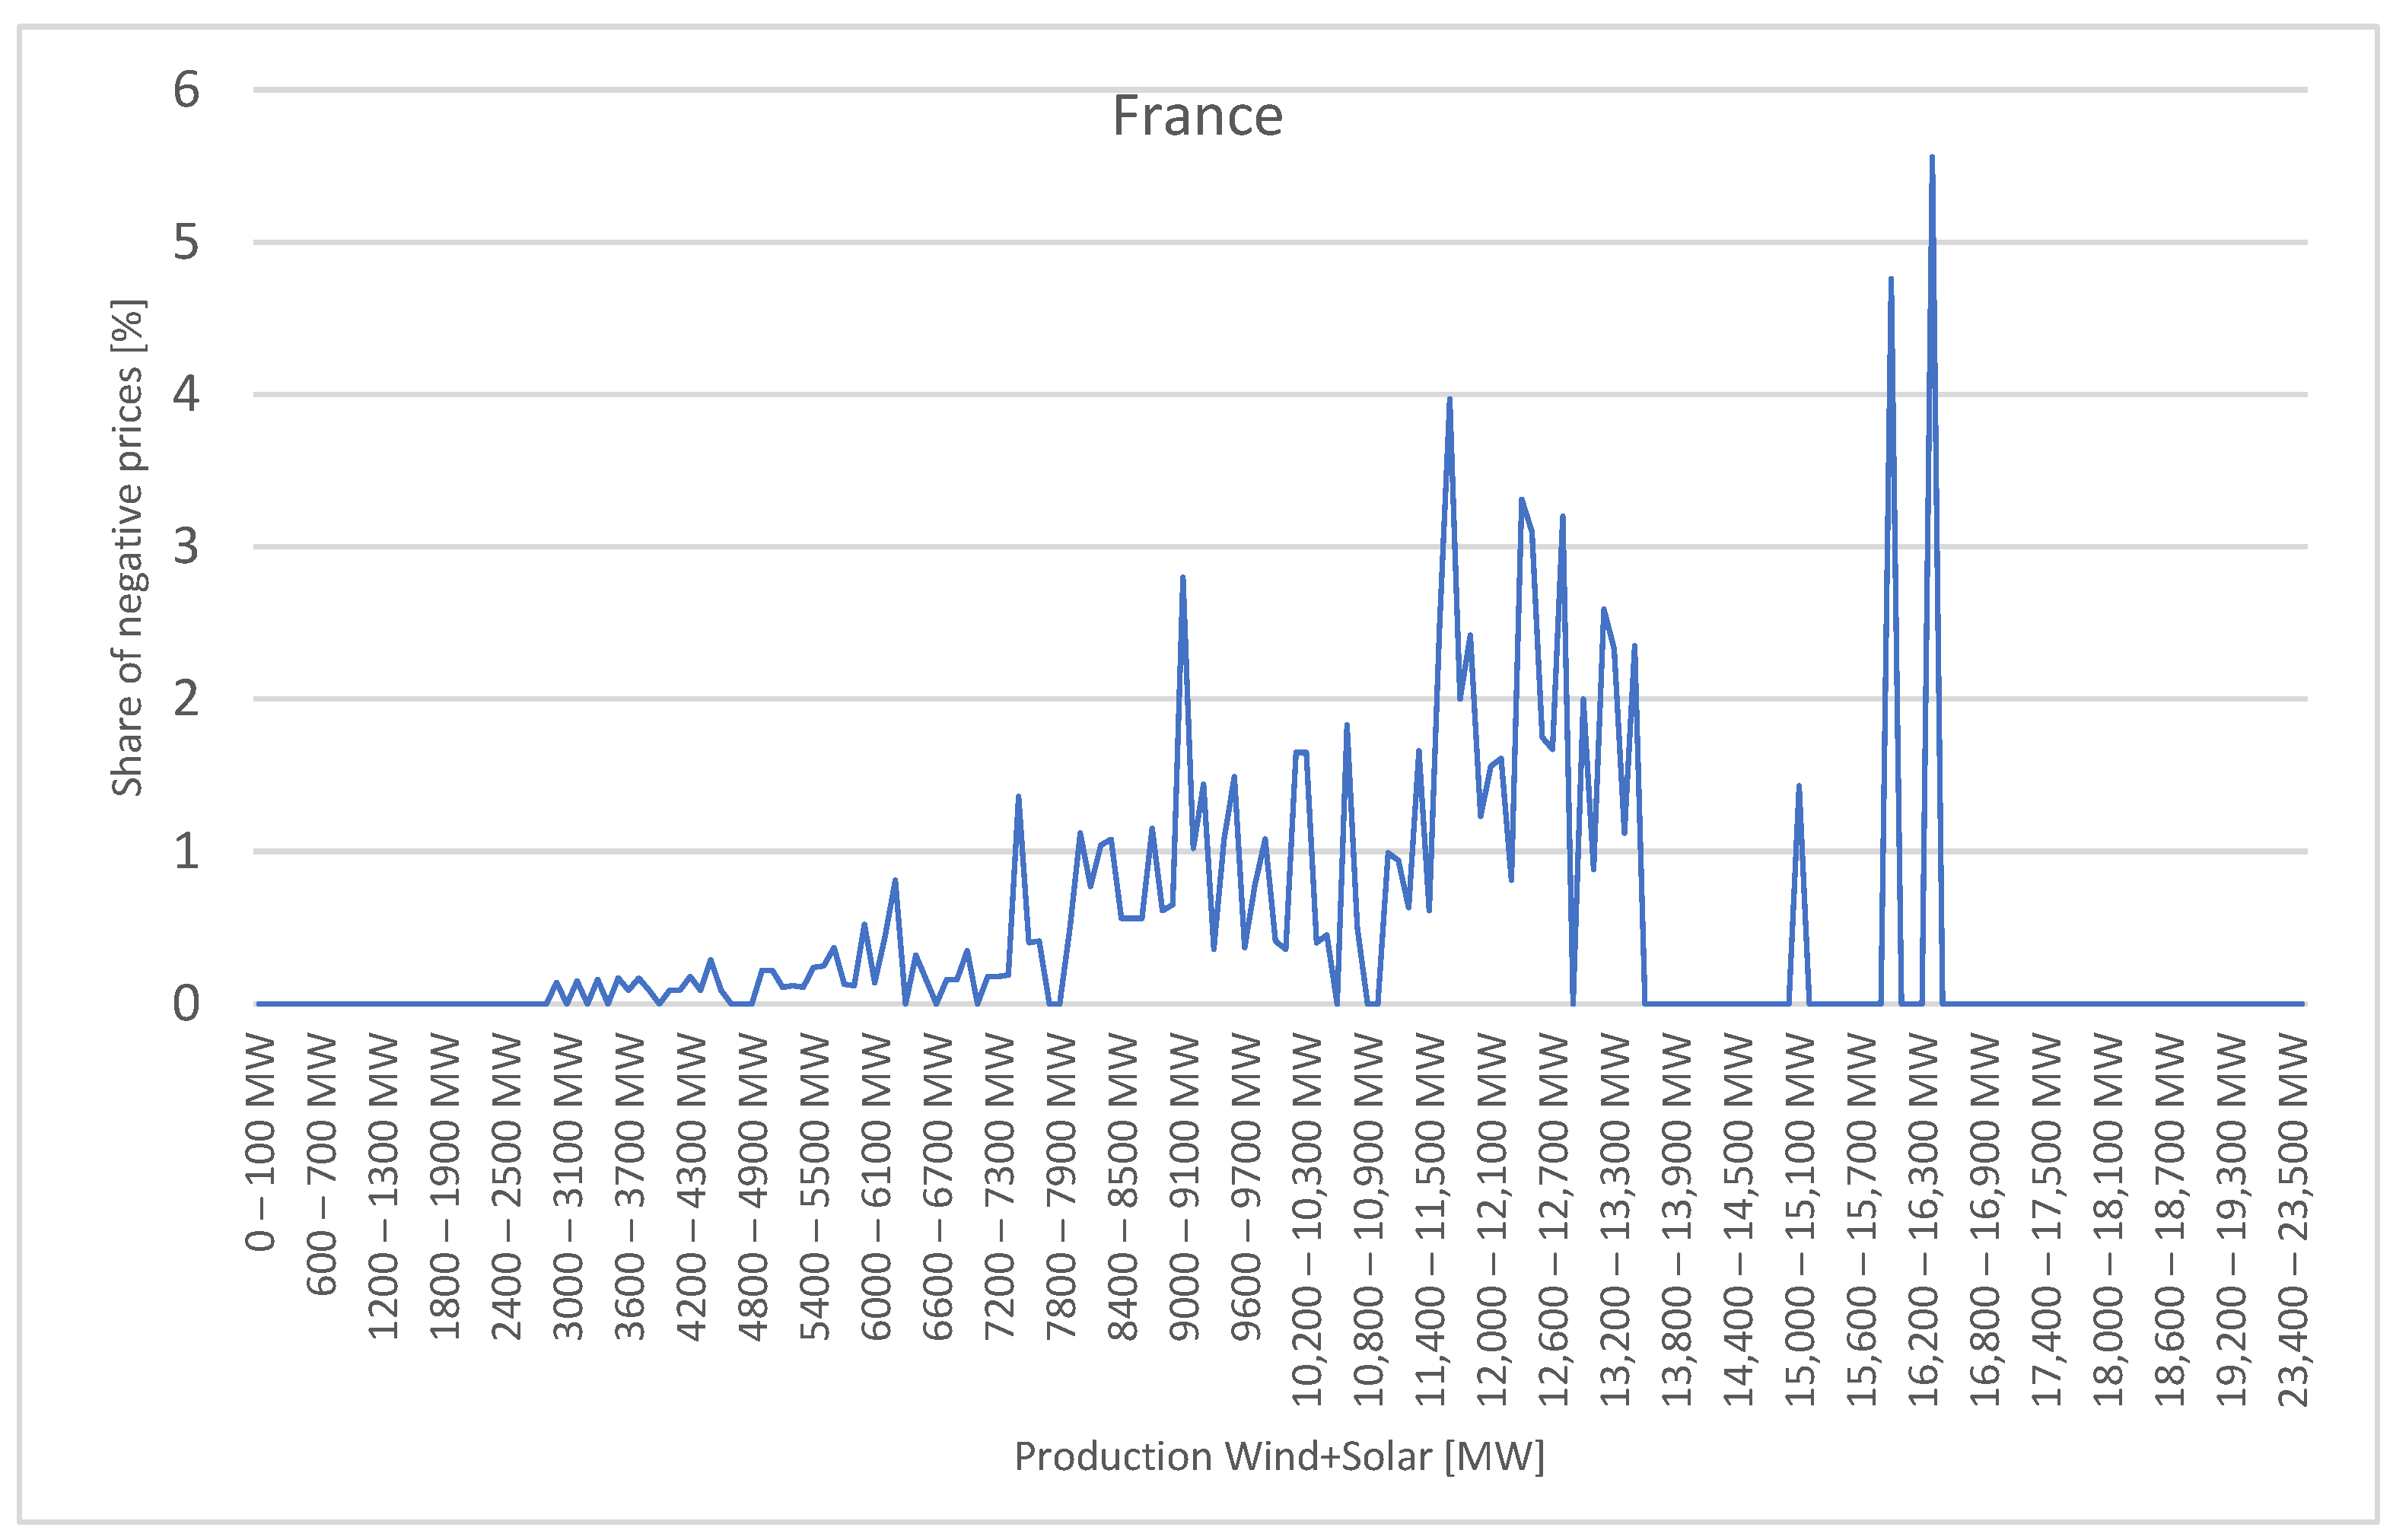
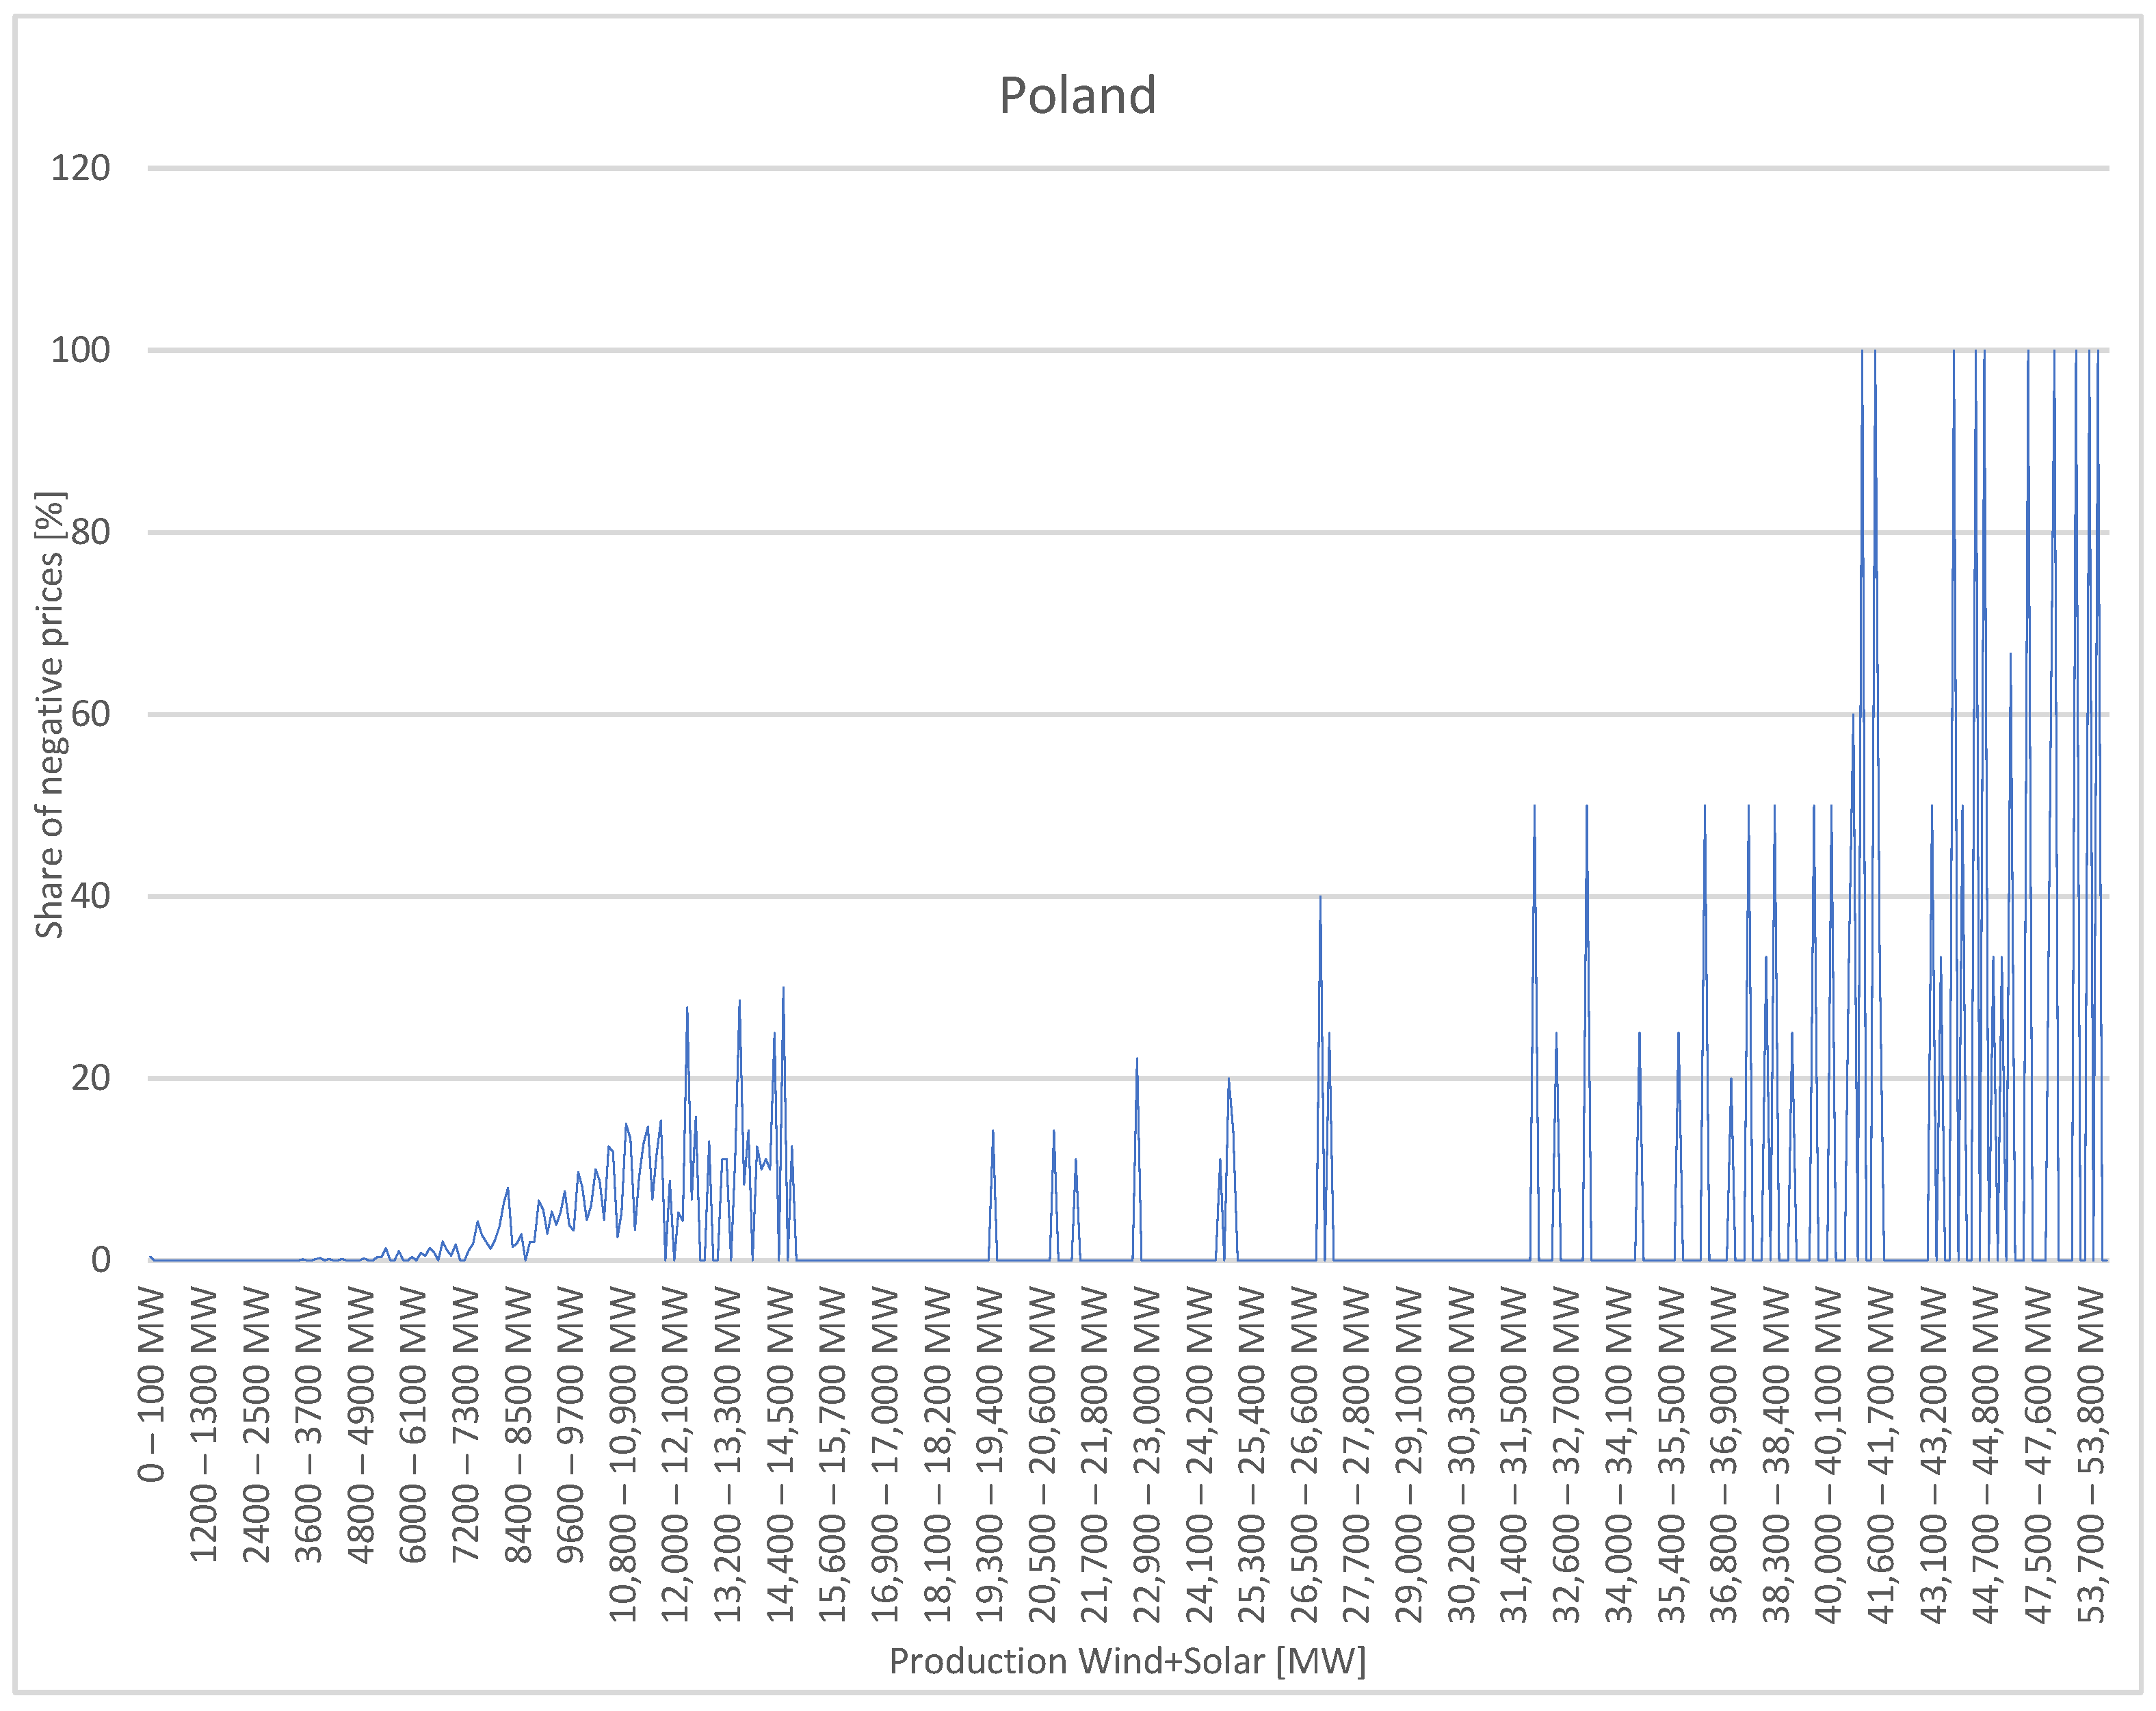
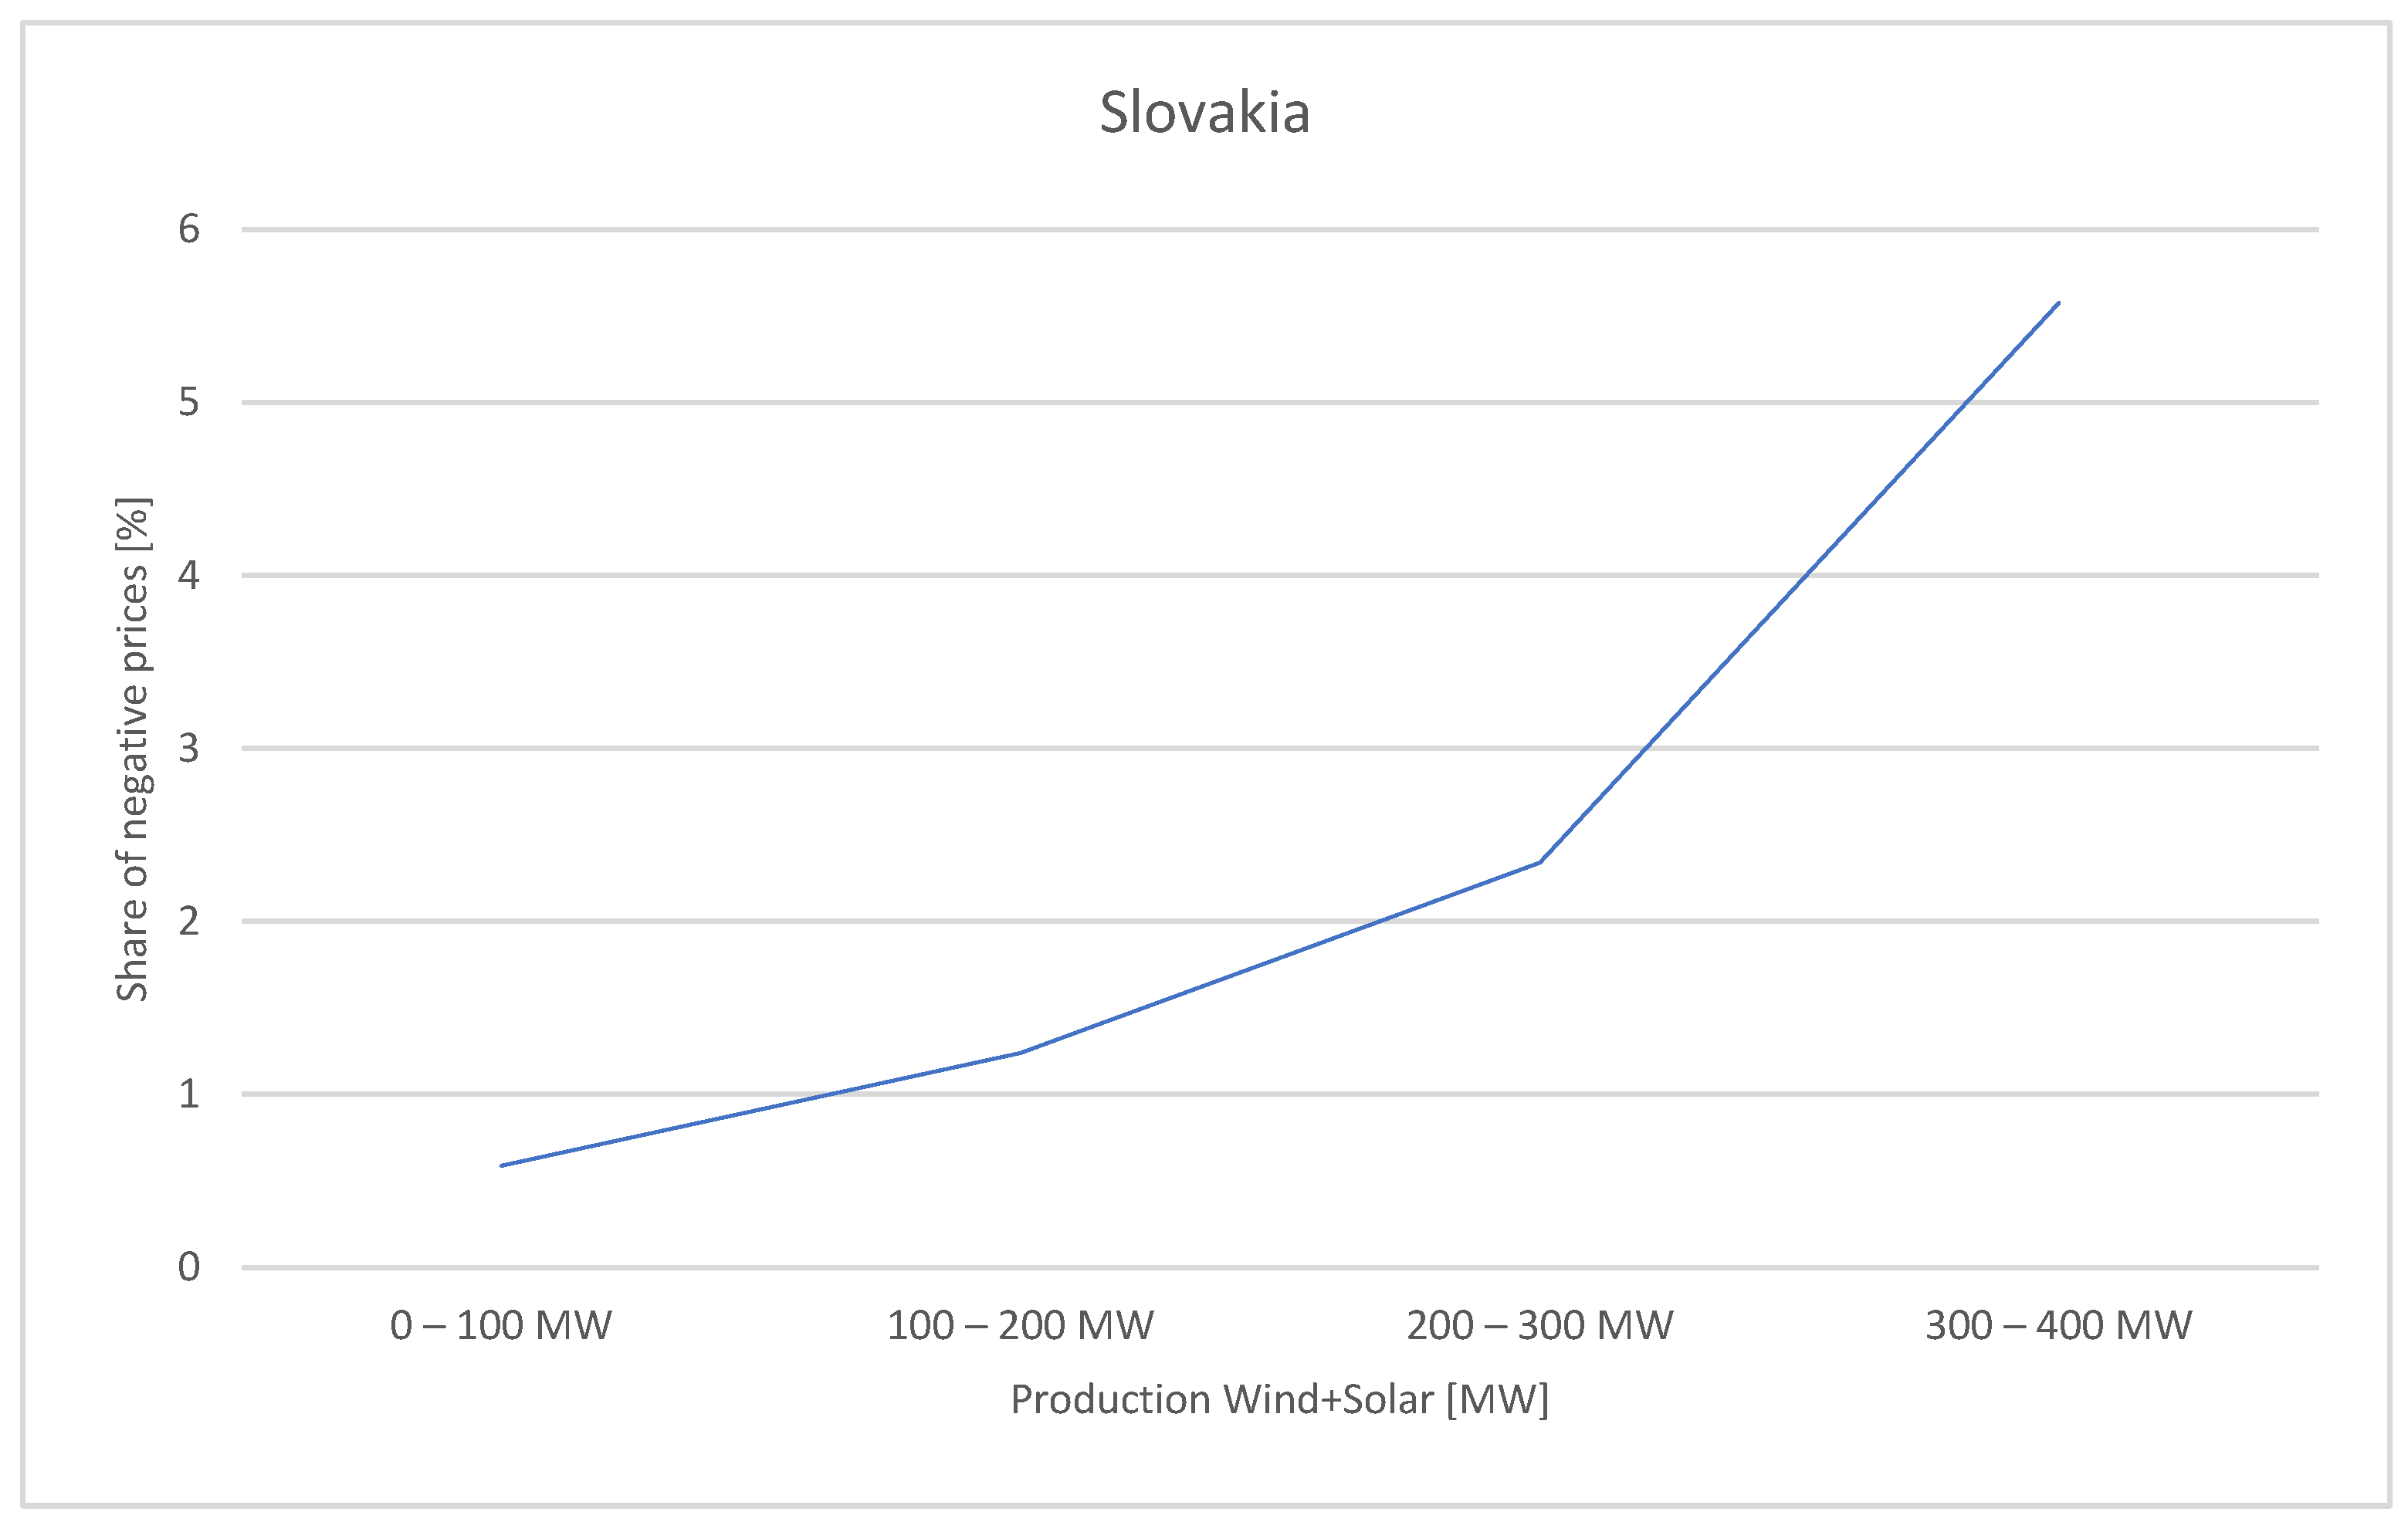
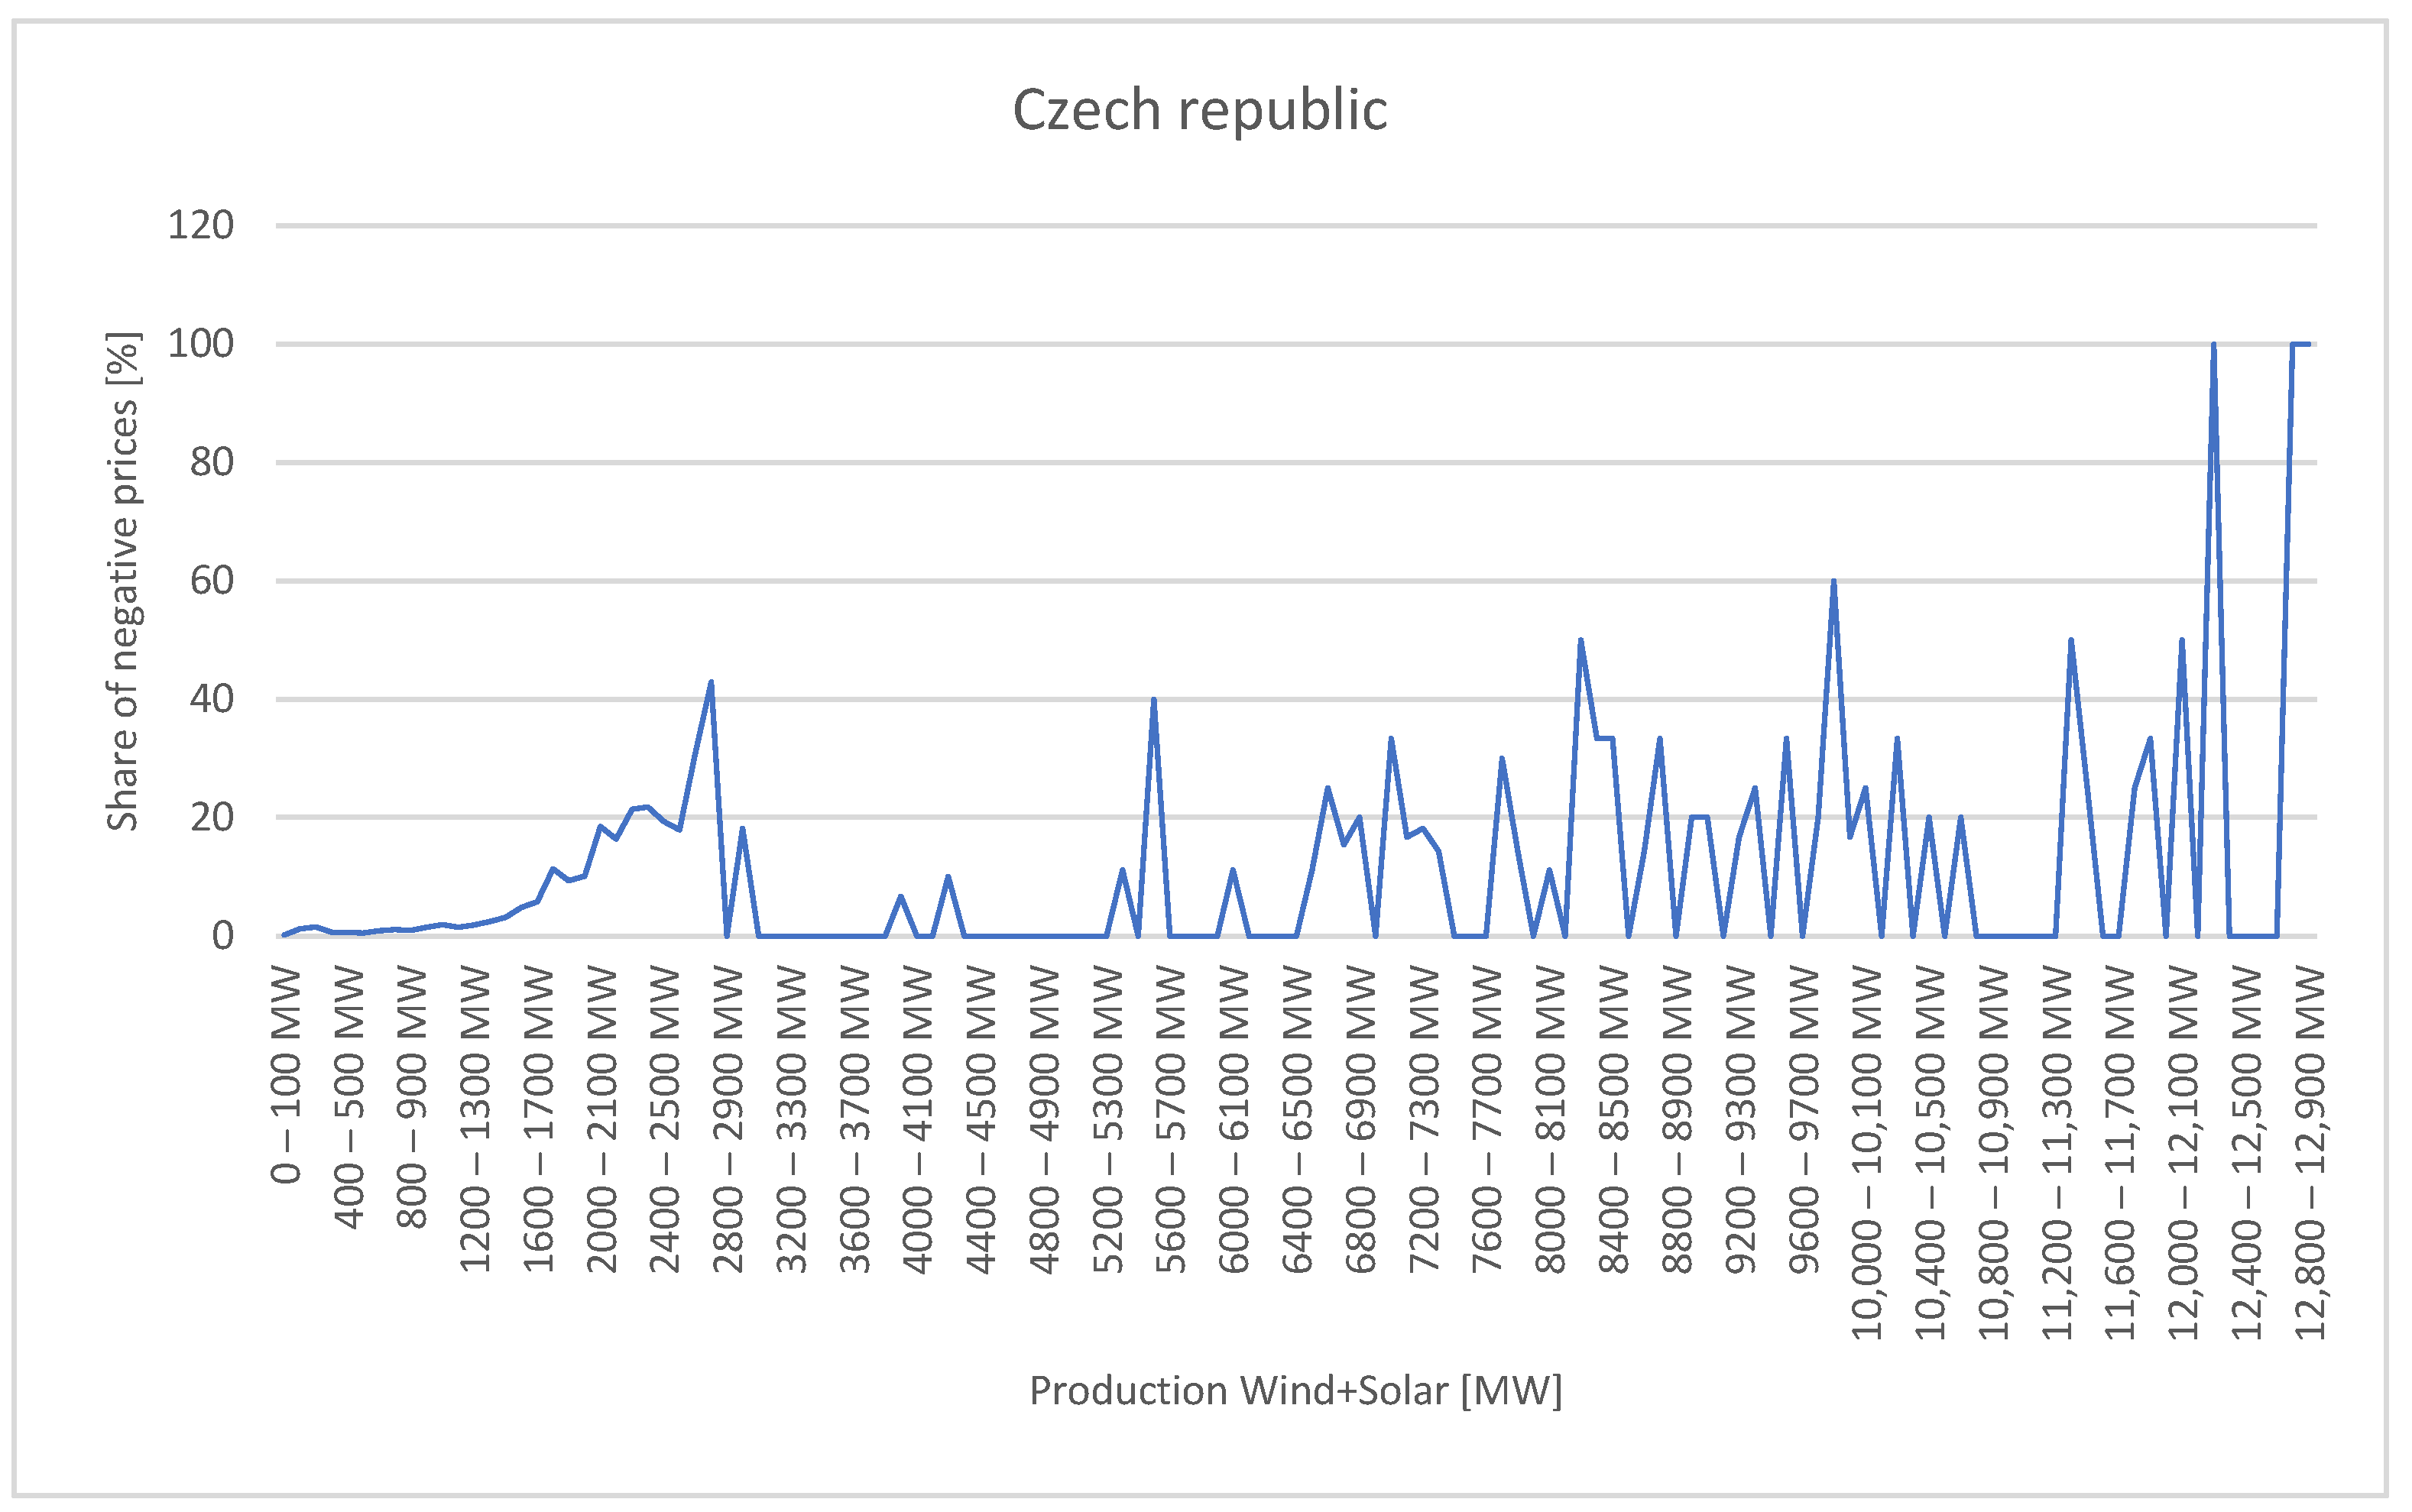
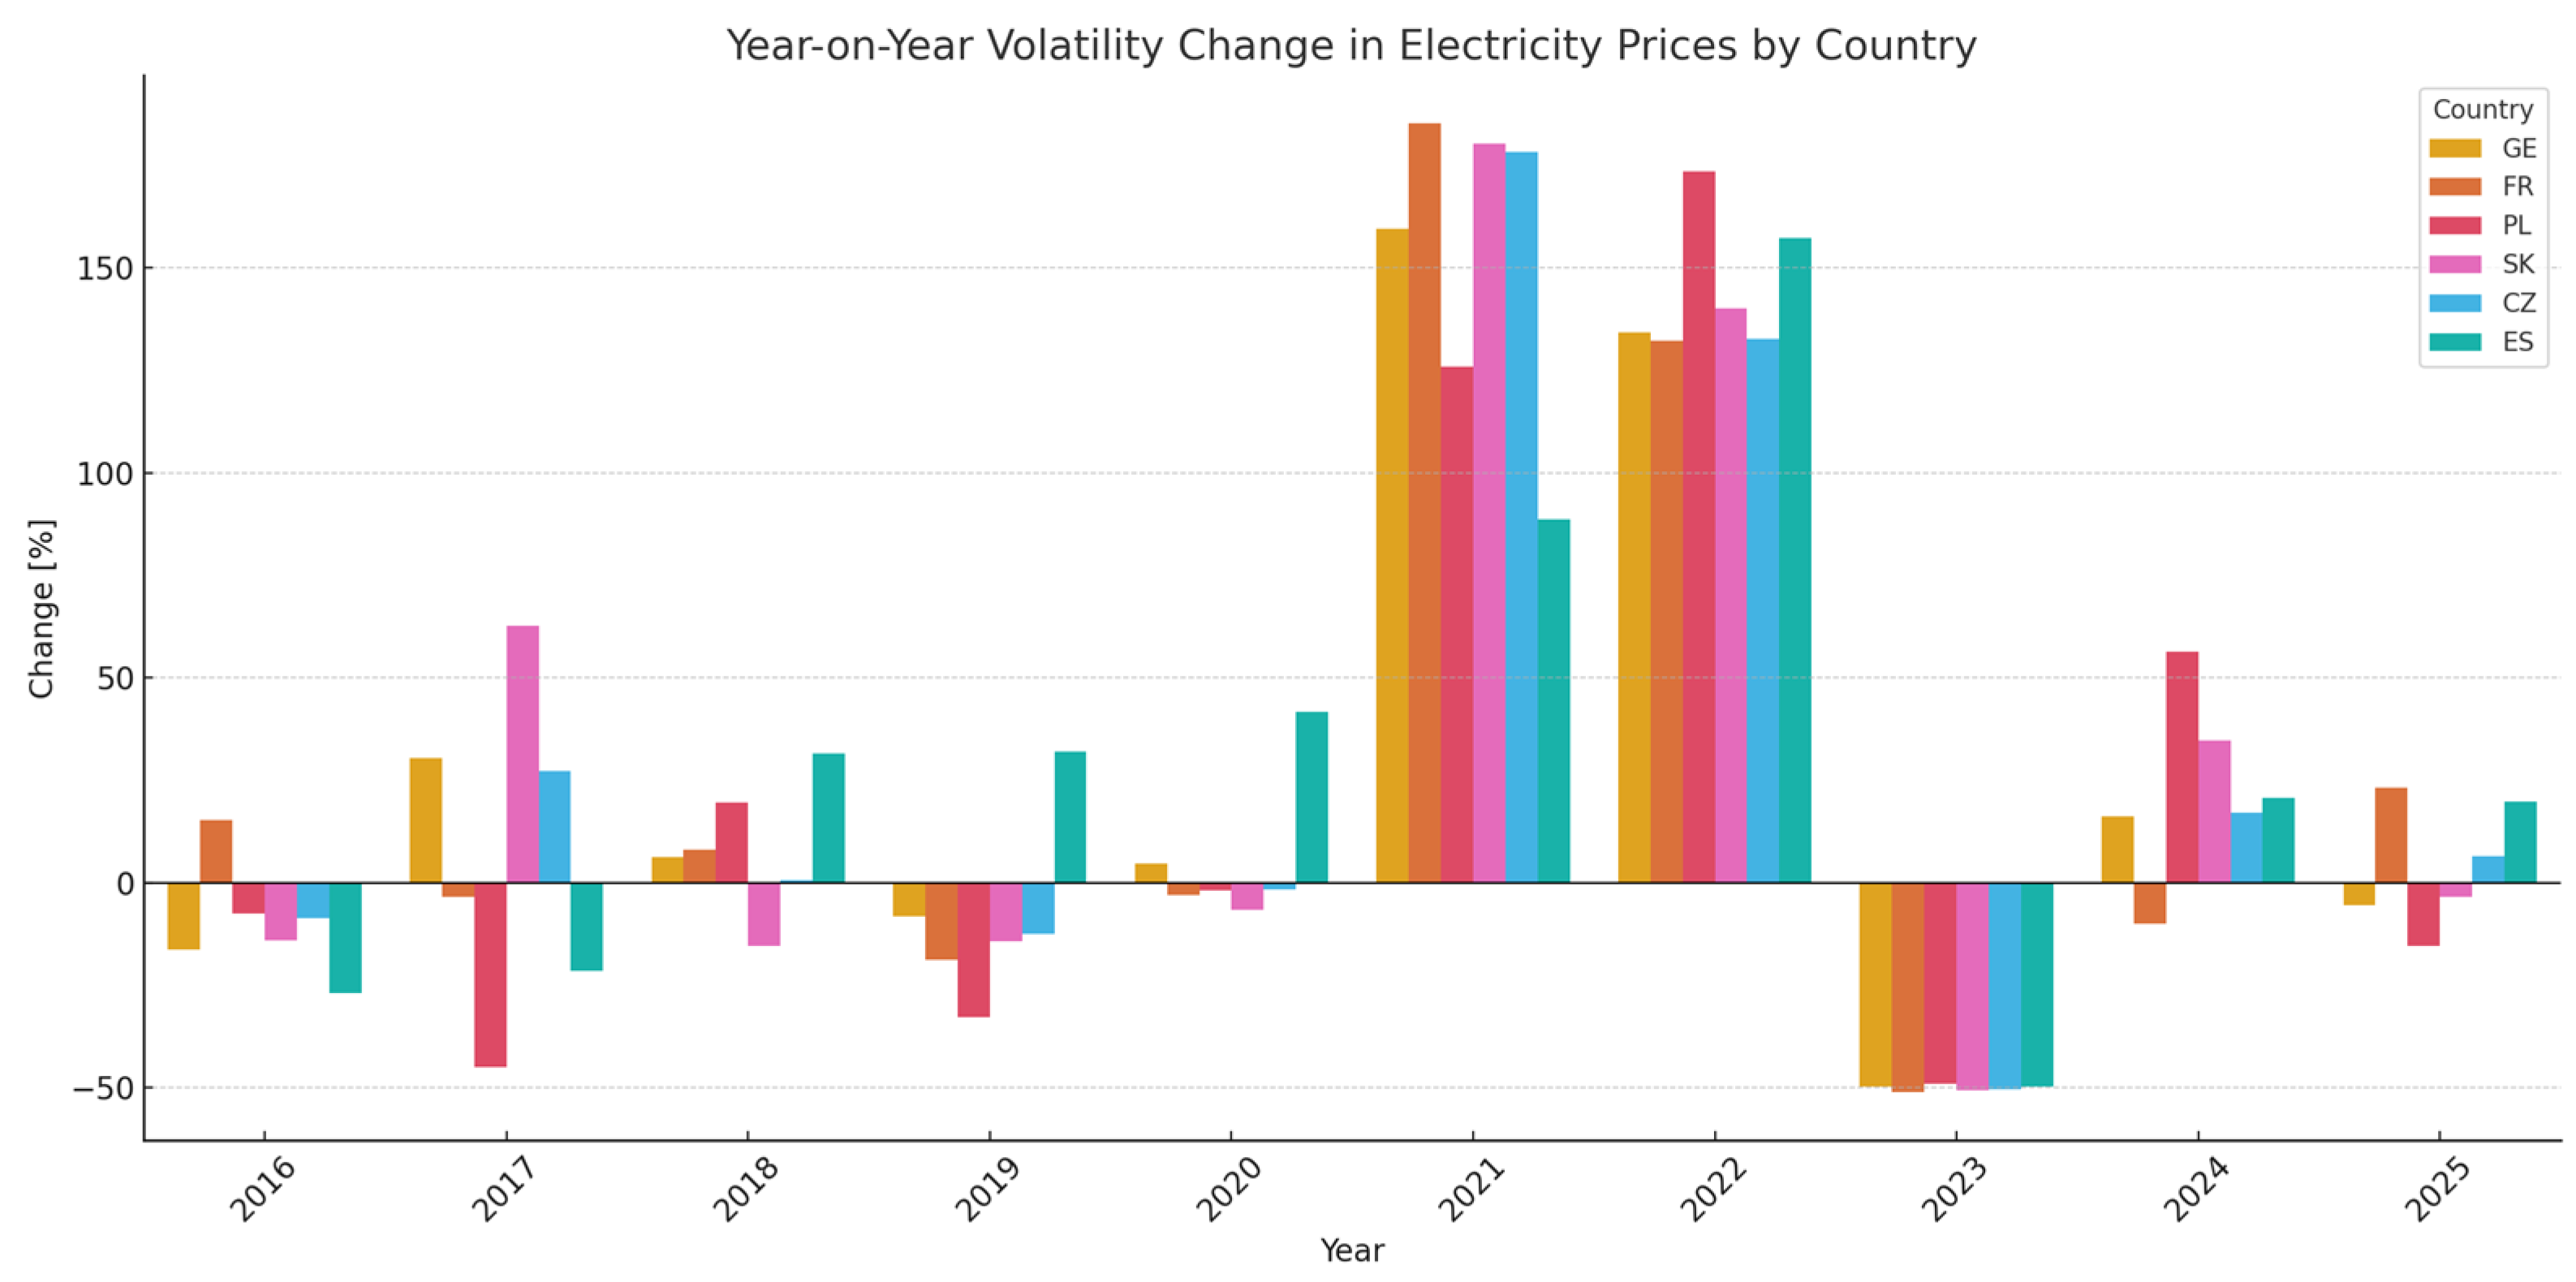
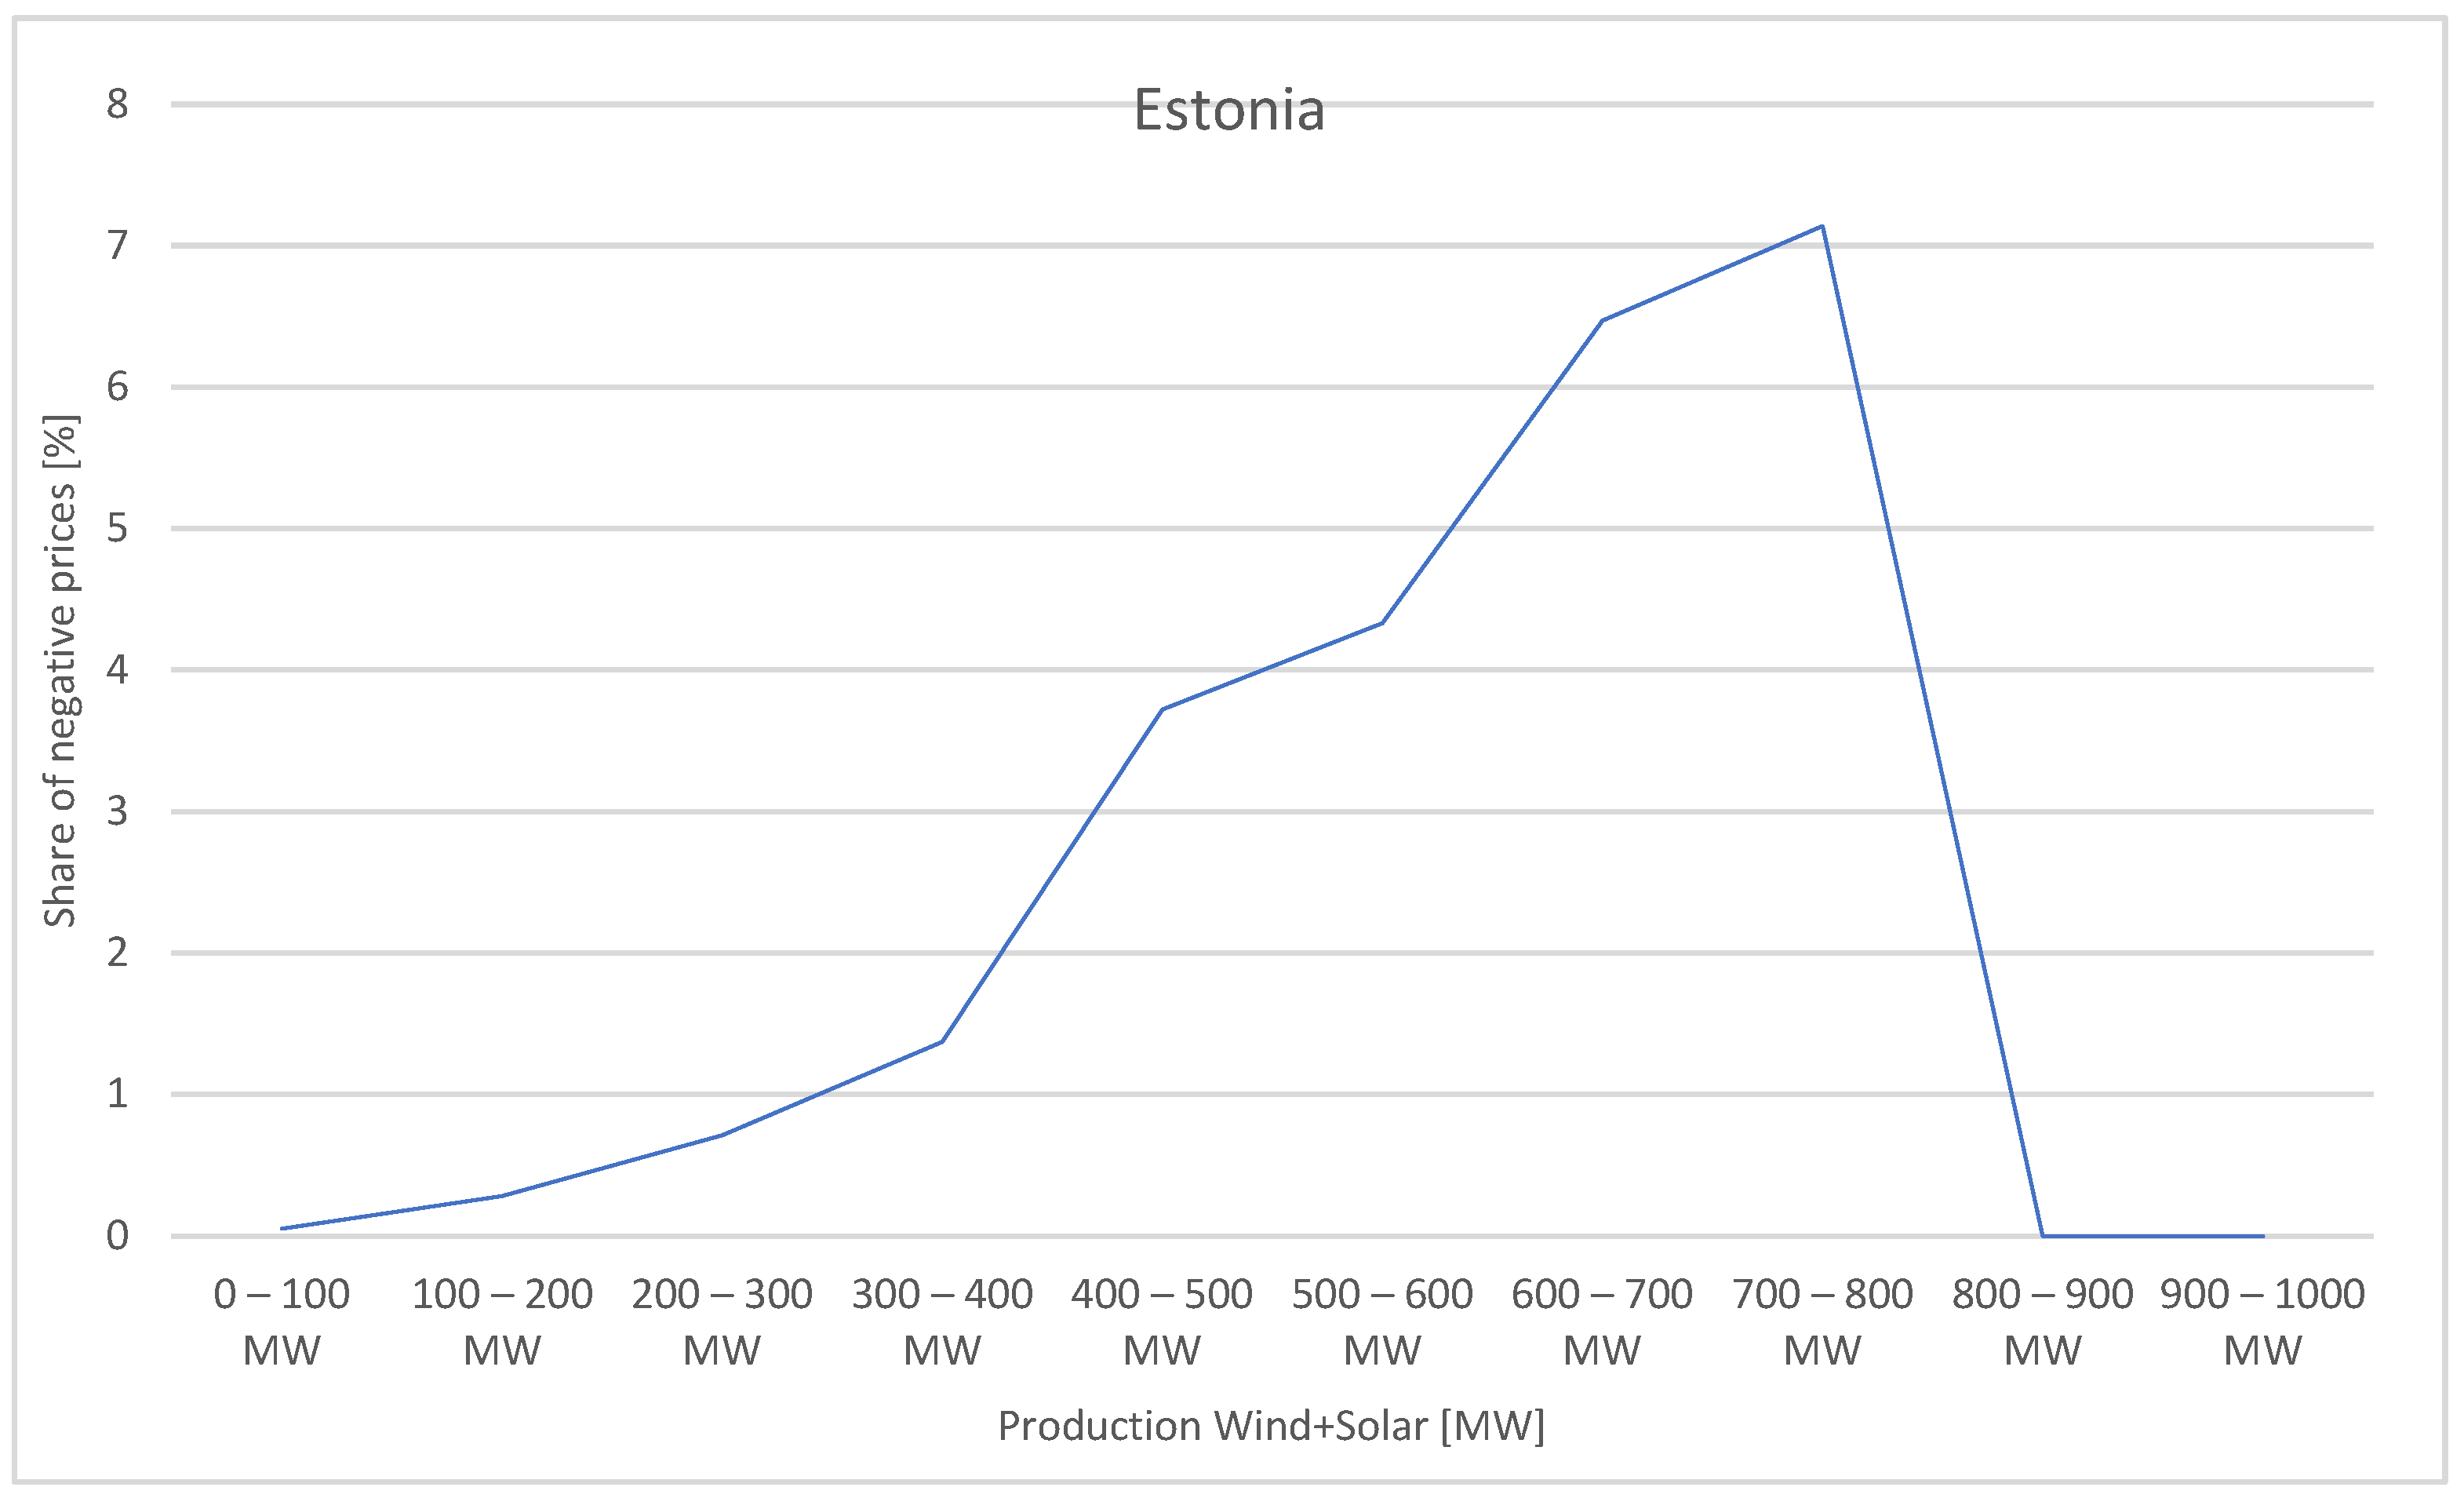
