Article

A Comparative Study on the Accuracy and Resolution of DAS and DORT-MUSIC Damage Imaging Method Based on Ultrasonic Guided Waves

1
Department of Civil Engineering and Mechanics, Jiangsu University, Zhenjiang 212013, China
2
Department of Physics and Electronic Engineering, Jiangsu University, Zhenjiang 212013, China
*
Author to whom correspondence should be addressed.
Appl. Sci. 2025, 15(12), 6380; https://doi.org/10.3390/app15126380
Submission received: 5 May 2025 / Revised: 30 May 2025 / Accepted: 4 June 2025 / Published: 6 June 2025

Abstract

The ultrasonic guided wave-based damage imaging methods are often limited in detection accuracy and resolution due to the dispersive characteristics of guided waves. Finding ways to extract more information from the guided wave field to improve imaging resolution has always been a hot topic in ultrasonic imaging. Based on the same set of guided wave field data obtained by numerical simulation and experiments, this paper compares the detection accuracy and resolution of the time-domain delay-and-sum (DAS) method, the frequency-domain DAS method, and the DORT-MUSIC method, which integrates time-reversal operator decomposition with multiple signal classification. The results show that, compared to the traditional time-domain imaging method, the frequency-domain method that incorporates dispersion relations exhibits significantly higher imaging accuracy. Additionally, the DORT-MUSIC method demonstrates a remarkable advantage in resolution, which can approach the diffraction limit. Related work in this paper provides a research basis for improving the imaging accuracy and resolution for ultrasonic guided waves in the practical application of structure damage detection.

1. Introduction

Ultrasonic waves are constrained by the boundaries when propagating in plate and shell structures, which exist in the form of ultrasonic guided waves [1]. The application of ultrasonic guided waves enables large-scale and efficient detection of surface and internal damage in structures [2,3,4,5,6,7]. Researchers have developed various methods for ultrasonic guided wave damage imaging, focusing on how to effectively excite and sense guided wave signals as well as extract and analyze the characteristics of weak damage signals.
Ultrasonic imaging methods based on array-excitation/sensing typically arrange piezoelectric wafer units with a specific spatial distribution. By analyzing the interaction between the wave field, characteristics of the wave sources can be obtained; thereby, damage localization and imaging is achieved. The complete reconstruction of the guided wave field information relies on the propagation characteristics of ultrasonic guided waves within the structure. The accuracy and resolution of different imaging techniques depend on the various parameters that can be obtained, which are constrained by spatial/time sampling rates, complex wave field characteristics, and detection environment limitations. Traditional ultrasonic guided wave damage imaging methods using array sensing include the Synthetic Aperture Focusing Technique (SAFT) [8,9,10], the Total Focusing Method (TFM) [11,12,13,14,15] based on the delay-and-sum (DAS) algorithm, and the time-reversal (TR) imaging method based on the inversion concept of guided wave field propagation, among others [16,17,18,19,20].
The integration of artificial intelligence and traditional ultrasonic guided wave imaging can significantly enhance the defect characterization capabilities of ultrasonic imaging methods. Shen et al. [7] proposed a CNN-based beamforming network that combines with DAS, enabling high-resolution, high-SNR Lamb wave damage imaging while maintaining computational efficiency. Song et al. [21] proposed a novel noncontact super-resolution guided wave array imaging approach using deep learning, combining global detection and local super-resolution fully convolutional networks to visualize subwavelength defects in plate-like structures with high resolution and noise robustness. These advancements broaden our understanding of the resolution performance of different ultrasonic guided wave imaging methods as well as their imaging capabilities in noisy environments. Meanwhile, we still need to further investigate physics-driven guided wave imaging methods as physical benchmarks and sources of interpretability for data-driven models, promoting a symbiotic framework integrating physics-based priors with data-driven techniques.
Compared to the single-input-single-output data relied upon by SAFT, the more comprehensive, all possible multi-input-multi-output data considered by TFM can provide higher resolution imaging for damage detection. The DAS algorithm controls the relative delays of the excitation signals for each driving/sensing element through a multi-channel control unit, allowing the superposition of multiple elements to form a directional probing beam that can be deflected or focused in a specified direction. This method combines the advantages of acoustic field control scanning with long-distance probing of ultrasonic guided waves, making it one of the ideal means for rapid detection of damage in plate-like structures. From the perspective of wave field inversion, the ray approximation of DAS simplifies the interaction process between the guided wave field and the damage to the incident/reflection process of the guided waves in the propagation direction. Under the assumption of constant wave speed, the scattering time information of the damage is used to infer the spatial location of the scattered waves. Therefore, the accurate acquisition of the time-amplitude information of the scattered waves is key to improving imaging accuracy. Victor Giurgiutiu et al. [22] used piezoelectric wafer active sensors (PWASs) adhered to the surface of structures as units to drive and sense ultrasonic guided waves, proposing a frequency tuning method to select the specific S0 mode ultrasonic guided wave with relatively weak dispersion characteristics. They employed a time-domain DAS algorithm under the far-field plane wave approximation to map the amplitude information corresponding to the transit time into space, thereby achieving imaging detection of pre-existing crack damage in aluminum plate structures. Lingyu Yu et al. [23] further extended the time-domain DAS algorithm to the near field, constructing an embedded ultrasonic structural radar system based on a guided wave phased array method [24]. They analyzed the effects of different array parameters, such as the number of elements, spacing, and array configuration, on the all-around guided wave beam driving. Emmanuel Moulin et al. [25] investigated the capabilities of piezoelectric array transducers in driving wave beams in different directions using a similar approach. The time-domain DAS selected weakly dispersive modes (such as the S0 mode in the low-frequency range) to mitigate the effects of guided wave dispersion, which somewhat limited the frequency range of guided waves to comprehensively capture all information regarding damages. Wenfa Zhu et al. [15] introduced the Sign Coherence Factor-Total Focusing Method (SCF-TFM) to address resolution degradation caused by Lamb wave dispersion. However, the method still lacks precise dispersion compensation mechanisms that could more effectively improve the accuracy of defect localization and sizing.
Addressing the dispersion issue of guided waves, researchers have further developed a frequency-domain method that implements delay-and-sum in the frequency domain [26,27], capable of incorporating wave equations that include dispersion relations into the calculations, thereby obtaining precise damage scattering sources. To consider the impact of the dispersion characteristics of multimodal guided waves, Wilcox [27] proposed a method for omnidirectional probing in large-area plate structures based on the frequency-domain DAS algorithm under the condition that the dispersion characteristics are known and compared the imaging effects of circular and annular arrays. Lingyu Yu and Zhenhua Tian [26] further advanced the frequency-domain DAS method for damage detection in composite plate structures, achieving accurate imaging detection of pre-existing damage in carbon fiber-reinforced composite plates while considering the angular correction between phase velocity and group velocity and the material anisotropy. Xuan Li et al. [14] proposed a full-focus imaging algorithm combining frequency-domain backpropagation and phase/waveform coherence analysis (SCF-WCF), which significantly improves defect detection accuracy and robustness in noisy environments. In summary, the frequency-domain ultrasonic guided wave DAS imaging method allows for the separate calculation of time or phase delays for each frequency component, achieving higher imaging localization accuracy and multi-damage imaging resolution under the premise of known dispersion characteristics. However, some researchers point out [28] the theoretical framework for guided wave scattering in the aforementioned methods still falls within the Born approximation category, making it difficult for the imaging resolution to surpass the diffraction limit.
In research related to the Time Reversal Method (TRM) and its iterative approaches aimed at achieving adaptive focusing of the wave field at scattering sources, researchers often use the Scattering Matrix to describe the multi-path mapping relationship between multiple input and output signals [29]. The system’s Time Reversal Operators (TROs) are then obtained through the Scattering Matrix, thereby inverting the entire process of guided wave propagation from excitation to scattering to sensing. For damages that are relatively small in scale within the structure, under the point scatterer approximation, the Decomposition of the Time Reversal Operator (DORT) methods that combines multiple signal classification (MUSIC) [20,30,31,32,33,34,35] performs eigenvalue decomposition of the TROs to obtain the eigenvectors of the incident and scattered signals as well as the intensity (corresponding to the eigenvalues) of each scattering source in the measured structure. This allows for selective focusing of the back-propagated wave field at each scattering source without considering the effects of the structure’s inhomogeneity and dispersion characteristics on the wave field.
Lehman and Devaney’s teams discussed the applicability of the DORT method under different scenarios, including the separation of scattering sources and the consideration of the Born approximation scattering model under weak secondary scattering [30] as well as closely spaced damages and multiple scattering effects [35]. The results indicated that while the DORT method could selectively invert and focus the wave field beams at each scattering source, its imaging accuracy did not achieve a significant improvement compared to ultrasound phased array methods. To address this, Devaney [36] introduced the MUSIC imaging condition, constructing a pseudo-spectral function as an imaging index based on the orthogonality between the signal subspace and the noise subspace after eigenvalue decomposition to achieve super-resolution imaging in the presence of multiple scatterers within the measured structure. Yanfeng Lang [19] introduced the Forward-Propagation-Free Focusing MUSIC (FPF-F MUSIC) algorithm, which leverages virtual TR to compensate for dispersion during back propagation, ensuring phase coherence across signals without additional repropagation steps.
Existing studies have shown that applying the DORT-MUSIC method can utilize the known Green’s function for guided wave propagation in the structure (which includes dispersion relationships) to solve for the spatial locations of scattering sources, with imaging accuracy unaffected by the guided wave dispersion relationship. Furthermore, in the context of imaging multiple damages, it can achieve detection resolutions superior to conventional array imaging methods. However, related studies have not revealed the physical mechanisms behind super-resolution imaging in an acoustic context. Building on this, F. Simonetti [28] explored the limits imposed by the diffraction limit on scattering source imaging under the Born approximation and proposed that the process in which evanescent waves with high wave numbers transform into propagating waves during multiple scattering carries super-resolution information about the damage, thus providing a basis for the capability of super-resolution imaging. Subsequent research indicated that, compared to the DAS, the DORT-MUSIC method has the advantage of high-resolution imaging but is also more susceptible to noise [37,38]. Therefore, extracting characteristic information about damage scattering from complex, overlapping signals in the presence of environmental noise is a key issue in ensuring the imaging quality of the DORT-MUSIC method.
It is evident that, compared to the DAS, which only inversely reconstructs the paths of guided wave propagation and reflection, the DORT-MUSIC method directly performs inverse calculations of the guided wave field, retrieves damage scattering information from the received signals, and avoids the impact of guided wave dispersion effects on imaging results. Therefore, it often offers a significant advantage in imaging accuracy. This study provides a systematic comparison of time-domain DAS, frequency-domain DAS, and DORT-MUSIC for ultrasonic guided wave damage imaging, explicitly quantifying resolution limits (down to 0.79λ) under experimental noise conditions. Our simulation study and experimental validation on aluminum plates with controlled noise levels reveals critical practical limitations, particularly the degradation of DORT-MUSIC resolution due to signal subspace orthogonality loss. Our discussion on frequency-domain computation for compensating dispersion characteristics, improving the accuracy of array imaging methods, and enhancing the resolution of different imaging methods provides practical guidance for method selection in plate-like structure non-destructive testing and structural health monitoring.

2. Materials and Methods

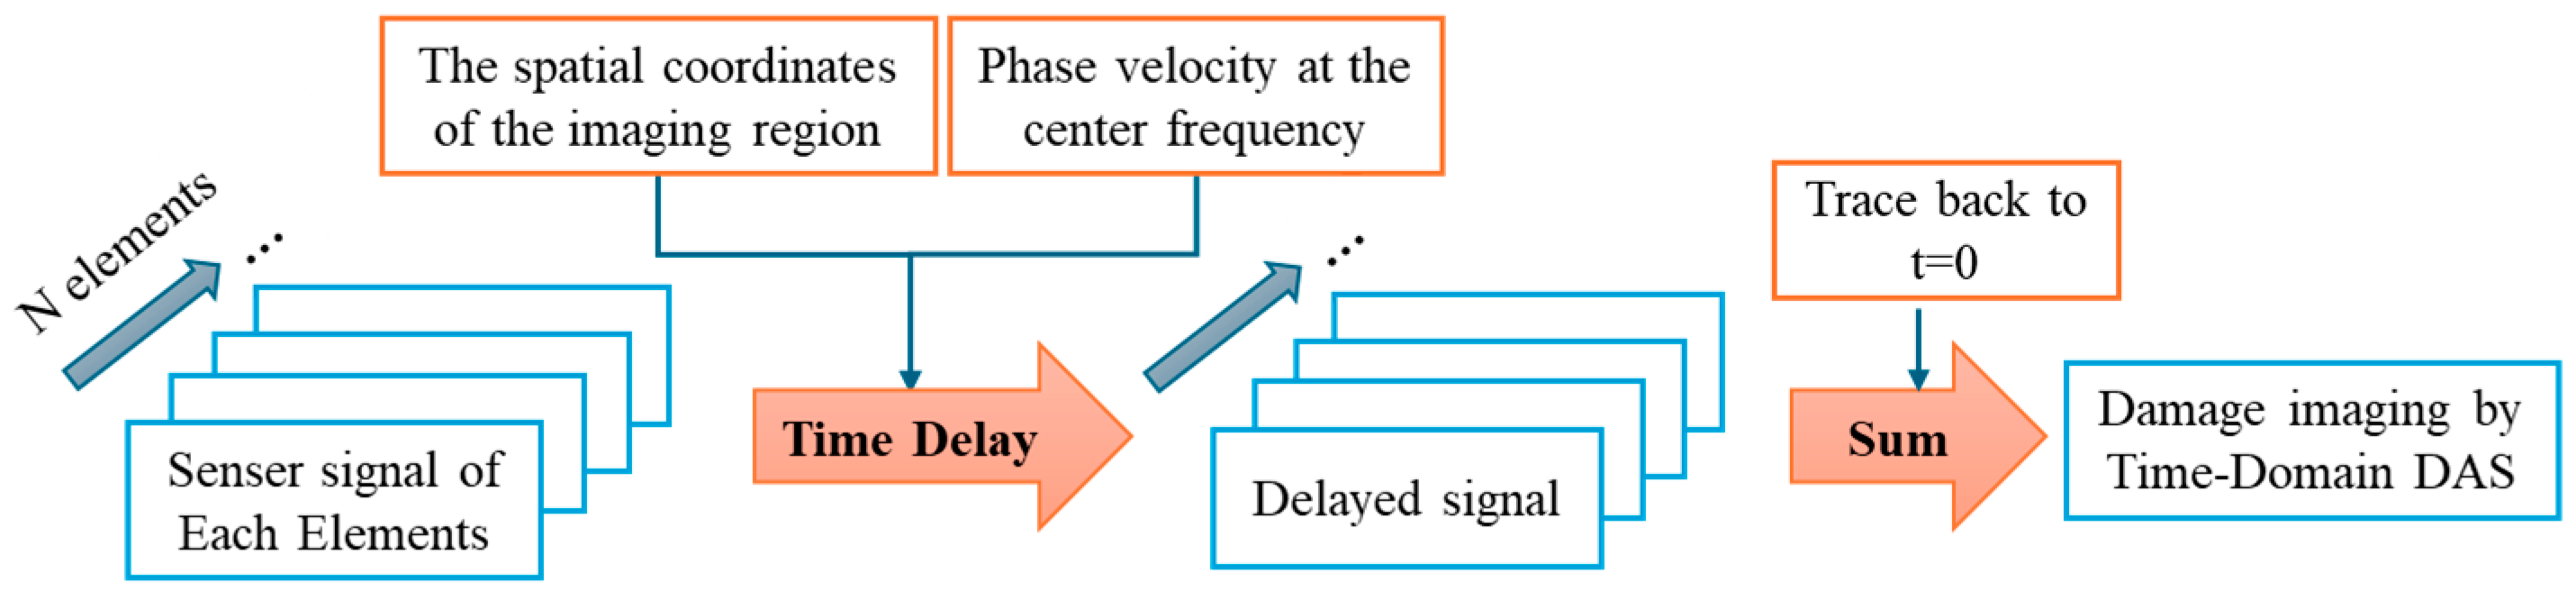
2.1. Time-Domain DAS

In the tested isotropic plate structure, there are M linearly arranged transducer units forming a one-dimensional ultrasonic transducer array. The spacing between the array elements is d, as shown in Figure 1.
Let the ultrasonic guided wave u m a t = A t be excited by the actuation unit located at s m . The guided wave field signal scattered by the damage (secondary acoustic wave source) located at r propagates to a one-dimensional linear array as shown in the figure. The signal received by the array element located at s n is u n s t . Ignoring the dispersion effects of the guided wave, the time difference of the received guided wave signal relative to the exciting signal can be expressed as:
Δ t r = k m r s m k n s n r ω 0 = c p r s m + c p r s n ,   m , n = 1,2 , , M
In this context, c p represents the phase velocity of the guided wave corresponding to the central frequency, while k m and k n are the wave number vectors. In isotropic materials, the magnitudes of the wave numbers are the same. Under the condition that the potential location r of the acoustic source (damage) in the structure is unknown, the structure is probed point by point at r s . A time-domain delay Δ t r s is applied to the received signals u n s t , r from each array element, and all the signals from the array elements are superimposed:
u D A S t , r , r s = m = 0 M 1 n = 0 M 1 A t r s m r s n e j ω t + Δ t r s k r s m k m r s n
When the condition r s = r is satisfied, the signal phases of each array element are synchronized, and the damage imaging index is taken as the zero moment of the sound source emission:
I 1 r s = u D A S t , r , r s t = 0
The maximum value will be obtained at the actual location of the damage. The flowchart of the time-domain DAS method is shown in Figure 2.

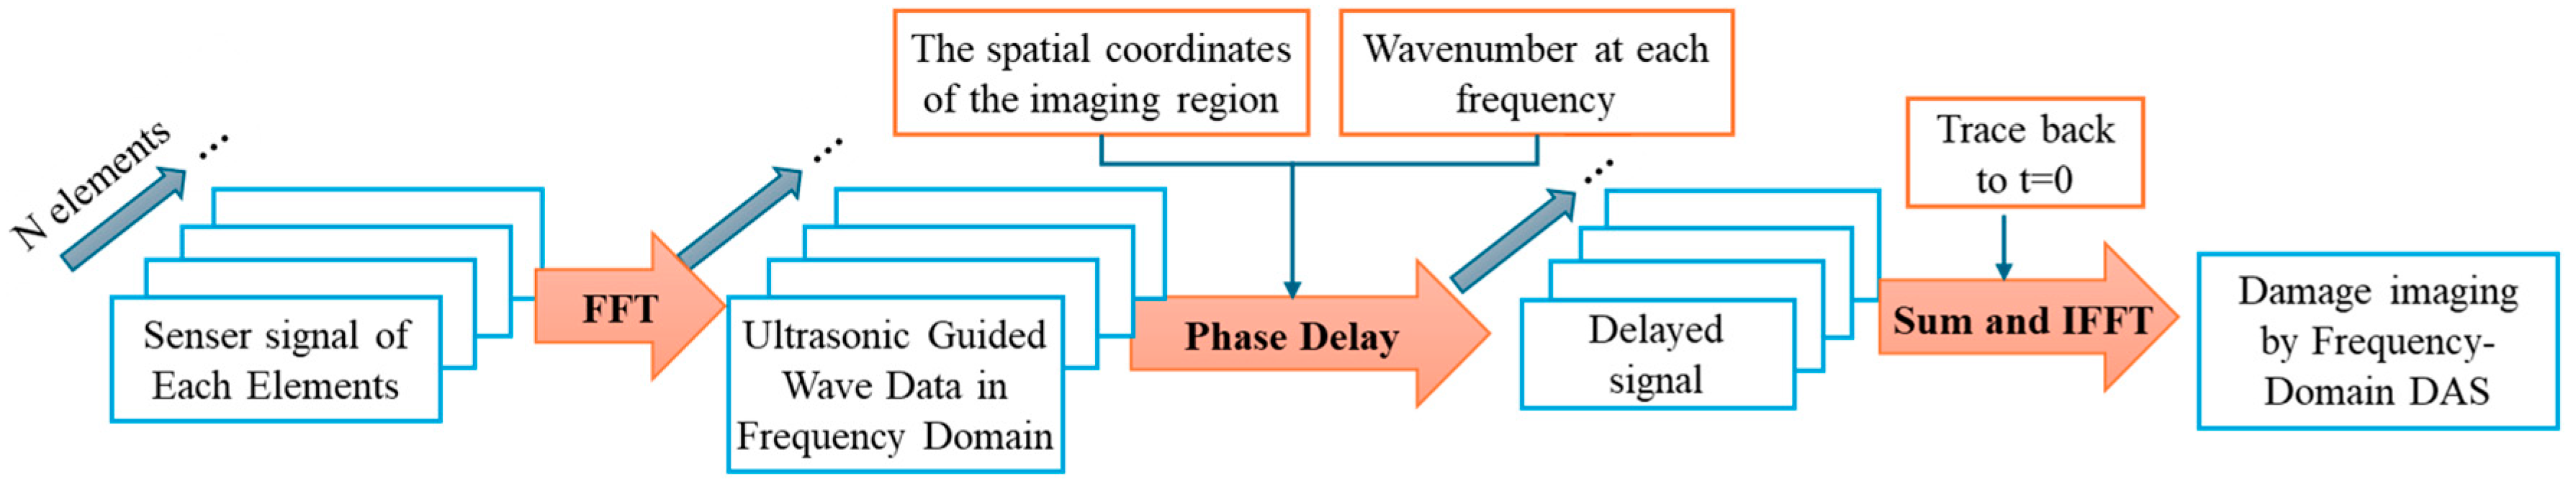
2.2. Frequency-Domain DAS
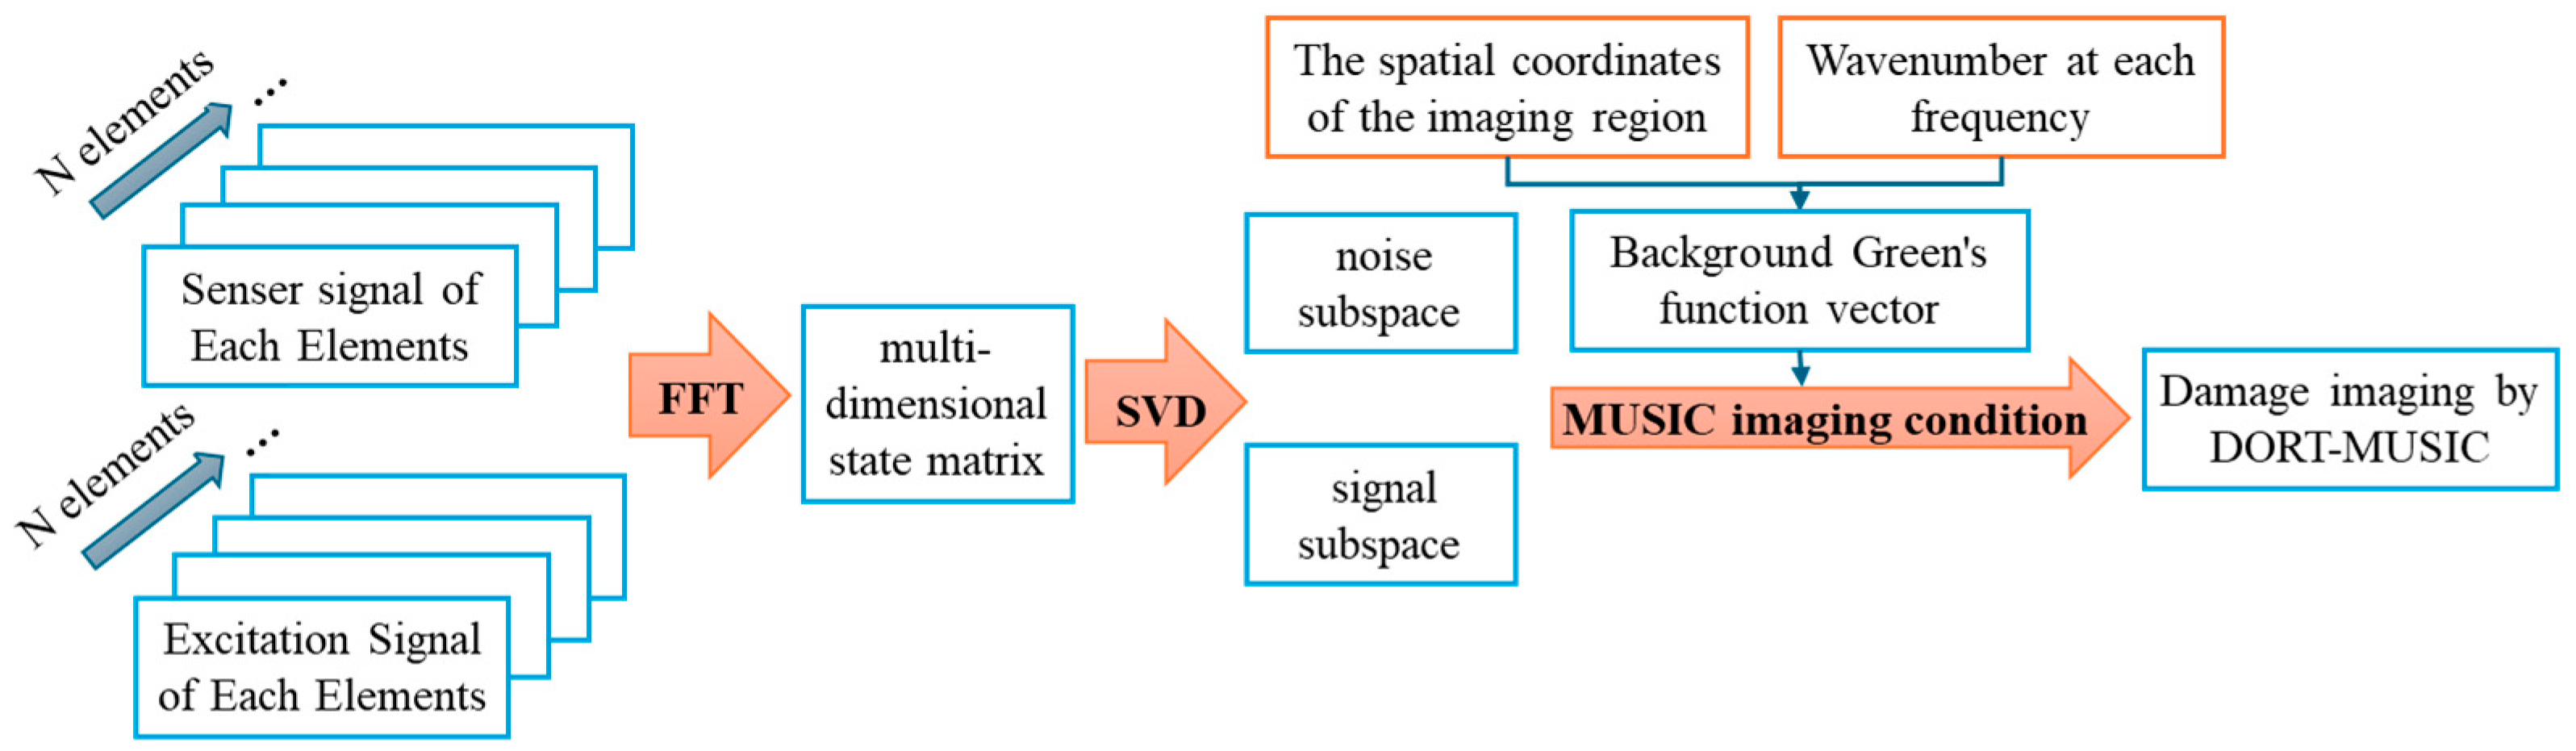
For the signal processing of ultrasonic guided waves with a certain bandwidth, by obtaining their dispersion relationship through numerical calculations or experimental methods, the delay and sum can be implemented in the frequency domain, thereby better inverting the propagation process of the wave field. The signal is transformed into the frequency domain for processing using Fourier transform:
U n s ω = F u n s t = + u n s t · e j ω t d t
For a specific frequency component ω , the time-domain delay given by Equation (1) can be expressed in terms of the phase delay as:
Δ φ r = k m r s m k n s n r , m , n = 1,2 , , M
In the above equation, k m = k ω ξ m and k n = k ω ξ n , where ξ n and ξ m are unit vectors pointing in the direction of wave propagation. In the calculation of phase delay, the dispersion relation must be substituted as a known condition. For the probing point located at r s in the imaging area, the phase delay for each frequency component is calculated based on the above equation and loaded onto U m s ω , r :
U D A S ω , r , r s = m = 0 M 1 n = 0 M 1 A ω r s m r s n e j k m r s m + k n r s n k m r s s m k n r s s n
The signals from each array element are synchronized when the condition r s = r is satisfied. The inverse transformation to the time domain is as follows:
u D A S t , r s = F 1 [ U D A S ω , r , r s ]
The imaging index is:
I 2 r s = u D A S t , r , r s t = 0
When the probe point is exactly located at the damage site, the above equation will yield the maximum amplitude, thereby enabling frequency-domain damage imaging. The flowchart of frequency-domain DAS method is shown in Figure 3.

2.3. DORT-MUSIC

Let the ultrasound signal excited by the m-th driving element be received by the n-th sensing element. The form of the multi-dimensional state matrix is:
T m n ( ω ) = U m a ω / U n s ω
Assume the number of scatterers (damage) K in the structure is less than the number of transducer array elements M, perform singular value decomposition on T:
T = G ^ s V ^ G ^ a H
In this context, V ^ represents the singular values corresponding to the number of scattering sources and scattering intensity, while G ^ s and G ^ a are the left and right singular vectors of the singular value decomposition.
G ^ s = G ^ 1 s , , G ^ K s , G ^ K + 1 s , , G ^ M s
G ^ a = G ^ 1 a , , G ^ K a , G ^ K + 1 a , , G ^ M a
The singular vectors G ^ 1 s , , G ^ K s and G ^ 1 a , , G ^ K a span the signal subspace S, which is related to the propagation of guided wave fields from the scattering source to the sensors and from the actuators to the scattering source, respectively. Meanwhile, the vectors G ^ K + 1 s , , G ^ M s and G ^ K + 1 a , , G ^ M a are associated with noise in the measurements and span the noise subspace N. According to the symmetric properties of the T matrix, the singular vectors of the signal subspace and the noise subspace corresponding to the same singular value are orthogonal. To this end, we establish the guided wave propagation Green’s function vector related to the spatial position r s in the structure:
g a r s = [ g r s , s 1 a , . g r s , s M a ] T g s r s = [ g r s , s 1 s , . g r s , s M s ] T
In the inspection space, if a certain point ( r s ) is exactly at the location of a damage scattering source, then the corresponding guided wave propagation Green’s function vector g r s must be orthogonal to the Green’s function vector g ^ obtained from the singular value decomposition of the noise subspace. The imaging condition for the corresponding MUSIC method can be expressed as:
I 3 r s = 1 m = K + 1 M g ^ m a · g a r s n = K + 1 M g ^ n s · g s r s
The flowchart of DORT-MUSIC imaging method is shown in Figure 4.

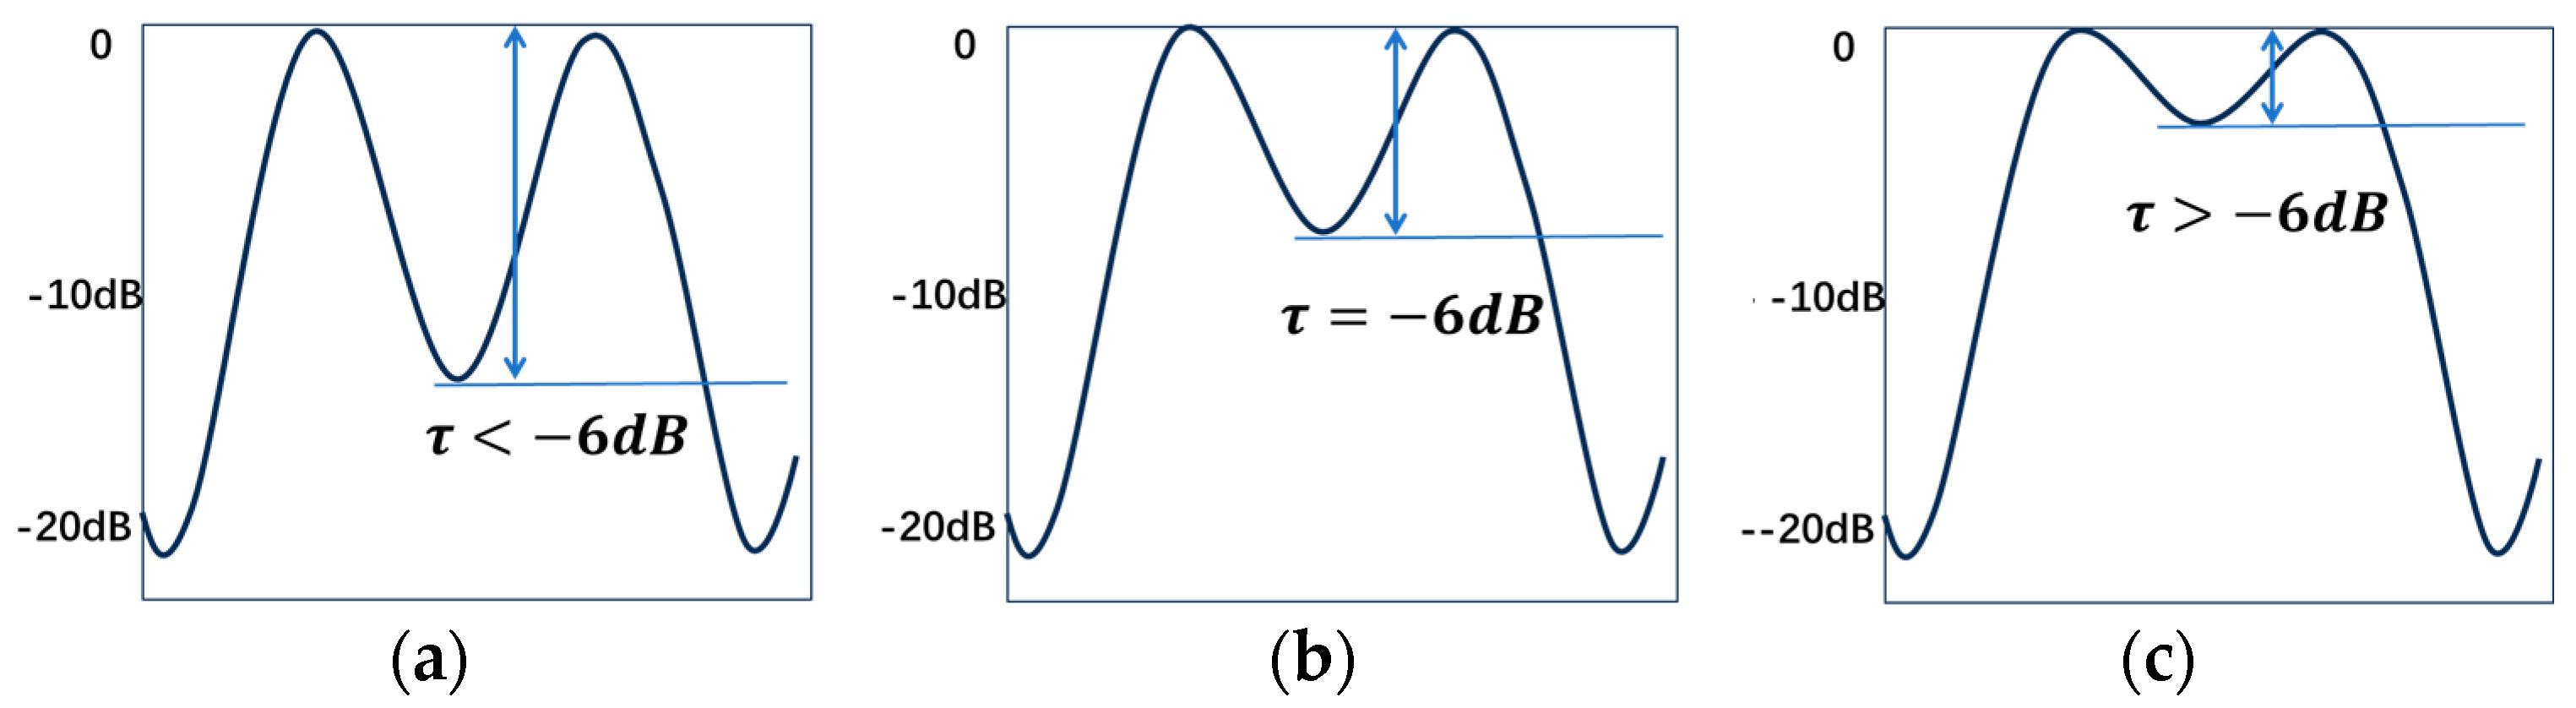
2.4. Performance Indicators

To indicate the localization capability and resolution capability of imaging methods for damage, an Array Performance Indicator (API) is introduced to indicate the size of the damage imaging hotspot area, defined as [39]:
API = A r e a 6 d B λ 2
The equation shows the ratio of the area of the imaging hotspot region (where the amplitude exceeds the 6   d B threshold) to the square of the wavelength. In this paper, the wavelength corresponds to the guided wave at the center frequency. A smaller index indicates that the hotspot region of this imaging method is more concentrated on the actual location of the damage, providing better resolution at the edges of the damage.
The peak-to-center intensity difference indicator τ [37] is used to evaluate the resolution capability of damage imaging methods for closely spaced double damages, which is defined as the attenuation multiple of the intensity at the center of the double damage imaging relative to the peak intensity of the damage, measured in dB. Figure 5 shows the resolution capabilities of damage imaging under different indicators.
The threshold for distinguishing damage is 6   d B , which means the peak center intensity is 25% of the damage peak intensity. When τ < 6   d B , the two imaging peaks of the double damage can be clearly distinguished, while when τ > 6   d B , the two imaging peaks overlap and are identified as a single damage. This indicates that a smaller threshold reflects better resolution capability of the imaging method.

2.5. Rayleigh Diffraction Limit

For comparison, we introduce the Rayleigh criterion used to estimate the diffraction limit of an array imaging system for two ideal point sources [40]:
θ R = 1.22 λ / D
In this formula, θ R denotes the minimum resolution angle determined by the Rayleigh criterion, λ is the wavelength, and D is the numerical aperture of the imaging system. According to the numerical simulations and experimental calculations in this chapter, D = 200 mm. The SLDV-measured out-of-plane guided wave signal predominantly corresponds to the A0 mode, with a guided wave wavelength of 7.6 mm at a center frequency of 250 kHz, resulting in θ R = 0.0464. Considering the distance L = 100 mm from the array to the damage imaging location, the resolution limit based on the Rayleigh criterion can be estimated:
d R = 4.64   m m = 0.61 λ

2.6. Numerical Simulation

A three-dimensional finite element numerical model, as shown in Figure 6, was established based on the finite element numerical computation platform COMSOL Multiphysics® 6.5. The material parameters of the plate are listed in Table 1. To avoid the influence of boundary reflections on guided waves, a Rayleigh damping absorbing boundary with a width of 50 mm was set at the boundary of the aluminum plate structure. The mass damping parameter α d M and the stiffness damping parameter β d K transition smoothly at the structure/damping boundary, gradually increasing with the depth of wave propagation into the damping layer. The material parameters are detailed in Table 1. The model allows for the configuration of different scales and quantities of damage as needed. The ultrasonic guided wave transducer array consists of 11 piezoelectric elements and employs an alternating excitation/receiving measurement scheme to collect out-of-plane velocity signal data. This is done to maintain consistency with the guided wave signals extracted by SLDV in the experiment, resulting in a total of 121 sets of actuation/sensing measurement sets for numerical simulation imaging.
In numerical simulations, to improve computational efficiency and reduce the physical fields that need to be coupled for solving the model, the ideal coupling effect between the piezoelectric transducer and the structure is equivalent to a localized force acting at the boundary of the transducer based on the pin force model proposed by V. Giurgiutiu et al. [1]. The excitation signal for the transducer unit is a sinusoidal guided wave signal modulated by a Gaussian window function.
F t = A s i n 2 π f c t exp 2 π f c t t 0 2 / B
where A is the amplitude control factor; f c is the center frequency of the excitation signal which is set at 250 kHz; and B is the time/frequency-domain bandwidth control factor, set at 20. At this point, the excitation waveform is a tri-peak wave, which has good temporal concentration, with an effective frequency range of approximately 120 kHz to 380 kHz at −6 dB, as shown in Figure 7; t 0 is the time-domain delay control parameter for the excitation signal.
To ensure the stability and convergence of the dynamic transient analysis, the 3D finite element model employs COMSOL’s Time-Dependent Solver with the Generalized-α method for time stepping. The solver time step of the finite element model must satisfy the Newmark time increment scheme, with at least 20 time steps within one period of wave propagation. According to this requirement, the 3D finite element model was discretized with a global mesh size of 0.23 mm (20 elements per wavelength at 380 kHz), refined to 0.01 mm near damage and transducers. The time step of 0.13 μs ensured numerical stability. The initial calculation step was set to 0.1 μs, and it automatically adjusts as the calculation process progresses.

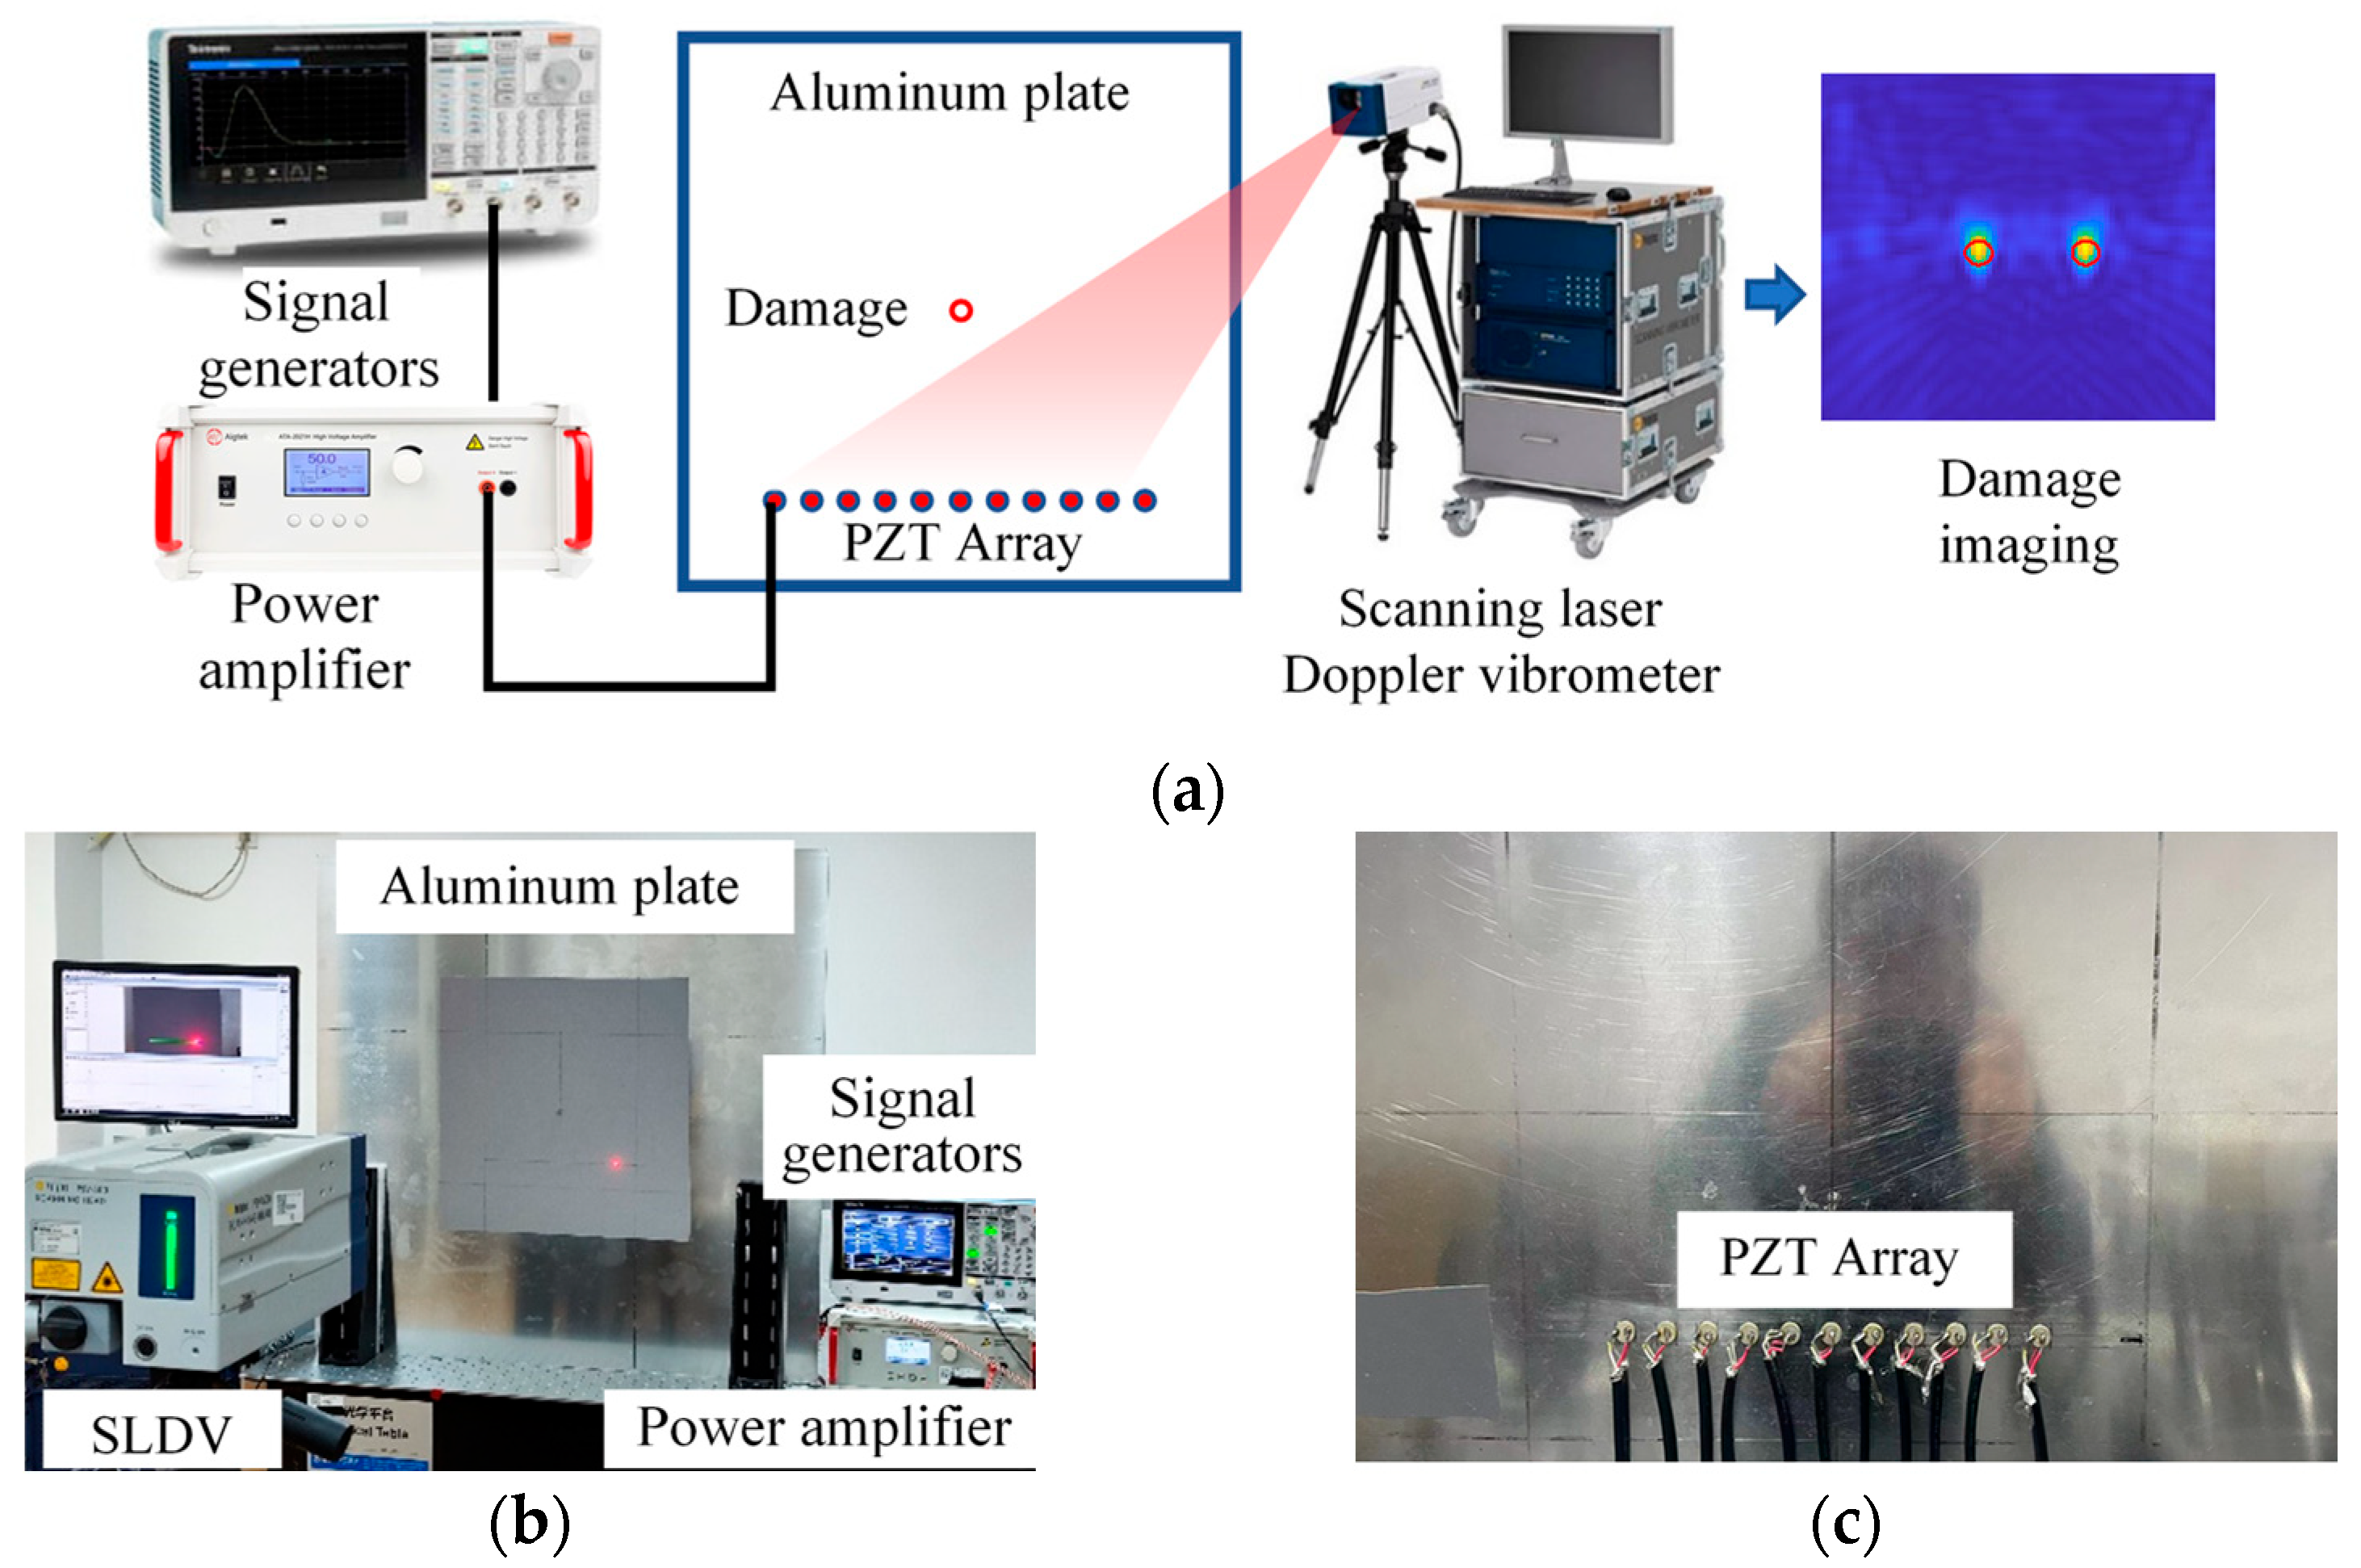
2.7. Experimental Validation

A PZT excitation/SLDV sensing experimental platform has been established, with the main experimental instruments including a scanning laser Doppler vibrometer (PSV-500, Polytec GmbH, Waldbronn, Germany), circular piezoelectric discs (PZT, APC851, Haiying, Wuxi, China, diameter 7 mm, thickness 0.2 mm), a power amplifier (ATA-2041, Aigtek, Xi’an, China), a signal generator (TEKTRONIX AFG31252, TEKTRONIX, Beaverton, OR, USA), and an AL6061 aluminum plate to be tested (1 m × 1 m × 2 mm). Different radius cylindrical magnets are attached in the central area of the plate as equivalent damage scattering sources. The excitation signal is generated by the signal generator, with parameters consistent with numerical simulations. The experimentally measured Young’s modulus of the aluminum plate was 68.8 GPa, showing slight differences compared to the numerical simulation. We incorporated the experimentally measured material parameters into the experimental imaging to ensure imaging accuracy.
Eleven piezoelectric elements are used for signal excitation, attached to the back of the plate structure along the line where y = 50 mm and x ranges from 50 mm to 250 mm, spaced 20 mm apart. In the experiment, the eleven piezoelectric driver units alternately excite ultrasonic guided wave signals, and the SLDV system collects out-of-plane velocity data triggered by the synchronous signal from the signal generator, with a sampling rate of 2.56 MHz. The SLDV system primarily captures the A0 mode of guided waves, thus avoiding the need for complex modal separation algorithms (not the focus of this study). At each measurement point, the signal is averaged over 25 times to reduce the random noise. The sampling points required for the imaging experiment coincide with the driving array, totaling 11 points. The schematic diagram and the physical image of the experimental system are shown in Figure 8.

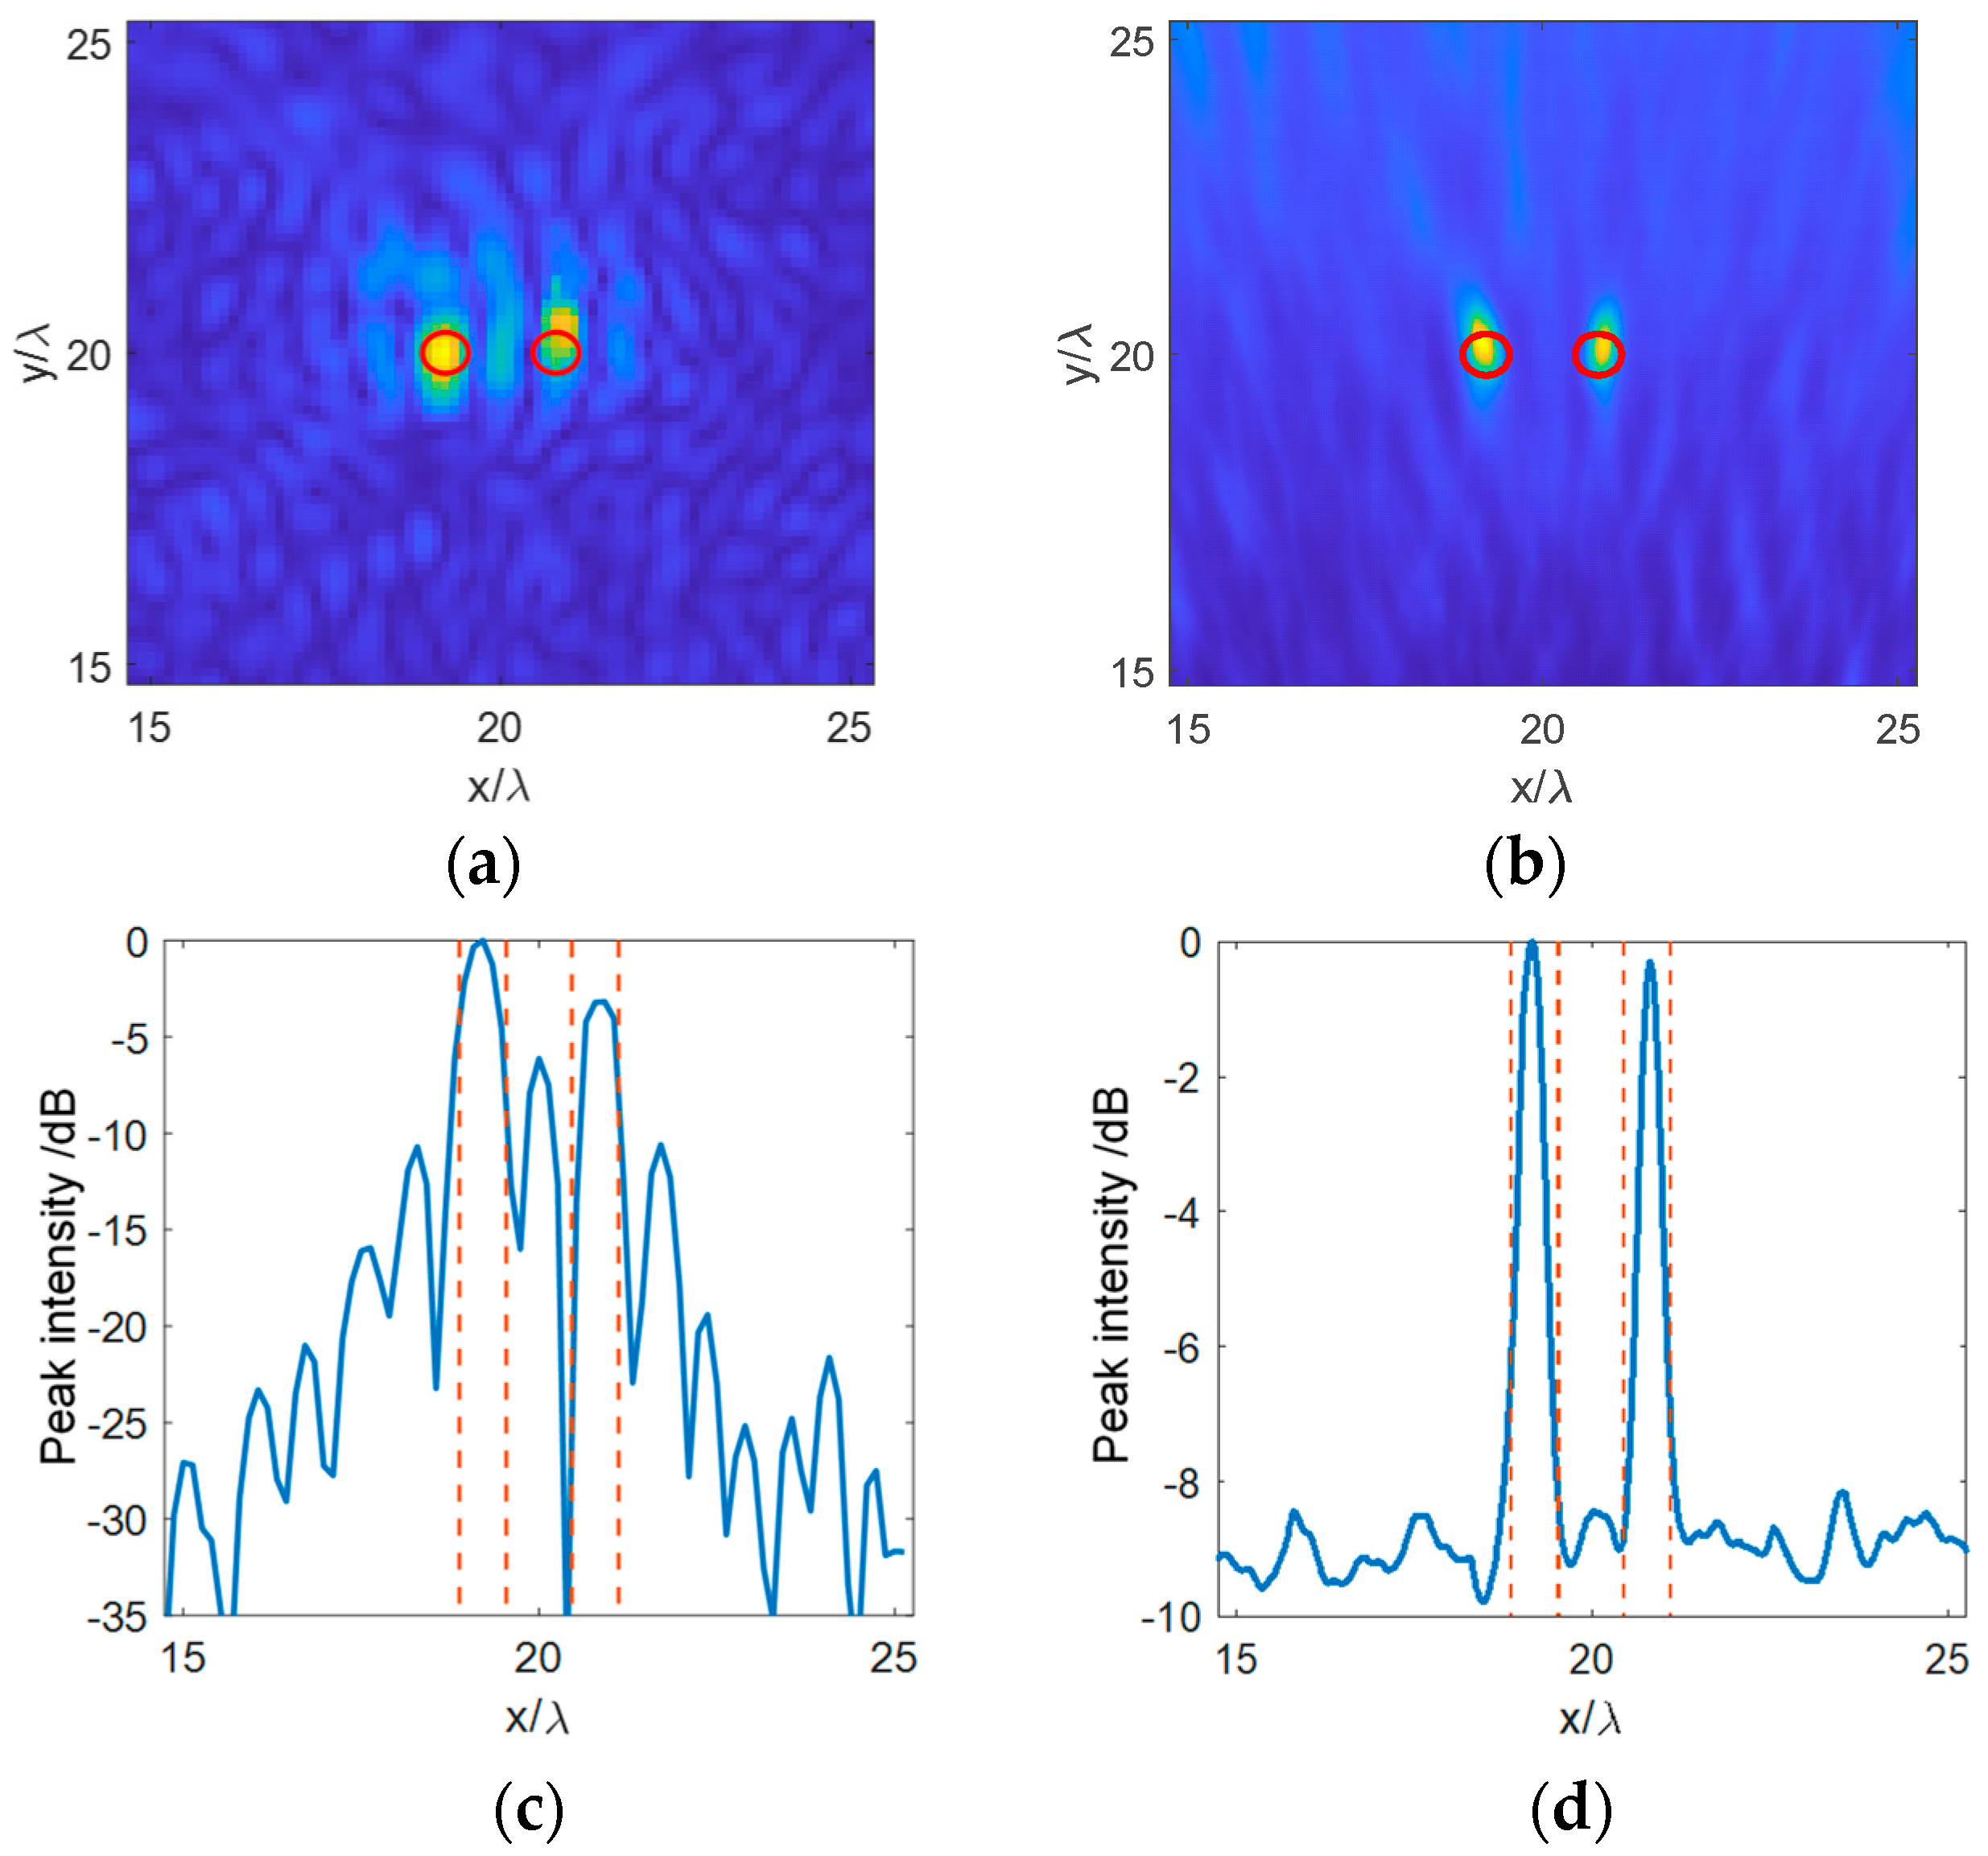
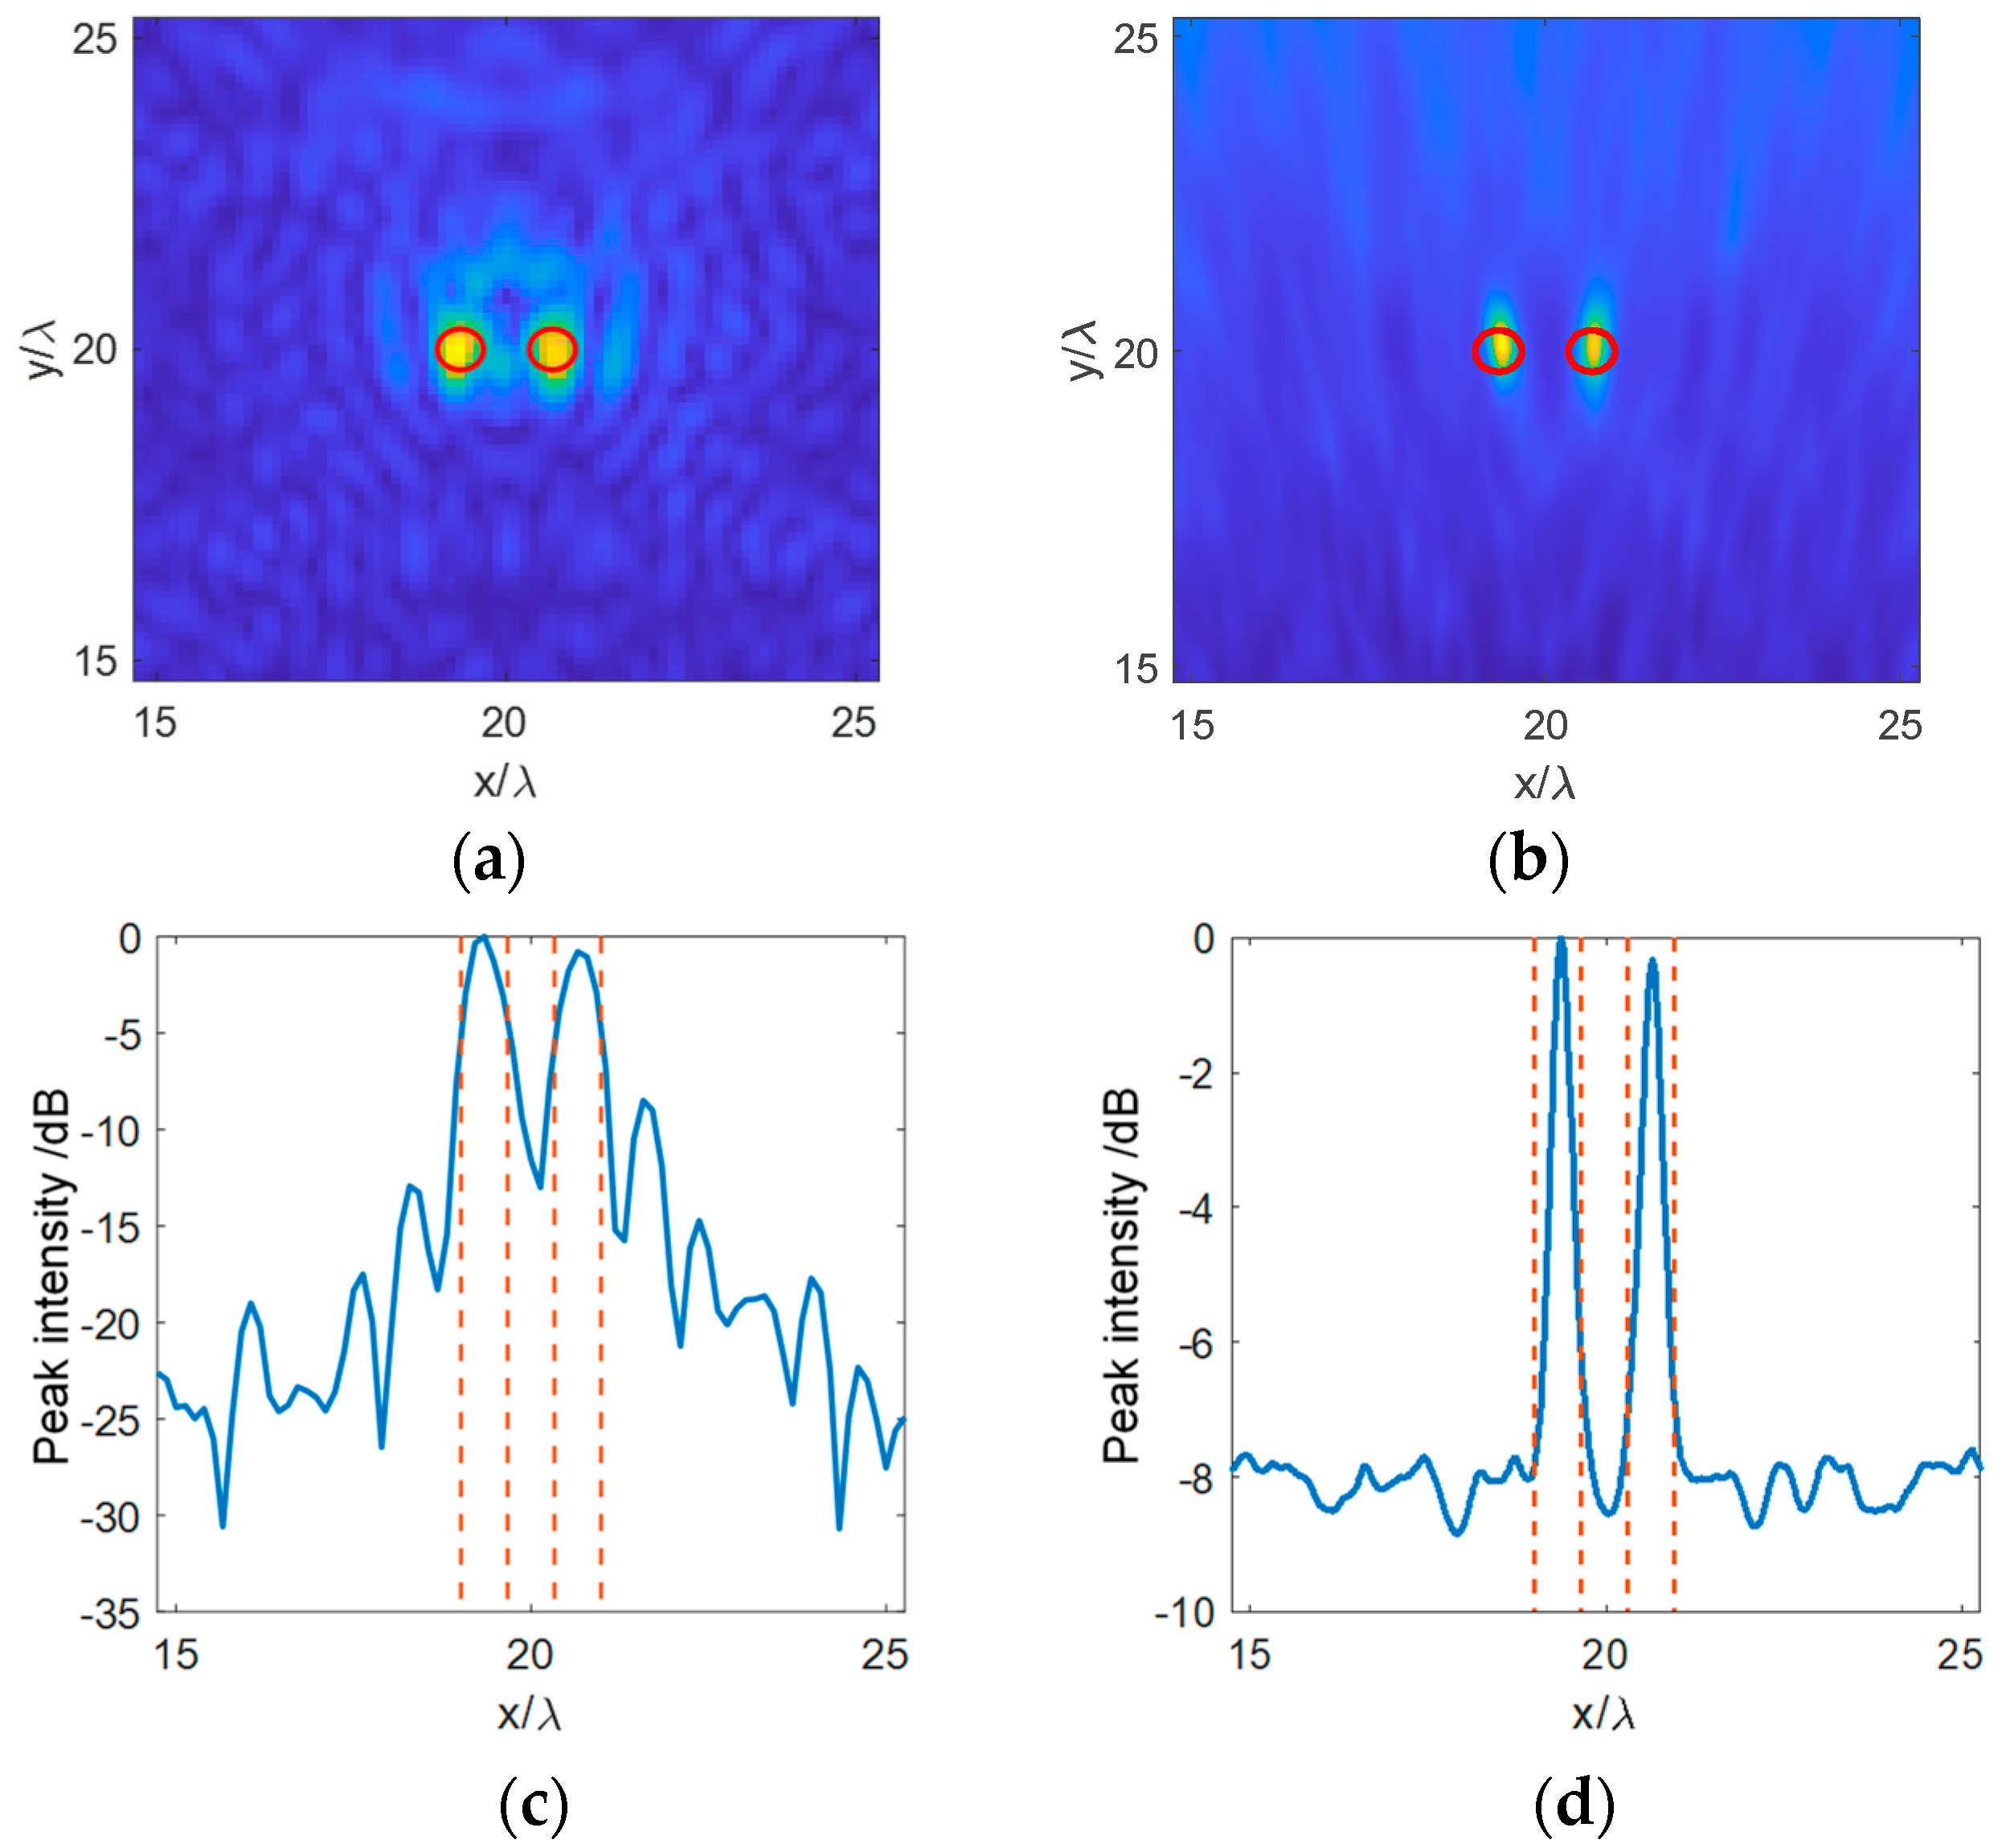
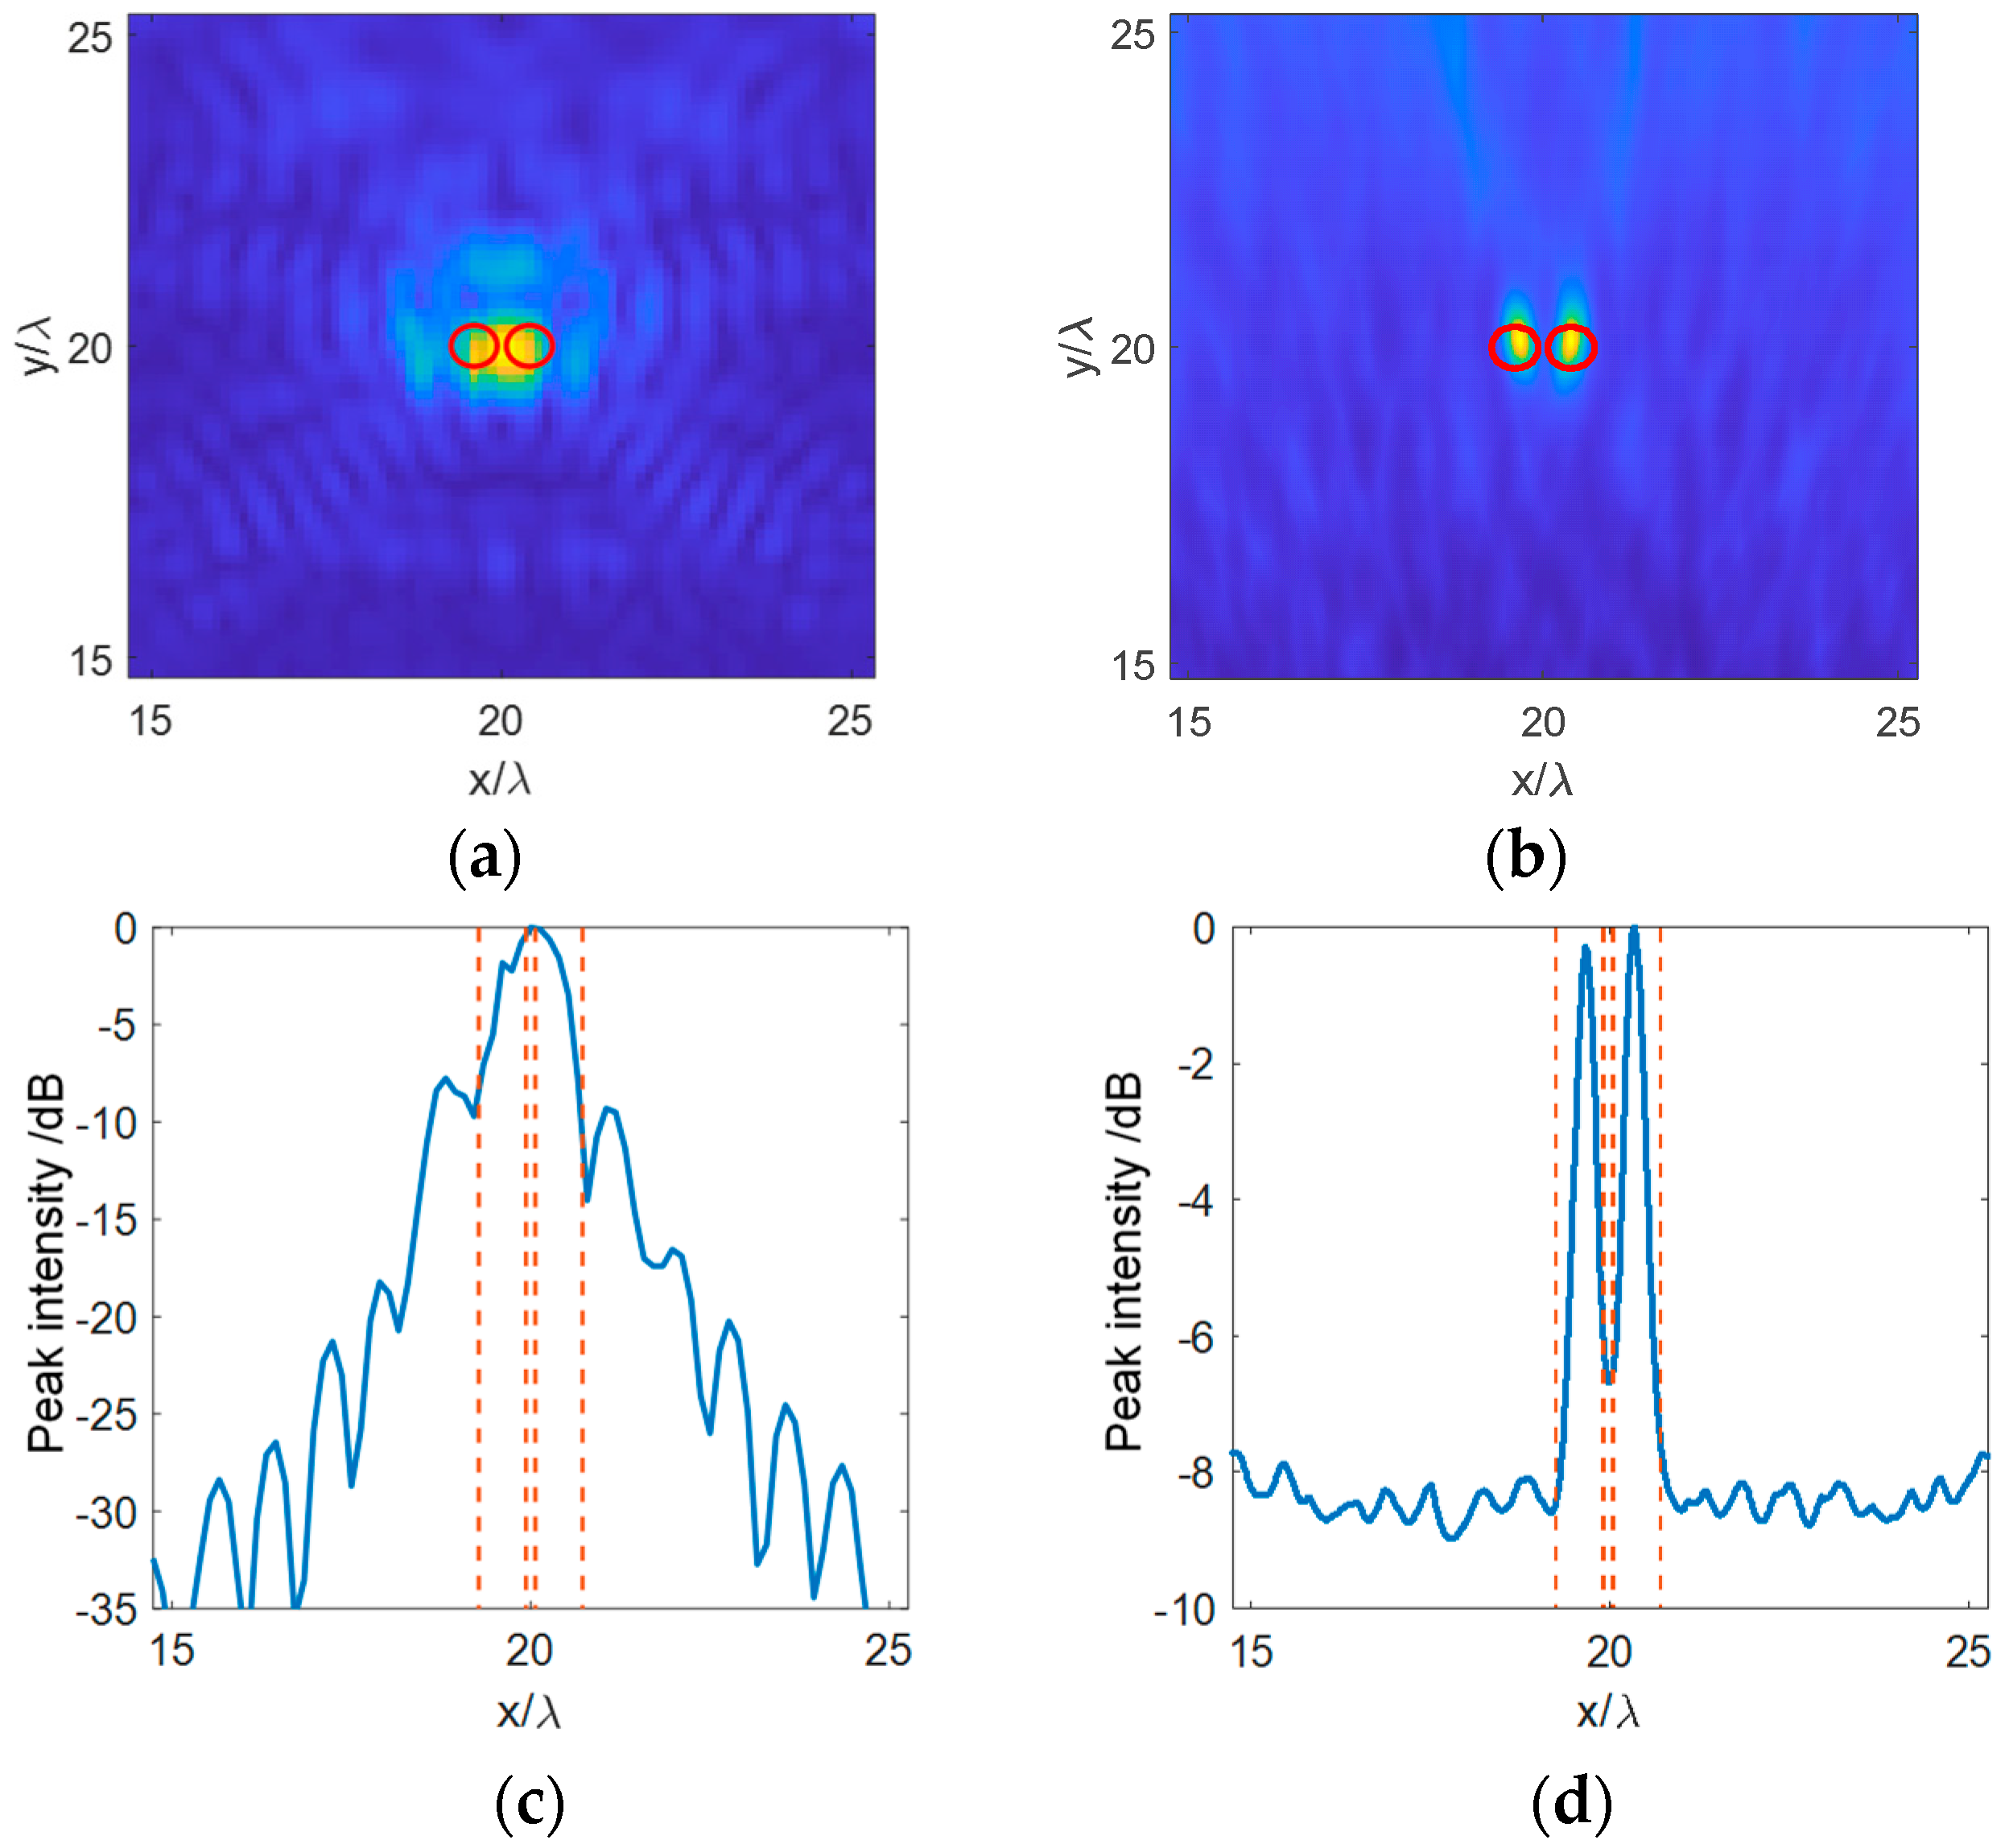
3. Results and Discussion

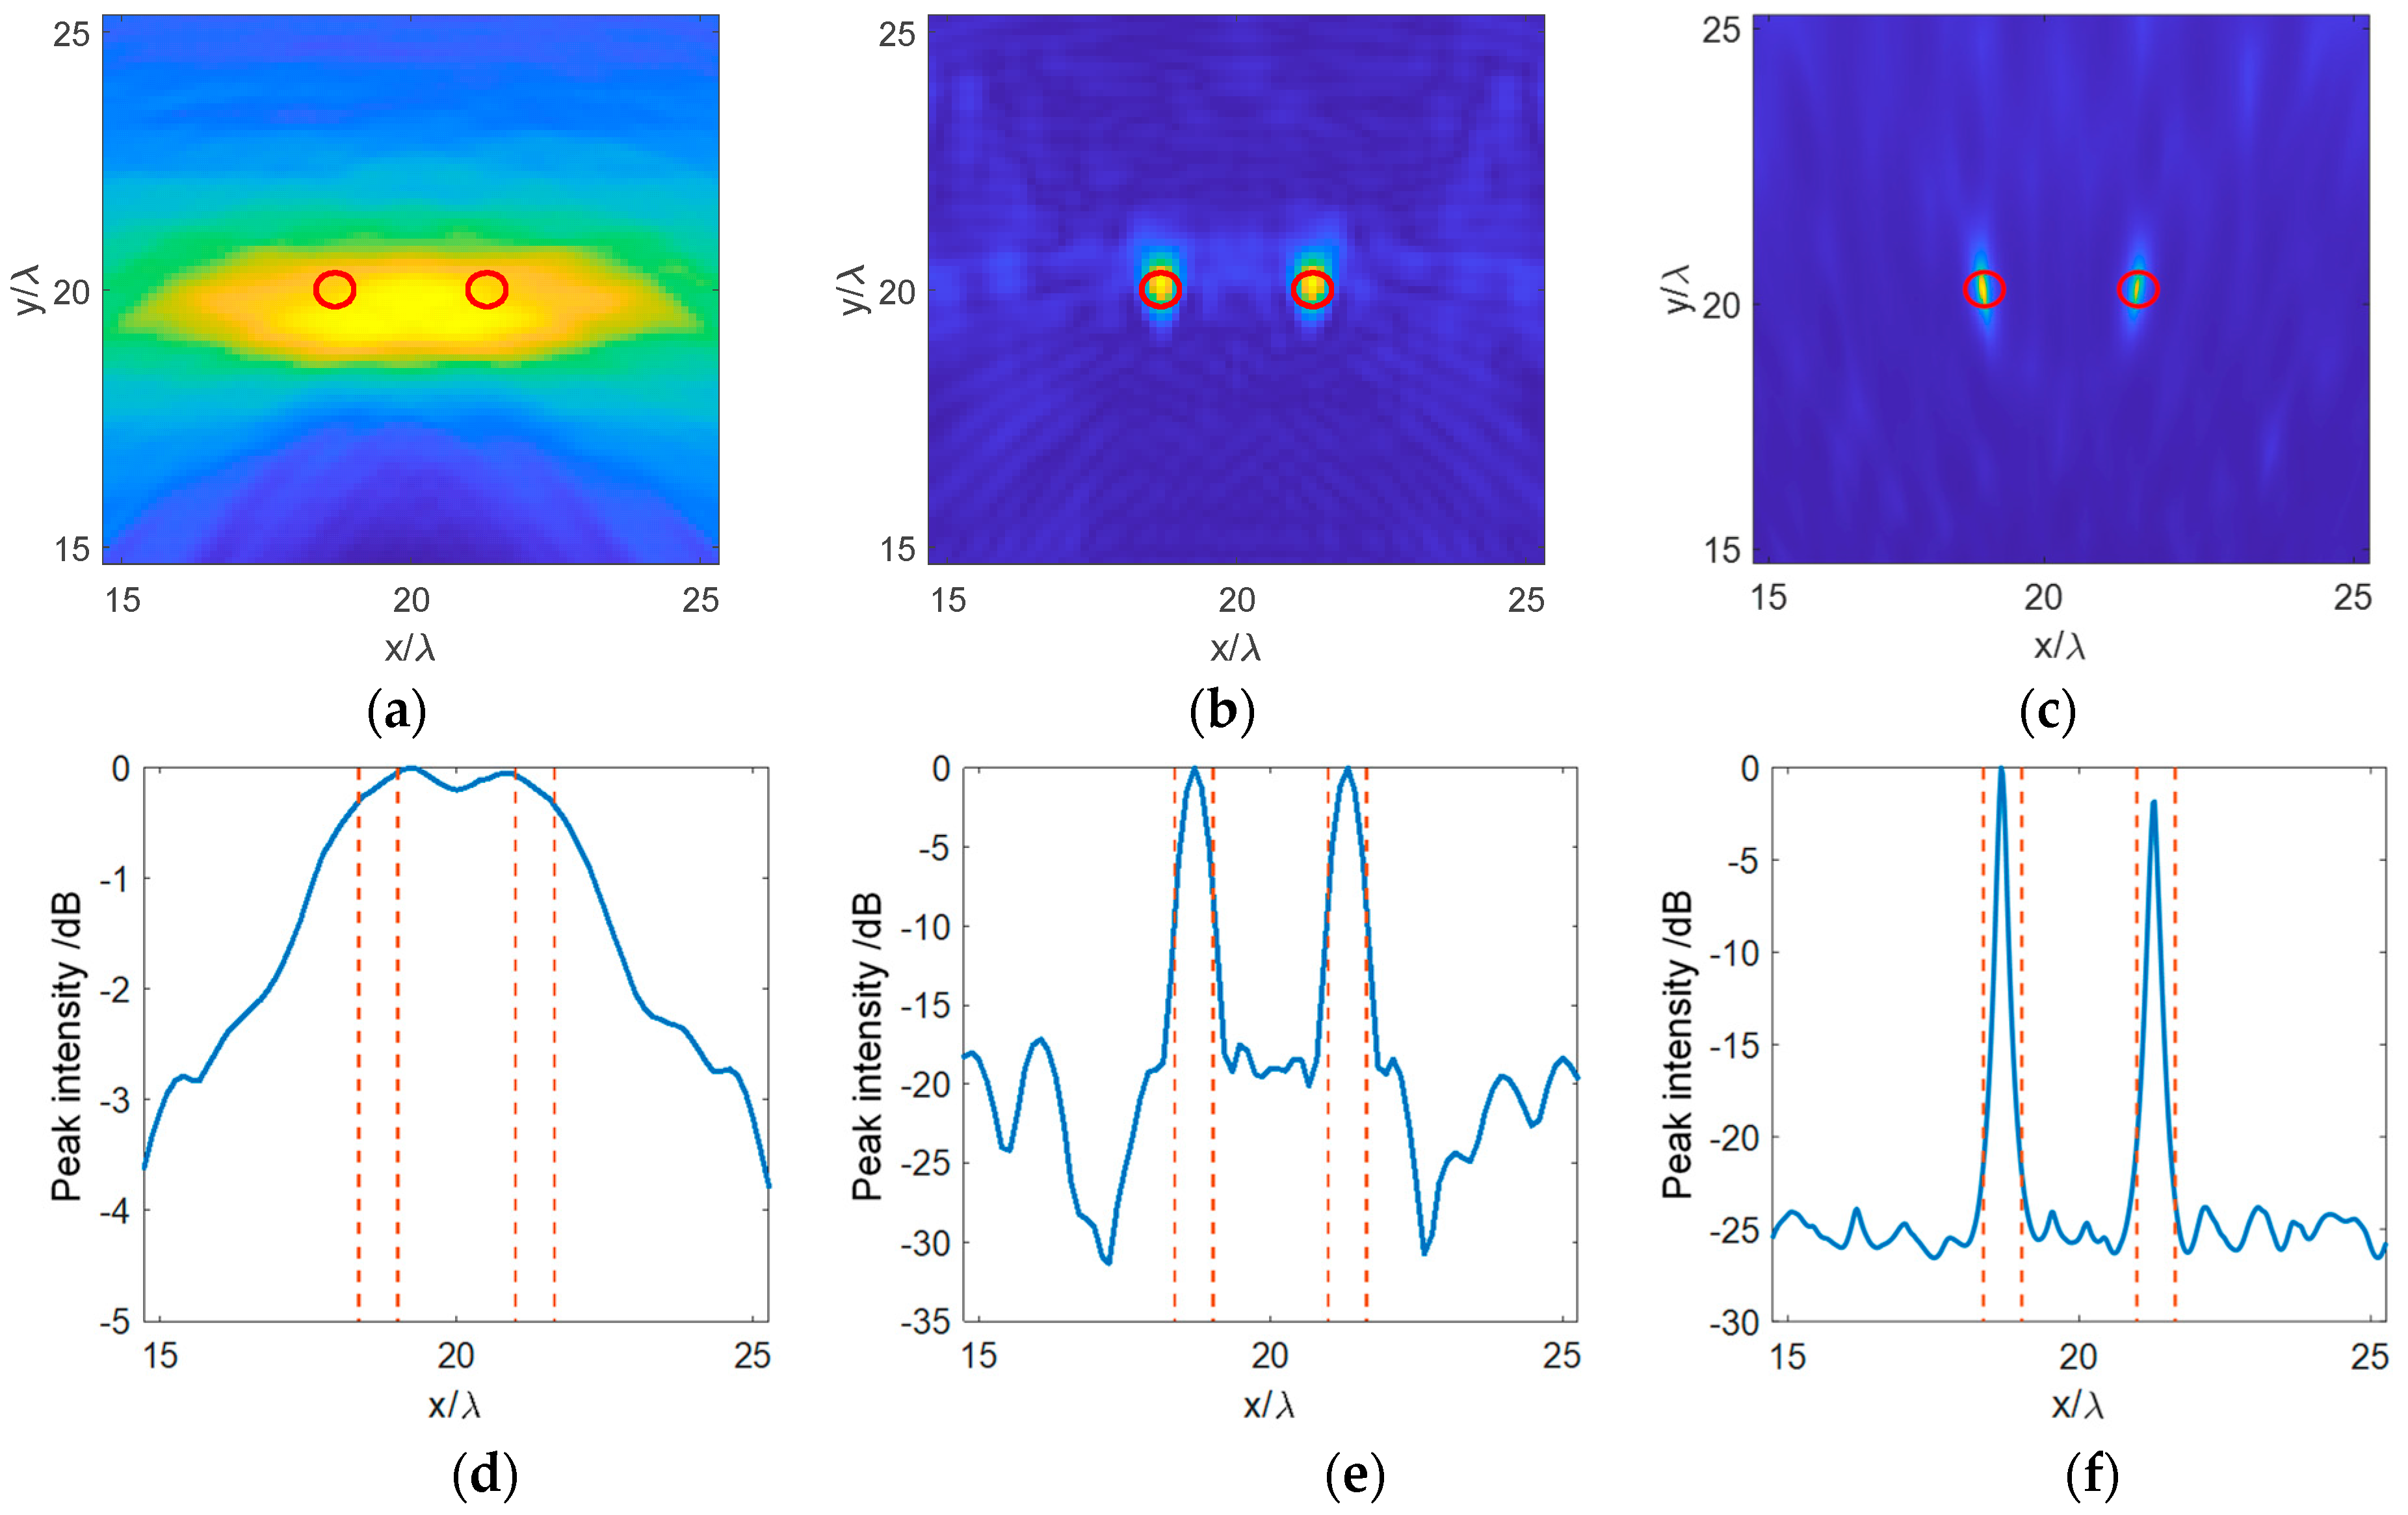
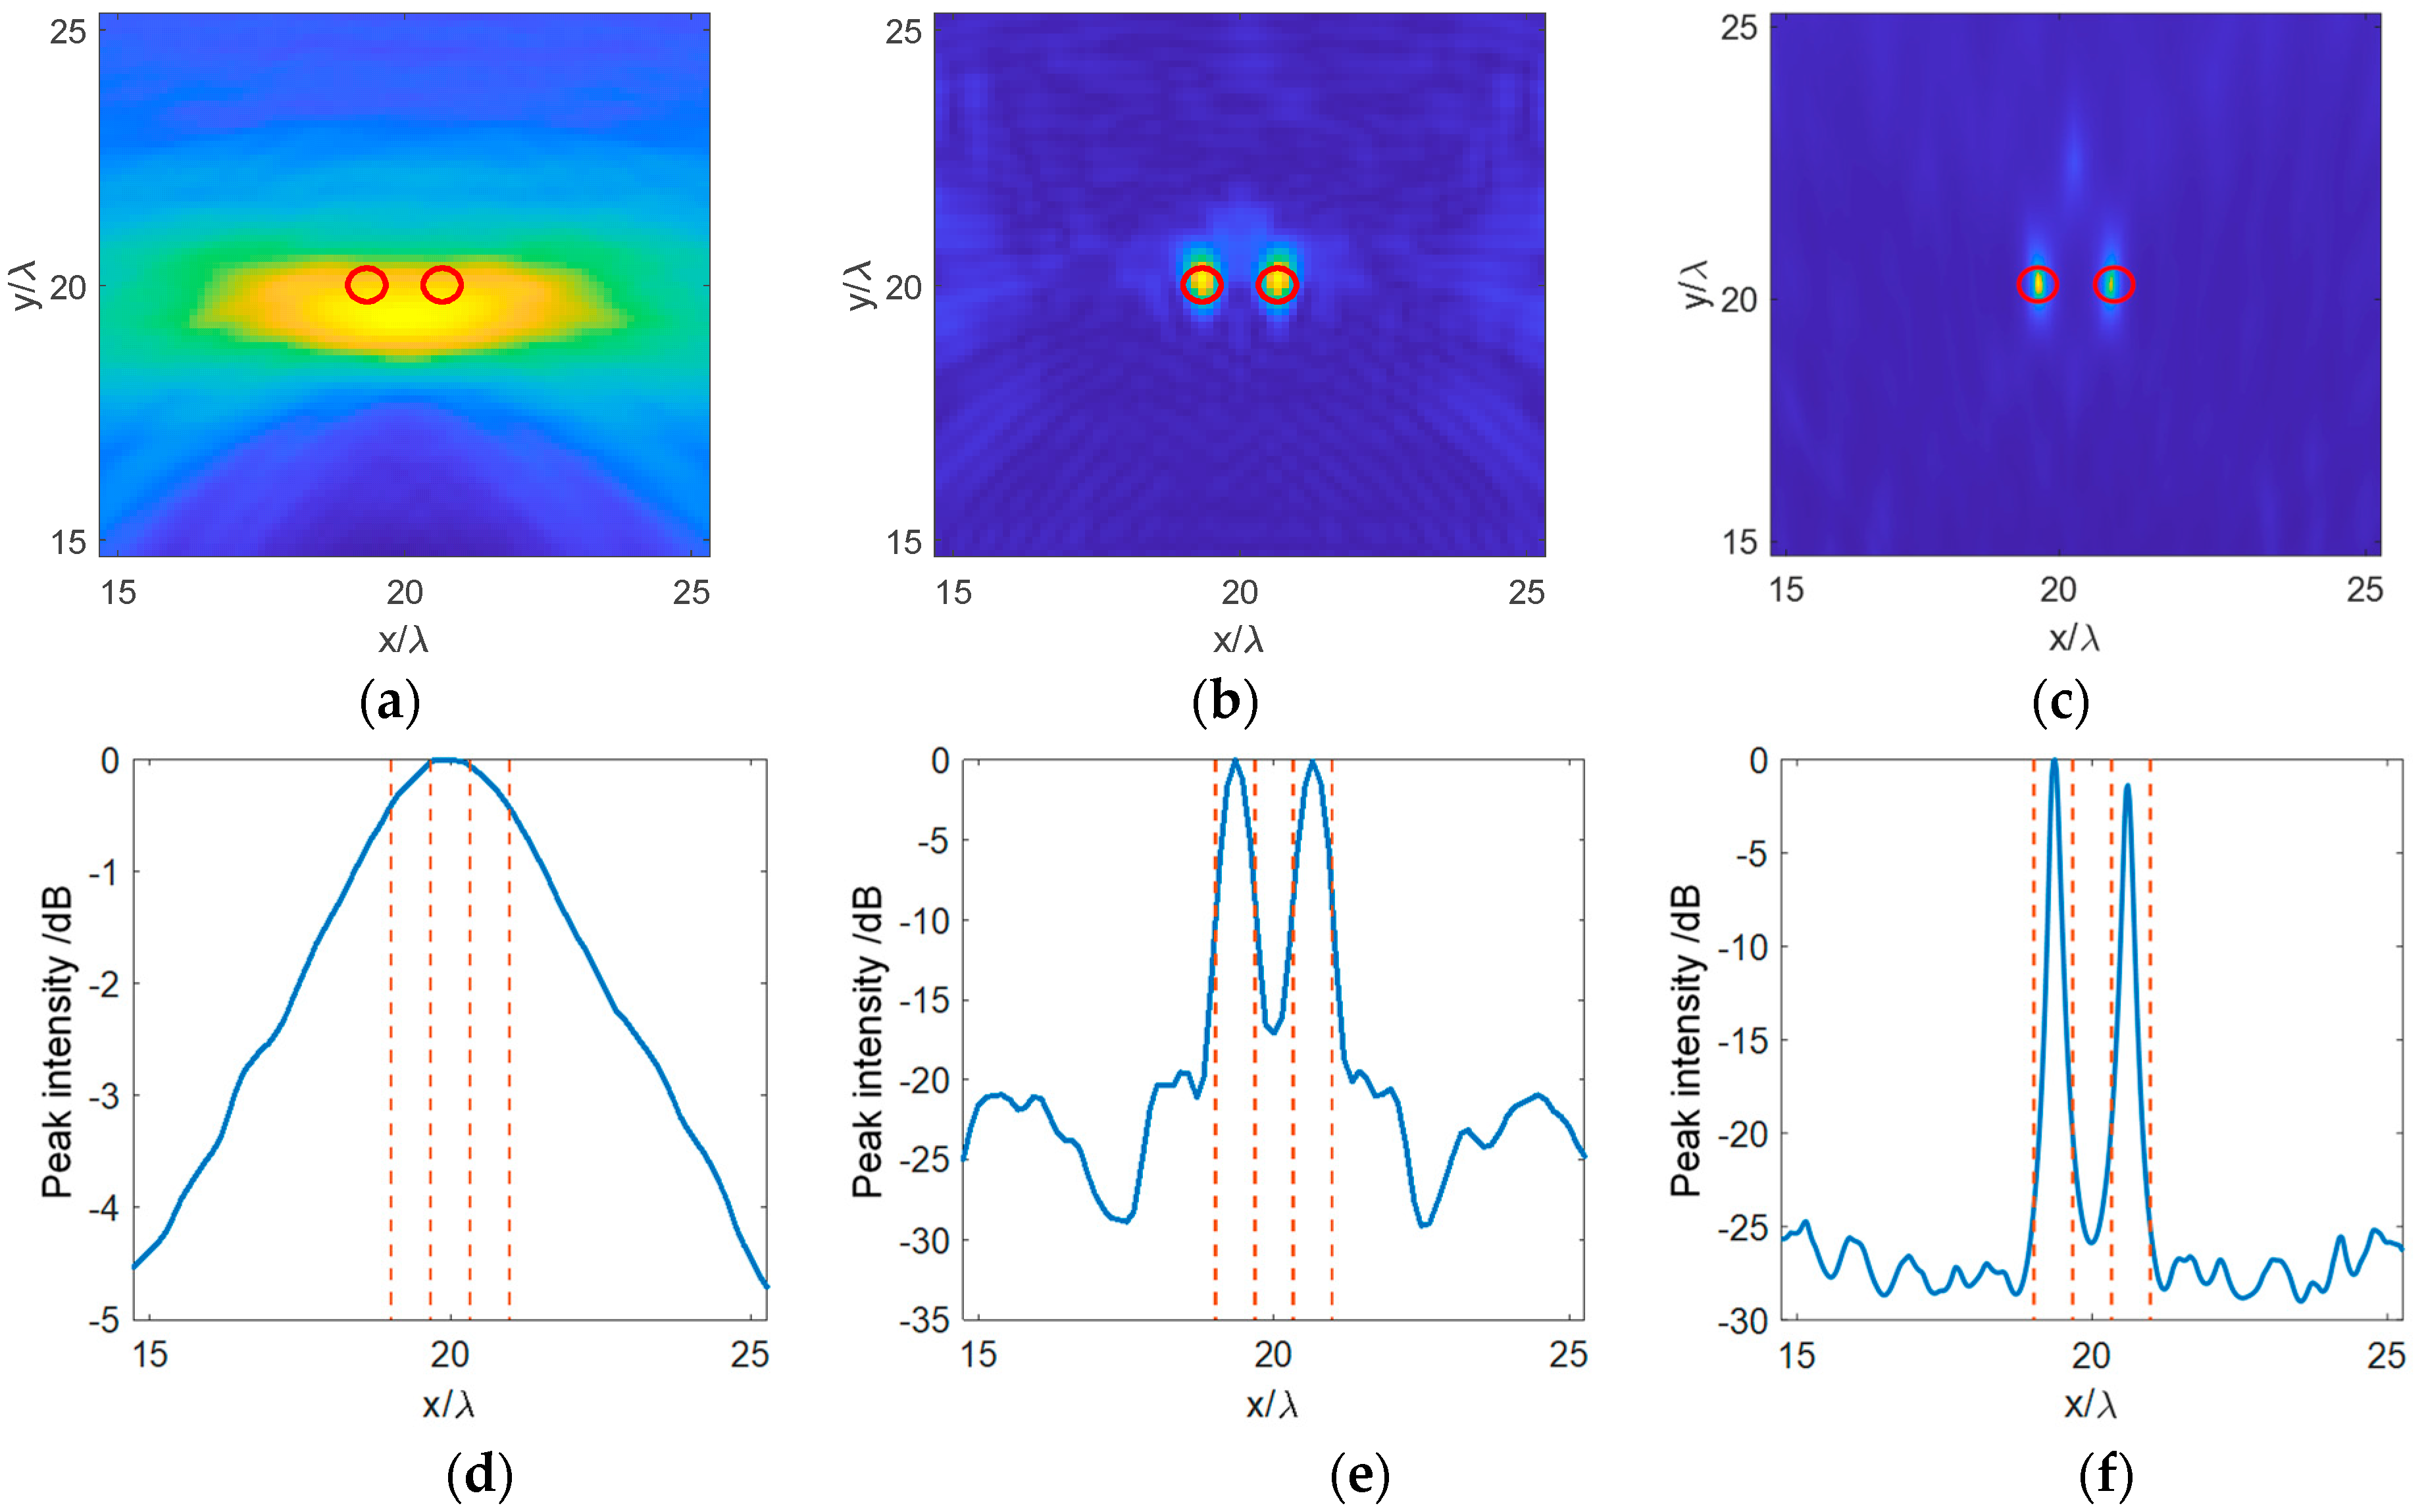
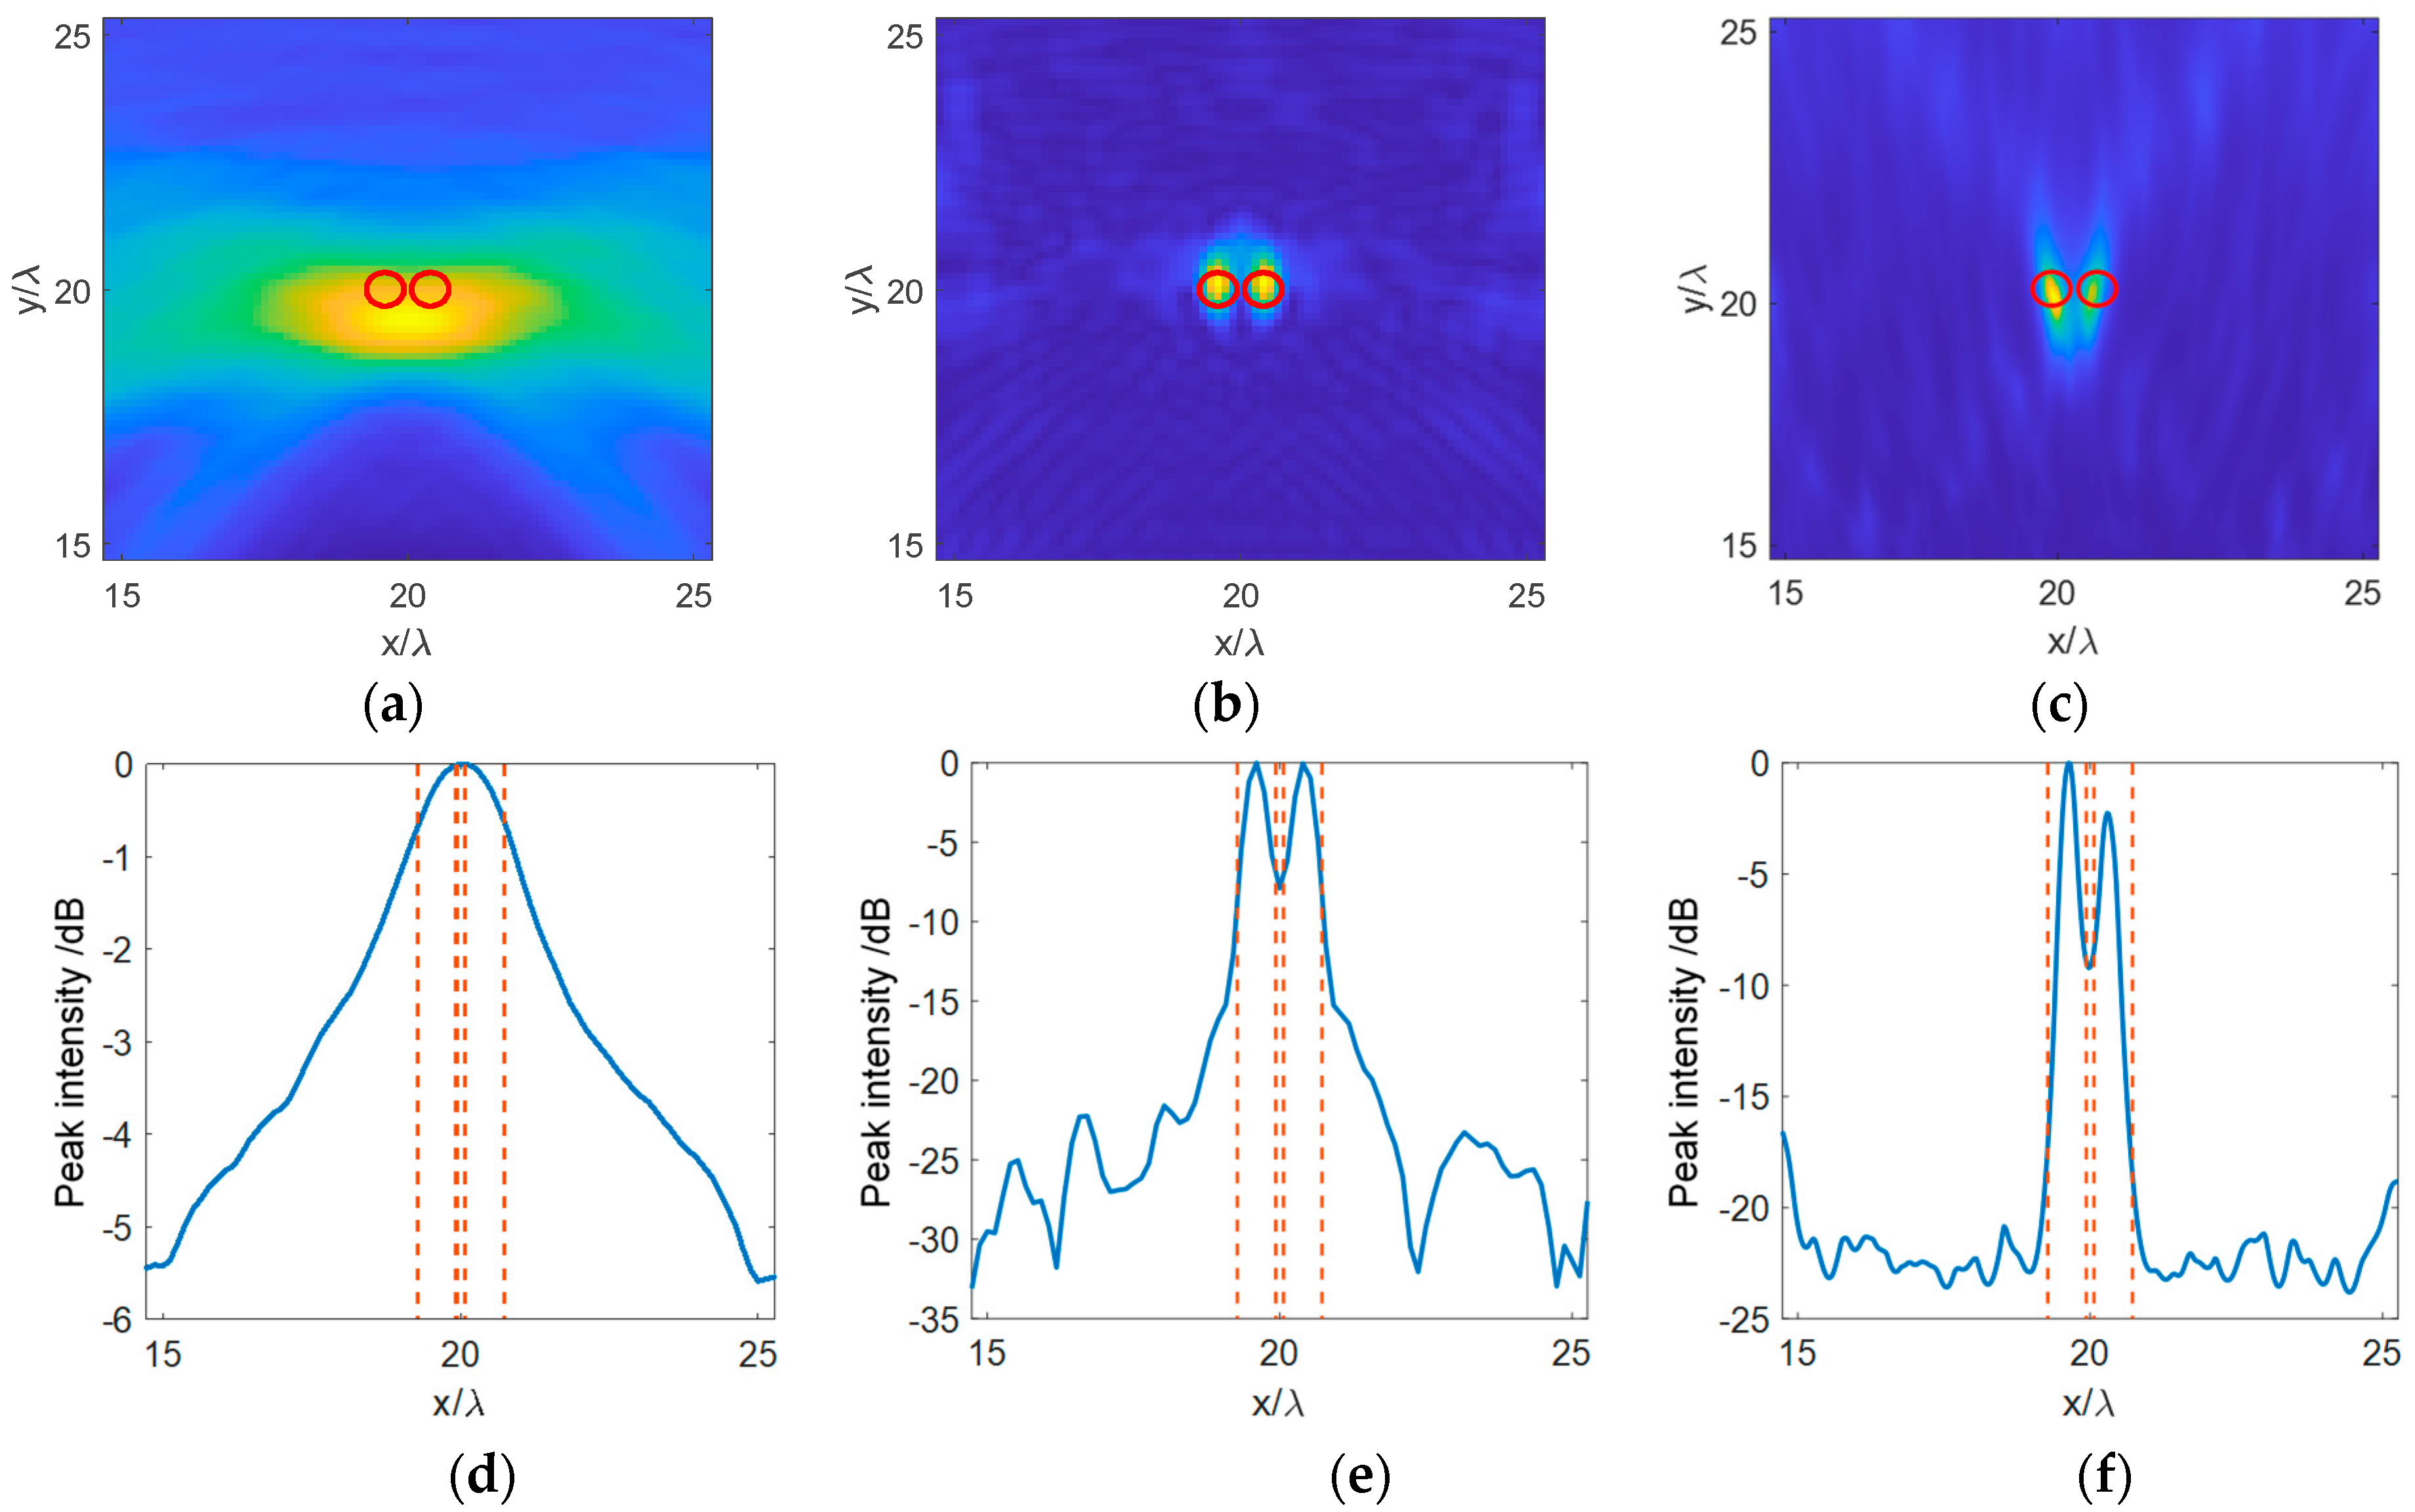
3.1. Numerical Simulation Results

To investigate the resolution capabilities of three imaging methods for multiple damages, numerical simulations were conducted on double through-hole damages distributed parallel to the array. The damage radius r = 2.5 mm and the imaging results of different damage center distances are shown in Figure 9, Figure 10, Figure 11 and Figure 12, with a comparison of the results presented in Table 2.
As the results show above, the coordinates of the local damage imaging plane and the peak intensity profile of the damage index are converted to ratios of spatial scale and the central wavelength of guided waves in the structure ( λ = 7.6   mm ). The red dashed line in the profile indicates the edge position of the damage. The damage diameter is 5 mm, approximately 0.66 λ , and the minimum distance between damages is d = 6   mm , approximately 0.79 λ , both of which are close to the diffraction limit. The results of various imaging indicators are shown in Table 2. Firstly, the time-domain DAS is limited by its relatively low circumferential (parallel to the array, same below) resolution, and under the different damage distance conditions mentioned above, it is unable to clearly distinguish between dual damages, only indicating the presence of damage in the structure with a single damage index peak and relatively low positional accuracy. This is mainly because the time-domain DAS cannot account for the dispersion effect of guided waves, leading to mispositioning and lower imaging resolution as it approximates the inversion of the full frequency range of guided wave signals using the phase velocity corresponding to the central frequency. As the distance between damages decreases, the API indicator of time-domain DAS imaging also gradually decreases. This is due to the overlapping of dual damages resulting in a single damage peak distribution range that declines as the damages approach, rather than an improvement in imaging resolution. Additionally, since the presence of dual damages cannot be distinguished, the peak center intensity difference index τ cannot be used to indicate changes in resolution under these conditions. The advantage of the time-domain DAS lies in its imaging efficiency. Since it does not require resolving and calculating delay superposition for each frequency, it can achieve near real-time imaging speeds.
For the frequency-domain DAS, its ability to examine high-frequency phase variation information allows for higher imaging accuracy and resolution. The imaging results can accurately indicate the distribution of dual damage locations with an accuracy of less than 1 mm. The array performance index (API) is approximately twice that of the single damage case, and the variation with decreasing damage distance is not significant, indicating that when damages are in close proximity, the spatial distribution of imaging peaks for each damage remains stable. Moreover, the portion of the scale above −6 dB is on the same order of magnitude as the wavelength, suggesting that its damage resolution capability is expected to approach the wavelength scale. Although the peak center intensity τ difference increases as the damages come closer together, even when d / λ is as low as 0.79, τ = 7.4   dB remains above the preset resolution threshold of −6 dB, indicating that under these conditions, the presence of dual damage can still be fully resolved, with resolution capability approaching the diffraction limit. This further corroborates the aforementioned conclusions.
The DORT-MUSIC method demonstrates a more prominent imaging resolution performance. The circumferential deviation of the damage center relative to the array is less than 0.6 mm, and the radial deviation is less than 1.8 mm, indicating that its circumferential positioning accuracy is superior to the radial. At the same time, the peak center intensity difference τ increases as the damage approaches; even when the distance to the damage center in the calculation is 6 mm (0.79 λ , close to the diffraction limit) and the edges of the double damage are only 1 mm apart, the τ indicator can still reach −9.2 dB. Combined with the two-dimensional imaging results, the double damage can still be clearly distinguished at this point. Additionally, the array performance index (API) does not show significant variation, with a maximum change of no more than 0.34, indicating that under the numerical calculation conditions, the peak of the damage imaging can clearly locate the damage area, and the imaging results maintain a high signal-to-noise ratio.

3.2. Experiment Results

Based on the experimental data from the 11 constructed PZT unit drives and 11 sensing points using SLDV sensing, frequency-domain DAS and DORT-MUSIC methods were employed to image dual damages located at different distances with a radius of 2.5 mm. Since the out-of-plane velocity signals from SLDV sensing are primarily composed of A0 mode guided wave components, the imaging focused mainly on the A0 mode guided wave components. The results are shown in Figure 13, Figure 14, Figure 15 and Figure 16, with a comparison of the results presented in Table 3.
Our results demonstrate distinct performance characteristics between the imaging methods under experimental noise conditions. While numerical simulations have shown that under the condition of dual damage, the time-domain DAS cannot clearly distinguish the presence of dual damage, both frequency-domain DAS and DORT-MUSIC achieve superior results by incorporating dispersion relations for solving. The frequency-domain DAS still maintains a high positioning accuracy, while the maximum deviation in the relative array radial (y-direction) positioning is 4 mm. When the damage distance is relatively far, the peak-to-center intensity difference index is less affected by experimental measurement data noise. However, due to the relatively weak scattering from artificial damage, it was difficult to distinguish the presence of dual damage in the experimental measurements for the case of d = 6 mm, resulting in a decrease in resolution compared to numerical calculations.
In contrast, DORT-MUSIC shows remarkable super-resolution capability, resolving 6 mm spacings in simulations (τ = −9.2 dB). The super-resolution capability stems from the interaction of evanescent waves’ high wave number components localized near the damage with propagating waves during multiple scattering events, as theorized by Simonetti [28]. These evanescent waves encode subwavelength damage information, which is retrieved through the time-reversal and subspace orthogonality principles inherent to DORT-MUSIC. It should also be noted that DORT-MUSIC is more sensitive to experimental noise (τ = −6.7 dB), as shown in Figure 17. This noise-dependent behavior aligns precisely with Davy et al.’s theoretical framework [38], whereas the distance between two scatterers decreases, the orthogonality of the signal subspace degrades, leading to a sharp decline in noise tolerance. The superior resolution of DORT-MUSIC highlights the critical role of noise control in practical applications. The most convenient method for reducing random noise is to use multiple measurements and averaging. In addition, deconvolution techniques, such as Wiener filtering, can also suppress noise and enhance damage-related components in the signal spectrum [41].
The advantages and disadvantages of these imaging methods are shown in Table 4, which provides clear guidance for method selection based on engineering needs: time-domain DAS is ideal for rapid inspections of large, simple structures like pipelines or storage tanks, where computational speed is critical, and moderate resolution is acceptable. Frequency-domain DAS is suitable for aerospace components where dispersion compensation improves accuracy for complex geometries. DORT-MUSIC is best for high-precision applications in controlled, high-SNR environments, such as detecting microcracks in turbine blades or composite materials, where near-diffraction-limit resolution is required despite higher computational costs. Simultaneously, when facing the detection requirements of large and complex structures, the application of frequency-domain imaging methods is limited by the need for structural dispersion relationships and even guided wave inversion calculations. While all methods involve trade-offs between resolution, scalability, and complexity, their complementary advantages enable a hierarchical monitoring strategy: using time-domain DAS for global surveillance and frequency-domain DAS or DORT-MUSIC for localized high-fidelity diagnostics in critical substructures.

4. Conclusions

This paper compares the detection accuracy and resolution of the time-domain DAS, the frequency-domain DAS, and the DORT-MUSIC damage imaging method. The results show that, compared to traditional time-domain imaging methods, the frequency-domain imaging method that incorporates dispersion relationships exhibits significantly higher imaging accuracy. Additionally, this work represents experimental demonstration of DORT-MUSIC’s near-diffraction-limit resolution (0.79λ) in guided wave imaging, validating Simonetti’s theoretical predictions [28] under realistic SNR constraints, where evanescent waves generated during multiple scattering events carry subwavelength information that is recoverable through time-reversal subspace processing. In experimental environments with higher noise levels, the resolution is constrained by the degradation of signal subspace orthogonality, as predicted by Davy et al. [38]. Our experimental setup utilized an idealized aluminum plate with known dispersion characteristics engineering applications in complex structures and high-noise environments. The quantified trade-offs between computational complexity, resolution, and noise robustness provide practical criteria for method selection in industrial applications, thus advancing ultrasonic guided wave imaging in structural health monitoring.

Author Contributions

Conceptualization, C.X. and B.X.; methodology, C.X. and Y.L.; software, G.X.; validation, C.X. and S.Z.; formal analysis, C.X.; investigation, S.Z.; resources, C.X.; data curation, C.X.; writing—original draft preparation, C.X.; writing—review and editing, Y.L.; visualization, C.X.; supervision, Y.L.; project administration, Y.L.; funding acquisition, Y.L. All authors have read and agreed to the published version of the manuscript.

Funding

This research was funded by the National Natural Science Foundation of China (NNSFC) (Grant Nos. 62071205, 62271235 and 12072133) and the Research Innovation Program for College Graduates of Jiangsu Province (Grant Nos. KYLX15_1045).

Institutional Review Board Statement

Not applicable.

Informed Consent Statement

Not applicable.

Data Availability Statement

The original contributions presented in the study are included in the article, further inquiries can be directed to the corresponding author.

Conflicts of Interest

The authors declare no conflicts of interest.

References

  1. Giurgiutiu, V. Structural Health Monitoring: With Piezoelectric Wafer Active Sensors; Elsevier: Amsterdam, The Netherlands, 2007. [Google Scholar]
  2. Di Ianni, T.; De Marchi, L.; Perelli, A.; Marzani, A. Compressive sensing of full wave field data for structural health monitoring applications. IEEE Trans. Ultrason. Ferroelectr. Freq. Control 2015, 62, 1373–1383. [Google Scholar] [CrossRef] [PubMed]
  3. Yu, L.; Tian, Z.; Leckey, C.A. Crack imaging and quantification in aluminum plates with guided wave wavenumber analysis methods. Ultrasonics 2015, 62, 203–212. [Google Scholar] [CrossRef] [PubMed]
  4. Lugovtsova, Y.; Bulling, J.; Mesnil, O.; Prager, J.; Gohlke, D.; Boller, C. Damage quantification in an aluminium-CFRP composite structure using guided wave wavenumber mapping: Comparison of instantaneous and local wavenumber analyses. NDT E Int. 2021, 122, 102472. [Google Scholar] [CrossRef]
  5. Tabjula, J.L.; Kanakambaran, S.; Kalyani, S.; Rajagopal, P.; Srinivasan, B. Outlier analysis for defect detection using sparse sampling in guided wave structural health monitoring. Struct. Control Health Monit. 2021, 28, e2690. [Google Scholar] [CrossRef]
  6. Shen, R.; Zhou, Z.; Xu, G.; Zhang, S.; Xu, C.; Xu, B.; Luo, Y. Adaptive Weighted Damage Imaging of Lamb Waves Based on Deep Learning. IEEE Access 2024, 12, 128860–128870. [Google Scholar] [CrossRef]
  7. Shen, R.; Zhou, Z.; Xu, G.; Zhang, S.; Xu, C.; Xu, B.; Luo, Y. Adaptive Beamforming Damage Imaging of Lamb Wave Based on CNN. Appl. Sci. 2025, 15, 3801. [Google Scholar] [CrossRef]
  8. Sicard, R.; Goyette, J.; Zellouf, D. A SAFT algorithm for lamb wave imaging of isotropic plate-like structures. Ultrasonics 2002, 39, 487–494. [Google Scholar] [CrossRef]
  9. Gaul, T.; Schubert, L.; Weihnacht, B.; Frankenstein, B. Localization of defects in pipes using guided waves and synthetic aperture focussing technique (SAFT). In Proceedings of the EWSHM-7th European Workshop on Structural Health Monitoring, Nantes, France, 8–11 July 2014. [Google Scholar]
  10. Sun, X.; Lin, L.; Jin, S. Resolution enhancement in ultrasonic TOFD imaging by combining sparse deconvolution and synthetic aperture focusing technique (Sparse-SAFT). Chin. J. Mech. Eng. 2022, 35, 94. [Google Scholar] [CrossRef]
  11. Lyu, Y.; Hong, H.; Song, G.; He, C. A Simplified Integration of Multi-Channel Ultrasonic Guided Wave System for Phased Array Detection and Total Focusing Imaging. Int. J. Acoust. Vib. 2021, 26, 104–109. [Google Scholar] [CrossRef]
  12. Zhang, J.; Drinkwater, B.W.; Wilcox, P.D.; Hunter, A.J. Defect detection using ultrasonic arrays: The multi-mode total focusing method. NDT E Int. 2010, 43, 123–133. [Google Scholar] [CrossRef]
  13. Shen, P.; Wu, Y.; Luo, Z.; Wu, Z.; Jing, J.; Zhang, H. Advanced orthogonal frequency and phase modulated waveform for ultrasonic phased array tfm detection in cfrp composites. IEEE Trans. Instrum. Meas. 2024, 73, 1–10. [Google Scholar] [CrossRef]
  14. Li, X.; Xiang, Y.; Liu, L.; Xuan, F.-Z. Ultrasonic guided wave phased array based on reconstructed pulse-echo signals from phase information. J. Phys. Conf. Ser. 2024, 2822, 012111. [Google Scholar] [CrossRef]
  15. Zhu, W.; Xiang, Y.; Zhang, H.; Zhang, M.; Fan, G.; Zhang, H. Super-resolution ultrasonic Lamb wave imaging based on sign coherence factor and total focusing method. Mech. Syst. Signal Process. 2023, 190, 110121. [Google Scholar] [CrossRef]
  16. Park, H.W.; Kim, S.B.; Sohn, H. Understanding a time reversal process in Lamb wave propagation. Wave Motion 2009, 46, 451–467. [Google Scholar] [CrossRef]
  17. Ing, R.K.; Fink, M. Time-reversed Lamb waves. IEEE Trans. Ultrason. Ferroelectr. Freq. Control 1998, 45, 1032–1043. [Google Scholar] [CrossRef]
  18. He, J.; Yuan, F.-G. Lamb-wave-based two-dimensional areal scan damage imaging using reverse-time migration with a normalized zero-lag cross-correlation imaging condition. Struct. Health Monit. 2017, 16, 444–457. [Google Scholar] [CrossRef]
  19. Lang, Y.; Yang, Z.; Kong, D.; Zhang, W.; Chen, X. Forward-propagation-free focusing MUSIC algorithm for Lamb waves. Struct. Health Monit. 2023, 22, 3856–3870. [Google Scholar] [CrossRef]
  20. Fan, S.; Zhang, A.; Sun, H.; Yun, F. A local TR-MUSIC algorithm for damage imaging of aircraft structures. Sensors 2021, 21, 3334. [Google Scholar] [CrossRef]
  21. Song, H.; Yang, Y. Noncontact super-resolution guided wave array imaging of subwavelength defects using a multiscale deep learning approach. Struct. Health Monit. 2021, 20, 1904–1923. [Google Scholar] [CrossRef]
  22. Giurgiutiu, V.; Bao, J. Embedded-ultrasonics structural radar for nondestructive evaluation of thin-wall structures. In Proceedings of the ASME International Mechanical Engineering Congress and Exposition, New Orleans, LA, USA, 17–22 November 2002; pp. 333–340. [Google Scholar]
  23. Yu, L.; Giurgiutiu, V. In situ 2-D piezoelectric wafer active sensors arrays for guided wave damage detection. Ultrasonics 2008, 48, 117–134. [Google Scholar] [CrossRef]
  24. Yu, L.; Santoni-Bottai, G.; Xu, B.; Liu, W.; Giurgiutiu, V. Piezoelectric wafer active sensors for in situ ultrasonic-guided wave SHM. Fatigue Fract. Eng. Mater. Struct. 2008, 31, 611–628. [Google Scholar] [CrossRef]
  25. Moulin, E.; Bourasseau, N.; Assaad, J.; Delebarre, C. Lamb-wave beam-steering for integrated health monitoring applications. In Proceedings of the Nondestructive Evaluation and Health Monitoring of Aerospace Materials and Composites II, San Diego, CA, USA, 3–5 March 2003; pp. 124–131. [Google Scholar]
  26. Yu, L.; Tian, Z. Guided wave phased array beamforming and imaging in composite plates. Ultrasonics 2016, 68, 43–53. [Google Scholar] [CrossRef]
  27. Wilcox, P.D. Omni-directional guided wave transducer arrays for the rapid inspection of large areas of plate structures. IEEE Trans. Ultrason. Ferroelectr. Freq. Control 2003, 50, 699–709. [Google Scholar] [CrossRef]
  28. Simonetti, F. Multiple scattering: The key to unravel the subwavelength world from the far-field pattern of a scattered wave. Phys. Rev. E 2006, 73, 036619. [Google Scholar] [CrossRef] [PubMed]
  29. Prada, C.; Wu, F.; Fink, M. The iterative time reversal mirror: A solution to self-focusing in the pulse echo mode. J. Acoust. Soc. Am. 1991, 90, 1119–1129. [Google Scholar] [CrossRef]
  30. Lehman, S.K.; Devaney, A.J. Transmission mode time-reversal super-resolution imaging. J. Acoust. Soc. Am. 2003, 113, 2742–2753. [Google Scholar] [CrossRef]
  31. Liu, X.-F.; Wang, B.-Z.; Li, L.-W. Time reversal dort and music methods for extended targets detection and imaging. In Proceedings of the 2013 IEEE International Conference On Microwave Technology & Computational Electromagnetics, Qingdao, China, 25–28 August 2013; pp. 304–307. [Google Scholar]
  32. He, J.; Yuan, F.-G. Lamb wave-based subwavelength damage imaging using the DORT-MUSIC technique in metallic plates. Struct. Health Monit. 2016, 15, 65–80. [Google Scholar] [CrossRef]
  33. He, J.; Yuan, F.-G. Lamb waves based fast subwavelength imaging using a DORT-MUSIC algorithm. AIP Conf. Proc. 2016, 1706, 030022. [Google Scholar] [CrossRef]
  34. Fan, C.; Yu, S.; Gao, B.; Zhao, Y.; Yang, L. Ultrasonic time-reversal-based super resolution imaging for defect localization and characterization. NDT E Int. 2022, 131, 102698. [Google Scholar] [CrossRef]
  35. Gruber, F.K.; Marengo, E.A.; Devaney, A.J. Time-reversal imaging with multiple signal classification considering multiple scattering between the targets. J. Acoust. Soc. Am. 2004, 115, 3042–3047. [Google Scholar] [CrossRef]
  36. Devaney, A.J. Super-resolution processing of multi-static data using time reversal and MUSIC. 2000. Available online: http://www.ece.neu.edu/faculty/devaney/ajd/preprints.htm (accessed on 4 May 2025).
  37. Fan, C.; Caleap, M.; Pan, M.; Drinkwater, B.W. A comparison between ultrasonic array beamforming and super resolution imaging algorithms for non-destructive evaluation. Ultrasonics 2014, 54, 1842–1850. [Google Scholar] [CrossRef] [PubMed]
  38. Davy, M.; Minonzio, J.-G.; de Rosny, J.; Prada, C.; Fink, M. Influence of noise on subwavelength imaging of two close scatterers using time reversal method: Theory and experiments. Prog. Electromagn. Res. 2009, 98, 333–358. [Google Scholar] [CrossRef]
  39. Holmes, C.; Drinkwater, B.W.; Wilcox, P.D. Post-processing of the full matrix of ultrasonic transmit–receive array data for non-destructive evaluation. NDT E Int. 2005, 38, 701–711. [Google Scholar] [CrossRef]
  40. Laroche, N.; Carcreff, E.; Bourguignon, S.; Idier, J.; Duclos, A. An inverse approach for ultrasonic imaging by total focusing point for close reflectors separation. In Proceedings of the 2018 IEEE International Ultrasonics Symposium (IUS), Kobe, Japan, 22–25 October 2018; pp. 1–4. [Google Scholar]
  41. Cicero, T. Signal Processing for Guided Wave Structural Health Monitoring. Ph.D. Thesis, Imperial College London, London, UK, 2009. [Google Scholar]
Figure 1. One-dimensional linear array.
Applsci 15 06380 g001
Figure 2. Flowchart of the time-domain DAS method.
Applsci 15 06380 g002
Figure 3. Flowchart of the frequency-domain DAS method.
Applsci 15 06380 g003
Figure 4. Flowchart of the DORT-MUSIC method.
Applsci 15 06380 g004
Figure 5. The peak center intensity difference τ evaluates the damage resolution capability. (a) When τ < −6 dB, damages can be clearly resolved. (b) When τ = −6 dB, damages can be barely resolved. (c) When τ > −6 dB, damages cannot be resolved.
Applsci 15 06380 g005
Figure 6. Numerical model of ultrasonic guided wave in plate.
Applsci 15 06380 g006
Figure 7. Excitation signal. (a) Time-domain normalized waveform. (b) Normalized frequency spectrum.
Applsci 15 06380 g007
Figure 8. (a) Experimental equipment connection schematic diagram. (b) Experimental platform. (c) PZT actuator array.
Applsci 15 06380 g008
Figure 9. Imaging results and imaging indicator profile of numerical simulations with two damages separated by 20 mm. (a,d) Time-domain DAS. (b,e) Frequency-domain DAS. (c,f) DORT-MUSIC. The color scale represents normalized intensity, and the red circles and lines indicate damage edges. Spatial coordinates are normalized relative to the wavelength (λ).
Applsci 15 06380 g009
Figure 10. Imaging results and imaging indicator profile of numerical simulations with two damages separated by 10 mm. (a,d) Time-domain DAS. (b,e) Frequency-domain DAS. (c,f) DORT-MUSIC. The color scale represents normalized intensity, and the red circles and lines indicate damage edges. Spatial coordinates are normalized relative to the wavelength (λ).
Applsci 15 06380 g010
Figure 11. Imaging results and imaging indicator profile of numerical simulations with two damages separated by 8 mm. (a,d) Time-domain DAS. (b,e) Frequency-domain DAS. (c,f) DORT-MUSIC. The color scale represents normalized intensity, and the red circles and lines indicate damage edges. Spatial coordinates are normalized relative to the wavelength (λ).
Applsci 15 06380 g011
Figure 12. Imaging results and imaging indicator profile of numerical simulations with two damages separated by 6 mm. (a,d) Time-domain DAS. (b,e) Frequency-domain DAS. (c,f) DORT-MUSIC. The color scale represents normalized intensity, and the red circles and lines indicate damage edges. Spatial coordinates are normalized relative to the wavelength (λ).
Applsci 15 06380 g012
Figure 13. Imaging results and corresponding indicator profile from experimental data with two damages separated by 20 mm. (a,c) Frequency-domain DAS. (b,d) DORT-MUSIC. The color scale represents normalized intensity, and the red circles and lines indicate damage edges. Spatial coordinates are normalized relative to the wavelength (λ).
Applsci 15 06380 g013
Figure 14. Imaging results and corresponding indicator profile from experimental data with two damages separated by 12 mm. (a,c) Frequency-domain DAS. (b,d) DORT-MUSIC. The color scale represents normalized intensity, and the red circles and lines indicate damage edges. Spatial coordinates are normalized relative to the wavelength (λ).
Applsci 15 06380 g014
Figure 15. Imaging results and corresponding indicator profile from experimental data with two damages separated by 10 mm. (a,c) Frequency-domain DAS. (b,d) DORT-MUSIC. The color scale represents normalized intensity, and the red circles and lines indicate damage edges. Spatial coordinates are normalized relative to the wavelength (λ).
Applsci 15 06380 g015
Figure 16. Imaging results and corresponding indicator profile from experimental data with two damages separated by 6 mm. (a,c) Frequency-domain DAS. (b,d) DORT-MUSIC. The color scale represents normalized intensity, and the red circles and lines indicate damage edges. Spatial coordinates are normalized relative to the wavelength (λ).
Applsci 15 06380 g016
Figure 17. Comparison of the peak-to-center intensity difference indicators with different dual damage center distances by each imaging method. (a) Numerical simulation results. (b) Experimental results.
Applsci 15 06380 g017
Table 1. Main properties of the aluminum plate.
Material ParametersValue
Aluminum plate dimensions (mm)300 × 300 × 2
Damping absorption boundary width (mm)50
Poisson ratio ν0.33
Elastic modulus E (GPa)70
Mass   damping   parameter   α d M s 1 25   ×   10 7 d s 2  1
Stiffness   damping   parameters   β d K s 6   ×   10 4 d s 2
Density   ρ   (kg/m3)2700
1  d s is the distance from a certain point in the damping layer to the edge of the plate.
Table 2. Comparison of numerical simulation imaging results for dual damage at different distances.
Damage Center Distance (mm)Damage Localization Deviation (mm)Peak-to-Center Intensity Difference τ (dB)Array Performance Indicator (API)
f-DASDORT-MUSICf-DASDORT-MUSICf-DASDORT-MUSIC
20 (0, 1)
(0, 1)
(−0.2, −1.8)
(0.2, −1.8)
−20.7−35.40.8480.185
10 (0, 1)
(0, 1)
(−0.2, 0.4)
(0, 0.4)
−17.1−24.60.7960.21
8 (0, 1)
(0, 1)
(0.2, −0.6)
(0, 1.8)
−16.1−22.80.850.28
6 (0, 1)
(0, 1)
(0.6, −0.8)
(−0.6, −0.4)
−7.4−9.20.830.34
Table 3. Comparison of experimental imaging results for dual damage at different distances.
Damage Center Distance (mm)Damage Localization Deviation (mm)Peak-to-Center Intensity Difference τ (dB)Array Performance Indicator (API)
f-DASDORT-MUSICf-DASDORT-MUSICf-DASDORT-MUSIC
20(0, 0)
(0, 1)
(0, 0.6)
(0, −0.4)
−26.2−8.91.301.17
12(0, 0)
(0, 4)
(−0.6, 1.2)
(0.2, 0.8)
−16.0−8.51.171.17
10(0, −1)
(0, −1)
(0.2, 0.8)
(−0.2, 0.4)
−12.0−8.41.431.08
6NA
NA
(0.2, 0.6)
(−0.2, 0.8)
NA−6.71.330.97
Table 4. Performance comparison of three imaging methods.
MethodComplexityComputational TimeResolutionNoise Sensitivity
Time-domain DASLowFastLowModerate
Frequency-domain DASModerateModerateHighModerate
DORT-MUSICHighSlowExtremely HighHigh
Disclaimer/Publisher’s Note: The statements, opinions and data contained in all publications are solely those of the individual author(s) and contributor(s) and not of MDPI and/or the editor(s). MDPI and/or the editor(s) disclaim responsibility for any injury to people or property resulting from any ideas, methods, instructions or products referred to in the content.

