Article

Effect of Moisture Content and Normal Impact Velocity on the Coefficient of Restitution of ‘Memory’ Wheat Grains

by
Jacek Marcinkiewicz
1,*,
Grzegorz Waldemar Ślaski
2 and
Mikołaj Spadło
2
1
Faculty of Civil and Transport Engineering, Poznan University of Technology, 60-965 Poznań, Poland
2
Faculty of Mechanical Engineering, Poznan University of Technology, 60-965 Poznań, Poland
*
Author to whom correspondence should be addressed.
Appl. Sci. 2025, 15(11), 6055; https://doi.org/10.3390/app15116055
Submission received: 24 March 2025 / Revised: 15 May 2025 / Accepted: 20 May 2025 / Published: 28 May 2025

Abstract

:

Featured Application

The findings presented in this study can be applied to the design of agricultural machinery that minimises mechanical damage during grain transport and processing, either through direct implementation or by utilising them in numerical simulations (DEM) to optimise processes related to grain flow in pneumatic transport systems, sorters and crushers. Considering the effects of moisture content and collision velocity on grain deformation allows for adjusting machine settings and controlling environmental conditions, which contributes to increased efficiency and production quality.

Abstract

This study analyses the dynamic impact between winter wheat grains (‘Memory’ cultivar) and a flat metal surface under normal collisions. Four moisture levels (7%, 10%, 13% and 16%) and impact velocities from 1.0 to 4.5 m·s−1 were chosen to reflect conditions in agricultural machinery. A custom test rig—comprising a transparent drop guide, a high-sensitivity piezoelectric force sensor and a high-speed camera—recorded grain velocity by vision techniques and contact force at 1 MHz. Force–time curves were examined to evaluate restitution velocity, the coefficient of restitution (CoR) and the effect of moisture on elastic–plastic deformation. CoR decreased non-linearly as impact velocity rose from 1.0 to 5.0 m·s−1, and moisture content increased from 7% to 16%, falling from ≈ 0.60 to 0.40–0.50. Grains with higher moisture struck at higher velocities showed greater plastic deformation, longer contact times and intensified energy dissipation, making them more susceptible to internal damage. The data provide validated reference values for discrete element method (DEM) calibration and will assist engineers in designing grain-handling equipment that minimises mechanical damage during harvesting, conveying and processing.

1. Introduction

Cereal crops remain a cornerstone of global plant-based food production, contributing more than half of the world’s agricultural output [1]. Wheat is especially important to human nutrition and caloric intake. In Poland, the winter-wheat cultivar ‘Memory’ is among the most widely grown because of its high yield potential and favourable processing characteristics [2].
Understanding how wheat kernels respond mechanically and biologically to external loading is increasingly important in agricultural engineering, particularly for mechanical harvesting, pneumatic conveying and milling operations.
During transport and handling, kernels often strike hard surfaces at high speed, causing structural damage, reduced germination and loss of product quality [3]. The coefficient of restitution ( C o R , e ) quantifies how much kinetic energy is retained after such impacts [4]. C o R is widely used in discrete element method (DEM) simulations of grain flows.
Previous work shows that C o R depends on kernel geometry—including asymmetries created by the embryo or brush (Figure 1) [2,5,6]—as well as surface texture, moisture content and impact velocity. Most experimental studies, however, have focused on maize, rice or soy; data for wheat (and for cultivar-level differences) remain scarce.
The aims of the present study were as follows:
  • To capture and analyse the force–time curves of single-kernel impacts with high-frequency piezoelectric sensing and high-speed imaging;
  • To determine how kernel moisture content and impact velocity influence C o R ;
  • To provide validated data for DEM calibration and for optimising grain-handling equipment so as to minimise mechanical damage during processing.
These objectives were pursued under controlled, perpendicular impacts between single kernels of winter wheat ‘Memory’ and a flat metal surface.

2. Collisions and the Coefficient of Restitution ( C o R , e)

2.1. Theoretical Background

Cereal-grain impacts—whether between two kernels or between a single kernel and a flat surface—are short-duration events in which contact forces rise and fall in microseconds, transferring momentum and altering velocity. The process is continuous but can be divided into compression and restitution stages [8,9].
During compression, immediately after first contact (Figure 2a), equal and opposite forces resist the relative motion [10,11]. For a normal impact of a grain of mass m against a rigid plate, the analysis simplifies because the plate’s mass is effectively infinite (M→∞), and its velocity remains zero [9]. After the instant of maximum compression, restitution begins (Figure 2b), and the contact force falls to zero as the grain returns—fully or partially—to its original shape [12]. Elastic collisions show almost immediate recovery, whereas elastic–plastic ones leave permanent deformation or delayed rebound [9,13,14,15,16].
The impact obeys momentum conservation and is characterised by the coefficient of restitution (CoR, e). With the convention that u denotes pre-impact velocity and v post-impact velocity, conservation of linear momentum for two bodies is as follows:
m 1 u 1 + m 2 u 2 =   m 1 v 1 +   m 2 v 2 ,
where
  • m 1 , m 2 —masses of the bodies;
  • u 1 , u 2 —initial velocity vectors;
  • v 1 , v 2 —final velocity vectors.
The coefficient of restitution ( C o R ,   e ) quantifies elasticity as the ratio of the relative normal separation (final) speed to the relative normal approach (initial) speed. For a grain impacting a flat plate,
C o R = e = v n u n .
where u n and v n are the grain’s velocity components normal to the surface before and after impact, respectively.
Collision regimes can be classified by the value of the coefficient of restitution ( C o R ,   e ):
  • e = 1—perfectly elastic; no kinetic energy is lost;
  • 0 < e < 1—partially elastic; some energy is dissipated, but the bodies separate;
  • e = 0—perfectly inelastic; the bodies stick together, and all translational kinetic energy is lost.
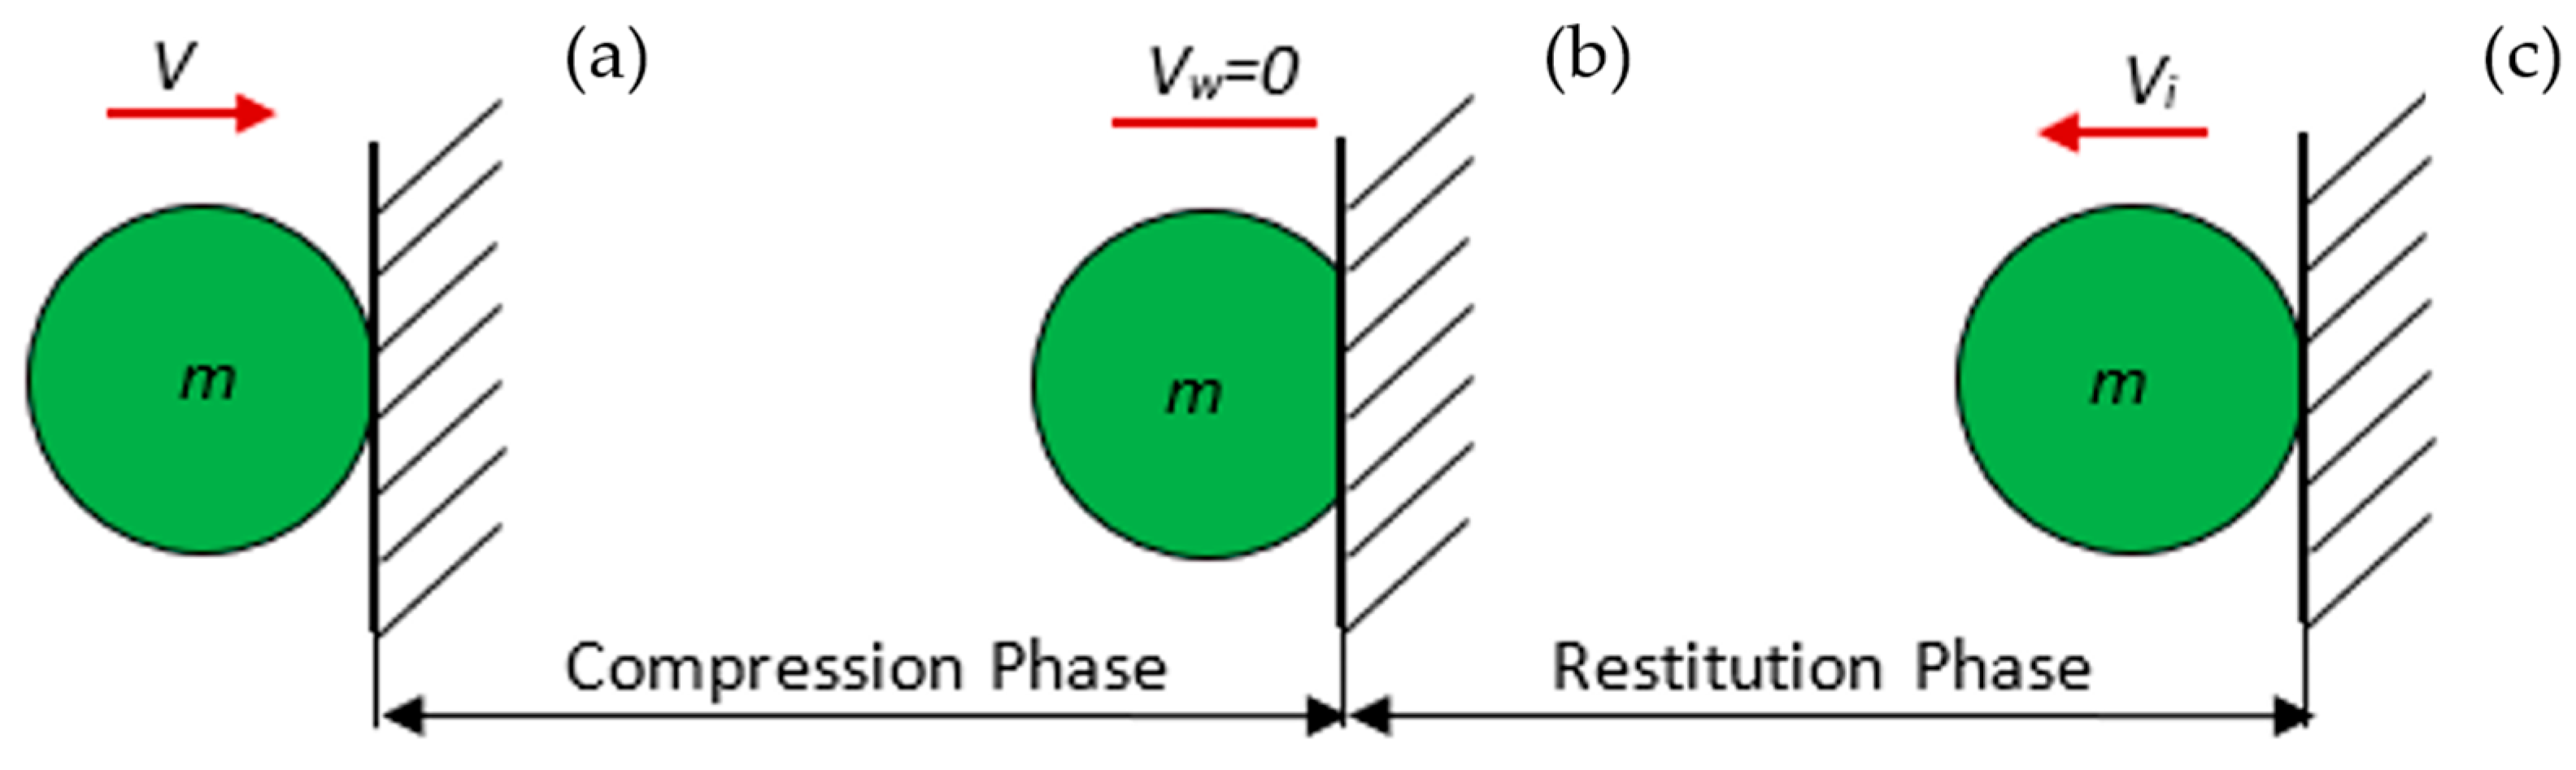
  • Normal impact against an immovable plate
For a normal collision of a particle of mass m with a rigid plate of effectively infinite mass ( M ) , the plate velocity is zero before and after impact ( u 2 = v 2   = 0 ) . Momentum conservation therefore reduces to the particle alone, and its post-impact velocity is
v 1 = e u 1 .
Accordingly, the following are true:
  • e = 1—the particle rebounds with unchanged speed;
  • e = 0—the particle comes to rest on the plate;
  • 0 < e < 1—the particle rebounds with reduced speed.
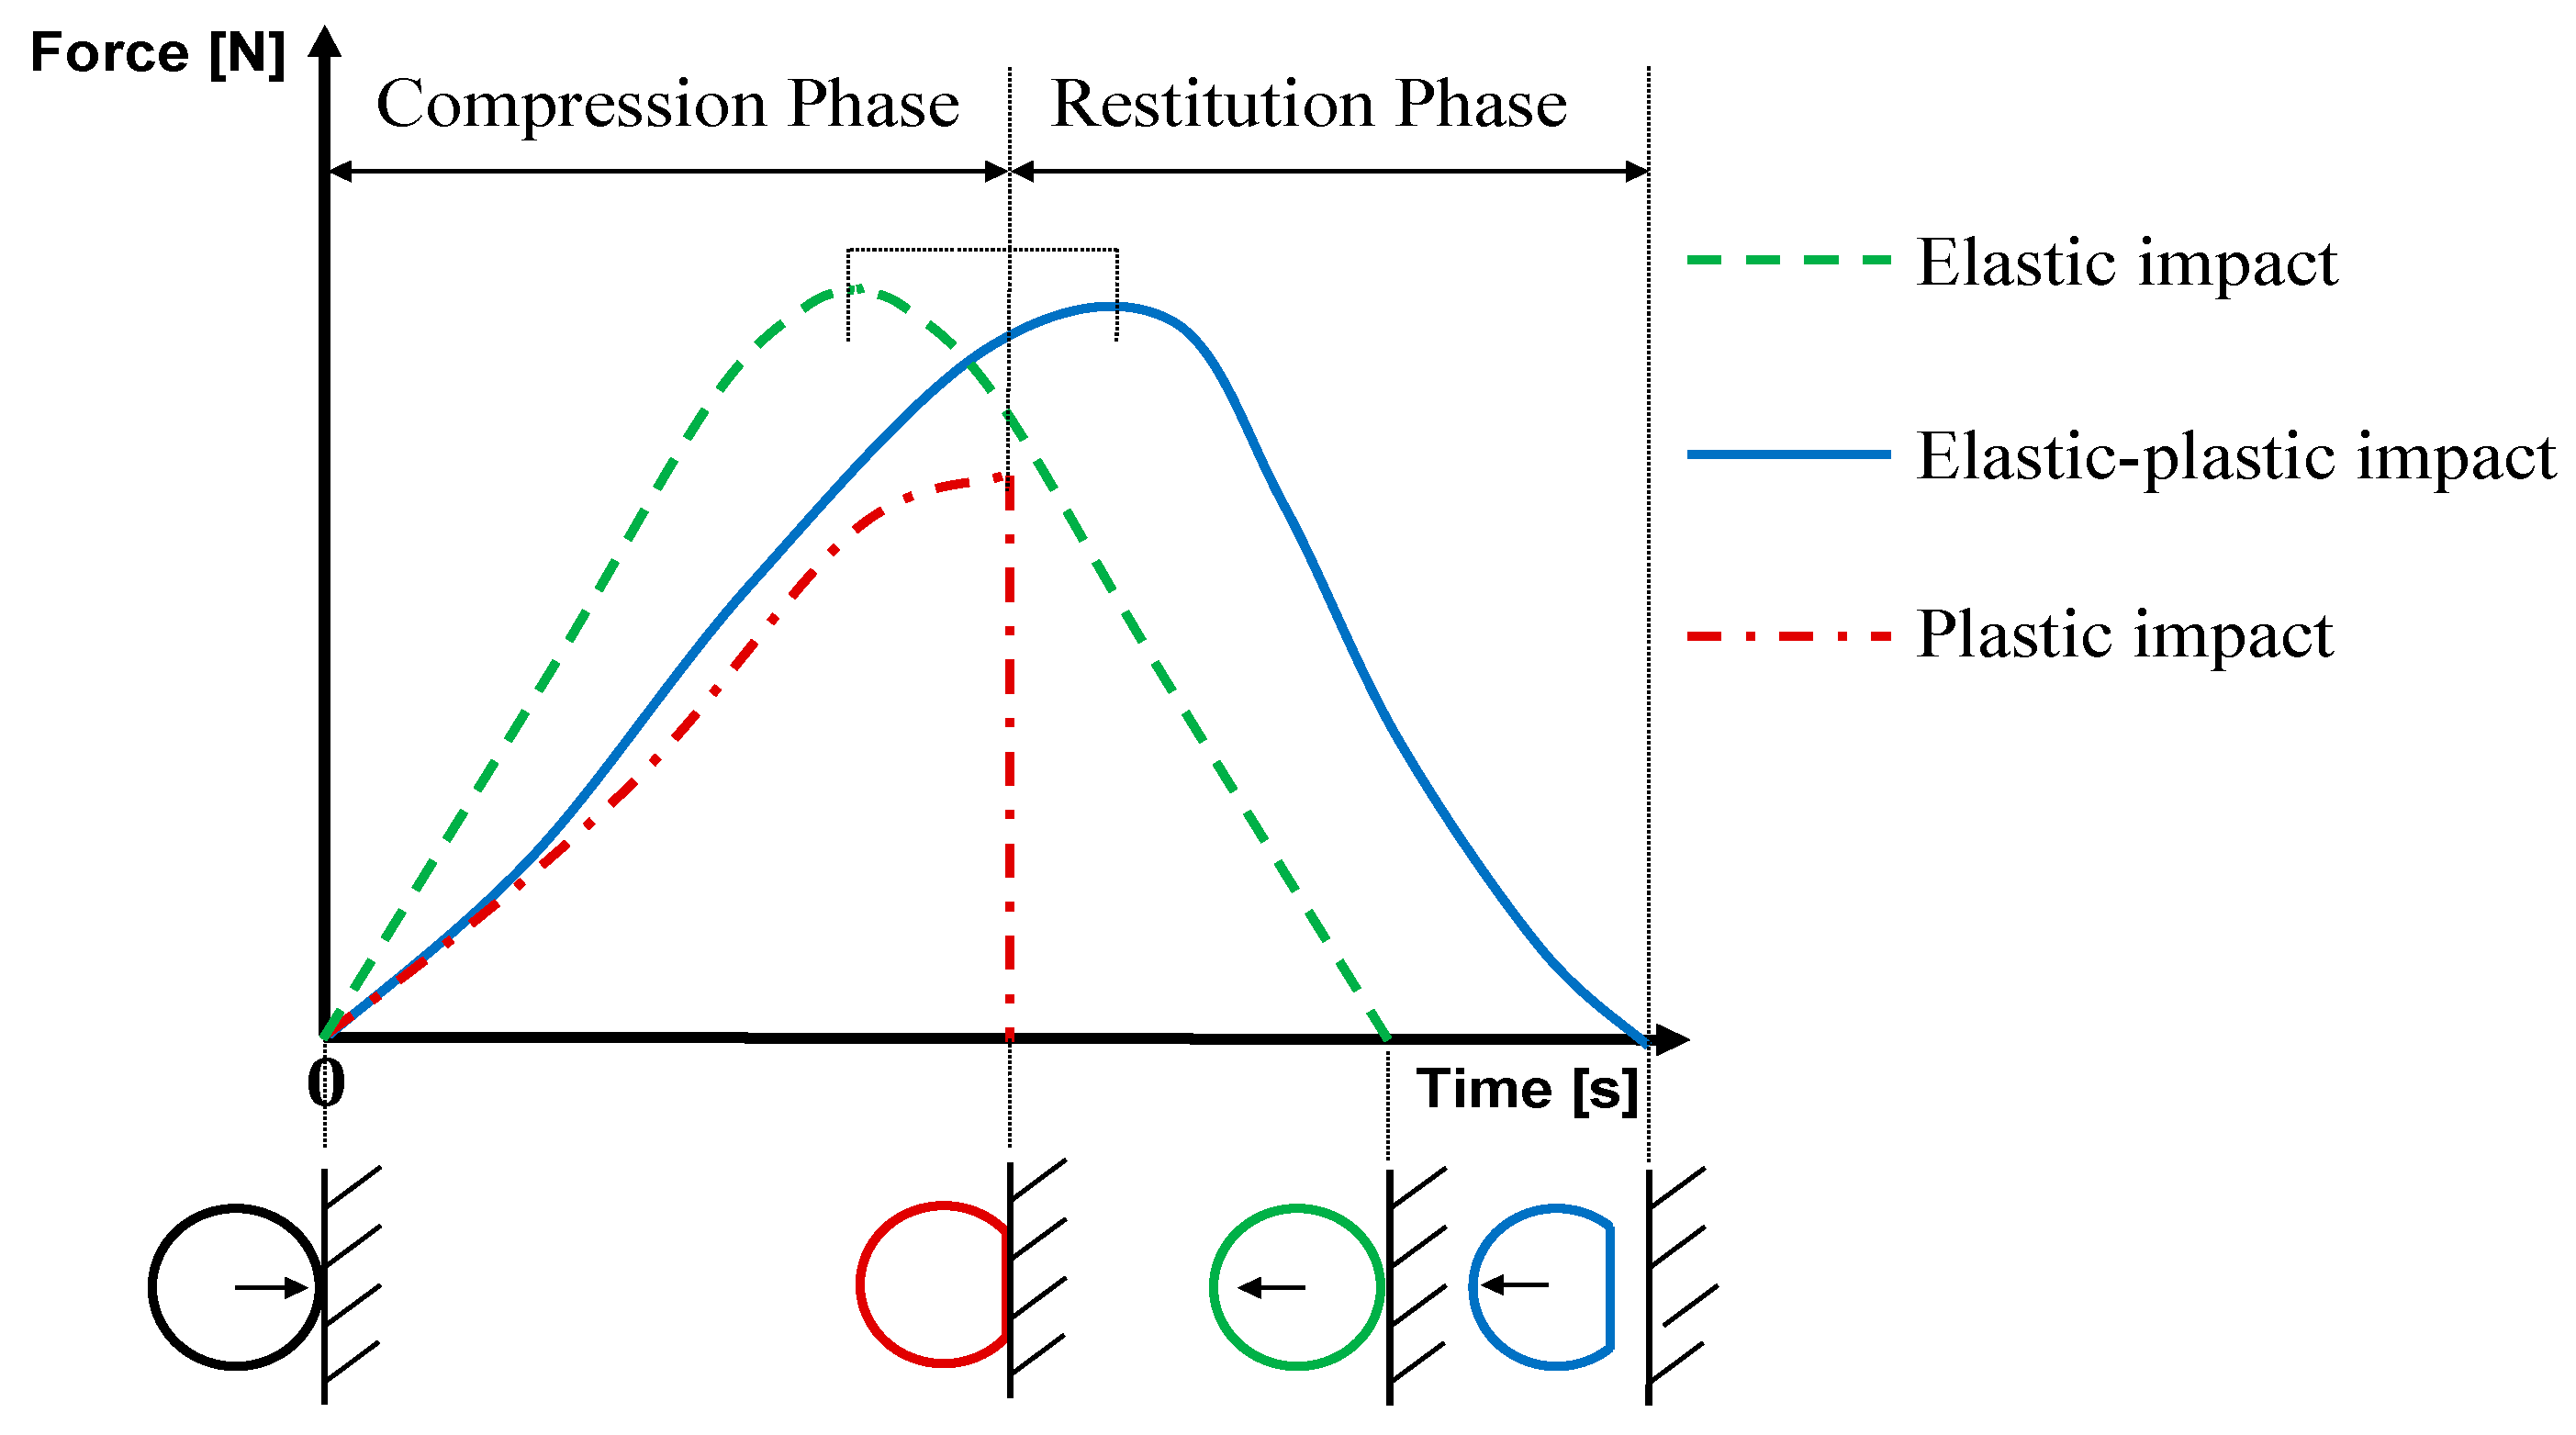
  • Elasticity versus plasticity of wheat kernels
Elasticity is quantified directly by C o R : values near 1 indicate an almost elastic response, whereas lower values signal energy loss through plastic deformation. Wheat kernels that absorb more energy (e.g., those with high moisture content or pre-damage) display the following:
  • Lower CoR;
  • Longer contact times, because energy absorption prolongs the unloading phase.
The mechanical properties therefore shape the force–time history (Figure 3). Elastic impacts exhibit symmetric rise and fall, while elastic–plastic and plastic impacts show asymmetry: compression lasts longer than restitution, and the total contact duration increases.

2.2. Methods for Determining the Coefficient of Restitution (CoR, e)

Several experimental approaches are available, depending on the instrumentation and the material under study. The most common are the following:
(a)
Velocity-based method;
(b)
Height-based (drop-test) method;
(c)
Impulse-based (force-impulse) method.

2.2.1. Velocity-Based Method

This approach employs high-speed cameras or velocity sensors to measure the pre- and post-impact velocities along the collision axis. For a strictly normal impact and rebound, C o R is obtained directly from Equation (2) [17].
Recent examples include the work [18], in which soil particles were treated (Ø 2–3 mm) as point masses and a maize kernel as the target surface. Particles were dropped from heights of 10, 15, 20 and 25 cm, the collision was filmed at high speed, and CoR was computed as the ratio of separation to approach velocity. A similar velocity method, augmented with a fixture that varied the reflection angle of maize seeds, was reported in [19,20].
Sandeep et al. [21], for example, used two electromagnets to release kernels from 155, 190, 240 and 300 mm onto granite, stainless steel, brass and rubber blocks. Two orthogonal high-speed cameras (1000 fps) captured the impacts, and CoR was calculated from Equation (2) [17].

2.2.2. Height-Based (Drop-Test) Method

When rebound velocity cannot be measured reliably, a simpler height-based method is often chosen [22,23]. In this approach, grains are released from known heights onto surfaces such as steel, plexiglass, seed plates or rubber sheets, and the rebound height is recorded.
Because impact velocity u in free fall is uniquely related to drop height h u , the coefficient of restitution is
C o R = e = v u = 2 g h v 2 g h u = h v h u
where the following apply:
  • e —coefficient of restitution (CoR);
  • u , v —velocities just before and after impact;
  • h u —drop height (release height);
  • h v —rebound height.
This height-based test works best with large, nearly spherical kernels, whose predictable bounces minimise angular error [22,24,25]. For irregular kernels such as wheat, however, a full rebound-velocity vector (vx,vy,vz) is required [20]:
C o R = e = v u = v x 2 + v y 2 + v z 2 2 g h u
Uncertainty in rebound direction increases measurement error, which is why we use the impulse method described below.

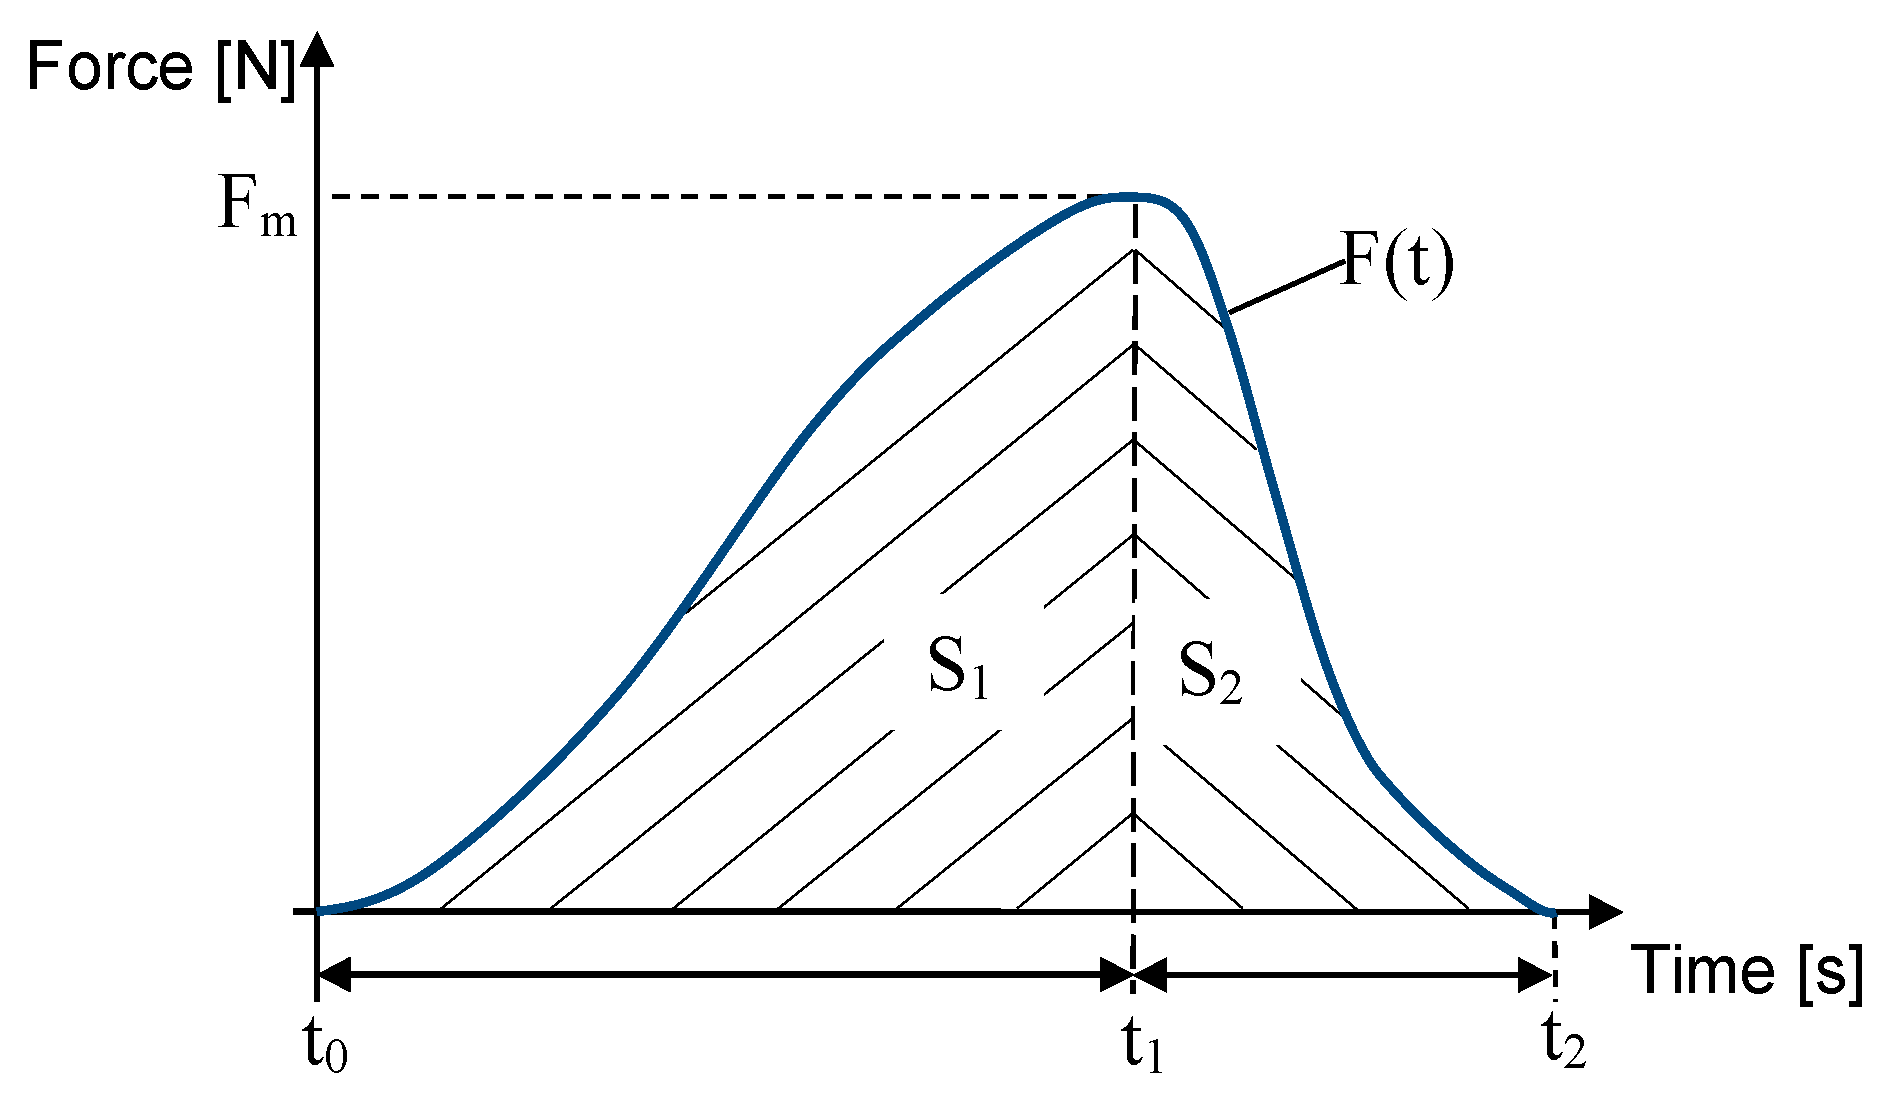
2.2.3. Impulse-Based Method

The present study adopts an impulse-based technique [26]. The time-resolved force signal is integrated to obtain loading and unloading impulses; this avoids errors that occur when irregular wheat kernels rebound at oblique angles and is therefore better suited to non-spherical grains.
For a single kernel impacting an infinitely rigid plate, Newton’s second law gives
F = m a = d ( m v ) d t = d p d t
Integrating over the contact duration t 0     t 2 yields the total impulse
S = t 0 t 2 d p = t 0 t 2 F t d t
The area under the force–time curve is separated into a loading impulse S 1 and an unloading impulse S 2 ; their ratio gives C o R (see Section 2.2). Figure 4 illustrates the impulse zones analysed in this study.
Compared with the height-based approach, the impulse method avoids errors arising from irregular rebound trajectories and is therefore better suited to non-spherical wheat kernels.
According to Figure 4, the total impulse of the impact can be divided into two phases. Phase 1 covers the rising part of the force curve, where local deformation spreads to the whole kernel. Phase 2 begins at the peak force and ends when the grain loses contact, while the deformation is released [27].
When the collision is modelled as a two-phase process, the total impulse S equals the sum of the partial impulses S 1 and S 2 :
S = S 1 + S 2 .
The impulse contributions for each phase can be expressed as
S 2 = t 0 t 1 F ( t )   d t
S 1 = t 1 t 2 F ( t )   d t
The coefficient of restitution is then
C o R = e = S 2 S 1 = t 0 t 1 F ( t )   d t t 1 t 2 F ( t )   d t 0 e 1 .
Typical limits are as follows:
  • e = 1—perfectly elastic: no kinetic-energy loss, full rebound;
  • e = 0—perfectly inelastic: the bodies stick together, and all kinetic energy is dissipated;
  • 0 < e < 1—partially elastic: some energy is lost during impact.
This procedure is known as the impulse-based (force-impulse) method for evaluating the CoR.
Although an impact can, to a first approximation, be represented by F t = S δ t , biological contacts last tens of microseconds. Consequently, the complete force–time curve was recorded and integrated so that both the impulse S and the deformation dynamics (peak force, loading and unloading rates) could be evaluated [4].
A review of the literature shows only a limited number of studies on the coefficient of restitution ( C o R ) of wheat grain determined by force-based methods [27,28].

3. Experimental Study on the Coefficient of Restitution of Wheat Grains

3.1. Factors Influencing Determination of the Coefficient of Restitution

When determining the coefficient of restitution ( e , hereafter C o R ) for cereal grains, a variety of factors can affect accuracy and repeatability. Although theoretical models offer a framework, practical measurement must account for real-world complexity. Previous work has shown that the test material itself strongly influences C o R [29]; for grains, however, the impact angle often exerts an even greater effect. In addition, higher impact velocities generally yield lower C o R values because more energy is lost to deformation [13,30].
Key grain-related and environmental variables are summarised below:
  • Moisture content—higher moisture levels reduce C o R [6,31]; water softens the kernel, lowering its stiffness and elasticity;
  • Variety and physical properties—size, shape and elastic modulus vary among cultivars and alter collision dynamics [32,33]; structural features such as bran layers and endosperm composition further modulate the response [32,34];
  • Environmental conditions—temperature and humidity during growth or testing modify mechanical properties and, consequently, C o R [33,35].
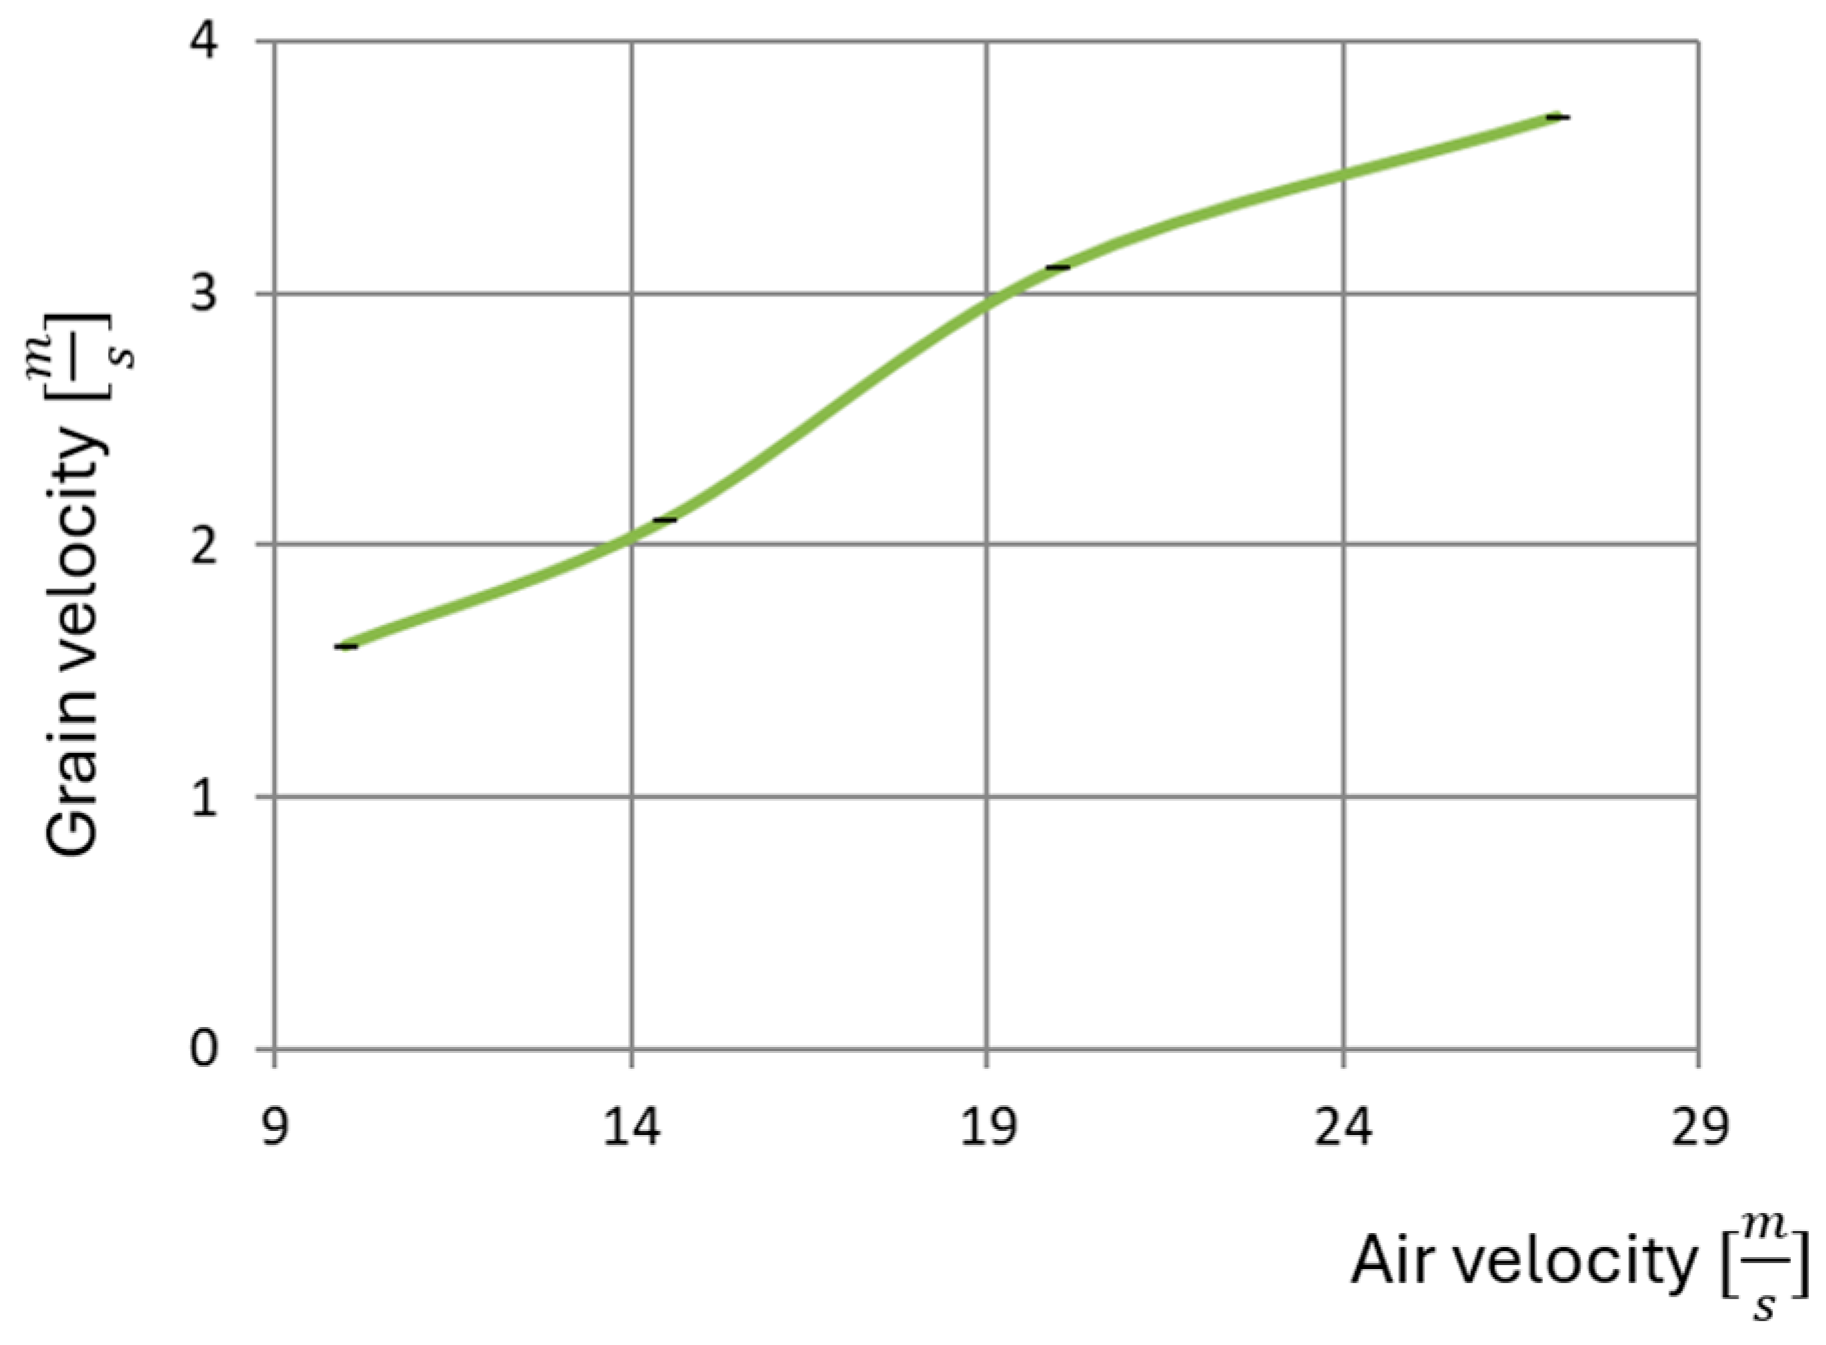
  • Impact velocity, which directly affects C o R , can be controlled in two common ways: (i) a calibrated spring launcher [29] or (ii) varying the drop height, a method widely used with wheat grains [23,28]. The latter approach produces velocities of 1–5 m s−1 with good repeatability while preserving the grain’s initial state.
This overview highlights the need to specify grain variety, moisture level, impact angle and velocity when reporting C o R data so that results remain comparable across studies.

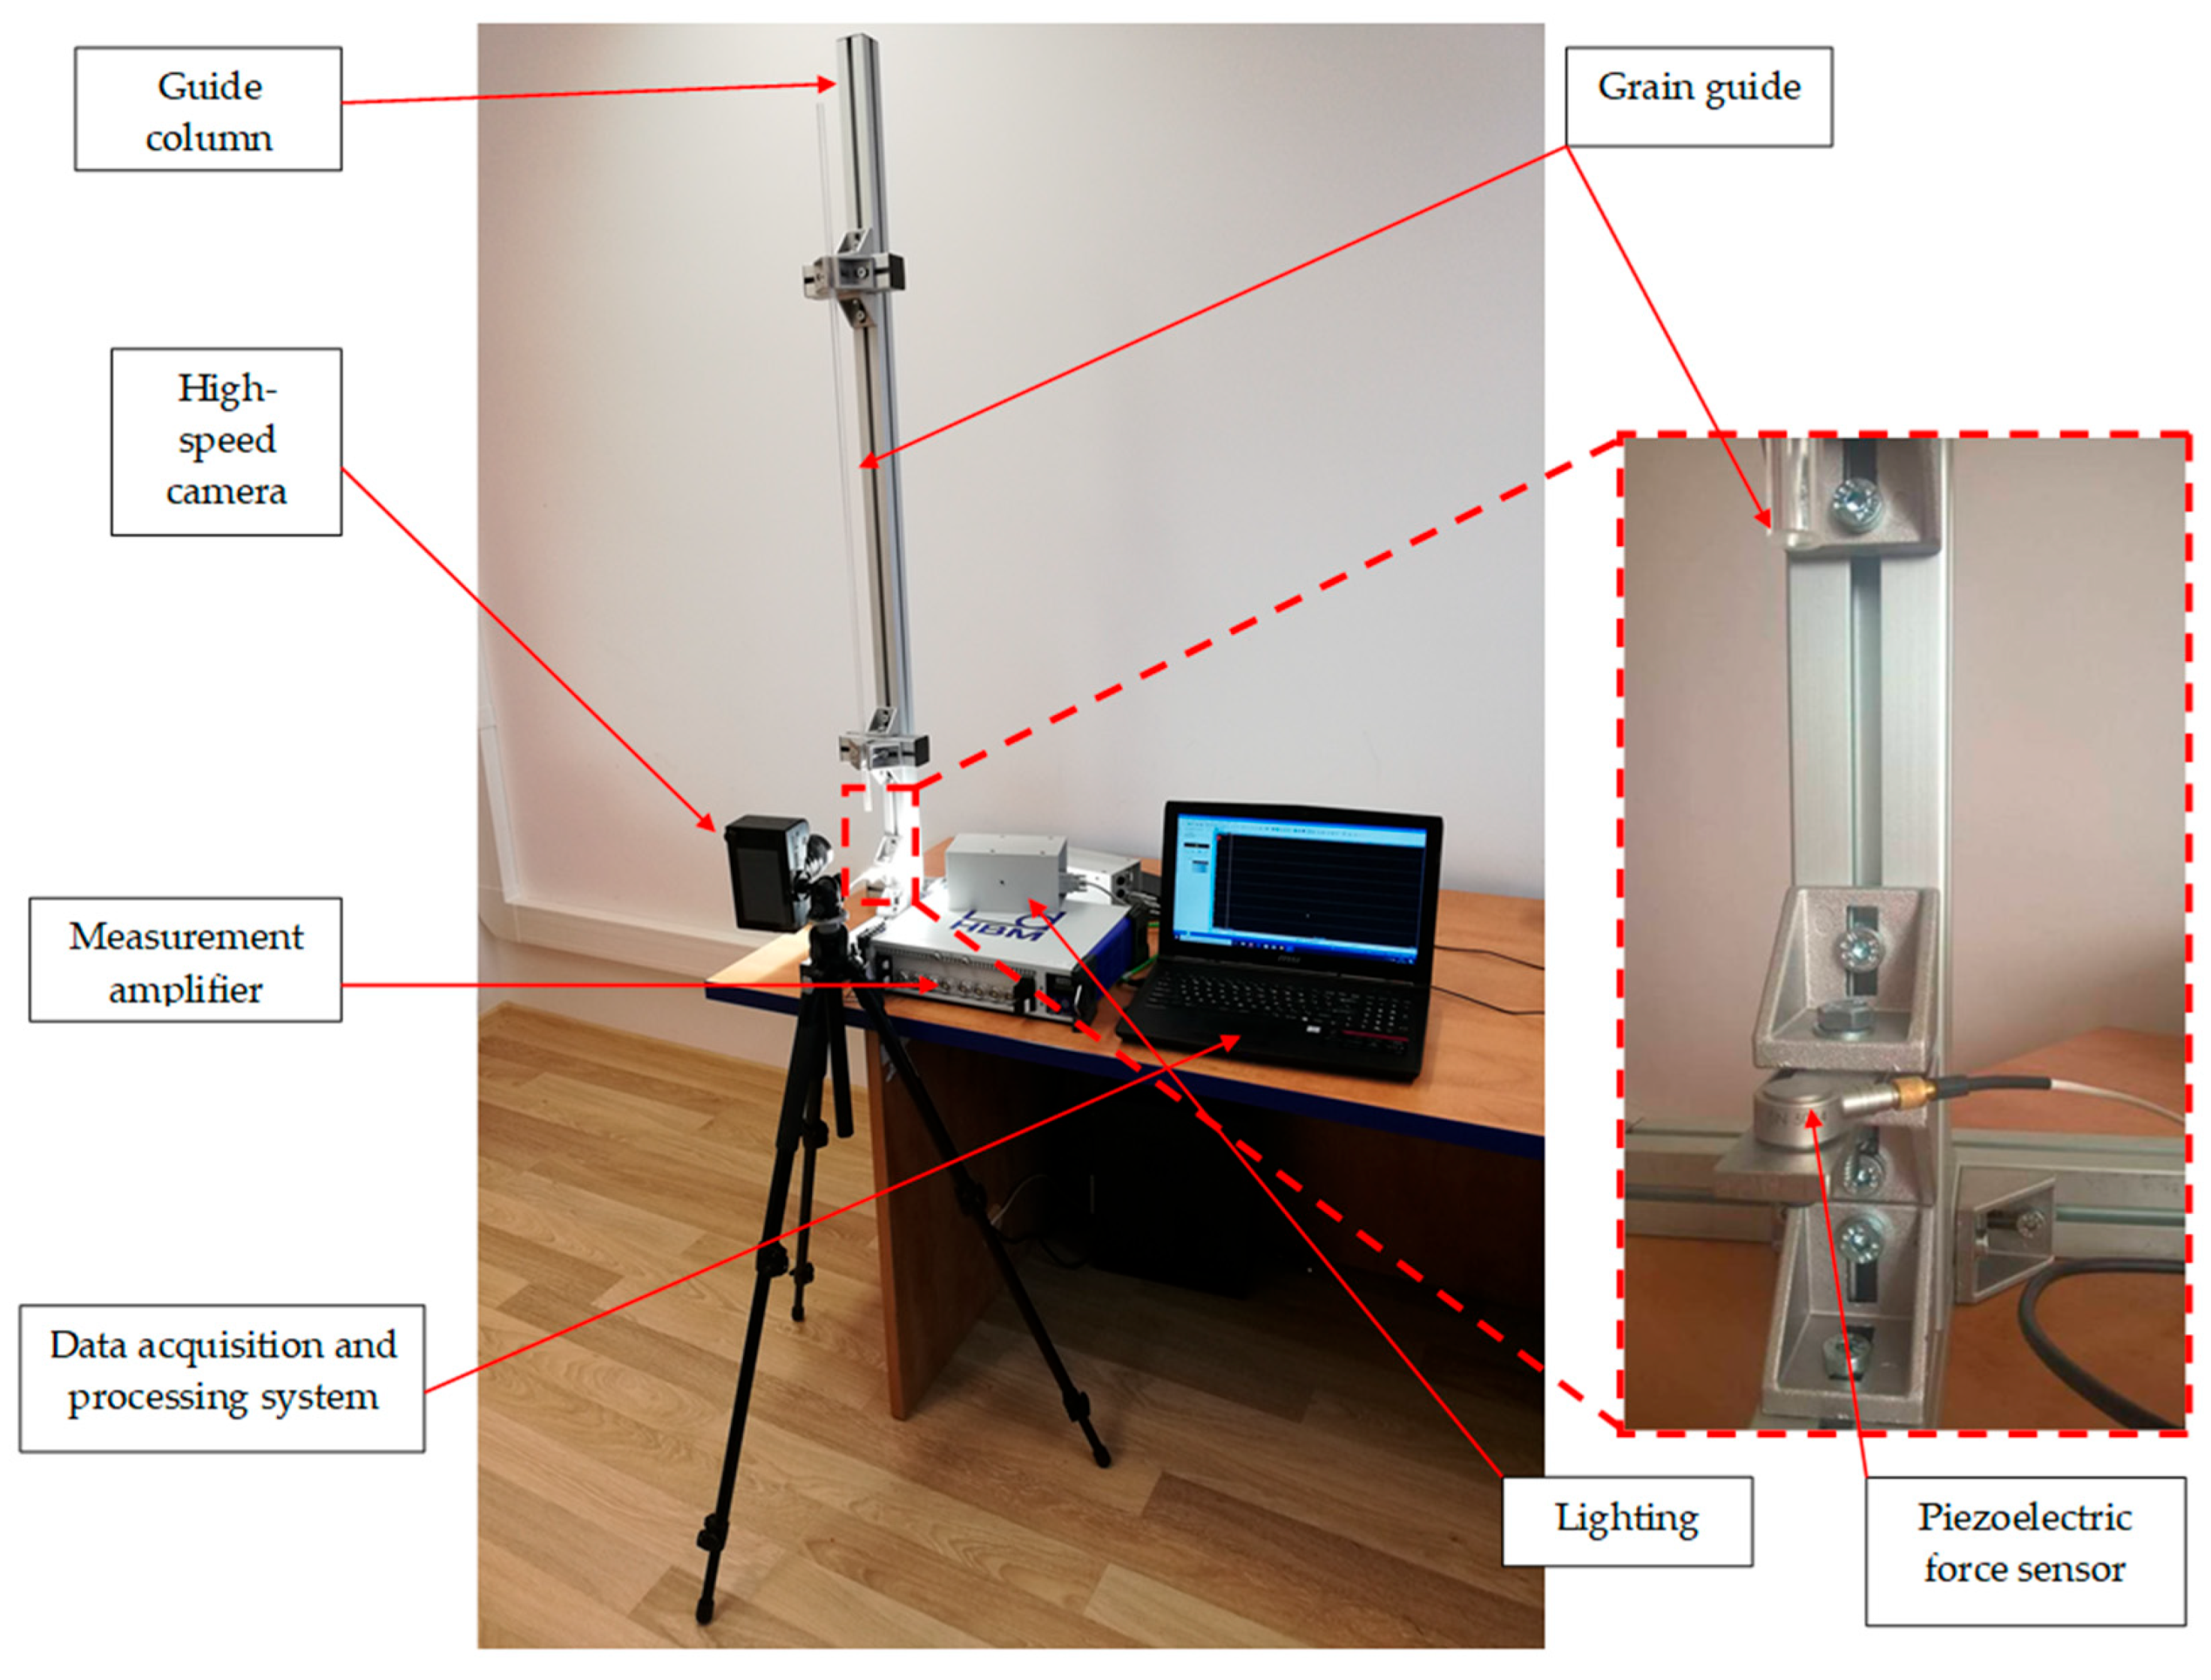
3.2. Experimental Test Stand

A specialised test stand was developed to investigate grain impacts by dropping kernels onto a surface and measuring both the impact velocity and the resulting impact force, as illustrated in Figure 5.
The test stand consisted of the following components:
  • Aluminium support frame;
  • Transparent grain guide that ensured precise positioning and release;
  • Piezoelectric force sensor (sensitivity 112.41 mV N−1; range 44.48 N);
  • High-speed camera with dedicated lighting for tracking grain motion and velocity;
  • HBM measurement amplifier sampling at 1 MHz;
  • Computer with acquisition and analysis software.
This configuration provided controlled release conditions and enabled reproducible, accurate measurements of single-grain impacts.

3.3. Pre-Collision Velocity Measurement

A high-speed camera measured the pre-collision velocity ( u ) at 640 × 240 px resolution and 8816 fps. The field of view spanned Δ z = 80   m m , overing the region between the exit of the transparent guide and the force-sensor surface.
The trajectory of the grain’s geometric centre was tracked to eliminate the influence of rotation. The velocity obtained with respect to the stationary camera was assumed to be identical to that relative to the stationary force sensor [36].
The transit time t of the grain over a known distance Φ was obtained from the number of frames ( F R ) recorded during that travel. Referencing F R to the camera frame rate ( F P S ) gives the impact velocity v :
v = Φ t = Φ F R F P S = Φ F P S F R
where F P S is the camera frame rate, expressed in frames per second.
The optical method used to measure grain velocity also enabled precise high-speed video analysis [37]. Each drop was analysed with respect to grain orientation at impact. Example frames are shown in Figure 6, illustrating the final flight frame and the impact frame. During the experiment, we discarded grains that exhibited excessive rotation, as this significantly distorts contact-force readings. This procedure ensured that only valid results were retained, thereby improving the accuracy and reliability of the dataset.
Oblique impacts produced several artefacts, visible for example as multi-peak force curves (Figure 7). Such cases are undesirable because they do not represent the single-impact force trace expected for perpendicular collisions and were therefore excluded from further analysis.
In order to minimise measurement distortion caused by rotational motion, the following multi-step procedure was adopted:
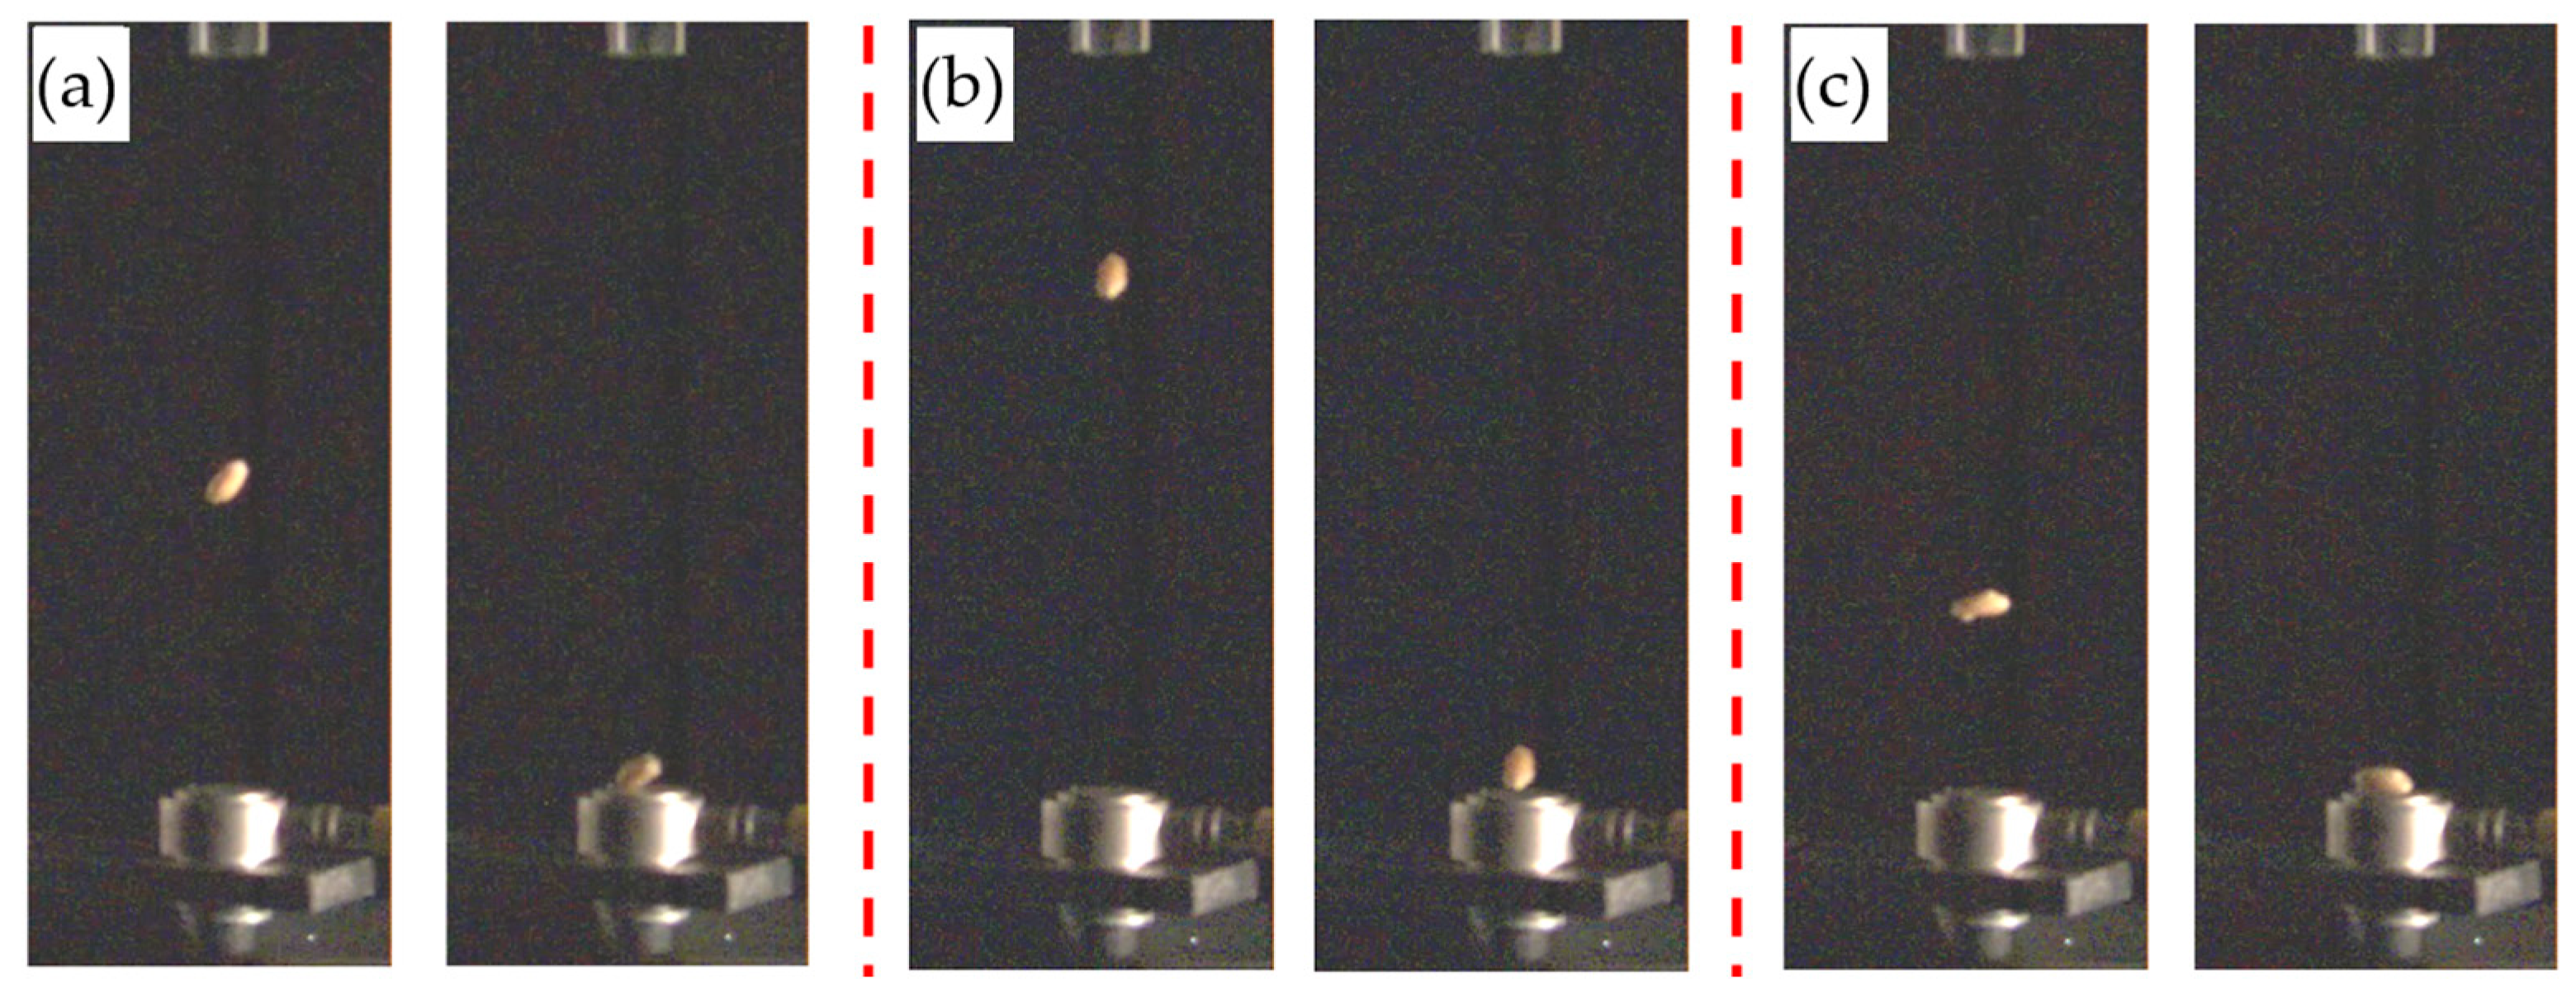
  • Free-fall through a guide tube: Each grain was dropped through a vertical polycarbonate tube (internal diameter 5 mm). Preliminary tests confirmed that this diameter suppressed lateral movement and matched the geometry of ‘Memory’ grains.
  • Visual inspection: Every drop was filmed with a high-speed camera (8816 fps). Trajectories were reviewed frame-by-frame, and grains showing visible rotation or instability were discarded.
  • Force-signal analysis: Each force–time trace was checked for the characteristic elastic–plastic shape expected for biological impacts [4,16,28,38]. Only curves that met this criterion were kept.
  • Reduction of random effects: a large sample ( n = 400 ) was tested, providing statistical stabilisation of the results.
  • Method validation by repeatability tests: From each moisture level, 20 grains were re-measured. The resulting C o R values differed by no more than ±0.02, confirming high repeatability. All calibration and uncertainty estimates followed ISO GUM guidelines.
This protocol yielded reliable data consistent with theoretical grain-to-plate contact models described by Stronge (2018) [4], Wojtkowski et al. (2010) [39] and Horabik and Molenda (2017) [24].

3.4. Measurement Accuracy Determination

In this study, the accuracy of the collision-force measurements obtained with a piezoelectric sensor was evaluated. The dominant contribution to the uncertainty stems from the instrument’s calibration and specifications (Type B); the statistical component (Type A) is minor. Each parameter was analysed separately under a rectangular probability distribution [27,40,41]:
S B F C = g r 3
where g r is the calibration uncertainty specified by the manufacturer. Additional contributions—non-linearity (1%) and temperature sensitivity (0.054%)—were combined with Equation (13) by the root-sum-of-squares (RSS) method. The expanded uncertainty U was then obtained with a coverage factor k = 2 (≈95% confidence):
U = k · S B F C
This procedure ensures that the reported force values carry well-defined confidence intervals and are comparable with those of other studies.
Velocity was measured with a high-speed camera, so its uncertainty depends on both distance and time. The camera frame-rate uncertainty, S F R = 0.057   F R S , provides the temporal component, whereas the distance uncertainty, S ϕ , combines calibration accuracy, operator repeatability, optical aberrations and lens distortion.
Because velocity is a ratio of distance to time, the combined standard uncertainty was obtained by propagating S ϕ and S F R with Equation (15):
S v = v Φ · S Φ 2 + v t · S t 2
The motivation for this detailed uncertainty calculation was to ensure that the experimental data accurately represent the true collision forces and velocities and to provide clear confidence intervals for every measurement. By accounting for instrument calibration, non-linearity, temperature drift and device precision, the results become more robust and comparable with other studies, thereby promoting reproducibility.
As an example, the maximum collision force was 22.49 N, with an expanded uncertainty of ±0.56 N (≈2.49%). The highest impact velocity, 4.76 m·s−1, carried a standard uncertainty of ±0.03 m·s−1 (≈0.63%). These figures demonstrate the high confidence in the force and velocity data and underscore the importance of rigorous uncertainty analysis in experimental work.

3.5. Characteristics of Research Samples

The complex structure of cereal grains—irregular shape, variable moisture content and multi-layered anatomy—makes them challenging subjects for collision analysis and for determining the coefficient of restitution ( C o R , e ). Such intrinsic variability can introduce inconsistency and bias if the grain population is not tightly controlled. Consequently, many studies use nearly spherical seeds—pea grains, lentils, soybeans, rapeseed and beans [10,42,43,44]—to simplify the geometry.
In the present work, we selected Triticum aestivum ‘Memory’, a winter wheat widely grown in Greater Poland and rated in the top-quality groups (A/B). Certified seed was obtained from a registered seed centre, guaranteeing provenance from laboratory fields and prior mechanical cleaning. Multi-stage sieving and vibratory-sorting with triers and winnowers had removed undersized, oversized and damaged kernels, yielding a homogeneous batch.
This careful sourcing and characterisation minimise sample variability and provide a robust basis for analysing grain impacts at different moisture levels. Prior to the commencement of the study, the grains were characterised for physical properties that could affect the measurements, using the instruments listed below:
  • Grain mass: determined with an analytical balance (RADWAG PS 1000/Y; accuracy ±0.001 g); 200 randomly selected grains were weighed individually on a controlled surface.
  • Moisture content: measured with a moisture analyser (RADWAG MA 200.3Y WH.B) and the routine reference method for cereals (PN-EN ISO 712:2009), which dries a prepared analytical sample at 130 °C.
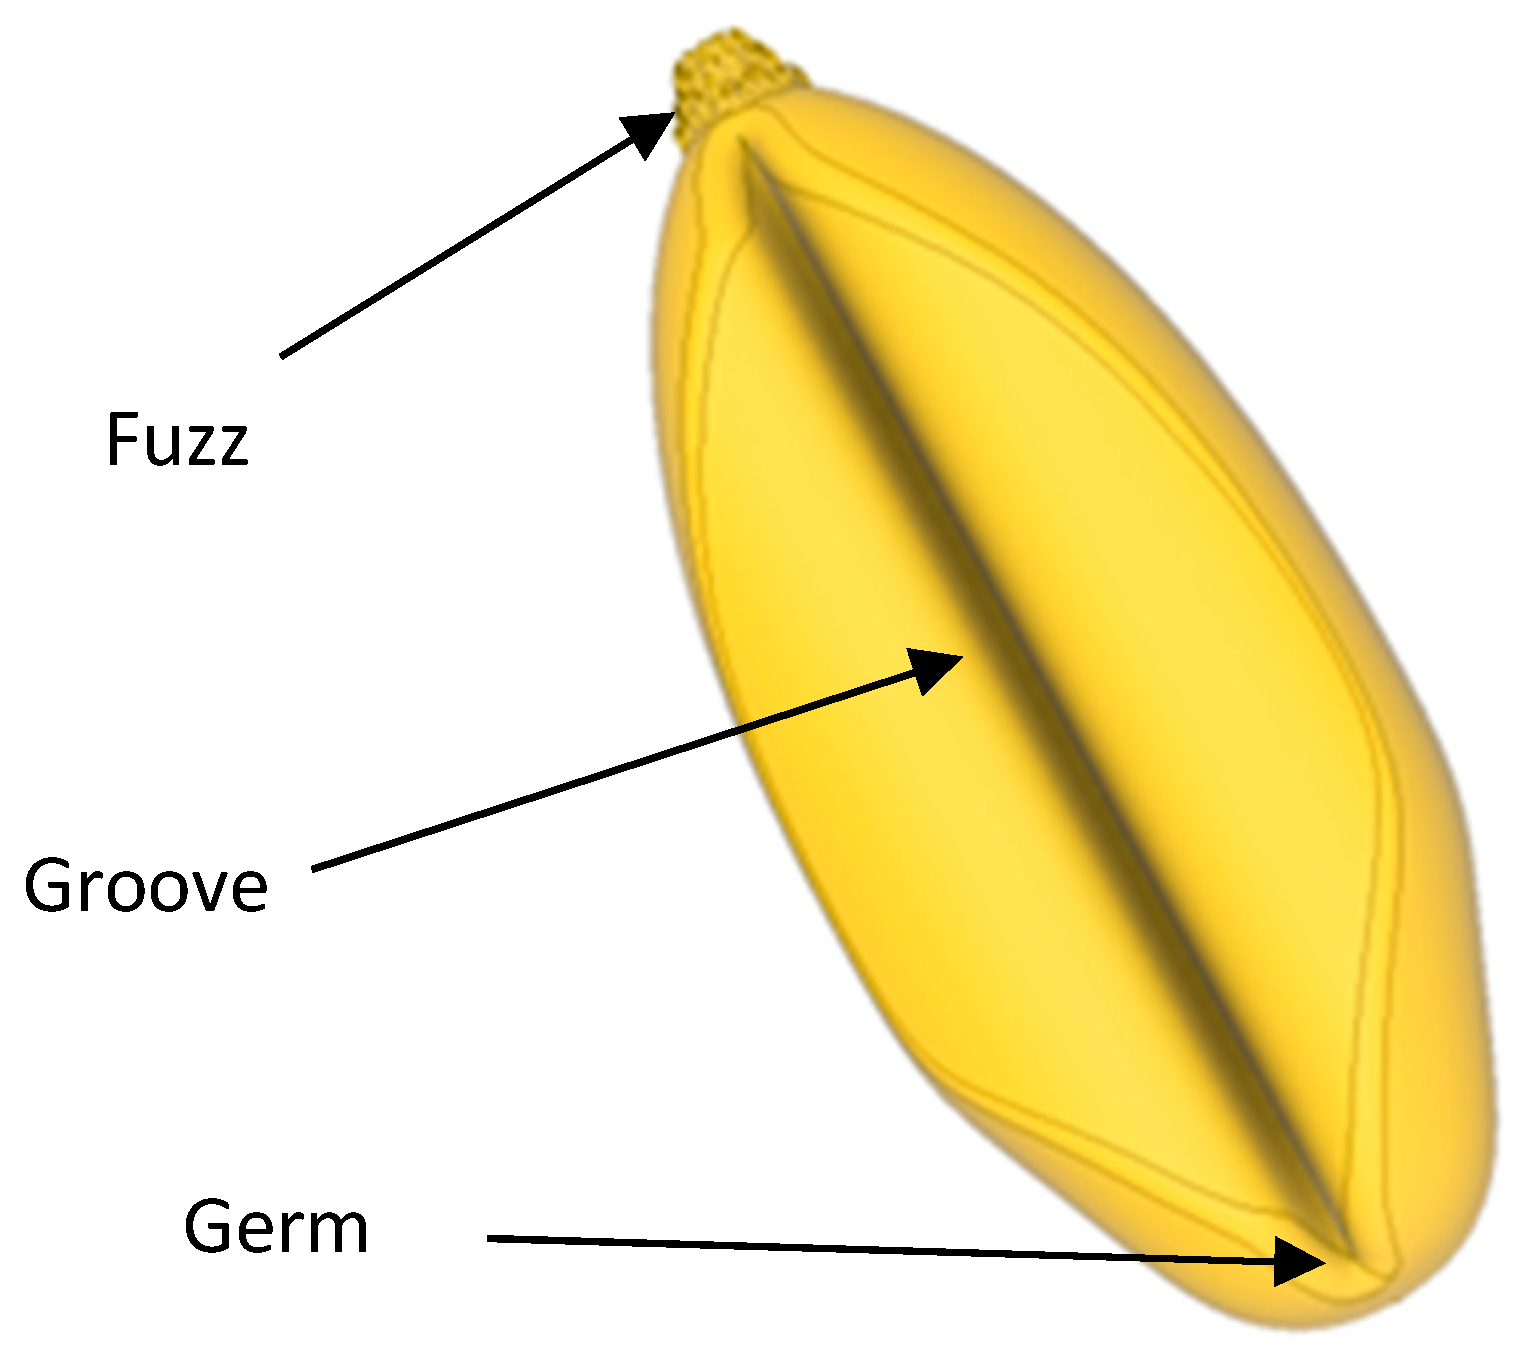
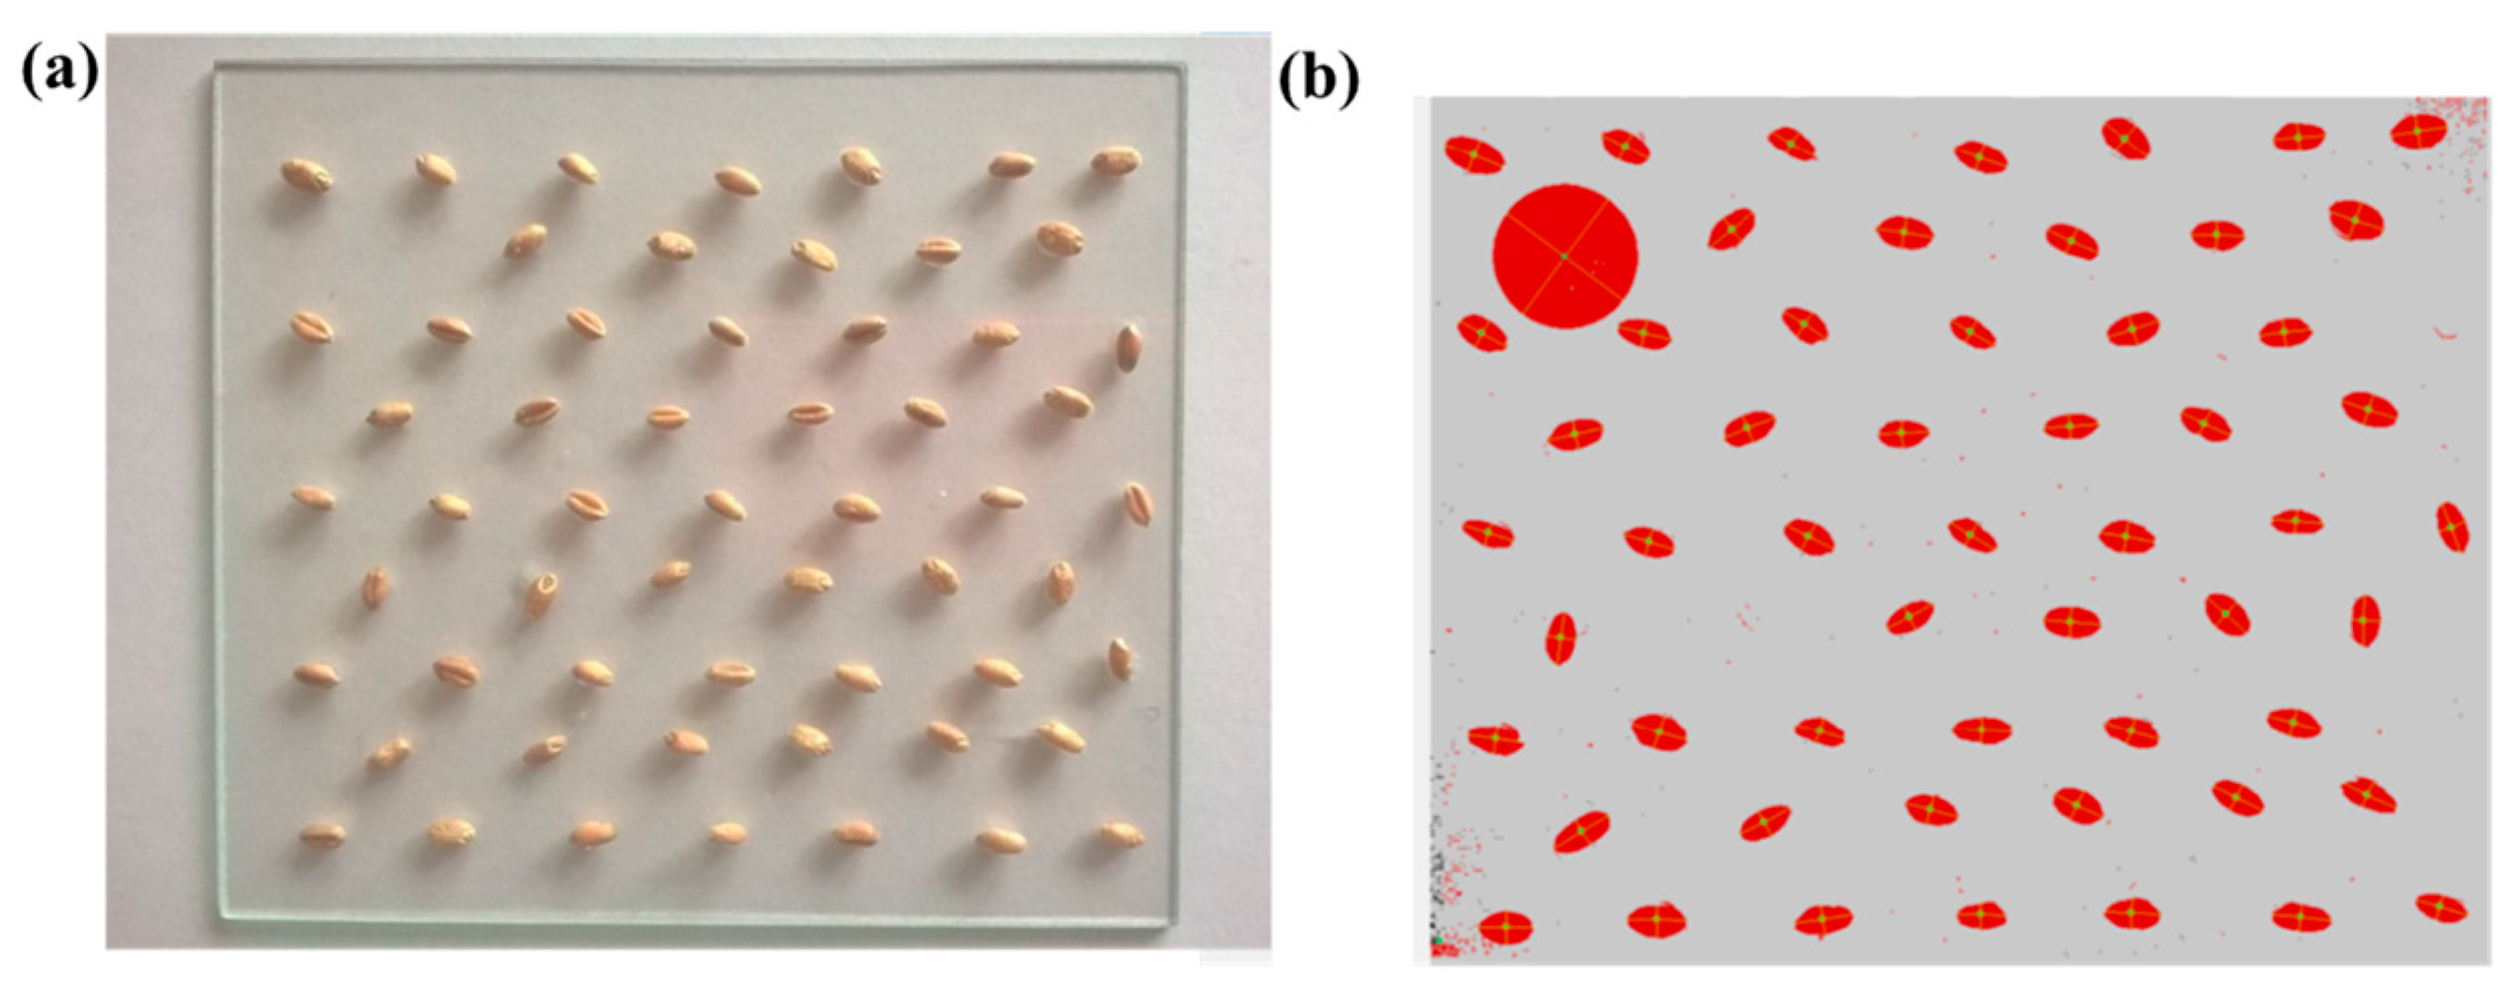
  • Principal dimensions: obtained by a photogrammetric method. High-contrast images were captured on a custom light table that provided back-lighting of the samples, then processed with GABAR software 1.0 developed at the Department of Working Machines, Poznań University of Technology (Figure 8a). Mean values and standard deviations of grain length, width and thickness were recorded.
As a result of the measurements, the following material characteristics were established:
  • Average grain mass: 0.045 ± 0.008 g;
  • Baseline moisture content: 7%;
  • Grain length: 6.41 ± 0.50 mm;
  • Grain width: 3.04 ± 0.38 mm.
Moisture-content adjustment was carried out by conditioning 100 g samples: the required volume of distilled water was added, and the samples were sealed in airtight containers, stored at 3 °C and shaken periodically to ensure uniform distribution. The mass of water to be added was calculated with
m w = w 1 w 0 100 w 1 m
where
  • m w —mass of the missing water,
  • M—mass of the grain,
  • w 0 —initial moisture level,
  • w 1 —target moisture level.
This range of 7–16% was selected because drying below 7% requires disproportionately high energy, whereas moisture contents above 16% accelerate microbial degradation of the grain.

3.6. Research Plan

The experiment covered four moisture levels of the test material—7%, 10%, 13% and 16%. For each level, measurements were taken on 100 randomly selected wheat grains.
Impact velocity was varied in four steps (1.5, 2.5, 3.5 and 4.5 m·s−1). The two lower velocities were obtained by free-falling the grains from heights of 200–1000 mm, whereas the maximum velocity (≈4.5 m·s−1) required a forced-air circulation system.
The chosen velocity range is justified by Segler’s Study [45], which identified 27.5 m·s−1 as the critical air speed in pneumatic transport: above this limit the grain structure is damaged, reducing biological value and preventing germination. Measurements made at the Department of Working Machines, Poznań University of Technology [46,47] (Figure 9) show that an air velocity of 27.5 m·s−1 in a seed-drill tube carrying wheat at 7.5% moisture corresponds to a grain velocity of approximately 4.5 m·s−1—hence the upper bound used in the present tests.
This setup ensured precise control of the experimental conditions and enabled reliable analysis of impact behaviour at different moisture levels and grain orientations.

4. Results

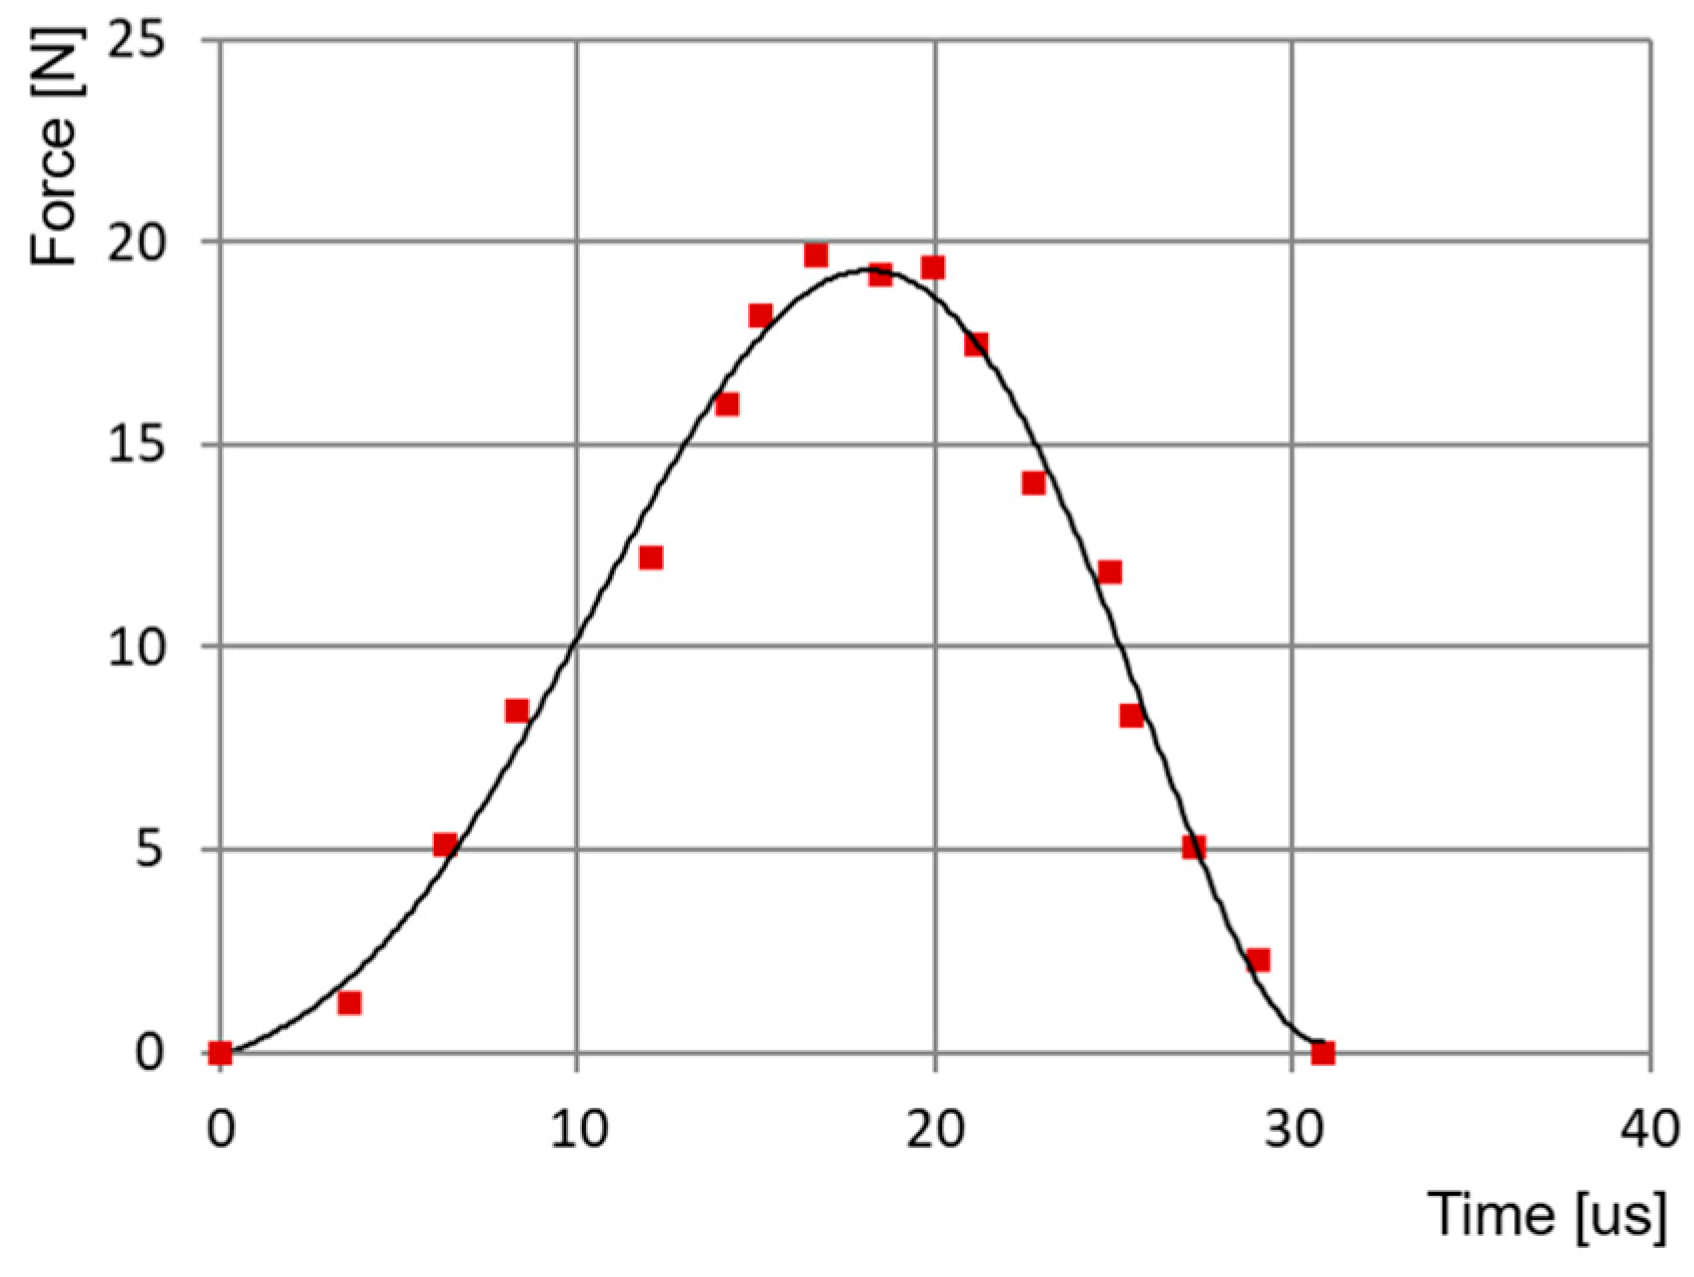
4.1. Identification of Contact Force in Collision of Wheat Grains with a Flat Metal Surface

The custom-built test rig was used to record contact-force time profiles, F c ( t ) and their maxima, F c _ m a x , during grain impact on the piezoelectric sensor. Figure 10a–d present F c ( t ) for four impact velocities (1.5, 2.5, 3.5 and 4.5 m·s−1) at four moisture levels (7.00 ± 0.28%, 10.00 ± 0.40%, 13.00 ± 0.52% and 16.00 ± 0.64%).
These moisture ranges were chosen because values below 7% demand disproportionate drying energy, whereas levels above 16% accelerate microbial degradation and are seldom used in practice.
Figure 11a–d show the maximum contact force F c _ m a x recorded for 400 wheat-grain impacts performed at four impact velocities (1.5, 2.5, 3.5 and 4.5 m·s−1) and four moisture levels (7%, 10%, 13% and 16%). The experimental values are plotted as blue, filled circles with error bars.
To describe the relationship between impact velocity and F c _ m a x , each dataset was fitted with a power-law model, y = a x b . The solid black curve depicts the fit, while red, dashed Neyman curves delimit the 95% confidence band. This band represents the range in which ≈95% of future experimental or simulated points are expected to fall, combining the statistical uncertainty of the fit with the natural variability of the grain material. A narrow band denotes high precision and low scatter; a wide band indicates greater uncertainty.

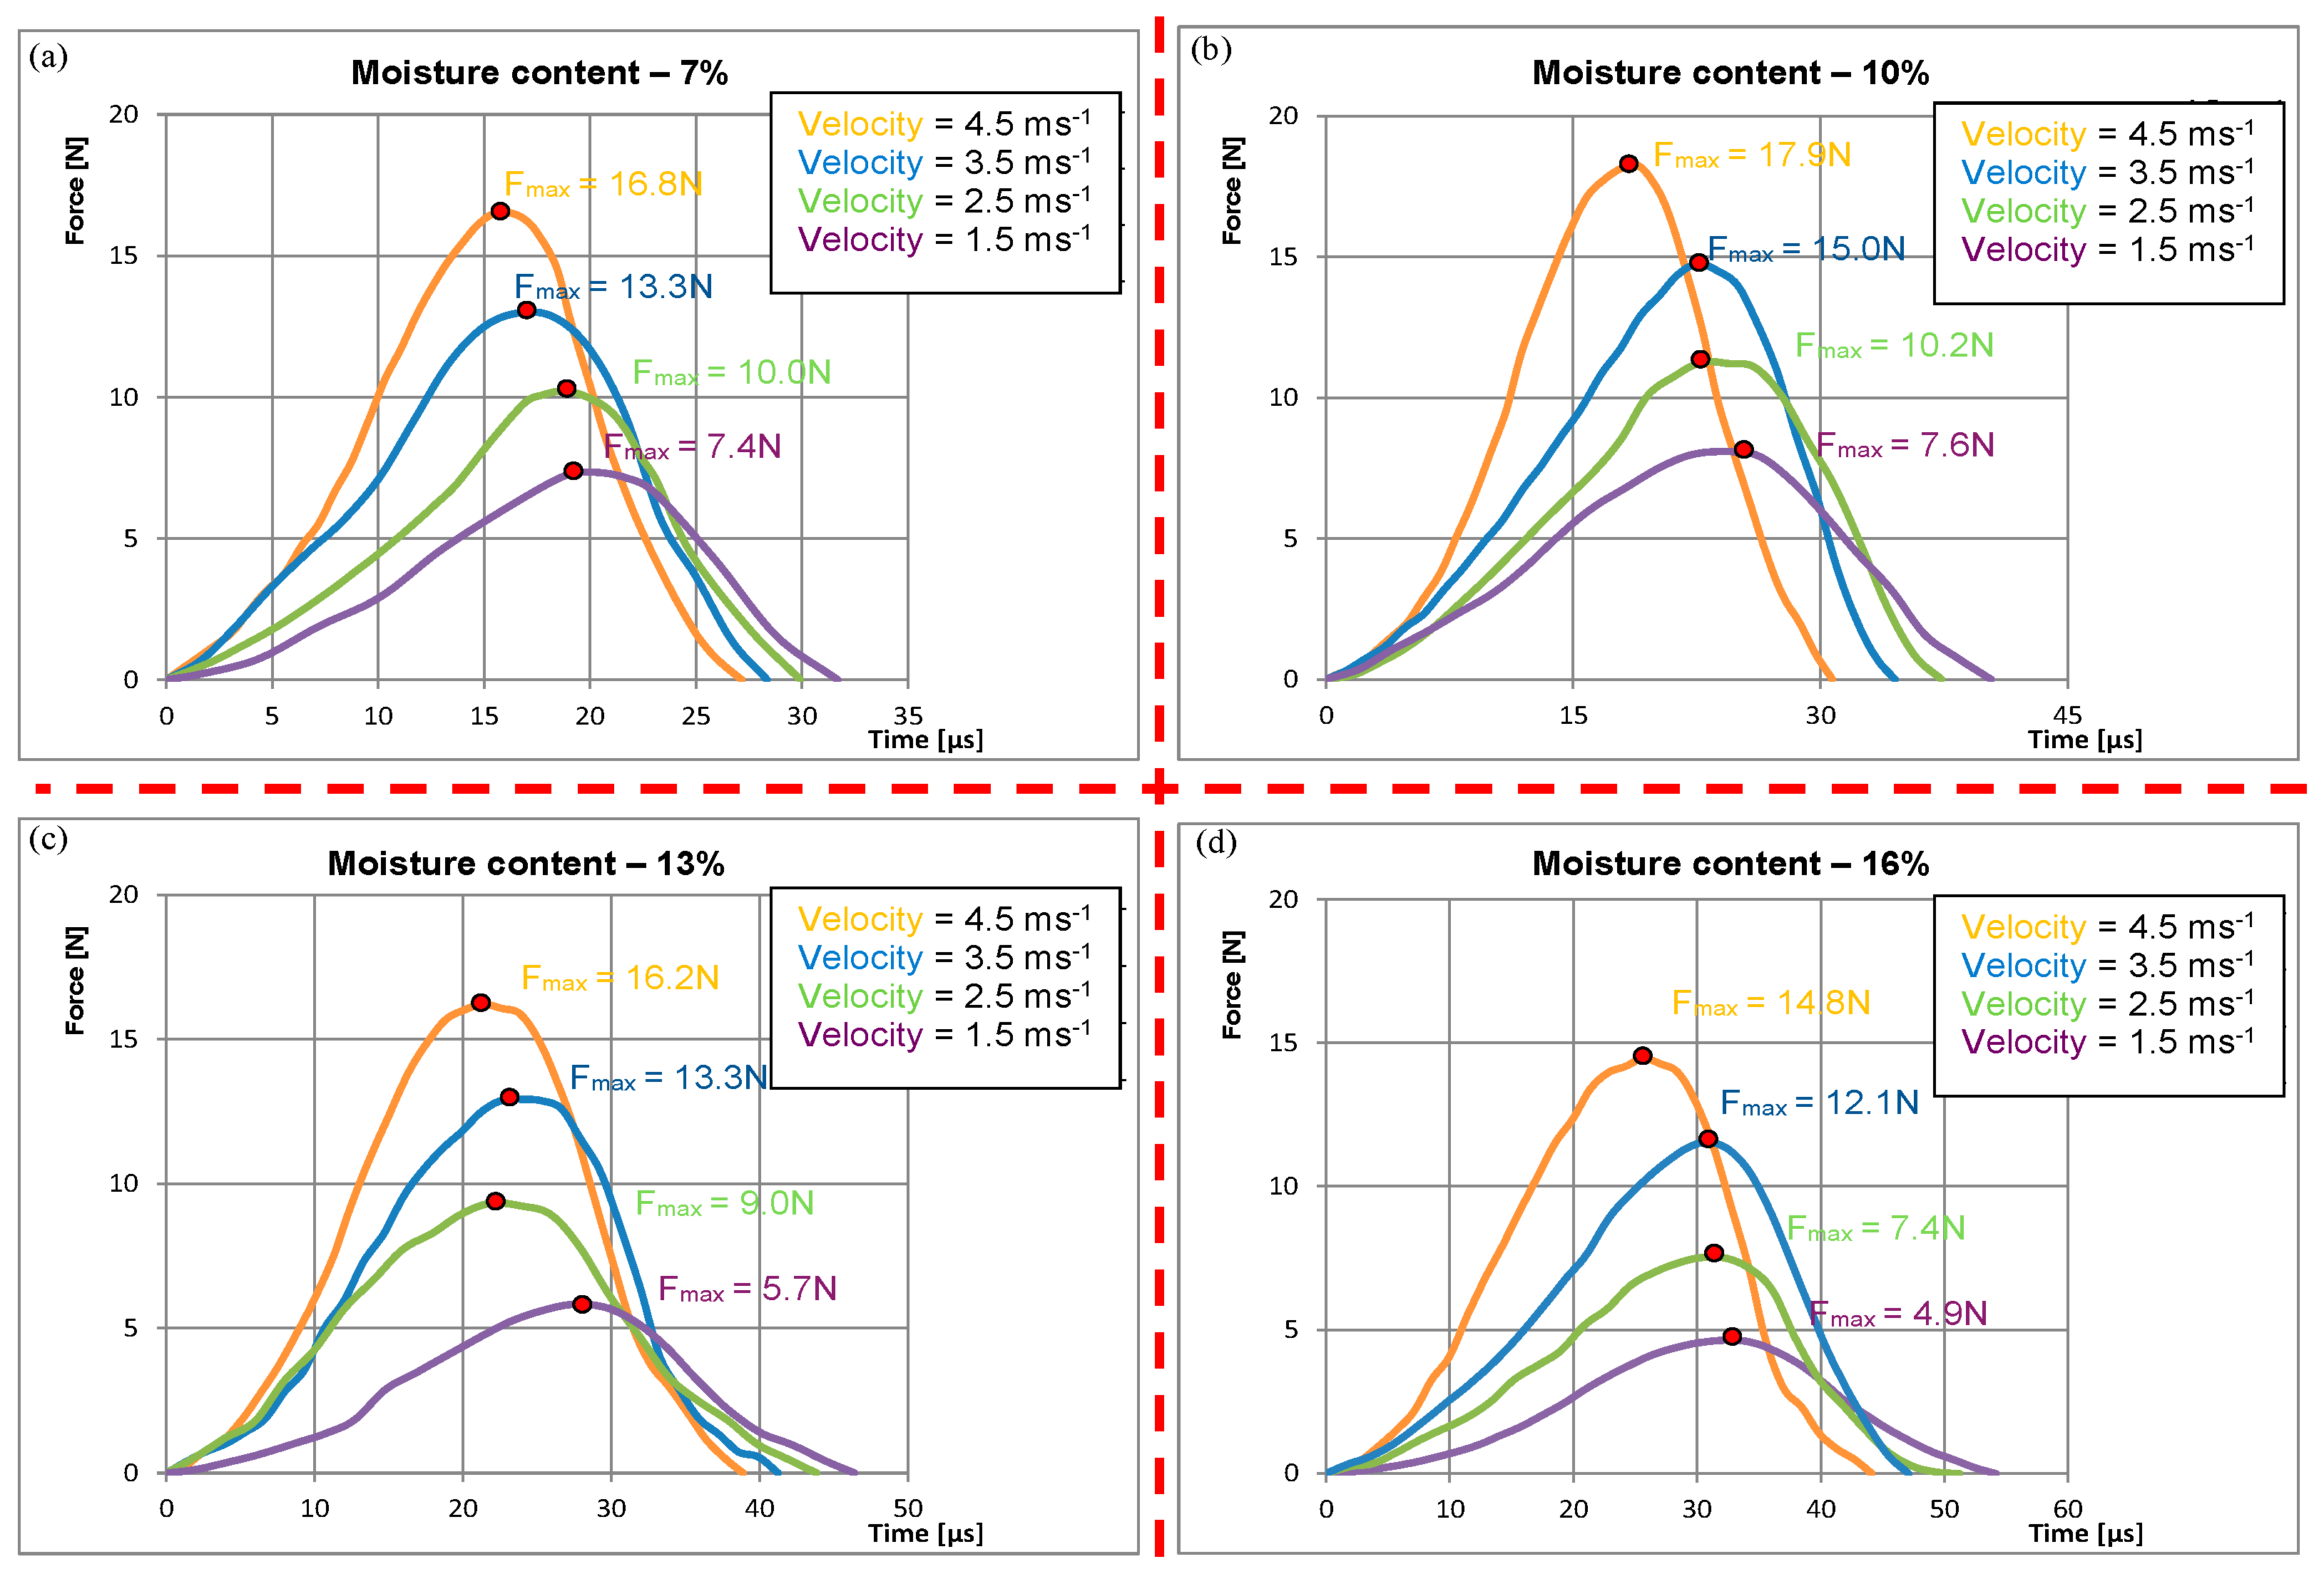
4.2. Identification of the Relationship Between Maximum Contact Force and Collision Time at Different Moisture Levels

The relationship between maximum contact force F c _ m a x and collision time t was also analysed for four moisture levels: 7%, 10%, 13% and 16%. Figure 12 shows F c _ m a x (N) plotted against t (µs) for wheat grains impacting a flat metal surface; data points are colour-coded by moisture level.
At every moisture level, the trend is characteristic of force dissipation: as F c _ m a x decreases, contact time increases. The initial decline in force is steep and later tapers off as the collision progresses. The fall in F c _ m a x correlates directly with impact velocity.
Each series is fitted with a power-law model, y = a x b , whose parameters a and b and coefficients of determination ( R 2 ) are listed in Figure 12. Neyman curves indicate the 95% confidence intervals around every fit.
The analysis demonstrates that moisture content significantly influences the impact dynamics of wheat grains. Higher moisture levels result in more elastic behaviour, characterised by longer collision times, and lower maximum forces, whereas lower moisture levels produce a more brittle response with a rapid decay of force. The longer contact times observed for grains at 16% moisture correspond to lower peak forces F c _ m a x (Figure 12), because their greater plasticity allows deformation to be distributed over time.
In moist kernels, the increased plasticity and elasticity spread the impact load, yielding lower peak forces. By contrast, grains at 7% moisture are stiffer and less deformable; the collision forces therefore rise rapidly and decay abruptly, producing higher F c _ m a x over shorter durations. Wet grains also absorb and redistribute impact energy within the endosperm and outer layers, whereas dry grains concentrate stress locally, amplifying peak forces.
These moisture-dependent material properties govern how a grain stores and releases energy: viscoelastic, high-moisture grains partly absorb and gradually release energy, while drier grains release it almost instantaneously. Understanding this relationship is essential for optimising mechanical processes in grain handling and processing, where controlling grain moisture can mitigate undesired impact damage.

5. Evaluation of Coefficient of Restitution (CoR)

5.1. Data Processing

To determine the coefficient of restitution, the experimental force–time curves were approximated because the raw data contained noise from the measurement system, transducer non-linearity and setup vibrations. Such disturbances could compromise data reliability, especially during the integration used to obtain the impulse.
The approximation expressed the signals as sixth-degree polynomials F c ( t ) that were smooth and free of local disturbances, enabling more precise analysis. Polynomial fitting was performed with APROKSYMACJA software (version 1.5.7.2) using the least-squares method, which minimised the influence of noise while preserving the signal shape—Figure 13. This procedure was essential for an accurate determination of the coefficient of restitution (CoR).
The determination of the coefficient of restitution was based on Equations (9) and (10), which require integrating the force function. Figure 4 illustrates how the approximating polynomials were integrated to obtain the impulse for the two contact phases—compression and restitution. To separate these phases, the dataset was divided at the point of maximum force F c _ m a x , identified as the location where the first derivative of F ( t ) is equal to zero.
Integration was carried out in a spreadsheet with the rectangular rule by subdividing the time axis into intervals Δ t and summing the products F ( t ) Δ t . The impulses calculated for the compression and restitution phases were then used to evaluate ( C o R , e) in accordance with Equation (11).
Processing the complete dataset of 400 wheat-grain impacts allowed ( C o R , e) to be plotted as a function of impact velocity and collision force for four moisture levels (7%, 10%, 13% and 16%; Figure 14). Under the relatively low velocities studied, ( C o R , e) appears to be governed by internal energy dissipation rather than by grain breakage, so damage effects can be neglected for the conditions tested.
The collected datasets were approximated using polynomial regression. The obtained goodness-of-fit coefficients showed no significant improvement when higher-degree polynomials were applied. Therefore, a quadratic function was deemed an appropriate representation of the relationship between the coefficient of restitution ( C o R , e) and collision velocity ( v c ) for grains at all moisture levels. Other functional forms—including exponential, power-law and higher-order polynomials up to the sixth degree—were also tested; however, none of them improved the fit because of the natural scatter in the measurement data, which stems from the inherent morphological heterogeneity of plant materials. The quadratic model is further supported by earlier studies of CoR in seeds such as rapeseed and peas, which display similar nonlinear characteristics.

5.2. Results and Interpretation

The trends observed in Figure 14 provide valuable insight into the mechanical behaviour of ‘Memory’ wheat grains during impact. The coefficient of restitution (CoR, e) decreases monotonically with velocity at every moisture level. At ~1.0 m·s−1, the CoR remains high (≈0.55–0.65), indicating an essentially elastic rebound, but it falls to ≈0.30–0.40 at 4.5 m·s−1 as more energy is dissipated through plastic deformation and micro-fracturing.
Moisture amplifies this effect. At 7% moisture, the CoR descends gradually with velocity, whereas at 16%, it starts lower (≈0.50) and declines sharply to ≈0.30–0.35 at 4.5 m·s−1, reflecting increased energy absorption by wetter kernels. Polynomial regression confirms the nonlinear CoR–velocity–moisture relationship; the coefficient of determination (R²) decreases with moisture, implying greater structural variability.
Comparing these results with the literature shows analogous CoR–velocity–moisture patterns for maize, oilseed rape, soybean, pea and other crop seeds [6,28,29,48,49,50]. Although absolute CoR, e values differ among species, the shared trend of lower CoR at higher velocity and moisture is consistent. Higher collision velocities promote permanent deformation, while moisture acts as a plasticiser that softens seed tissues and increases internal damping [24,29].
In wheat, the multilayered husk–aleurone–endosperm structure likely accentuates these effects, making combined velocity–moisture analyses more challenging than for morphologically simpler seeds such as pea or soybean [48]. These phenomena are universal for plant seeds, albeit modulated by species morphology and genotype [49]. The literature points out that CoR may vary markedly between varieties [22]; variety-specific tests—such as the present study on ‘Memory’ wheat—are therefore essential for accurate modelling and equipment design.

5.3. Practical Significance of the Results

The experimental work conducted in this study provides several practically relevant insights. Beyond the primary objective—validating simulation models for use with the discrete element method (DEM) to predict grain behaviour in pneumatic transport systems and mechanical sorters as support for machine design—the results also enable more direct, application-oriented conclusions. The most evident utility lies in their potential to reduce the risk of mechanical damage to grains during harvesting, transport and processing.
Based on the relationships observed between grain moisture content, impact velocity and the coefficient of restitution (CoR), we propose the following recommendations:
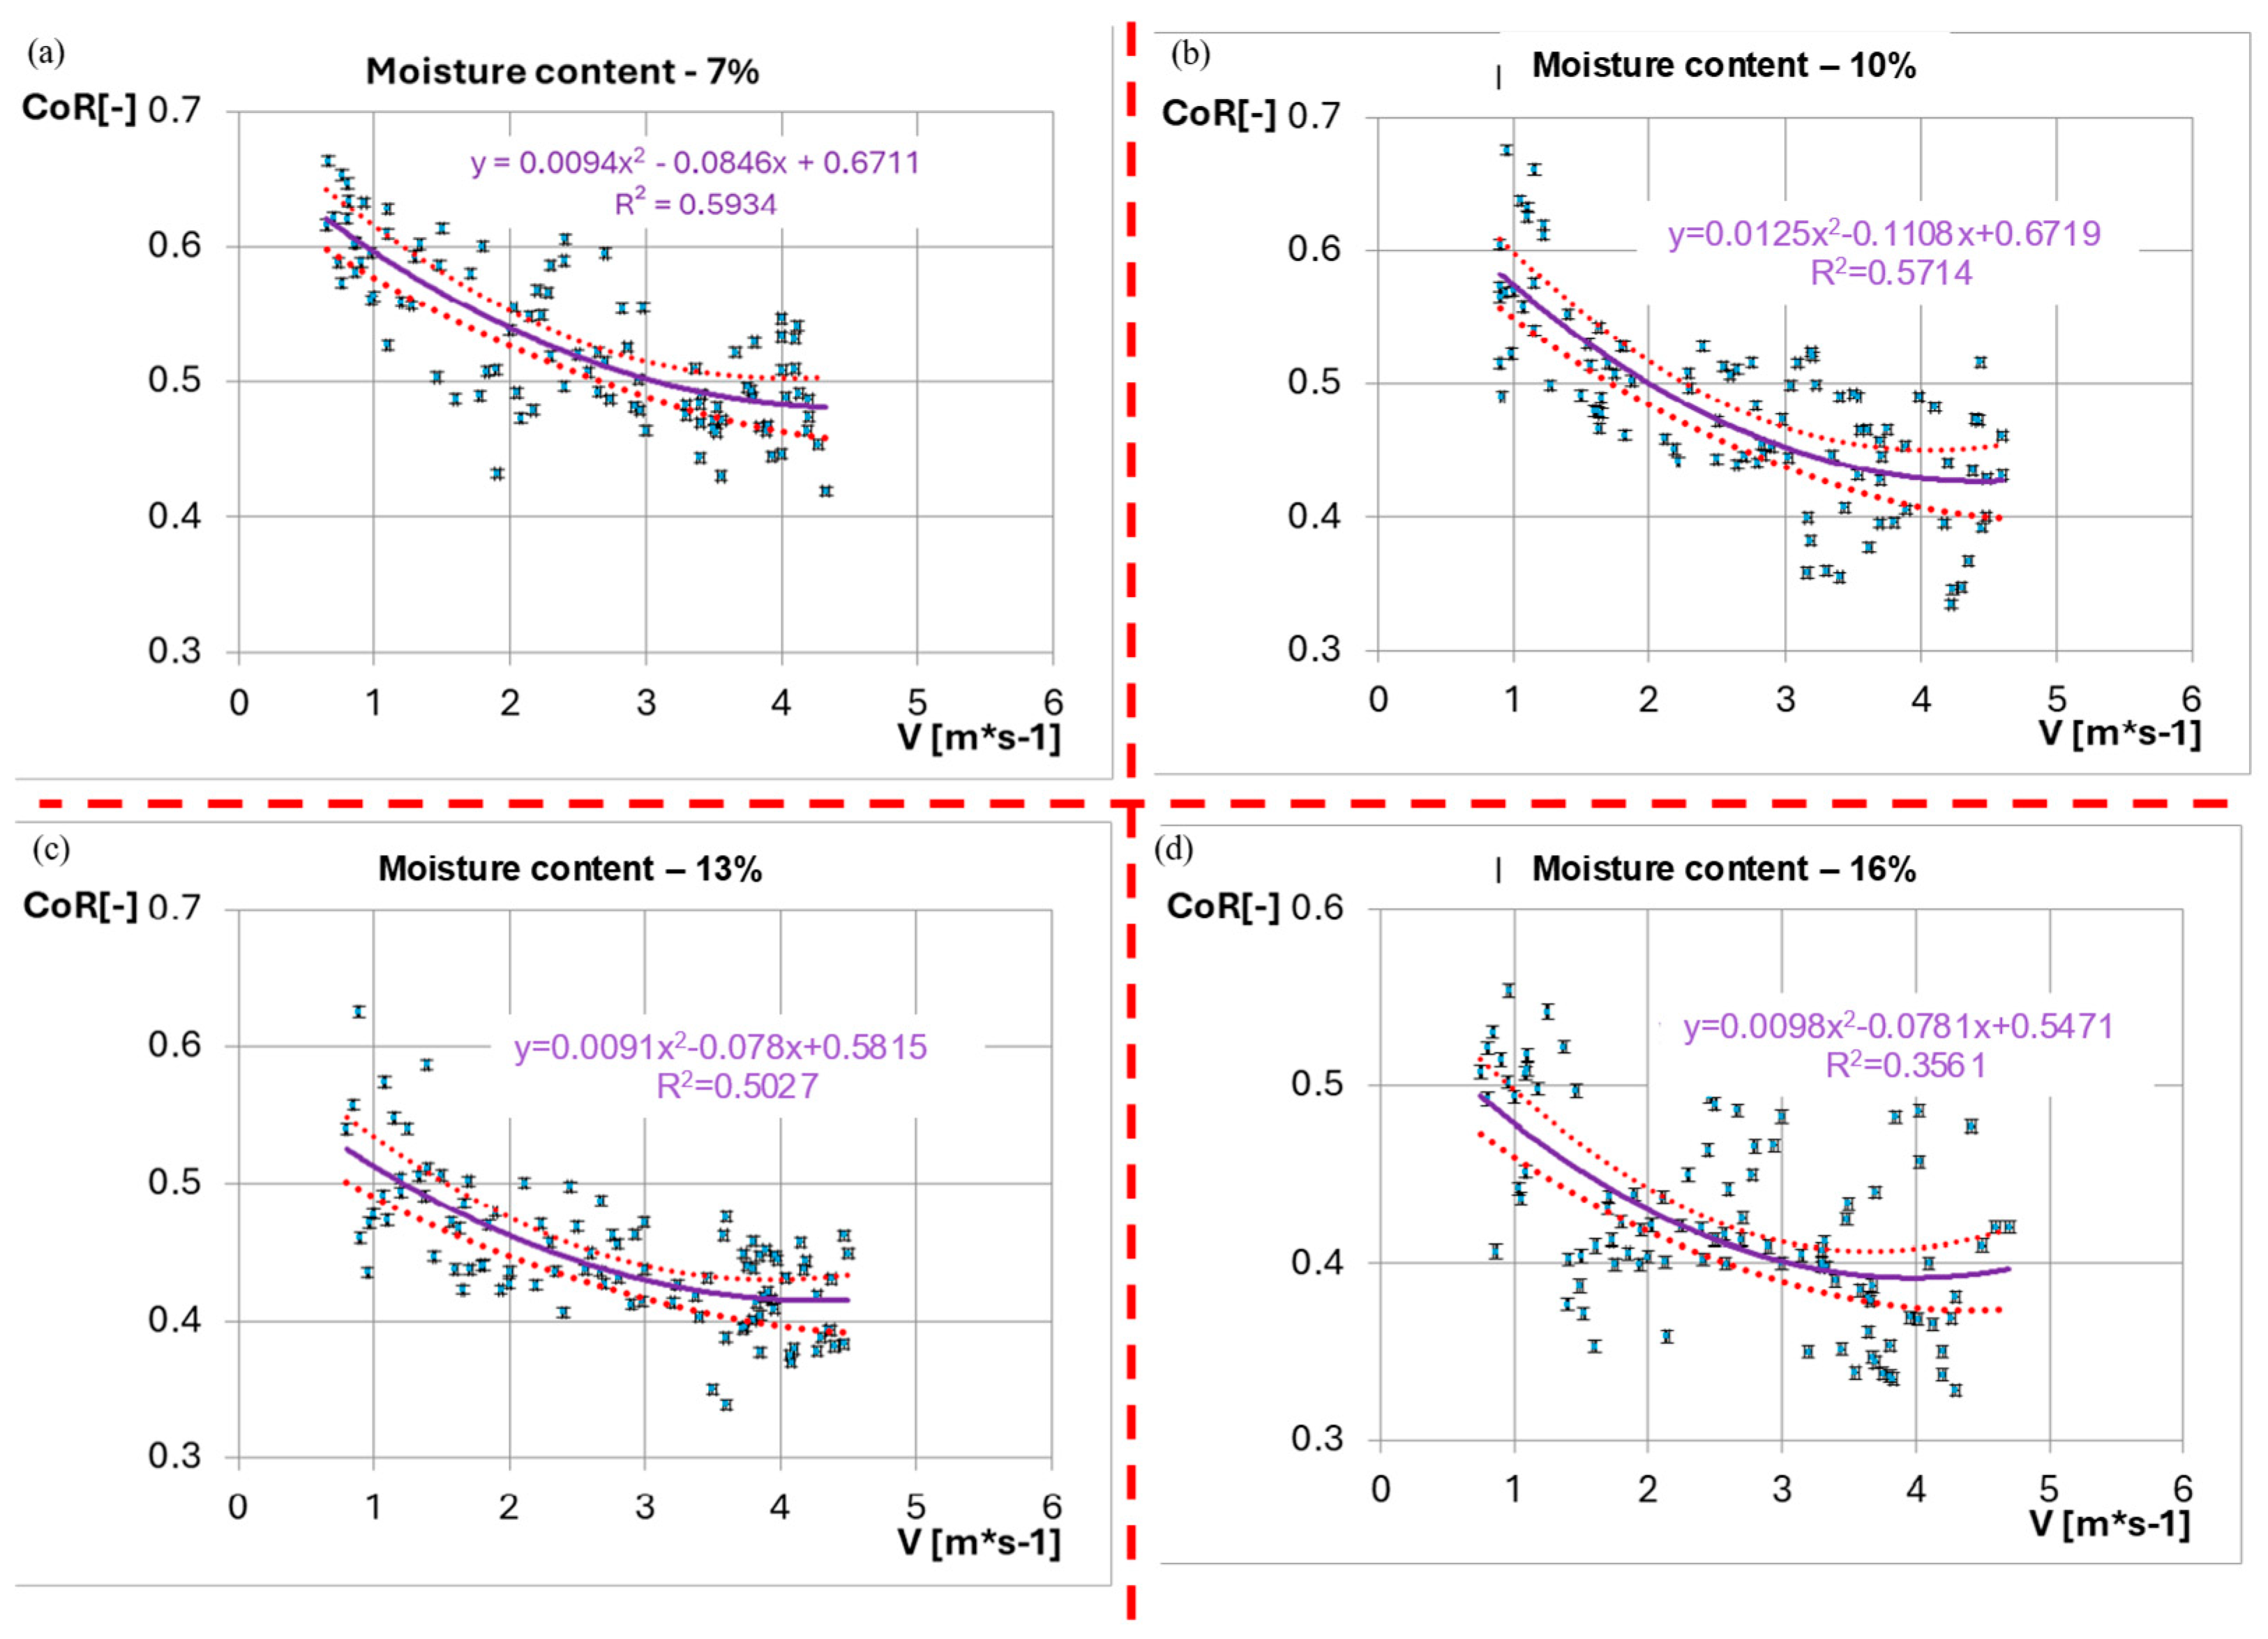
  • Moisture content: A strong correlation exists between CoR and grain moisture, as illustrated in Figure 14; for the ‘Memory’ wheat variety, structural damage is markedly lower when moisture remains below 10%. Higher moisture significantly increases plastic deformation and internal damping, thereby lowering the CoR and prolonging contact time during impact.
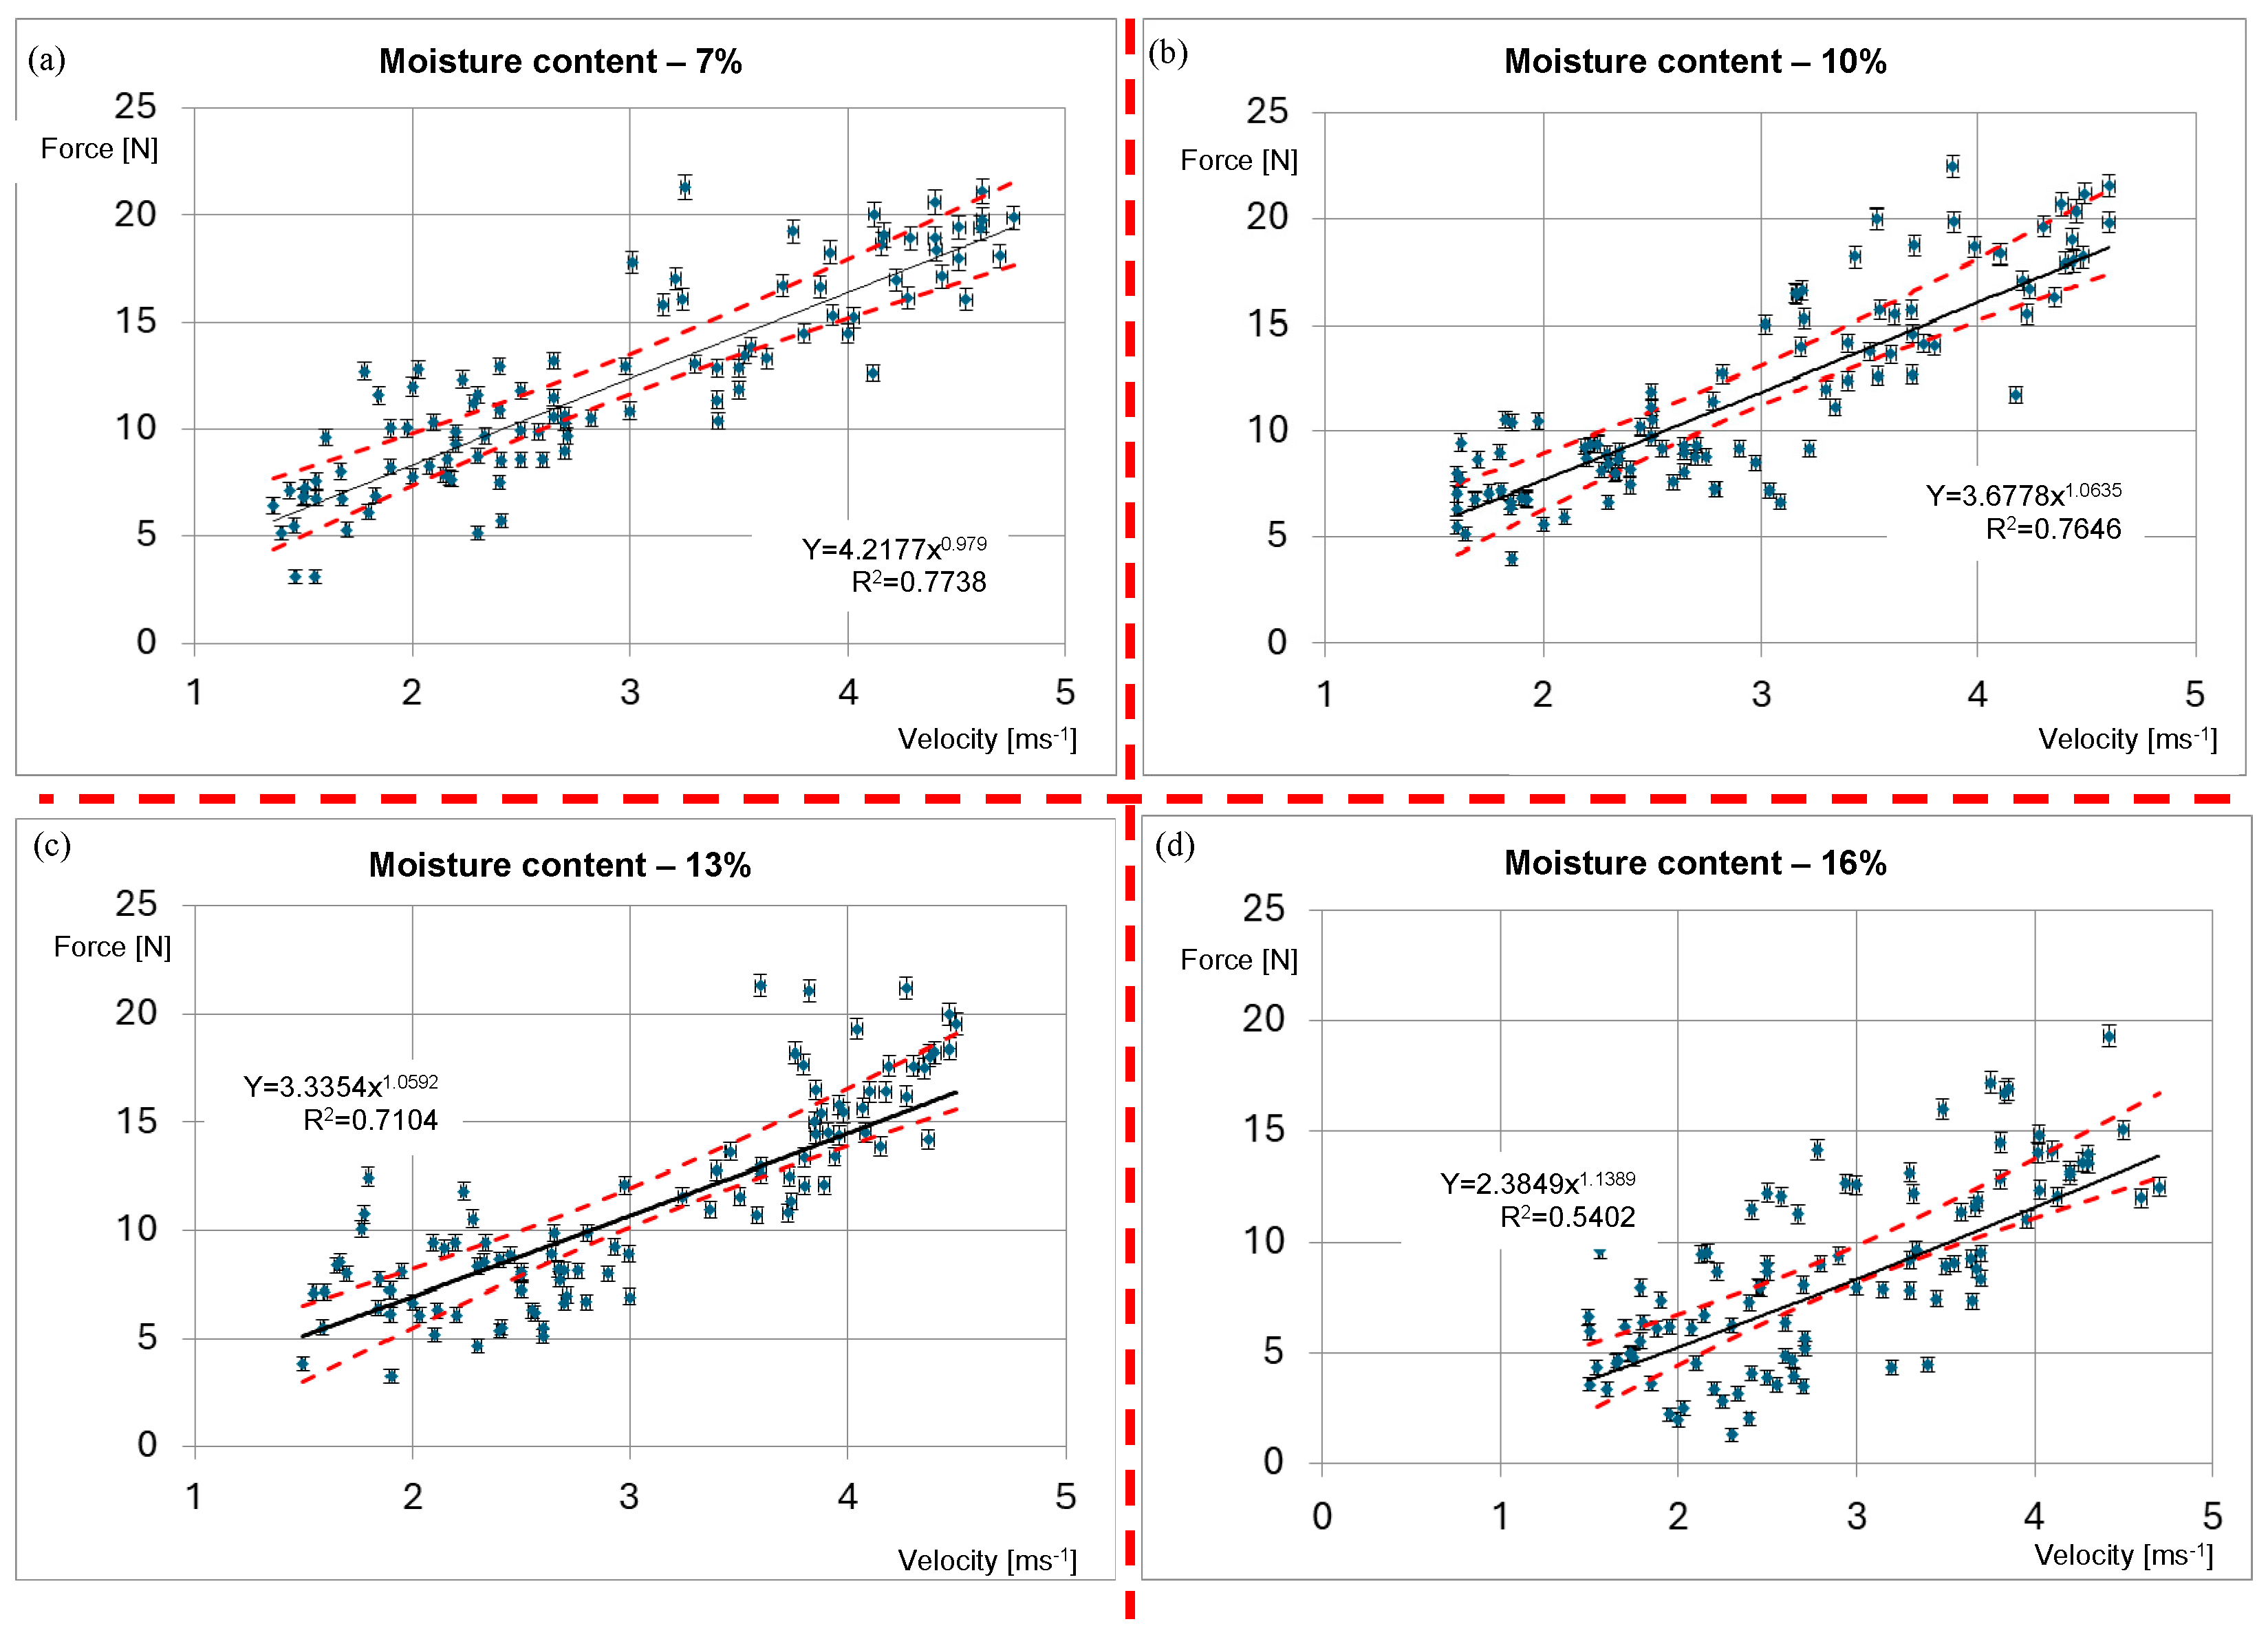
  • Impact velocity: Grain-surface impact velocity is another critical factor, particularly when selecting transport speeds in pneumatic conveying systems such as seed drills. In this study, CoR decreased from 0.6 to 0.4–0.5 as velocity rose from 1.0 to 5.0 m·s−1 (Figure 8). High-moisture kernels impacted at higher velocities are therefore especially vulnerable to internal mechanical damage.
  • Equipment design: Impact dynamics also inform equipment design. Machine contact surfaces (e.g., metal plates, guides or rotary components) should absorb part of the impact energy or distribute forces evenly. Using slightly elastic materials and non-perpendicular geometries can help to minimise grain damage under operating conditions.

6. Conclusions

This study quantifies how impact velocity and moisture content shape the normal-impact behaviour of ‘Memory’ wheat grains. A high-sensitivity force sensor combined with high-speed imaging provides a transferable protocol for future grain-impact studies. We show that the maximum contact force increases monotonically with velocity, whereas the coefficient of restitution (CoR) decreases non-linearly from ≈0.6 to ≈0.4 when velocity rises from 1 to 5 m·s−1 and moisture content from 7% to 16%.
Higher-moisture kernels dissipate more energy, resulting in longer contact times and lower rebound, which makes them especially susceptible to internal damage during high-speed handling.
These findings supply experimentally validated input parameters for discrete element method (DEM) models and offer immediate guidance for designers of pneumatic conveyors and sorters—keeping grain moisture below ≈10% and limiting local impact velocities to <3 m·s−1 should markedly reduce breakage. Future work will extend the method to oblique impacts and additional wheat cultivars to generalise these design rules.

Author Contributions

Conceptualisation, J.M. and M.S.; methodology, J.M. and M.S.; software, J.M.; formal analysis, J.M. and G.W.Ś.; investigation, J.M. and M.S.; resources, M.S.; data curation, M.S. and J.M.; writing—original draft preparation, G.W.Ś. and J.M.; writing—review and editing, G.W.Ś., J.M. and M.S.; visualisation, M.S. and J.M.; supervision, G.W.Ś. and M.S.; project administration, J.M.; funding acquisition, J.M. All authors have read and agreed to the published version of the manuscript.

Funding

This research received no external funding.

Institutional Review Board Statement

Not applicable.

Informed Consent Statement

Not applicable.

Data Availability Statement

The original contributions presented in this study are included in the article. Further inquiries can be directed to the corresponding author.

Conflicts of Interest

The authors declare no conflicts of interest.

References

  1. Curtis, B.C. Wheat in the World. In Bread Wheat Improvement and Production; Curtis, B.C., Rajaram, S., Macpherson, H.G., Eds.; Plant Production and Protection Series 30; FAO: Roma, Italy, 2002; pp. 1–18. ISBN 92-5-104809-6. [Google Scholar]
  2. Iwańska, M.; Paderewski, J.; Stępień, M.; Rodrigues, P.C. Adaptation of Winter Wheat Cultivars to Different Environments: A Case Study in Poland. Agronomy 2020, 10, 632. [Google Scholar] [CrossRef]
  3. Chen, Z.; Wassgren, C.; Ambrose, R. Measured damage resistance of corn and wheat kernels to compression, friction, and repeated impacts. Powder Technol. 2020, 380, 638–648. [Google Scholar] [CrossRef]
  4. Stronge, W. Impact Mechanics, 2nd ed.; Cambridge University Press: Cambridge, UK, 2018; ISBN 9781139050227. [Google Scholar] [CrossRef]
  5. Glenn, G.M.; Younce, F.L.; Pitts, M.J. Fundamental physical properties characterizing the hardness of wheat endosperm. J. Cereal Sci. 1991, 13, 179–194. [Google Scholar] [CrossRef]
  6. Mousaviraad, M.; Tekeste, M. Effect of grain moisture content on physical, mechanical, and bulk dynamic behaviour of maize. Biosyst. Eng. 2020, 195, 186–197. [Google Scholar] [CrossRef]
  7. Marcinkiewicz, J. Modelowanie sił Kontaktowych w Układzie ZIARNO roślinne–Powierzchnia Zespołu Roboczego w Aspekcie Zjawisk o Przebiegu Dynamicznym. Doctoral Dissertation, Politechnika Poznańska, Poznań, Poland, 2023. [Google Scholar]
  8. Fan, Y.; Wang, H.; Zhou, T.; Zou, L.; Jiang, Z.; Hu, M. Prediction of Coefficient of Restitution for Impact Elastoplastic Spheres Considering Finite Plate Thickness. Chin. J. Mech. Eng. 2024, 37, 91. [Google Scholar] [CrossRef]
  9. Haug, E.J.; Wu, S.C.; Yang, S.M. Dynamics of mechanical systems with coulomb friction, stiction, impact and constraint addition deletion—I theory. Mech. Mach. Theory 1986, 21, 401–406. [Google Scholar] [CrossRef]
  10. Hu, G.; Hu, Z.; Jian, B.; Liu, L.; Wan, H. On the determination of the damping coefficient of non-linear spring-dashpot system to model Hertz contact for simulation by discrete element method. J. Comput. 2011, 6, 984–988. [Google Scholar] [CrossRef]
  11. Ivanov, A.P. Dynamics of Systems with Mechanical Collisions; Mezhdunarodnaya Programma Obrazovaniya: Moscow, Russia, 1997. (In Russian) [Google Scholar]
  12. Panovko, Y.G. Introduction to the Theory of Mechanical Impact; Nauka: Moscow, Russia, 1977. (In Russian) [Google Scholar]
  13. Wriggers, P. Computational Contact Mechanics, 2nd ed.; Springer: Berlin/Heidelberg, Germany, 2006; ISBN -13: 978-0-471-49680-9. [Google Scholar] [CrossRef]
  14. Flickinger, D.M.; Bowling, A. Simultaneous oblique impacts and contacts in multibody systems with friction. Multibody Syst. Dyn. 2010, 23, 249–261. [Google Scholar] [CrossRef]
  15. Rodriguez, A.; Bowling, A. Solution to indeterminate multipoint impact with frictional contact using constraints. Multibody Syst. Dyn. 2012, 28, 313–330. [Google Scholar] [CrossRef]
  16. Goldsmith, W. Impact: The Theory and Physical Behaviour of Colliding Solids; Edward Arnold Ltd.: London, UK, 1960. [Google Scholar]
  17. Li, Y.; Qiu, X.; Zhang, X. Different definitions and corresponding applicabilities of the coefficient of restitution. Mech. Eng. 2015, 37, 773–777. [Google Scholar] [CrossRef]
  18. Gao, Z.; Lu, C.; Li, H.; He, J.; Wang, Q.; Huang, S.; Li, Y.; Zhan, H. Measurement Method of Collision Restitution Coefficient between Corn Seed and Soil Based on the Collision Dynamics Theory of Mass Point and Fixed Surface. Agriculture 2022, 12, 1611. [Google Scholar] [CrossRef]
  19. Zhou, Z.; Zhang, M. Measurement and analysis of restitution coefficient between maize seed and soil based on high-speed photography. Int. J. Agric. Biol. Eng. 2017, 10, 113–118. [Google Scholar]
  20. Liu, Y.; Zong, W.Y.; Ma, L.N. Determination of 3D collision recovery coefficient of oil sunflower seeds by high-speed photography. Trans. Chin. Soc. Agric. Eng. 2020, 36, 44–53. [Google Scholar]
  21. Sandeep, C.S.; Senetakis, K.; Cheung, D.; Choi, C.E.; Wang, Y.; Coop, M.R.; Ng, C.W.W. Experimental study on the coefficient of restitution of grain against block interfaces for natural and engineered materials. Can. Geotech. J. 2021, 58, 35–48. [Google Scholar] [CrossRef]
  22. Szwed, G.; Pecen, J. Wyniki badań współczynnika restytucji niektórych nasion roślin uprawnych. Inżynieria Rol. 2006, 4, 289–295. [Google Scholar]
  23. Wang, C.; Li, Y.; Ma, L.; Ma, Z. Experimental study on measurement of restitution coefficient of wheat seeds in collision models. Trans. Chin. Soc. Agric. Eng. 2012, 28, 274–279. [Google Scholar] [CrossRef]
  24. Horabik, J.; Beczek, M.; Molenda, M. Determination of the restitution coefficient of seeds and coefficients of visco-elastic Hertz contact models for DEM simulations. Biosyst. Eng. 2017, 161, 106–119. [Google Scholar] [CrossRef]
  25. Mi, G.; Liu, Y.; Wang, T.; Dong, J.; Zhang, S.; Li, Q.; Chen, K.; Huang, Y. Measurement of Physical Properties of Sorghum Seeds and Calibration of Discrete Element Modeling Parameters. Agriculture 2022, 12, 681. [Google Scholar] [CrossRef]
  26. Yu, K.; Elghannay, H.A.; Tafti, D. An impulse based model for spherical particle collisions with sliding and rolling. Powder Technol. 2017, 319, 102–116. [Google Scholar] [CrossRef]
  27. Wang, L.; Yang, H.; Wang, Z.; Wang, Q.; Lu, C.; Wang, C.; He, J. Calibration of DEM Polyhedron Model for Wheat Seed Based on Angle of Repose Test and Semi-Resolved CFD-DEM Coupling Simulation. Agriculture 2025, 15, 506. [Google Scholar] [CrossRef]
  28. Wang, J.; Zhang, W.; Wang, F.; Liu, Y.; Zhao, B.; Fang, X. Experimental Analysis and Verification of the Influence on the Elastic Recovery Coefficient of Wheat. Appl. Sci. 2023, 13, 5481. [Google Scholar] [CrossRef]
  29. Wang, J.; Xu, C.; Xu, Y.; Wang, Z.; Qi, X.; Wang, J.; Zhou, W.; Tang, H.; Wang, Q. Influencing Factors Analysis and Simulation Calibration of Restitution Coefficient of Rice Grain. Appl. Sci. 2021, 11, 5884. [Google Scholar] [CrossRef]
  30. Wang, L.; Zheng, Z.; Yu, Y.; Liu, T.; Zhang, Z. Determination of the energetic coefficient of restitution of maize grain based on laboratory experiments and DEM simulations. Powder Technol. 2020, 362, 645–658. [Google Scholar] [CrossRef]
  31. Wang, L.; Wu, B.; Wu, Z.; Li, R.; Feng, X. Experimental determination of the coefficient of restitution of particle-particle collision for frozen maize grains. Powder Technol. 2018, 338, 263–273. [Google Scholar] [CrossRef]
  32. Qiu, Y.-K.; An, J.-H.; Yi, M.-L.; Luo, J.-R.; Wang, L.-Z.; Tu, J.; Zhou, Z.-M.; Huang, C. Effect of grain size on mechanical property, friction and wear property and corrosion property of CoCrNi medium-entropy alloy. Zhongguo Youse Jinshu Xuebao/Chin. J. Nonferrous Met. 2023, 33, 1890–1901. [Google Scholar]
  33. Jiang, J.; Sun, W.; Luo, N. Atomic insights into effects of temperature and grain diameter on the micro-deformation mechanism, mechanical properties and sluggish diffusion of nanocrystalline high-entropy alloys. Mater. Today Commun. 2022, 33, 104224. [Google Scholar] [CrossRef]
  34. Figueroa, J.D.C.; Hernández, Z.J.E.; Véles, M.J.J.; Duarte, P.R.; Martínez-Flores, H.E.; Ponce-García, N. Evaluation of degree of elasticity and other mechanical properties of wheat kernels. Cereal Chem. 2011, 88, 12–18. [Google Scholar] [CrossRef]
  35. Ahmed, M.; Hassan, F.U. Cumulative effect of temperature and solar radiation on wheat yield. Not. Bot. Horti Agrobot. Cluj-Napoca 2011, 39, 146–152. [Google Scholar] [CrossRef]
  36. Lai, H.W.; Chow, M.W.K.; Ma, C.K.; Yan, A.Y.K. Calibration of the Frame Rate of High-Speed Digital Video Recorders by Stationary Counting Method. NCSLI Meas. 2018, 12, 38–44. [Google Scholar] [CrossRef]
  37. Yu, C.K.; Hsieh, P.R.; Yuter, S.E.; Cheng, L.W.; Tsai, C.L.; Lin, C.Y.; Chen, Y. Measuring droplet fall speed with a high-speed camera: Indoor accuracy and potential outdoor applications. Atmos. Meas. Tech. 2016, 9, 1755–1766. [Google Scholar] [CrossRef]
  38. Sun, J.; Si, H.; Li, X.; Guo, Y. Measurement test and analysis on the restitution coefficient of the coarse cereals grain. J. Chin. Agric. Mech. 2020, 41, 88–93. [Google Scholar] [CrossRef]
  39. Wojtkowski, M.; Pecen, J.; Horabik, J.; Molenda, M. Rapeseed Impact Against a Flat Surface: Physical Testing and DEM Simulation with Two Contact Models. Powder Technol. 2010, 204, 196–206. [Google Scholar] [CrossRef]
  40. Guide to the Expression of Uncertainty in Measurement (GUM). ISO/IEC/OIML/BIPM, last ed. BIPM JCGM 100 2008. Available online: https://www.bipm.org/documents/20126/2071204/JCGM_100_2008_E.pdf (accessed on 30 December 2024).
  41. Janiczek, R. Metody Oceny Niepewności Pomiarów; Pracownia Komputerowa Jacka Skalmierskiego: Katowice, Poland; Gliwice, Poland, 2008. [Google Scholar]
  42. Tahereh, N.; Heydari, M.M.; Meda, V. Combination of germination and innovative microwave-assisted infrared drying of lentils: Effect of physicochemical properties of different varieties on water uptake, germination, and drying kinetics. Appl. Food Res. 2022, 2, 100040. [Google Scholar] [CrossRef]
  43. Alizadeh, E.; Bertrand, F.; Chaouki, J. Development of a granular normal contact force model based on a non- Newtonian liquid filled dashpot. Powder Technol. 2013, 237, 202–212. [Google Scholar] [CrossRef]
  44. Oomah, B.D.; Ward, S.; Balasubramanian, P. Dehulling and selected physical characteristics of Canadian dry bean (Phaseolus vulgaris L.) cultivars. Food Res. Int. 2010, 43, 1410–1415. [Google Scholar] [CrossRef]
  45. Segler, G. Pneumatic Grain Conveying; National Institute of Agricultural Engineering: Silsoe, UK, 1951. [Google Scholar]
  46. Gierz, Ł.; Kęska, W.; Gierz, S. Badania laboratoryjne czasu transportu ziarna pszenicy w przewodzie nasiennym siewnika. J. Res. Appl. Agric. Eng. 2012, 57, 37–40. [Google Scholar]
  47. Gierz, Ł.; Kęska, W. Badania symulacyjne i laboratoryjne czasu transportu ziarna rzepaku w przewodzie nasiennym siewnika. J. Res. Appl. Agric. Eng. 2012, 57, 73–78. [Google Scholar]
  48. Li, X.F.; Liu, F.; Zhao, M.Q. Determination of contact parameters between maize seeds and seeders. J. Agric. Mech. Res. 2018, 40, 149–153. [Google Scholar]
  49. Kong, F.T.; Shi, L.; Zhang, Y.T. Determination and analysis of recovery coefficient in seed cotton collision model. China Agric. Sci. Technol. Rev. 2019, 21, 92–99. [Google Scholar]
  50. Zhang, Y.; Liu, F.; Zhao, M.Q. Experimental study on Physical and mechanical characteristics of Mung bean. J. Agric. Mech. Res. 2017, 39, 119–124. [Google Scholar]
Figure 1. Wheat grain [7].
Applsci 15 06055 g001
Figure 2. Contact phases in a grain–plate collision: (a) initial contact; (b) deformation until relative motion ceases; (c) end of contact [7].
Applsci 15 06055 g002
Figure 3. Force–time relationship for different material characteristics (adapted from [4,7]).
Applsci 15 06055 g003
Figure 4. Impulse force zones [7].
Applsci 15 06055 g004
Figure 5. Grain impact test stand [7].
Applsci 15 06055 g005
Figure 6. Selected grain orientations during flight and collision with the force-sensor surface: (a) angular; (b) perpendicular; (c) parallel [7].
Applsci 15 06055 g006
Figure 7. Example force–time profiles for collisions with angular grain orientations: (a) rotating grain, case 1; (b) rotating grain, case 2 [7].
Applsci 15 06055 g007
Figure 8. Identification of geometric features: (a) measurement plate; (b) software interface for grain-geometry measurement [7].
Applsci 15 06055 g008
Figure 9. Grain velocity versus air velocity in pneumatic ducts [7].
Applsci 15 06055 g009
Figure 10. Collision-force F c t profiles for wheat grains at moisture levels (a) 7%, (b) 10%, (c) 13% and (d) 16% [7].
Applsci 15 06055 g010
Figure 11. Maximum collision force versus impact velocity for wheat grains at different moisture levels: (a) 7%, (b) 10%, (c) 13% and (d) 16% [7].
Applsci 15 06055 g011
Figure 12. Relationship between maximum contact force F c _ m a x and contact time ( t ) at different moisture levels: (a) 7%, (b) 10%, (c) 13% and (d) 16% [7].
Applsci 15 06055 g012
Figure 13. Approximation of the measurement data.
Applsci 15 06055 g013
Figure 14. Coefficient of restitution (CoR) as a function of collision velocity [7] at different moisture levels: (a) 7%, (b) 10%, (c) 13% and (d) 16%.
Applsci 15 06055 g014
Disclaimer/Publisher’s Note: The statements, opinions and data contained in all publications are solely those of the individual author(s) and contributor(s) and not of MDPI and/or the editor(s). MDPI and/or the editor(s) disclaim responsibility for any injury to people or property resulting from any ideas, methods, instructions or products referred to in the content.

