
Dynamic Ensemble Selection for EEG Signal Classification in Distributed Data Environments


Abstract
1. Introduction
- A comprehensive ensemble framework that supports EEG classification with dispersed data without centralized access.
- A novel coalition-based dynamic model selection mechanism using conflict metrics.
- An in-depth evaluation across multiple dispersion scenarios with various base classifiers.
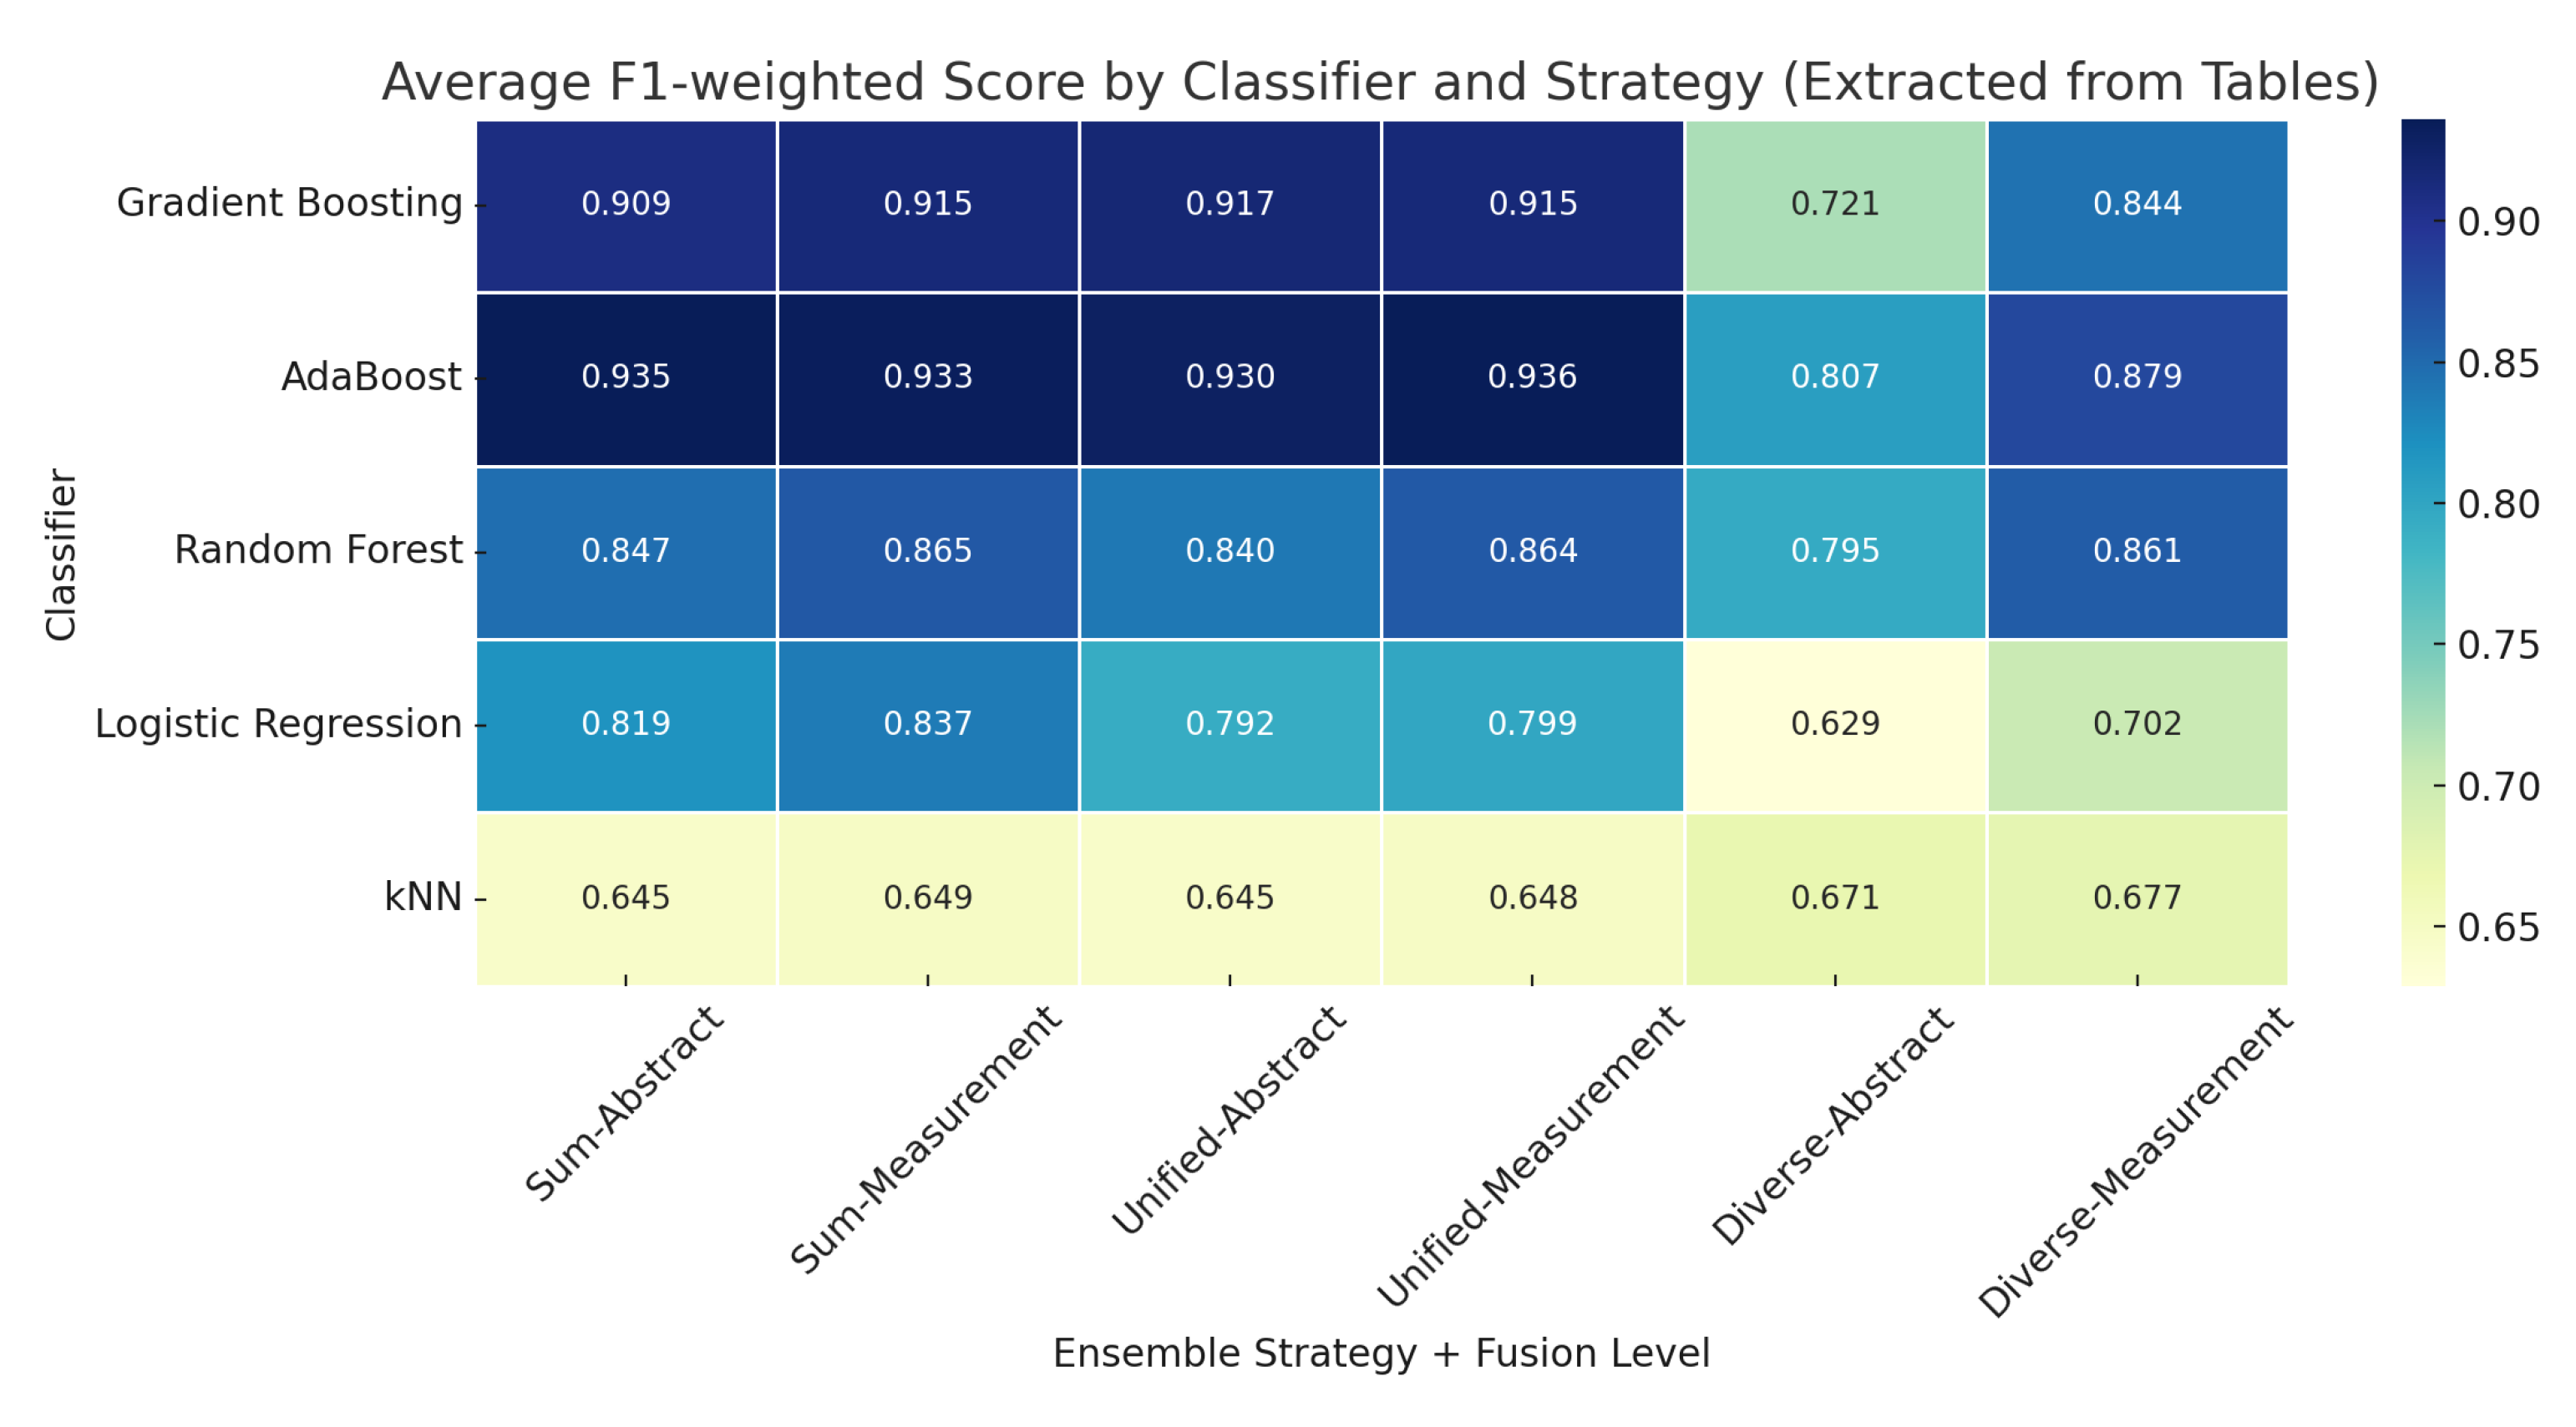
- Empirical evidence showing that unified coalitions with measurement-level fusion achieve good performance, particularly with Gradient Boosting models.
2. Materials and Methods
- Unified coalitions, where for all pairs in the group, capturing groups of models that largely agree.
- Diverse coalitions, where , representing models with significantly differing perspectives.
- Measurement-level fusion: All prediction vectors from coalition members are summed. The final class is the one with the highest aggregated score.
- Abstract-level fusion: A simple majority vote is conducted among coalition members, based on their most confident class prediction.
3. Datasets and Experimental Results
- Statistical features: mean, variance, skewness, kurtosis, root mean square (RMS), and zero crossings.
- Spectral power features: delta, theta, alpha, beta, gamma, and total power.
- Wavelet-based features: for decomposition levels 0 to 4, the mean, variance, skewness, and kurtosis of the wavelet coefficients were computed.
- Abstract level, sum: Each local classifier (Random Forest, AdaBoost, Gradient Boosting, k-Nearest Neighbours, and Logistic Regression) makes an independent prediction, one decision class. The final decision is the result of majority voting.
- Probability level, sum: Each local classifier makes an independent prediction. The resulting probability vectors are summed element-wise, and the class with the highest aggregated score is selected as the final decision.
- Unified groups, abstract level: Models are grouped using compliance coalition formation. One strongest coalition makes the final decision by voting.
- Diverse groups, abstract level: Models are grouped using diversified coalition formation. One strongest coalition makes the final decision by voting.
- Unified groups, measurement level: Models are grouped using compliance coalition formation. One strongest coalition prediction vectors are summed. The final class is the one with the highest aggregated score.
- Diverse groups, measurement level: Models are grouped using diversified coalition formation. One strongest coalition prediction vectors are summed. The final class is the one with the highest aggregated score.
- Random Forest: The number of estimators (n_estimators) was varied among . Two splitting criteria were evaluated: gini and entropy. The maximum depth of trees was fixed at max_depth = 6, while the minimum number of samples required to split an internal node (min_samples_split) was tested with values .
- AdaBoost: The ensemble size was controlled by varying n_estimators in . Two boosting algorithms were considered: SAMME and SAMME.R. Additionally, the learning_rate parameter was evaluated with values to control the contribution of each weak learner.
- Gradient Boosting: The number of boosting stages (n_estimators) was set to values among , with the learning_rate adjusted across . The maximum depth of each individual regression estimator (max_depth) was varied within .
- Logistic Regression: The following solvers were evaluated: lbfgs, liblinear, sag, saga, and newton-cg. The class_weight parameter was set either to balanced or none to assess the impact of handling class imbalance. Regularization was controlled via the penalty parameter, which was tested with values l1, l2, and None.
4. Discussion
5. Conclusions
- Coalition-based ensemble models outperform traditional voting approaches.
- Measurement-level prediction aggregation preserves more discriminative information than abstract label-level fusion.
- Boosting methods (Gradient Boosting, AdaBoost) are suitable for decentralized EEG classification tasks.
Author Contributions
Funding
Institutional Review Board Statement
Informed Consent Statement
Data Availability Statement
Conflicts of Interest
References
- Rieke, N.; Hancox, J.; Li, W.; Milletari, F.; Roth, H.R.; Albarqouni, S.; Bakas, S.; Galtier, M.N.; Landman, B.A.; Maier-Hein, K.; et al. The future of digital health with federated learning. NPJ Digit. Med. 2020, 3, 119. [Google Scholar] [CrossRef] [PubMed]
- Roy, Y.; Banville, H.; Albuquerque, I.; Gramfort, A.; Falk, T.H.; Faubert, J. Deep learning-based electroencephalography analysis: A systematic review. J. Neural Eng. 2019, 16, 051001. [Google Scholar] [CrossRef] [PubMed]
- World Health Organization. Available online: https://www.who.int/news-room/fact-sheets/detail/epilepsy (accessed on 17 May 2025).
- Acharya, U.R.; Oh, S.L.; Hagiwara, Y.; Tan, J.H.; Adeli, H.; Subha, D.P. Automated EEG-based screening of depression using deep convolutional neural network. Comput. Methods Programs Biomed. 2018, 161, 103–113. [Google Scholar] [CrossRef]
- Pękala, B.; Szkoła, J.; Grochowalski, P.; Gil, D.; Kosior, D.; Dyczkowski, K. A Novel Method for Human Fall Detection Using Federated Learning and Interval-Valued Fuzzy Inference Systems. J. Artif. Intell. Soft Comput. Res. 2025, 15, 77–90. [Google Scholar] [CrossRef]
- Zhang, Z.; Li, P.; Al Hammadi, A.Y.; Guo, F.; Damiani, E.; Yeun, C.Y. Reputation-based federated learning defense to mitigate threats in EEG signal classification. In Proceedings of the 2024 16th International Conference on Computer and Automation Engineering (ICCAE), Melbourne, Australia, 14–16 March 2024; IEEE: Piscataway Township, NJ, USA, 2024; pp. 173–180. [Google Scholar]
- Burduk, R.; Biedrzycki, J. Subspace-based decision trees integration. Inf. Sci. 2022, 592, 215–226. [Google Scholar] [CrossRef]
- Cano, A.; Krawczyk, B. ROSE: Robust online self-adjusting ensemble for continual learning on imbalanced drifting data streams. Mach. Learn. 2022, 111, 2561–2599. [Google Scholar] [CrossRef]
- Ruszczak, B.; Rudnik, K. Ensemble-based versus expert-assisted approach to carbon price features selection. In Proceedings of the FedCSIS (Communication Papers), Warsaw, Poland, 17–20 September 2023; pp. 245–250. [Google Scholar]
- Singer, G.; Ratnovsky, A.; Naftali, S. Classification of severity of trachea stenosis from EEG signals using ordinal decision-tree based algorithms and ensemble-based ordinal and non-ordinal algorithms. Expert Syst. Appl. 2021, 173, 114707. [Google Scholar] [CrossRef]
- Dura, A.; Wosiak, A.; Stasiak, B.; Wojciechowski, A.; Rogowski, J. Reversed correlation-based pairwised EEG channel selection in emotional state recognition. In International Conference on Computational Science; Springer International Publishing: Cham, Switzerland, 2021; pp. 528–541. [Google Scholar]
- Kołodziej, M.; Majkowski, A.; Rysz, A. Implementation of machine learning and deep learning techniques for the detection of epileptic seizures using intracranial electroencephalography. Appl. Sci. 2023, 13, 8747. [Google Scholar] [CrossRef]
- Krzywicka, M.; Wosiak, A. Efficacy of feature selection and Classification algorithms in cancer remission using medical imaging. Procedia Comput. Sci. 2024, 246, 4572–4581. [Google Scholar] [CrossRef]
- Huang, Z.; Yang, Y.; Ma, Y.; Dong, Q.; Su, J.; Shi, H.; Zhang, S.; Hu, L. EEG detection and recognition model for epilepsy based on dual attention mechanism. Sci. Rep. 2025, 15, 9404. [Google Scholar] [CrossRef]
- Medhi, K.; Hoque, N.; Dutta, S.K.; Hussain, M.I. An efficient EEG signal classification technique for Brain–Computer Interface using hybrid Deep Learning. Biomed. Signal Process. Control 2022, 78, 104005. [Google Scholar] [CrossRef]
- Gosala, B.; Kapgate, P.D.; Jain, P.; Chaurasia, R.N.; Gupta, M. Wavelet transforms for feature engineering in EEG data processing: An application on Schizophrenia. Biomed. Signal Process. Control 2023, 85, 104811. [Google Scholar] [CrossRef]
- Lalawat, R.S.; Bajaj, V. Optimal variational mode decomposition based automatic stress classification system using EEG signals. Appl. Acoust. 2025, 231, 110478. [Google Scholar] [CrossRef]
- Marfo, K.F.; Przybyła-Kasperek, M. Exploring the Impact of Object Diversity on Classification Quality in Dispersed Data Environments. In Intelligent Information and Database Systems; Nguyen, N.T., Chbeir, R., Manolopoulos, Y., Fujita, H., Hong, T.-P., Nguyen, L.M., Wojtkiewicz, K., Eds.; ACIIDS 2024 Lecture Notes in Computer Science; Springer: Singapore, 2024; Volume 14796. [Google Scholar]
- Przybyła-Kasperek, M.; Sacewicz, J. Ensembles of random trees with coalitions-a classification model for dispersed data. Procedia Comput. Sci. 2024, 246, 1599–1608. [Google Scholar] [CrossRef]
- Przybyła-Kasperek, M.; Kusztal, K.; Addo, B.A. Dispersed Data Classification Model with Conflict Analysis and Parameterized Allied Relations. Procedia Comput. Sci. 2024, 246, 2215–2224. [Google Scholar] [CrossRef]
- Sarnovsky, M.; Kolarik, M. Classification of the drifting data streams using heterogeneous diversified dynamic class-weighted ensemble. PeerJ Comput. Sci. 2021, 7, e459. [Google Scholar] [CrossRef]
- Zyblewski, P.; Sabourin, R.; Woźniak, M. Preprocessed dynamic classifier ensemble selection for highly imbalanced drifted data streams. Inf. Fusion 2021, 66, 138–154. [Google Scholar] [CrossRef]
- Swami, P.; Gandhi, T.; Panigrahi, B.K.; Tripathi, M.; Anand, S. A novel robust diagnostic model to detect seizures in electroencephalography. Expert Syst. Appl. 2016, 56, 116–130. [Google Scholar] [CrossRef]
- Blankertz, B.; Dornhege, G.; Krauledat, M.; Müller, K.R.; Curio, G. The non-invasive Berlin Brain-Computer Interface: Fast acquisition of effective performance in untrained subjects. NeuroImage 2007, 37, 539–550. [Google Scholar] [CrossRef]
- Lawhern, V.J.; Solon, A.J.; Waytowich, N.R.; Gordon, S.M.; Hung, C.P.; Lance, B.J. EEGNet: A compact convolutional neural network for EEG-based brain–computer interfaces. J. Neural Eng. 2018, 15, 056013. [Google Scholar] [CrossRef]
- Ancora, L.A.; Blanco-Mora, D.A.; Alves, I.; Bonifácio, A.; Morgado, P.; Miranda, B. Cities and neuroscience research: A systematic literature review. Front. Psychiatry 2022, 13, 983352. [Google Scholar] [CrossRef] [PubMed]
- Gerner, N.; Pickerle, D.; Höller, Y.; Hartl, A. Neurophysiological Markers of Design-Induced Cognitive Changes: A Feasibility Study with Consumer-Grade Mobile EEG. Brain Sci. 2025, 15, 432. [Google Scholar] [CrossRef]
- He, C.; Chen, Y.Y.; Phang, C.R.; Stevenson, C.; Chen, I.P.; Jung, T.P.; Ko, L.W. Diversity and suitability of the state-of-the-art wearable and wireless EEG systems review. IEEE J. Biomed. Health Inform. 2023, 27, 3830–3843. [Google Scholar] [CrossRef] [PubMed]

| No. of Tables | Method/Model | F1 | F1 | ||||
|---|---|---|---|---|---|---|---|
| Prec. | Recall | (Weig.) | (Macro) | BAacc | Acc | ||
| 3LT | Abstract level; sum; RF (100,gini) | 0.903 | 0.893 | 0.892 | 0.892 | 0.893 | 0.893 |
| Measurement level; sum; RF (200,entropy) | 0.94 | 0.927 | 0.926 | 0.926 | 0.927 | 0.927 | |
| Unified groups; abstract level; RF (100,gini) | 0.903 | 0.893 | 0.892 | 0.892 | 0.893 | 0.893 | |
| Diverse groups; abstract level; RF (100,gini) | 0.903 | 0.893 | 0.892 | 0.892 | 0.893 | 0.893 | |
| Unified groups; measurement level; RF (200,entropy) | 0.94 | 0.927 | 0.926 | 0.926 | 0.927 | 0.927 | |
| Diverse groups; measurement level; RF (200,entropy) | 0.94 | 0.927 | 0.926 | 0.926 | 0.927 | 0.927 | |
| Abstract level; sum; kNN (2) | 0.779 | 0.76 | 0.762 | 0.762 | 0.76 | 0.76 | |
| Measurement level; sum; kNN (2) | 0.746 | 0.727 | 0.723 | 0.723 | 0.727 | 0.727 | |
| Unified groups; abstract level; kNN (2) | 0.779 | 0.76 | 0.762 | 0.762 | 0.76 | 0.76 | |
| Diverse groups; abstract level; kNN (2) | 0.75 | 0.72 | 0.717 | 0.717 | 0.72 | 0.72 | |
| Unified groups; measurement level; kNN (2) | 0.736 | 0.72 | 0.721 | 0.721 | 0.72 | 0.72 | |
| Diverse groups; measurement level; kNN (2) | 0.712 | 0.68 | 0.683 | 0.683 | 0.68 | 0.68 | |
| Abstract level; sum; AdaBoost (50) | 0.946 | 0.933 | 0.932 | 0.932 | 0.933 | 0.933 | |
| Measurement level; sum; AdaBoost (50) | 0.946 | 0.933 | 0.932 | 0.932 | 0.933 | 0.933 | |
| Unified groups; abstract level; AdaBoost (50) | 0.946 | 0.933 | 0.932 | 0.932 | 0.933 | 0.933 | |
| Diverse groups; abstract level; AdaBoost (50) | 0.938 | 0.927 | 0.926 | 0.926 | 0.927 | 0.927 | |
| Unified groups; measurement level; AdaBoost (50) | 0.946 | 0.933 | 0.932 | 0.932 | 0.933 | 0.933 | |
| Diverse groups; measurement level; AdaBoost (50) | 0.946 | 0.933 | 0.932 | 0.932 | 0.933 | 0.933 | |
| Abstract level; sum; Gradient Boosting (100) | 0.972 | 0.967 | 0.966 | 0.966 | 0.967 | 0.967 | |
| Measurement level; sum; Gradient Boosting (50) | 0.961 | 0.953 | 0.953 | 0.953 | 0.953 | 0.953 | |
| Unified groups; abstract level; Gradient Boosting (50) | 0.983 | 0.98 | 0.98 | 0.98 | 0.98 | 0.98 | |
| Diverse groups; abstract level; Gradient Boosting (50) | 0.839 | 0.827 | 0.823 | 0.823 | 0.827 | 0.827 | |
| Unified groups; measurement level; Gradient Boosting (50) | 0.961 | 0.953 | 0.953 | 0.953 | 0.953 | 0.953 | |
| Diverse groups; measurement level; Gradient Boosting (200) | 0.902 | 0.893 | 0.892 | 0.892 | 0.893 | 0.893 | |
| Abstract level; sum; Logistic Regression | 0.878 | 0.873 | 0.874 | 0.874 | 0.873 | 0.873 | |
| Measurement level; sum; Logistic Regression | 0.899 | 0.893 | 0.893 | 0.893 | 0.893 | 0.893 | |
| Unified groups; abstract level; Logistic Regression | 0.878 | 0.873 | 0.874 | 0.874 | 0.873 | 0.873 | |
| Diverse groups; abstract level; Logistic Regression | 0.832 | 0.807 | 0.809 | 0.809 | 0.807 | 0.807 | |
| Unified groups; measurement level; Logistic Regression | 0.899 | 0.893 | 0.893 | 0.893 | 0.893 | 0.893 | |
| Diverse groups; measurement level; Logistic Regression | 0.87 | 0.853 | 0.855 | 0.855 | 0.853 | 0.853 | |
| 5LT | Abstract level; sum; RF (10,entropy) | 0.909 | 0.867 | 0.856 | 0.856 | 0.867 | 0.867 |
| Measurement level; sum; RF (10,gini) | 0.918 | 0.887 | 0.882 | 0.882 | 0.887 | 0.887 | |
| Unified groups; abstract level; RF (10,entropy) | 0.909 | 0.867 | 0.856 | 0.856 | 0.867 | 0.867 | |
| Diverse groups; abstract level; RF (20,gini) | 0.866 | 0.82 | 0.807 | 0.807 | 0.82 | 0.82 | |
| Unified groups; measurement level; RF (10,entropy) | 0.919 | 0.887 | 0.881 | 0.881 | 0.887 | 0.887 | |
| Diverse groups; measurement level; RF (50,gini) | 0.9 | 0.867 | 0.86 | 0.86 | 0.867 | 0.867 | |
| Abstract level; sum; kNN (2) | 0.719 | 0.68 | 0.688 | 0.688 | 0.68 | 0.68 | |
| Measurement level; sum; kNN (4) | 0.715 | 0.673 | 0.681 | 0.681 | 0.673 | 0.673 | |
| Unified groups; abstract level; kNN (2) | 0.719 | 0.68 | 0.688 | 0.688 | 0.68 | 0.68 | |
| Diverse groups; abstract level; kNN (4) | 0.743 | 0.72 | 0.722 | 0.722 | 0.72 | 0.72 | |
| Unified groups; measurement level; kNN (4) | 0.715 | 0.673 | 0.681 | 0.681 | 0.673 | 0.673 | |
| Diverse groups; measurement level; kNN (2) | 0.705 | 0.673 | 0.663 | 0.663 | 0.673 | 0.673 | |
| Abstract level; sum; AdaBoost (20) | 0.957 | 0.947 | 0.946 | 0.946 | 0.947 | 0.947 | |
| Measurement level; sum; AdaBoost (100) | 0.963 | 0.953 | 0.952 | 0.952 | 0.953 | 0.953 | |
| Unified groups; abstract level; AdaBoost (20) | 0.978 | 0.973 | 0.973 | 0.973 | 0.973 | 0.973 | |
| Diverse groups; abstract level; AdaBoost (10) | 0.897 | 0.88 | 0.879 | 0.879 | 0.88 | 0.88 | |
| Unified groups; measurement level; AdaBoost (20) | 0.972 | 0.967 | 0.966 | 0.966 | 0.967 | 0.967 | |
| Diverse groups; measurement level; AdaBoost (20) | 0.91 | 0.893 | 0.891 | 0.891 | 0.893 | 0.893 | |
| Abstract level; sum; Gradient Boosting (10) | 0.899 | 0.867 | 0.857 | 0.857 | 0.867 | 0.867 | |
| Measurement level; sum; Gradient Boosting (10) | 0.907 | 0.893 | 0.892 | 0.892 | 0.893 | 0.893 | |
| Unified groups; abstract level; Gradient Boosting (200) | 0.9 | 0.887 | 0.884 | 0.884 | 0.887 | 0.887 | |
| Diverse groups; abstract level; Gradient Boosting (200) | 0.77 | 0.74 | 0.743 | 0.743 | 0.74 | 0.74 | |
| Unified groups; measurement level; Gradient Boosting (10) | 0.907 | 0.893 | 0.892 | 0.892 | 0.893 | 0.893 | |
| Diverse groups; measurement level; Gradient Boosting (10) | 0.878 | 0.86 | 0.859 | 0.859 | 0.86 | 0.86 | |
| Abstract level; sum; Logistic Regression | 0.9 | 0.86 | 0.86 | 0.86 | 0.86 | 0.86 | |
| Measurement level; sum; Logistic Regression | 0.927 | 0.9 | 0.9 | 0.9 | 0.9 | 0.9 | |
| Unified groups; abstract level; Logistic Regression | 0.874 | 0.84 | 0.836 | 0.836 | 0.84 | 0.84 | |
| Diverse groups; abstract level; Logistic Regression | 0.762 | 0.7 | 0.697 | 0.697 | 0.7 | 0.7 | |
| Unified groups; measurement level; Logistic Regression | 0.842 | 0.827 | 0.816 | 0.816 | 0.827 | 0.827 | |
| Diverse groups; measurement level; Logistic Regression | 0.874 | 0.847 | 0.847 | 0.847 | 0.847 | 0.847 | |
| 7LT | Abstract level; sum; RF (20,gini) | 0.853 | 0.827 | 0.818 | 0.818 | 0.827 | 0.827 |
| Measurement level; sum; RF (20,entropy) | 0.913 | 0.88 | 0.875 | 0.875 | 0.88 | 0.88 | |
| Unified groups; abstract level; RF (10,gini) | 0.865 | 0.807 | 0.789 | 0.789 | 0.807 | 0.807 | |
| Diverse groups; abstract level; RF (200,entropy) | 0.778 | 0.76 | 0.753 | 0.753 | 0.76 | 0.76 | |
| Unified groups; measurement level; RF (100,entropy) | 0.907 | 0.867 | 0.859 | 0.859 | 0.867 | 0.867 | |
| Diverse groups; measurement level; RF (20,entropy) | 0.915 | 0.887 | 0.881 | 0.881 | 0.887 | 0.887 | |
| Abstract level; sum; kNN (3) | 0.619 | 0.58 | 0.582 | 0.582 | 0.58 | 0.58 | |
| Measurement level; sum; kNN (3) | 0.66 | 0.647 | 0.613 | 0.613 | 0.647 | 0.647 | |
| Unified groups; abstract level; kNN (3) | 0.619 | 0.58 | 0.582 | 0.582 | 0.58 | 0.58 | |
| Diverse groups; abstract level; kNN (5) | 0.663 | 0.633 | 0.595 | 0.595 | 0.633 | 0.633 | |
| Unified groups; measurement level; kNN (3) | 0.66 | 0.647 | 0.613 | 0.613 | 0.647 | 0.647 | |
| Diverse groups; measurement level; kNN (3) | 0.707 | 0.687 | 0.664 | 0.664 | 0.687 | 0.687 | |
| Abstract level; sum; AdaBoost (100) | 0.952 | 0.94 | 0.939 | 0.939 | 0.94 | 0.94 | |
| Measurement level; sum; AdaBoost (50) | 0.952 | 0.94 | 0.939 | 0.939 | 0.94 | 0.94 | |
| Unified groups; abstract level; AdaBoost (20) | 0.956 | 0.94 | 0.939 | 0.939 | 0.94 | 0.94 | |
| Diverse groups; abstract level; AdaBoost (100) | 0.899 | 0.88 | 0.878 | 0.878 | 0.88 | 0.88 | |
| Unified groups; measurement level; AdaBoost (20) | 0.957 | 0.947 | 0.945 | 0.945 | 0.947 | 0.947 | |
| Diverse groups; measurement level; AdaBoost (100) | 0.967 | 0.96 | 0.959 | 0.959 | 0.96 | 0.96 | |
| Abstract level; sum; Gradient Boosting (10) | 0.952 | 0.94 | 0.938 | 0.938 | 0.94 | 0.94 | |
| Measurement level; sum; Gradient Boosting (100) | 0.967 | 0.96 | 0.959 | 0.959 | 0.96 | 0.96 | |
| Unified groups; abstract level; Gradient Boosting (10) | 0.944 | 0.933 | 0.931 | 0.931 | 0.933 | 0.933 | |
| Diverse groups; abstract level; Gradient Boosting (200) | 0.76 | 0.733 | 0.717 | 0.717 | 0.733 | 0.733 | |
| Unified groups; measurement level; Gradient Boosting (100) | 0.963 | 0.953 | 0.95 | 0.95 | 0.953 | 0.953 | |
| Diverse groups; measurement level; Gradient Boosting (200) | 0.899 | 0.887 | 0.882 | 0.882 | 0.887 | 0.887 | |
| Abstract level; sum; Logistic Regression | 0.923 | 0.893 | 0.888 | 0.888 | 0.893 | 0.893 | |
| Measurement level; sum; Logistic Regression | 0.923 | 0.893 | 0.888 | 0.888 | 0.893 | 0.893 | |
| Unified groups; abstract level; Logistic Regression | 0.841 | 0.833 | 0.83 | 0.83 | 0.833 | 0.833 | |
| Diverse groups; abstract level; Logistic Regression | 0.663 | 0.593 | 0.574 | 0.574 | 0.593 | 0.593 | |
| Unified groups; measurement level; Logistic Regression | 0.865 | 0.86 | 0.858 | 0.858 | 0.86 | 0.86 | |
| Diverse groups; measurement level; Logistic Regression | 0.734 | 0.66 | 0.652 | 0.652 | 0.66 | 0.66 |
| No. of Tables | Method/Model | F1 | F1 | ||||
|---|---|---|---|---|---|---|---|
| Prec. | Recall | (Weig.) | (Macro) | BAacc | Acc | ||
| 9LT | Abstract level; sum; RF (200,gini) | 0.918 | 0.887 | 0.882 | 0.882 | 0.887 | 0.887 |
| Measurement level; sum; RF (20,gini) | 0.906 | 0.86 | 0.85 | 0.85 | 0.86 | 0.86 | |
| Unified groups; abstract level; RF (200,gini) | 0.918 | 0.887 | 0.882 | 0.882 | 0.887 | 0.887 | |
| Diverse groups; abstract level; RF (200,gini) | 0.849 | 0.827 | 0.824 | 0.824 | 0.827 | 0.827 | |
| Unified groups; measurement level; RF (10,gini) | 0.907 | 0.867 | 0.859 | 0.859 | 0.867 | 0.867 | |
| Diverse groups; measurement level; RF (20,entropy) | 0.884 | 0.84 | 0.83 | 0.83 | 0.84 | 0.84 | |
| Abstract level; sum; kNN (6) | 0.707 | 0.687 | 0.664 | 0.664 | 0.687 | 0.687 | |
| Measurement level; sum; kNN (6) | 0.776 | 0.687 | 0.664 | 0.664 | 0.687 | 0.687 | |
| Unified groups; abstract level; kNN (6) | 0.707 | 0.687 | 0.664 | 0.664 | 0.687 | 0.687 | |
| Diverse groups; abstract level; kNN (6) | 0.788 | 0.727 | 0.681 | 0.681 | 0.727 | 0.727 | |
| Unified groups; measurement level; kNN (6) | 0.776 | 0.687 | 0.664 | 0.664 | 0.687 | 0.687 | |
| Diverse groups; measurement level; kNN (2) | 0.727 | 0.687 | 0.694 | 0.694 | 0.687 | 0.687 | |
| Abstract level; sum; AdaBoost (100) | 0.953 | 0.94 | 0.939 | 0.939 | 0.94 | 0.94 | |
| Measurement level; sum; AdaBoost (50) | 0.934 | 0.927 | 0.926 | 0.926 | 0.927 | 0.927 | |
| Unified groups; abstract level; AdaBoost (50) | 0.938 | 0.927 | 0.926 | 0.926 | 0.927 | 0.927 | |
| Diverse groups; abstract level; AdaBoost (100) | 0.747 | 0.713 | 0.714 | 0.714 | 0.713 | 0.713 | |
| Unified groups; measurement level; AdaBoost (20) | 0.928 | 0.92 | 0.92 | 0.92 | 0.92 | 0.92 | |
| Diverse groups; measurement level; AdaBoost (10) | 0.912 | 0.893 | 0.892 | 0.892 | 0.893 | 0.893 | |
| Abstract level; sum; Gradient Boosting (10) | 0.967 | 0.96 | 0.959 | 0.959 | 0.96 | 0.96 | |
| Measurement level; sum; Gradient Boosting (10) | 0.964 | 0.953 | 0.952 | 0.952 | 0.953 | 0.953 | |
| Unified groups; abstract level; Gradient Boosting (10) | 0.985 | 0.98 | 0.98 | 0.98 | 0.98 | 0.98 | |
| Diverse groups; abstract level; Gradient Boosting (20) | 0.672 | 0.653 | 0.655 | 0.655 | 0.653 | 0.653 | |
| Unified groups; measurement level; Gradient Boosting (10) | 0.989 | 0.987 | 0.987 | 0.987 | 0.987 | 0.987 | |
| Diverse groups; measurement level; Gradient Boosting (100) | 0.763 | 0.733 | 0.738 | 0.738 | 0.733 | 0.733 | |
| Abstract level; sum; Logistic Regression | 0.782 | 0.767 | 0.765 | 0.765 | 0.767 | 0.767 | |
| Measurement level; sum; Logistic Regression | 0.791 | 0.78 | 0.776 | 0.776 | 0.78 | 0.78 | |
| Unified groups; abstract level; Logistic Regression | 0.771 | 0.74 | 0.742 | 0.742 | 0.74 | 0.74 | |
| Diverse groups; abstract level; Logistic Regression | 0.541 | 0.553 | 0.535 | 0.535 | 0.553 | 0.553 | |
| Unified groups; measurement level; Logistic Regression | 0.779 | 0.733 | 0.739 | 0.739 | 0.733 | 0.733 | |
| Diverse groups; measurement level; Logistic Regression | 0.712 | 0.58 | 0.577 | 0.577 | 0.58 | 0.58 | |
| 11LT | Abstract level; sum; RF (100,entropy) | 0.879 | 0.807 | 0.787 | 0.787 | 0.807 | 0.807 |
| Measurement level; sum; RF (10,gini) | 0.882 | 0.82 | 0.793 | 0.793 | 0.82 | 0.82 | |
| Unified groups; abstract level; RF (200,gini) | 0.861 | 0.8 | 0.78 | 0.78 | 0.8 | 0.8 | |
| Diverse groups; abstract level; RF (20,gini) | 0.749 | 0.713 | 0.698 | 0.698 | 0.713 | 0.713 | |
| Unified groups; measurement level; RF (100,gini) | 0.882 | 0.813 | 0.795 | 0.795 | 0.813 | 0.813 | |
| Diverse groups; measurement level; RF (100,entropy) | 0.889 | 0.827 | 0.81 | 0.81 | 0.827 | 0.827 | |
| Abstract level; sum; kNN (2) | 0.742 | 0.62 | 0.527 | 0.527 | 0.62 | 0.62 | |
| Measurement level; sum; kNN (5) | 0.594 | 0.613 | 0.563 | 0.563 | 0.613 | 0.613 | |
| Unified groups; abstract level; kNN (2) | 0.742 | 0.62 | 0.527 | 0.527 | 0.62 | 0.62 | |
| Diverse groups; abstract level; kNN (2) | 0.673 | 0.64 | 0.641 | 0.641 | 0.64 | 0.64 | |
| Unified groups; measurement level; kNN (5) | 0.594 | 0.613 | 0.563 | 0.563 | 0.613 | 0.613 | |
| Diverse groups; measurement level; kNN (3) | 0.818 | 0.707 | 0.679 | 0.679 | 0.707 | 0.707 | |
| Abstract level; sum; AdaBoost (50) | 0.924 | 0.92 | 0.92 | 0.92 | 0.92 | 0.92 | |
| Measurement level; sum; AdaBoost (100) | 0.938 | 0.92 | 0.918 | 0.918 | 0.92 | 0.92 | |
| Unified groups; abstract level; AdaBoost (50) | 0.89 | 0.88 | 0.879 | 0.879 | 0.88 | 0.88 | |
| Diverse groups; abstract level; AdaBoost (10) | 0.709 | 0.64 | 0.637 | 0.637 | 0.64 | 0.64 | |
| Unified groups; measurement level; AdaBoost (50) | 0.932 | 0.92 | 0.918 | 0.918 | 0.92 | 0.92 | |
| Diverse groups; measurement level; AdaBoost (20) | 0.786 | 0.74 | 0.721 | 0.721 | 0.74 | 0.74 | |
| Abstract level; sum; Gradient Boosting (10) | 0.87 | 0.833 | 0.825 | 0.825 | 0.833 | 0.833 | |
| Measurement level; sum; Gradient Boosting (20) | 0.853 | 0.827 | 0.82 | 0.82 | 0.827 | 0.827 | |
| Unified groups; abstract level; Gradient Boosting (10) | 0.844 | 0.82 | 0.811 | 0.811 | 0.82 | 0.82 | |
| Diverse groups; abstract level; Gradient Boosting (10) | 0.685 | 0.673 | 0.665 | 0.665 | 0.673 | 0.673 | |
| Unified groups; measurement level; Gradient Boosting (20) | 0.813 | 0.8 | 0.793 | 0.793 | 0.8 | 0.8 | |
| Diverse groups; measurement level; Gradient Boosting (20) | 0.86 | 0.853 | 0.851 | 0.851 | 0.853 | 0.853 | |
| Abstract level; sum; Logistic Regression | 0.799 | 0.727 | 0.71 | 0.71 | 0.727 | 0.727 | |
| Measurement level; sum; Logistic Regression | 0.809 | 0.74 | 0.729 | 0.729 | 0.74 | 0.74 | |
| Unified groups; abstract level; Logistic Regression | 0.765 | 0.687 | 0.68 | 0.68 | 0.687 | 0.687 | |
| Diverse groups; abstract level; Logistic Regression | 0.585 | 0.54 | 0.529 | 0.529 | 0.54 | 0.54 | |
| Unified groups; measurement level; Logistic Regression | 0.777 | 0.707 | 0.687 | 0.687 | 0.707 | 0.707 | |
| Diverse groups; measurement level; Logistic Regression | 0.618 | 0.58 | 0.581 | 0.581 | 0.58 | 0.58 |
| No. of Tables | Method/Model | F1 | F1 | ||||
|---|---|---|---|---|---|---|---|
| Prec. | Recall | (Weig.) | (Macro) | BAacc | Acc | ||
| 3LT | Abstract level; sum; RF (10,gini) | 0.533 | 0.533 | 0.532 | 0.532 | 0.533 | 0.533 |
| Measurement level; sum; RF (50,entropy) | 0.52 | 0.519 | 0.518 | 0.518 | 0.519 | 0.519 | |
| Unified groups; abstract level; RF (10,gini) | 0.533 | 0.533 | 0.532 | 0.532 | 0.533 | 0.533 | |
| Diverse groups; abstract level; RF (10,entropy) | 0.523 | 0.523 | 0.522 | 0.522 | 0.523 | 0.523 | |
| Unified groups; measurement level; RF (50,entropy) | 0.52 | 0.519 | 0.518 | 0.518 | 0.519 | 0.519 | |
| Diverse groups; measurement level; RF (50,gini) | 0.521 | 0.52 | 0.518 | 0.518 | 0.52 | 0.52 | |
| Abstract level; sum; kNN (2) | 0.467 | 0.484 | 0.408 | 0.408 | 0.484 | 0.484 | |
| Measurement level; sum; kNN (4) | 0.473 | 0.474 | 0.466 | 0.466 | 0.474 | 0.474 | |
| Unified groups; abstract level; kNN (2) | 0.467 | 0.484 | 0.408 | 0.408 | 0.484 | 0.484 | |
| Diverse groups; abstract level; kNN (2) | 0.528 | 0.519 | 0.478 | 0.478 | 0.519 | 0.519 | |
| Unified groups; measurement level; kNN (4) | 0.468 | 0.468 | 0.467 | 0.467 | 0.468 | 0.468 | |
| Diverse groups; measurement level; kNN (4) | 0.483 | 0.484 | 0.483 | 0.483 | 0.484 | 0.484 | |
| Abstract level; sum; AdaBoost (10) | 0.574 | 0.571 | 0.566 | 0.566 | 0.571 | 0.571 | |
| Measurement level; sum; AdaBoost (200) | 0.582 | 0.58 | 0.578 | 0.578 | 0.58 | 0.58 | |
| Unified groups; abstract level; AdaBoost (10) | 0.574 | 0.571 | 0.566 | 0.566 | 0.571 | 0.571 | |
| Diverse groups; abstract level; AdaBoost (10) | 0.555 | 0.554 | 0.553 | 0.553 | 0.554 | 0.554 | |
| Unified groups; measurement level; AdaBoost (200) | 0.582 | 0.58 | 0.578 | 0.578 | 0.58 | 0.58 | |
| Diverse groups; measurement level; AdaBoost (10) | 0.581 | 0.58 | 0.578 | 0.578 | 0.58 | 0.58 | |
| Abstract level; sum; Gradient Boosting (20) | 0.586 | 0.586 | 0.585 | 0.585 | 0.586 | 0.586 | |
| Measurement level; sum; Gradient Boosting (20) | 0.561 | 0.56 | 0.559 | 0.559 | 0.56 | 0.56 | |
| Unified groups; abstract level; Gradient Boosting (20) | 0.586 | 0.586 | 0.585 | 0.585 | 0.586 | 0.586 | |
| Diverse groups; abstract level; Gradient Boosting (20) | 0.556 | 0.555 | 0.554 | 0.554 | 0.555 | 0.555 | |
| Unified groups; measurement level; Gradient Boosting (20) | 0.561 | 0.56 | 0.559 | 0.559 | 0.56 | 0.56 | |
| Diverse groups; measurement level; Gradient Boosting (200) | 0.558 | 0.556 | 0.554 | 0.554 | 0.556 | 0.556 | |
| Abstract level; sum; Logistic Regression | 0.537 | 0.536 | 0.536 | 0.536 | 0.536 | 0.536 | |
| Measurement level; sum; Logistic Regression | 0.519 | 0.519 | 0.519 | 0.519 | 0.519 | 0.519 | |
| Unified groups; abstract level; Logistic Regression | 0.537 | 0.536 | 0.536 | 0.536 | 0.536 | 0.536 | |
| Diverse groups; abstract level; Logistic Regression | 0.542 | 0.542 | 0.541 | 0.541 | 0.542 | 0.542 | |
| Unified groups; measurement level; Logistic Regression | 0.519 | 0.519 | 0.519 | 0.519 | 0.519 | 0.519 | |
| Diverse groups; measurement level; Logistic Regression | 0.544 | 0.544 | 0.543 | 0.543 | 0.544 | 0.544 | |
| 5LT | Abstract level; sum; RF (10,entropy) | 0.506 | 0.506 | 0.504 | 0.504 | 0.506 | 0.506 |
| Measurement level; sum; RF (20,entropy) | 0.507 | 0.506 | 0.504 | 0.504 | 0.506 | 0.506 | |
| Unified groups; abstract level; RF (10,entropy) | 0.506 | 0.506 | 0.504 | 0.504 | 0.506 | 0.506 | |
| Diverse groups; abstract level; RF (100,entropy) | 0.53 | 0.53 | 0.529 | 0.529 | 0.53 | 0.53 | |
| Unified groups; measurement level; RF (20,entropy) | 0.507 | 0.506 | 0.504 | 0.504 | 0.506 | 0.506 | |
| Diverse groups; measurement level; RF (200,entropy) | 0.521 | 0.521 | 0.519 | 0.519 | 0.521 | 0.521 | |
| Abstract level; sum; kNN (2) | 0.421 | 0.476 | 0.368 | 0.368 | 0.476 | 0.476 | |
| Measurement level; sum; kNN (3) | 0.473 | 0.473 | 0.472 | 0.472 | 0.473 | 0.473 | |
| Unified groups; abstract level; kNN (2) | 0.421 | 0.476 | 0.368 | 0.368 | 0.476 | 0.476 | |
| Diverse groups; abstract level; kNN (2) | 0.517 | 0.516 | 0.502 | 0.502 | 0.516 | 0.516 | |
| Unified groups; measurement level; kNN (3) | 0.473 | 0.473 | 0.472 | 0.472 | 0.473 | 0.473 | |
| Diverse groups; measurement level; kNN (6) | 0.501 | 0.501 | 0.5 | 0.5 | 0.501 | 0.501 | |
| Abstract level; sum; AdaBoost (200) | 0.568 | 0.567 | 0.566 | 0.566 | 0.567 | 0.567 | |
| Measurement level; sum; AdaBoost (20) | 0.582 | 0.581 | 0.581 | 0.581 | 0.581 | 0.581 | |
| Unified groups; abstract level; AdaBoost (200) | 0.568 | 0.567 | 0.566 | 0.566 | 0.567 | 0.567 | |
| Diverse groups; abstract level; AdaBoost (20) | 0.521 | 0.521 | 0.52 | 0.52 | 0.521 | 0.521 | |
| Unified groups; measurement level; AdaBoost (20) | 0.582 | 0.581 | 0.581 | 0.581 | 0.581 | 0.581 | |
| Diverse groups; measurement level; AdaBoost (20) | 0.584 | 0.584 | 0.583 | 0.583 | 0.584 | 0.584 | |
| Abstract level; sum; Gradient Boosting (20) | 0.557 | 0.556 | 0.555 | 0.555 | 0.556 | 0.556 | |
| Measurement level; sum; Gradient Boosting (10) | 0.559 | 0.557 | 0.554 | 0.554 | 0.557 | 0.557 | |
| Unified groups; abstract level; Gradient Boosting (20) | 0.557 | 0.556 | 0.555 | 0.555 | 0.556 | 0.556 | |
| Diverse groups; abstract level; Gradient Boosting (100) | 0.534 | 0.534 | 0.533 | 0.533 | 0.534 | 0.534 | |
| Unified groups; measurement level; Gradient Boosting (10) | 0.559 | 0.557 | 0.554 | 0.554 | 0.557 | 0.557 | |
| Diverse groups; measurement level; Gradient Boosting (50) | 0.555 | 0.555 | 0.555 | 0.555 | 0.555 | 0.555 | |
| Abstract level; sum; Logistic Regression | 0.508 | 0.508 | 0.506 | 0.506 | 0.508 | 0.508 | |
| Measurement level; sum; Logistic Regression | 0.513 | 0.513 | 0.513 | 0.513 | 0.513 | 0.513 | |
| Unified groups; abstract level; Logistic Regression | 0.508 | 0.508 | 0.506 | 0.506 | 0.508 | 0.508 | |
| Diverse groups; abstract level; Logistic Regression | 0.531 | 0.531 | 0.529 | 0.529 | 0.531 | 0.531 | |
| Unified groups; measurement level; Logistic Regression | 0.513 | 0.513 | 0.513 | 0.513 | 0.513 | 0.513 | |
| Diverse groups; measurement level; Logistic Regression | 0.555 | 0.555 | 0.555 | 0.555 | 0.555 | 0.555 | |
| 7LT | Abstract level; sum; RF (50,entropy) | 0.521 | 0.521 | 0.52 | 0.52 | 0.521 | 0.521 |
| Measurement level; sum; RF (10,gini) | 0.511 | 0.511 | 0.51 | 0.51 | 0.511 | 0.511 | |
| Unified groups; abstract level; RF (50,entropy) | 0.521 | 0.521 | 0.52 | 0.52 | 0.521 | 0.521 | |
| Diverse groups; abstract level; RF (100,entropy) | 0.537 | 0.536 | 0.535 | 0.535 | 0.536 | 0.536 | |
| Unified groups; measurement level; RF (10,gini) | 0.511 | 0.511 | 0.51 | 0.51 | 0.511 | 0.511 | |
| Diverse groups; measurement level; RF (10,gini) | 0.521 | 0.521 | 0.518 | 0.518 | 0.521 | 0.521 | |
| Abstract level; sum; kNN (2) | 0.419 | 0.483 | 0.357 | 0.357 | 0.483 | 0.483 | |
| Measurement level; sum; kNN (2) | 0.441 | 0.449 | 0.428 | 0.428 | 0.449 | 0.449 | |
| Unified groups; abstract level; kNN (2) | 0.419 | 0.483 | 0.357 | 0.357 | 0.483 | 0.483 | |
| Diverse groups; abstract level; kNN (2) | 0.531 | 0.529 | 0.524 | 0.524 | 0.529 | 0.529 | |
| Unified groups; measurement level; kNN (2) | 0.442 | 0.444 | 0.438 | 0.438 | 0.444 | 0.444 | |
| Diverse groups; measurement level; kNN (5) | 0.519 | 0.518 | 0.512 | 0.512 | 0.518 | 0.518 | |
| Abstract level; sum; AdaBoost (10) | 0.601 | 0.599 | 0.596 | 0.596 | 0.599 | 0.599 | |
| Measurement level; sum; AdaBoost (50) | 0.586 | 0.584 | 0.582 | 0.582 | 0.584 | 0.584 | |
| Unified groups; abstract level; AdaBoost (10) | 0.601 | 0.599 | 0.596 | 0.596 | 0.599 | 0.599 | |
| Diverse groups; abstract level; AdaBoost (10) | 0.524 | 0.524 | 0.524 | 0.524 | 0.524 | 0.524 | |
| Unified groups; measurement level; AdaBoost (50) | 0.586 | 0.584 | 0.582 | 0.582 | 0.584 | 0.584 | |
| Diverse groups; measurement level; AdaBoost (10) | 0.575 | 0.575 | 0.574 | 0.574 | 0.575 | 0.575 | |
| Abstract level; sum; Gradient Boosting (50) | 0.557 | 0.556 | 0.555 | 0.555 | 0.556 | 0.556 | |
| Measurement level; sum; Gradient Boosting (50) | 0.558 | 0.558 | 0.557 | 0.557 | 0.558 | 0.558 | |
| Unified groups; abstract level; Gradient Boosting (50) | 0.557 | 0.556 | 0.555 | 0.555 | 0.556 | 0.556 | |
| Diverse groups; abstract level; Gradient Boosting (200) | 0.529 | 0.529 | 0.528 | 0.528 | 0.529 | 0.529 | |
| Unified groups; measurement level; Gradient Boosting (50) | 0.558 | 0.558 | 0.557 | 0.557 | 0.558 | 0.558 | |
| Diverse groups; measurement level; Gradient Boosting (20) | 0.568 | 0.567 | 0.566 | 0.566 | 0.567 | 0.567 | |
| Abstract level; sum; Logistic Regression | 0.478 | 0.479 | 0.478 | 0.478 | 0.479 | 0.479 | |
| Measurement level; sum; Logistic Regression | 0.481 | 0.481 | 0.48 | 0.48 | 0.481 | 0.481 | |
| Unified groups; abstract level; Logistic Regression | 0.478 | 0.479 | 0.478 | 0.478 | 0.479 | 0.479 | |
| Diverse groups; abstract level; Logistic Regression | 0.536 | 0.536 | 0.534 | 0.534 | 0.536 | 0.536 | |
| Unified groups; measurement level; Logistic Regression | 0.481 | 0.481 | 0.48 | 0.48 | 0.481 | 0.481 | |
| Diverse groups; measurement level; Logistic Regression | 0.535 | 0.535 | 0.535 | 0.535 | 0.535 | 0.535 |
| No. of Tables | Method/Model | F1 | F1 | ||||
|---|---|---|---|---|---|---|---|
| Prec. | Recall | (Weig.) | (Macro) | BAacc | Acc | ||
| 9LT | Abstract level; sum; RF (10,gini) | 0.509 | 0.509 | 0.507 | 0.507 | 0.509 | 0.509 |
| Measurement level; sum; RF (10,entropy) | 0.518 | 0.518 | 0.516 | 0.516 | 0.518 | 0.518 | |
| Unified groups; abstract level; RF (10,gini) | 0.509 | 0.509 | 0.507 | 0.507 | 0.509 | 0.509 | |
| Diverse groups; abstract level; RF (100,entropy) | 0.533 | 0.533 | 0.532 | 0.532 | 0.533 | 0.533 | |
| Unified groups; measurement level; RF (10,entropy) | 0.518 | 0.518 | 0.516 | 0.516 | 0.518 | 0.518 | |
| Diverse groups; measurement level; RF (10,entropy) | 0.525 | 0.524 | 0.522 | 0.522 | 0.524 | 0.524 | |
| Abstract level; sum; kNN (4) | 0.473 | 0.496 | 0.371 | 0.371 | 0.496 | 0.496 | |
| Measurement level; sum; kNN (5) | 0.454 | 0.454 | 0.454 | 0.454 | 0.454 | 0.454 | |
| Unified groups; abstract level; kNN (4) | 0.473 | 0.496 | 0.371 | 0.371 | 0.496 | 0.496 | |
| Diverse groups; abstract level; kNN (6) | 0.514 | 0.514 | 0.513 | 0.513 | 0.514 | 0.514 | |
| Unified groups; measurement level; kNN (5) | 0.454 | 0.454 | 0.454 | 0.454 | 0.454 | 0.454 | |
| Diverse groups; measurement level; kNN (5) | 0.51 | 0.51 | 0.507 | 0.507 | 0.51 | 0.51 | |
| Abstract level; sum; AdaBoost (100) | 0.565 | 0.565 | 0.565 | 0.565 | 0.565 | 0.565 | |
| Measurement level; sum; AdaBoost (100) | 0.535 | 0.534 | 0.533 | 0.533 | 0.534 | 0.534 | |
| Unified groups; abstract level; AdaBoost (100) | 0.565 | 0.565 | 0.565 | 0.565 | 0.565 | 0.565 | |
| Diverse groups; abstract level; AdaBoost (20) | 0.52 | 0.52 | 0.52 | 0.52 | 0.52 | 0.52 | |
| Unified groups; measurement level; AdaBoost (100) | 0.535 | 0.534 | 0.533 | 0.533 | 0.534 | 0.534 | |
| Diverse groups; measurement level; AdaBoost (50) | 0.589 | 0.586 | 0.583 | 0.583 | 0.586 | 0.586 | |
| Abstract level; sum; Gradient Boosting (10) | 0.535 | 0.534 | 0.533 | 0.533 | 0.534 | 0.534 | |
| Measurement level; sum; Gradient Boosting (20) | 0.519 | 0.519 | 0.517 | 0.517 | 0.519 | 0.519 | |
| Unified groups; abstract level; Gradient Boosting (20) | 0.535 | 0.534 | 0.533 | 0.533 | 0.534 | 0.534 | |
| Diverse groups; abstract level; Gradient Boosting (20) | 0.529 | 0.529 | 0.528 | 0.528 | 0.529 | 0.529 | |
| Unified groups; measurement level; Gradient Boosting (50) | 0.519 | 0.519 | 0.517 | 0.517 | 0.519 | 0.519 | |
| Diverse groups; measurement level; Gradient Boosting (20) | 0.566 | 0.565 | 0.564 | 0.564 | 0.565 | 0.565 | |
| Abstract level; sum; Logistic Regression | 0.578 | 0.577 | 0.576 | 0.576 | 0.577 | 0.577 | |
| Measurement level; sum; Logistic Regression | 0.574 | 0.574 | 0.572 | 0.572 | 0.574 | 0.574 | |
| Unified groups; abstract level; Logistic Regression | 0.578 | 0.577 | 0.576 | 0.576 | 0.577 | 0.577 | |
| Diverse groups; abstract level; Logistic Regression | 0.539 | 0.539 | 0.537 | 0.537 | 0.539 | 0.539 | |
| Unified groups; measurement level; Logistic Regression | 0.574 | 0.574 | 0.572 | 0.572 | 0.574 | 0.574 | |
| Diverse groups; measurement level; Logistic Regression | 0.51 | 0.51 | 0.51 | 0.51 | 0.51 | 0.51 | |
| 11LT | Abstract level; sum; RF (10,entropy) | 0.517 | 0.516 | 0.51 | 0.51 | 0.516 | 0.516 |
| Measurement level; sum; RF (10,gini) | 0.497 | 0.497 | 0.495 | 0.495 | 0.497 | 0.497 | |
| Unified groups; abstract level; RF (10,entropy) | 0.517 | 0.516 | 0.51 | 0.51 | 0.516 | 0.516 | |
| Diverse groups; abstract level; RF (100,entropy) | 0.533 | 0.533 | 0.532 | 0.532 | 0.533 | 0.533 | |
| Unified groups; measurement level; RF (10,gini) | 0.497 | 0.497 | 0.495 | 0.495 | 0.497 | 0.497 | |
| Diverse groups; measurement level; RF (50,entropy) | 0.521 | 0.519 | 0.51 | 0.51 | 0.519 | 0.519 | |
| Abstract level; sum; kNN (4) | 0.539 | 0.506 | 0.377 | 0.377 | 0.506 | 0.506 | |
| Measurement level; sum; kNN (7) | 0.451 | 0.454 | 0.445 | 0.445 | 0.454 | 0.454 | |
| Unified groups; abstract level; kNN (4) | 0.539 | 0.506 | 0.377 | 0.377 | 0.506 | 0.506 | |
| Diverse groups; abstract level; kNN (2) | 0.524 | 0.524 | 0.521 | 0.521 | 0.524 | 0.524 | |
| Unified groups; measurement level; kNN (7) | 0.451 | 0.454 | 0.445 | 0.445 | 0.454 | 0.454 | |
| Diverse groups; measurement level; kNN (4) | 0.503 | 0.503 | 0.502 | 0.502 | 0.503 | 0.503 | |
| Abstract level; sum; AdaBoost (10) | 0.579 | 0.577 | 0.574 | 0.574 | 0.577 | 0.577 | |
| Measurement level; sum; AdaBoost (20) | 0.6 | 0.597 | 0.594 | 0.594 | 0.597 | 0.597 | |
| Unified groups; abstract level; AdaBoost (10) | 0.579 | 0.577 | 0.574 | 0.574 | 0.577 | 0.577 | |
| Diverse groups; abstract level; AdaBoost (10) | 0.522 | 0.522 | 0.522 | 0.522 | 0.522 | 0.522 | |
| Unified groups; measurement level; AdaBoost (20) | 0.6 | 0.597 | 0.594 | 0.594 | 0.597 | 0.597 | |
| Diverse groups; measurement level; AdaBoost (20) | 0.579 | 0.576 | 0.573 | 0.573 | 0.576 | 0.576 | |
| Abstract level; sum; Gradient Boosting (10) | 0.528 | 0.528 | 0.527 | 0.527 | 0.528 | 0.528 | |
| Measurement level; sum; Gradient Boosting (50) | 0.527 | 0.526 | 0.526 | 0.526 | 0.526 | 0.526 | |
| Unified groups; abstract level; Gradient Boosting (10) | 0.528 | 0.528 | 0.527 | 0.527 | 0.528 | 0.528 | |
| Diverse groups; abstract level; Gradient Boosting (200) | 0.529 | 0.529 | 0.529 | 0.529 | 0.529 | 0.529 | |
| Unified groups; measurement level; Gradient Boosting (50) | 0.527 | 0.526 | 0.526 | 0.526 | 0.526 | 0.526 | |
| Diverse groups; measurement level; Gradient Boosting (100) | 0.548 | 0.548 | 0.546 | 0.546 | 0.548 | 0.548 | |
| Abstract level; sum; Logistic Regression | 0.528 | 0.528 | 0.527 | 0.527 | 0.528 | 0.528 | |
| Measurement level; sum; Logistic Regression | 0.513 | 0.513 | 0.511 | 0.511 | 0.513 | 0.513 | |
| Unified groups; abstract level; Logistic Regression | 0.528 | 0.528 | 0.527 | 0.527 | 0.528 | 0.528 | |
| Diverse groups; abstract level; Logistic Regression | 0.536 | 0.536 | 0.534 | 0.534 | 0.536 | 0.536 | |
| Unified groups; measurement level; Logistic Regression | 0.513 | 0.513 | 0.511 | 0.511 | 0.513 | 0.513 | |
| Diverse groups; measurement level; Logistic Regression | 0.54 | 0.539 | 0.536 | 0.536 | 0.539 | 0.539 |
| p-Value | Abstract Level Sum | Measurement Level Sum | Unified Groups Abstract Level | Diverse Groups Abstract Level | Unified Groups Measurement Level | Diverse Groups Measurement Level |
|---|---|---|---|---|---|---|
| Abstract level, sum | 1 | 1 | 0.456 | 1 | 1 | |
| Measurement level, sum | 1 | 1 | 0.132 | 1 | 1 | |
| Unified groups, abstract level | 1 | 1 | 1 | 1 | 1 | |
| Diverse groups, abstract level | 0.456 | 0.132 | 1 | 0.426 | 0.009 | |
| Unified groups, measurement level | 1 | 1 | 1 | 0.426 | 1 | |
| Diverse groups, measurement level | 1 | 1 | 1 | 0.009 | 1 |
| Data Set | Method/Model | Prec. | Recall | F1 (Weig.) | F1 (Macro) | BAacc | Acc |
|---|---|---|---|---|---|---|---|
| EEG Epilepsy | RF (200,gini) | 0.946 | 0.933 | 0.932 | 0.932 | 0.933 | 0.933 |
| kNN (4) | 0.782 | 0.74 | 0.716 | 0.716 | 0.74 | 0.74 | |
| AdaBoost (20) | 0.953 | 0.947 | 0.946 | 0.946 | 0.947 | 0.947 | |
| Gradient Boosting (50) | 0.946 | 0.933 | 0.932 | 0.932 | 0.933 | 0.933 | |
| Logistic Regression | 0.888 | 0.867 | 0.869 | 0.869 | 0.867 | 0.867 | |
| BCI Competition IV Dataset 1 | RF (20,gini) | 0.53 | 0.529 | 0.527 | 0.527 | 0.529 | 0.529 |
| kNN (2) | 0.485 | 0.492 | 0.442 | 0.442 | 0.492 | 0.492 | |
| AdaBoost (10) | 0.606 | 0.604 | 0.603 | 0.603 | 0.604 | 0.604 | |
| Gradient Boosting (20) | 0.597 | 0.597 | 0.597 | 0.597 | 0.597 | 0.597 | |
| Logistic Regression | 0.542 | 0.541 | 0.541 | 0.541 | 0.541 | 0.541 |
| Data Set | Prec. | Recall | F1 (Weig.) | F1 (Macro) | BAacc | Acc |
|---|---|---|---|---|---|---|
| EEG Epilepsy | 0.836 | 0.767 | 0.737 | 0.737 | 0.767 | 0.767 |
| BCI Competition IV Dataset 1 | 0.516 | 0.516 | 0.513 | 0.513 | 0.516 | 0.516 |
Disclaimer/Publisher’s Note: The statements, opinions and data contained in all publications are solely those of the individual author(s) and contributor(s) and not of MDPI and/or the editor(s). MDPI and/or the editor(s) disclaim responsibility for any injury to people or property resulting from any ideas, methods, instructions or products referred to in the content. |
© 2025 by the authors. Licensee MDPI, Basel, Switzerland. This article is an open access article distributed under the terms and conditions of the Creative Commons Attribution (CC BY) license (https://creativecommons.org/licenses/by/4.0/).
Share and Cite
Przybyła-Kasperek, M.; Sacewicz, J. Dynamic Ensemble Selection for EEG Signal Classification in Distributed Data Environments. Appl. Sci. 2025, 15, 6043. https://doi.org/10.3390/app15116043
Przybyła-Kasperek M, Sacewicz J. Dynamic Ensemble Selection for EEG Signal Classification in Distributed Data Environments. Applied Sciences. 2025; 15(11):6043. https://doi.org/10.3390/app15116043
Chicago/Turabian StylePrzybyła-Kasperek, Małgorzata, and Jakub Sacewicz. 2025. "Dynamic Ensemble Selection for EEG Signal Classification in Distributed Data Environments" Applied Sciences 15, no. 11: 6043. https://doi.org/10.3390/app15116043
APA StylePrzybyła-Kasperek, M., & Sacewicz, J. (2025). Dynamic Ensemble Selection for EEG Signal Classification in Distributed Data Environments. Applied Sciences, 15(11), 6043. https://doi.org/10.3390/app15116043