

Investigation of Biochars in Terms of Vitamin E Adsorption Capacity

 , ,
, ,  ,
,
Abstract
Featured Application
Abstract
1. Introduction
2. Materials and Methods
2.1. Selection of Biochars

| Biochar | Pyrolysis Process | Biomass | Wood Type |
|---|---|---|---|
| A | Kiln | Mostly beech, some oak and acacia (with very little bark) | Hard |
| B | PYREG | Sieved fresh wood chips (mainly trunk wood of poplars) | Probably hard |
| C | Pyrolysis, N/A | Beech | Hard |
| D | Pyrolysis, N/A | Beech, spruce | Hard, soft (spruce) |
| E | PYREG | Wood chips | N/A |
| F | Kiln | Beech, larch, spruce, oak, herbal extracts | Hard, soft (spruce) |
| G | PYREG | Beech, oak, ash, maple, hornbeam | Hard |
| H | PYREG | Wood chips, beech wood chips | Hard |
| I | PYREG | Spruce, pine | Soft |
| J | PYREG | Mostly beech, some oak | Hard |
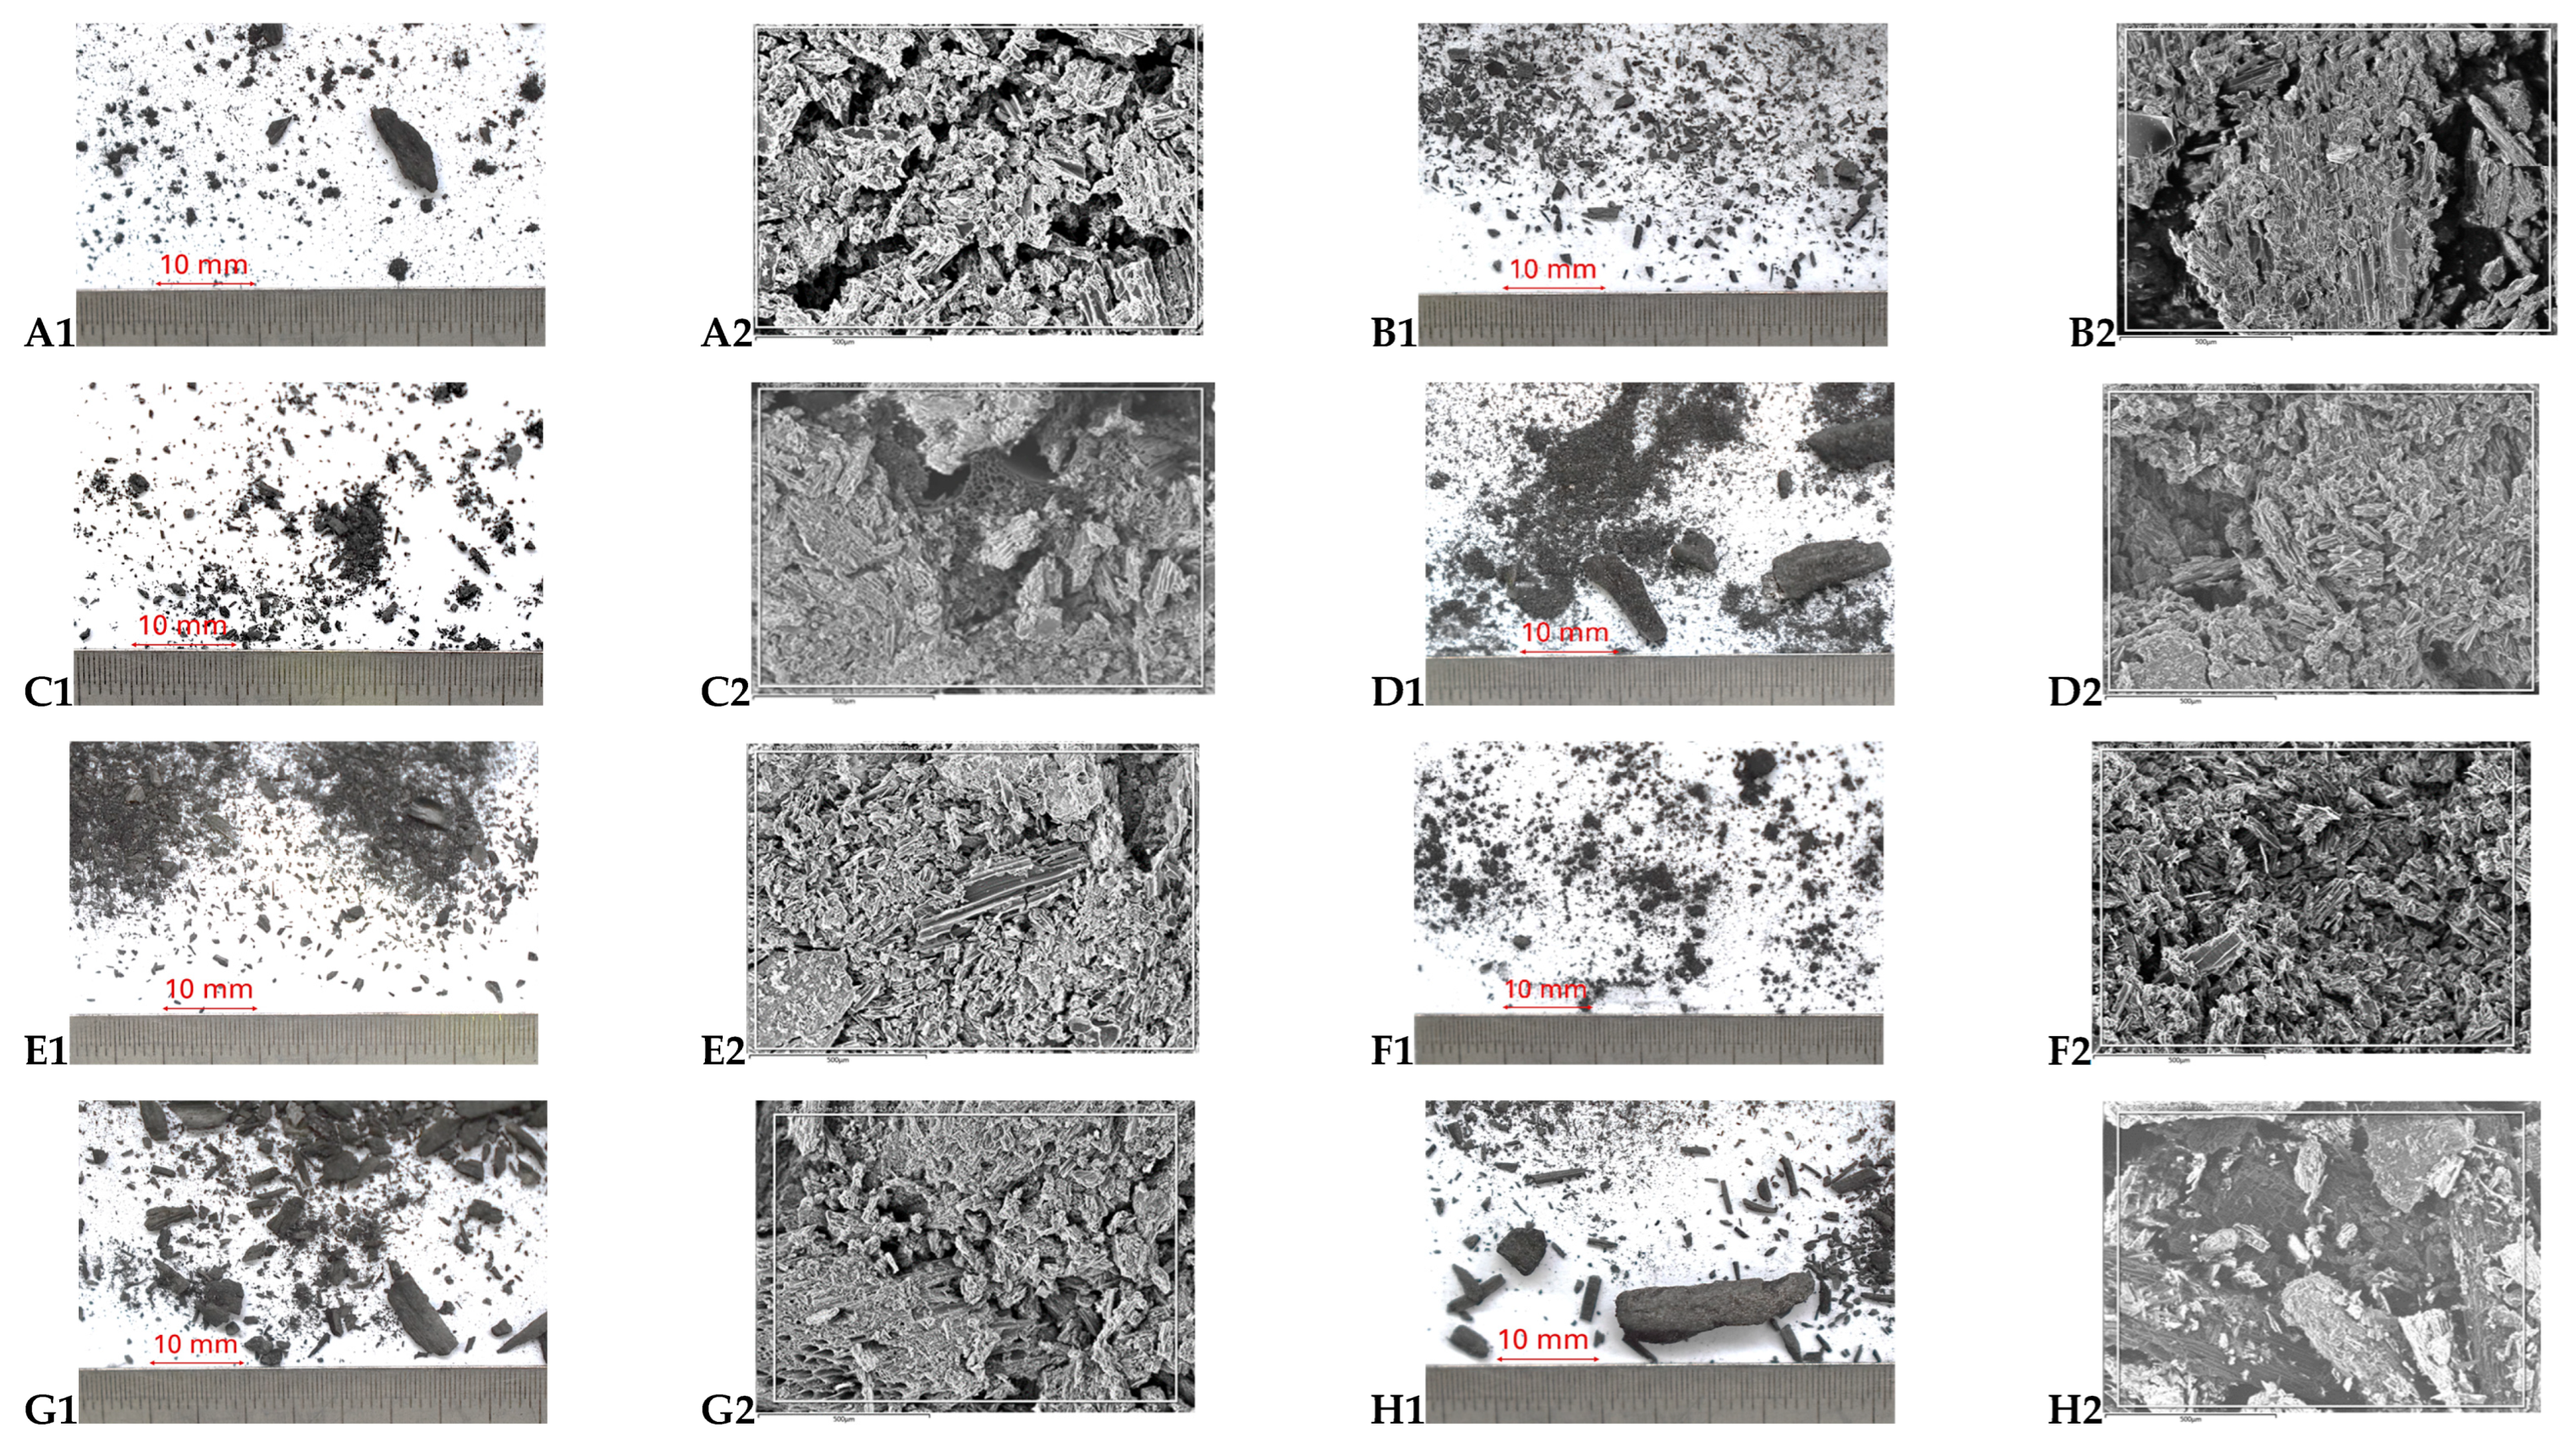
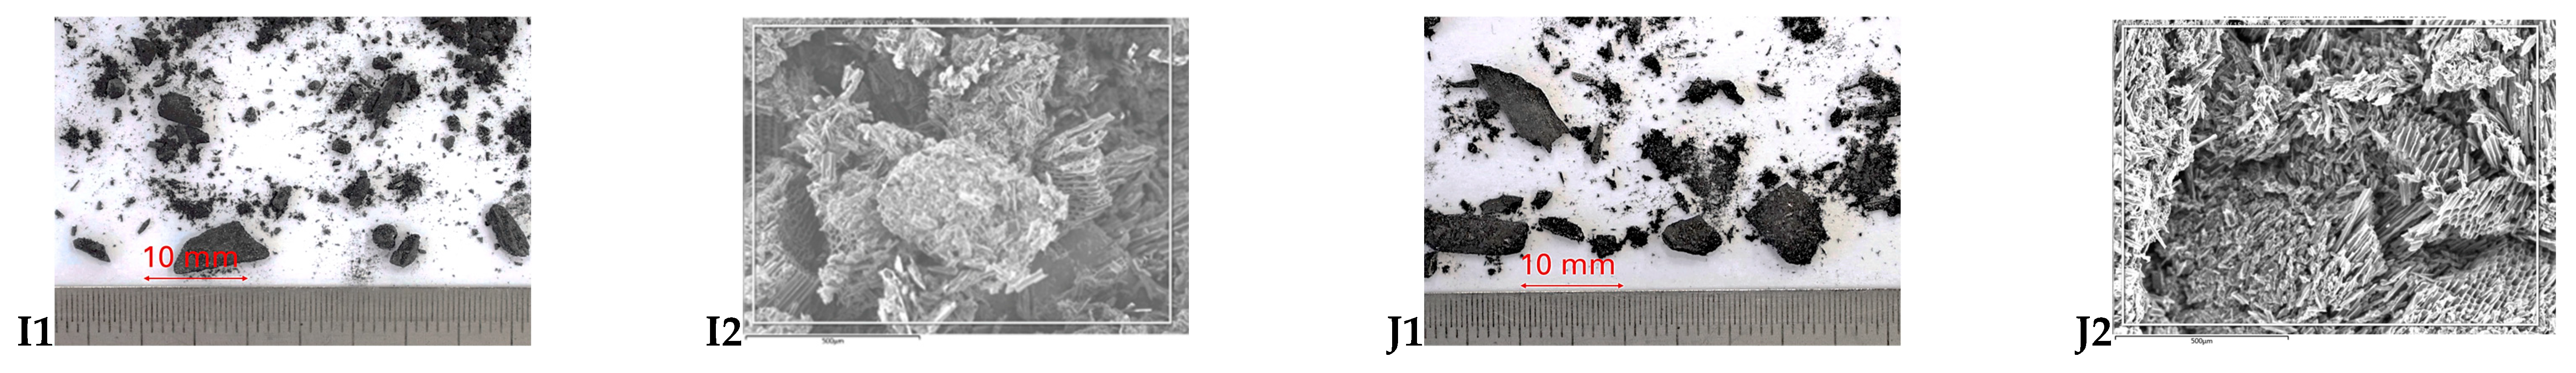
2.2. Imaging
2.3. Analysis of Mesopore Distribution
2.4. Theoretical Calculation of α-Tocopheryl Acetate’s Volume
2.5. Theoretical Calculation of Adsorption Capacity
- -
- : adsorption capacity of α-tocopheryl acetate (mg/g);
- -
- : molar mass (=472.754 g/mol);
- -
- : BJH surface area (m2/g);
- -
- 1000: conversion factor;
- -
- : molecular surface area of α-tocopherol (=1.1305 × 10⁻¹⁸ m2);
- -
- : Avogadro number (=6.022 × 10²³ mol−1).
2.6. Adsorption Capacity of Biochars for α-Tocopheryl Acetate
2.6.1. Preparation of Stock Solution
2.6.2. Preparation of Biochars with α-Tocopheryl Acetate
2.6.3. Analysis of Biochars’ α-Tocopheryl Acetate Adsorption
- -
- : absolute adsorption capacity of α-tocopheryl acetate (mgα-tocopheryl acetate/gbiochar);
- -
- : initial concentration of α-tocopheryl acetate in the stock solution (g/L);
- -
- : concentration of α-tocopheryl acetate in the stock solution (g/L);
- -
- : volume of reaction (L), which is
- -
- : weight of biochar (g).
- -
- : the absolute adsorption capacity of α-tocopheryl acetate (mgα-tocopheryl acetate/gbiochar DM);
- -
- : the initial concentration of α-tocopheryl acetate in the stock solution (g/L);
- -
- : the concentration of α-tocopheryl acetate in the stock solution (g/L);
- -
- : the volume of the reaction (L), calculated as ;
- -
- : the weight of biochar (g) on a dry matter basis, which was multiplied by , which is .
- -
- : the relative adsorption capacity of α-tocopheryl acetate (%);
- -
- : factor;
- -
- : the initial concentration of α-tocopheryl acetate in the stock solution (g/L);
- -
- : the concentration of α-tocopheryl acetate in the stock solution (g/L).
2.7. Statistical Analysis
3. Results and Discussions
3.1. Characteristics of Biochars
3.1.1. Influence of Processing
3.1.2. Influence of Biomass
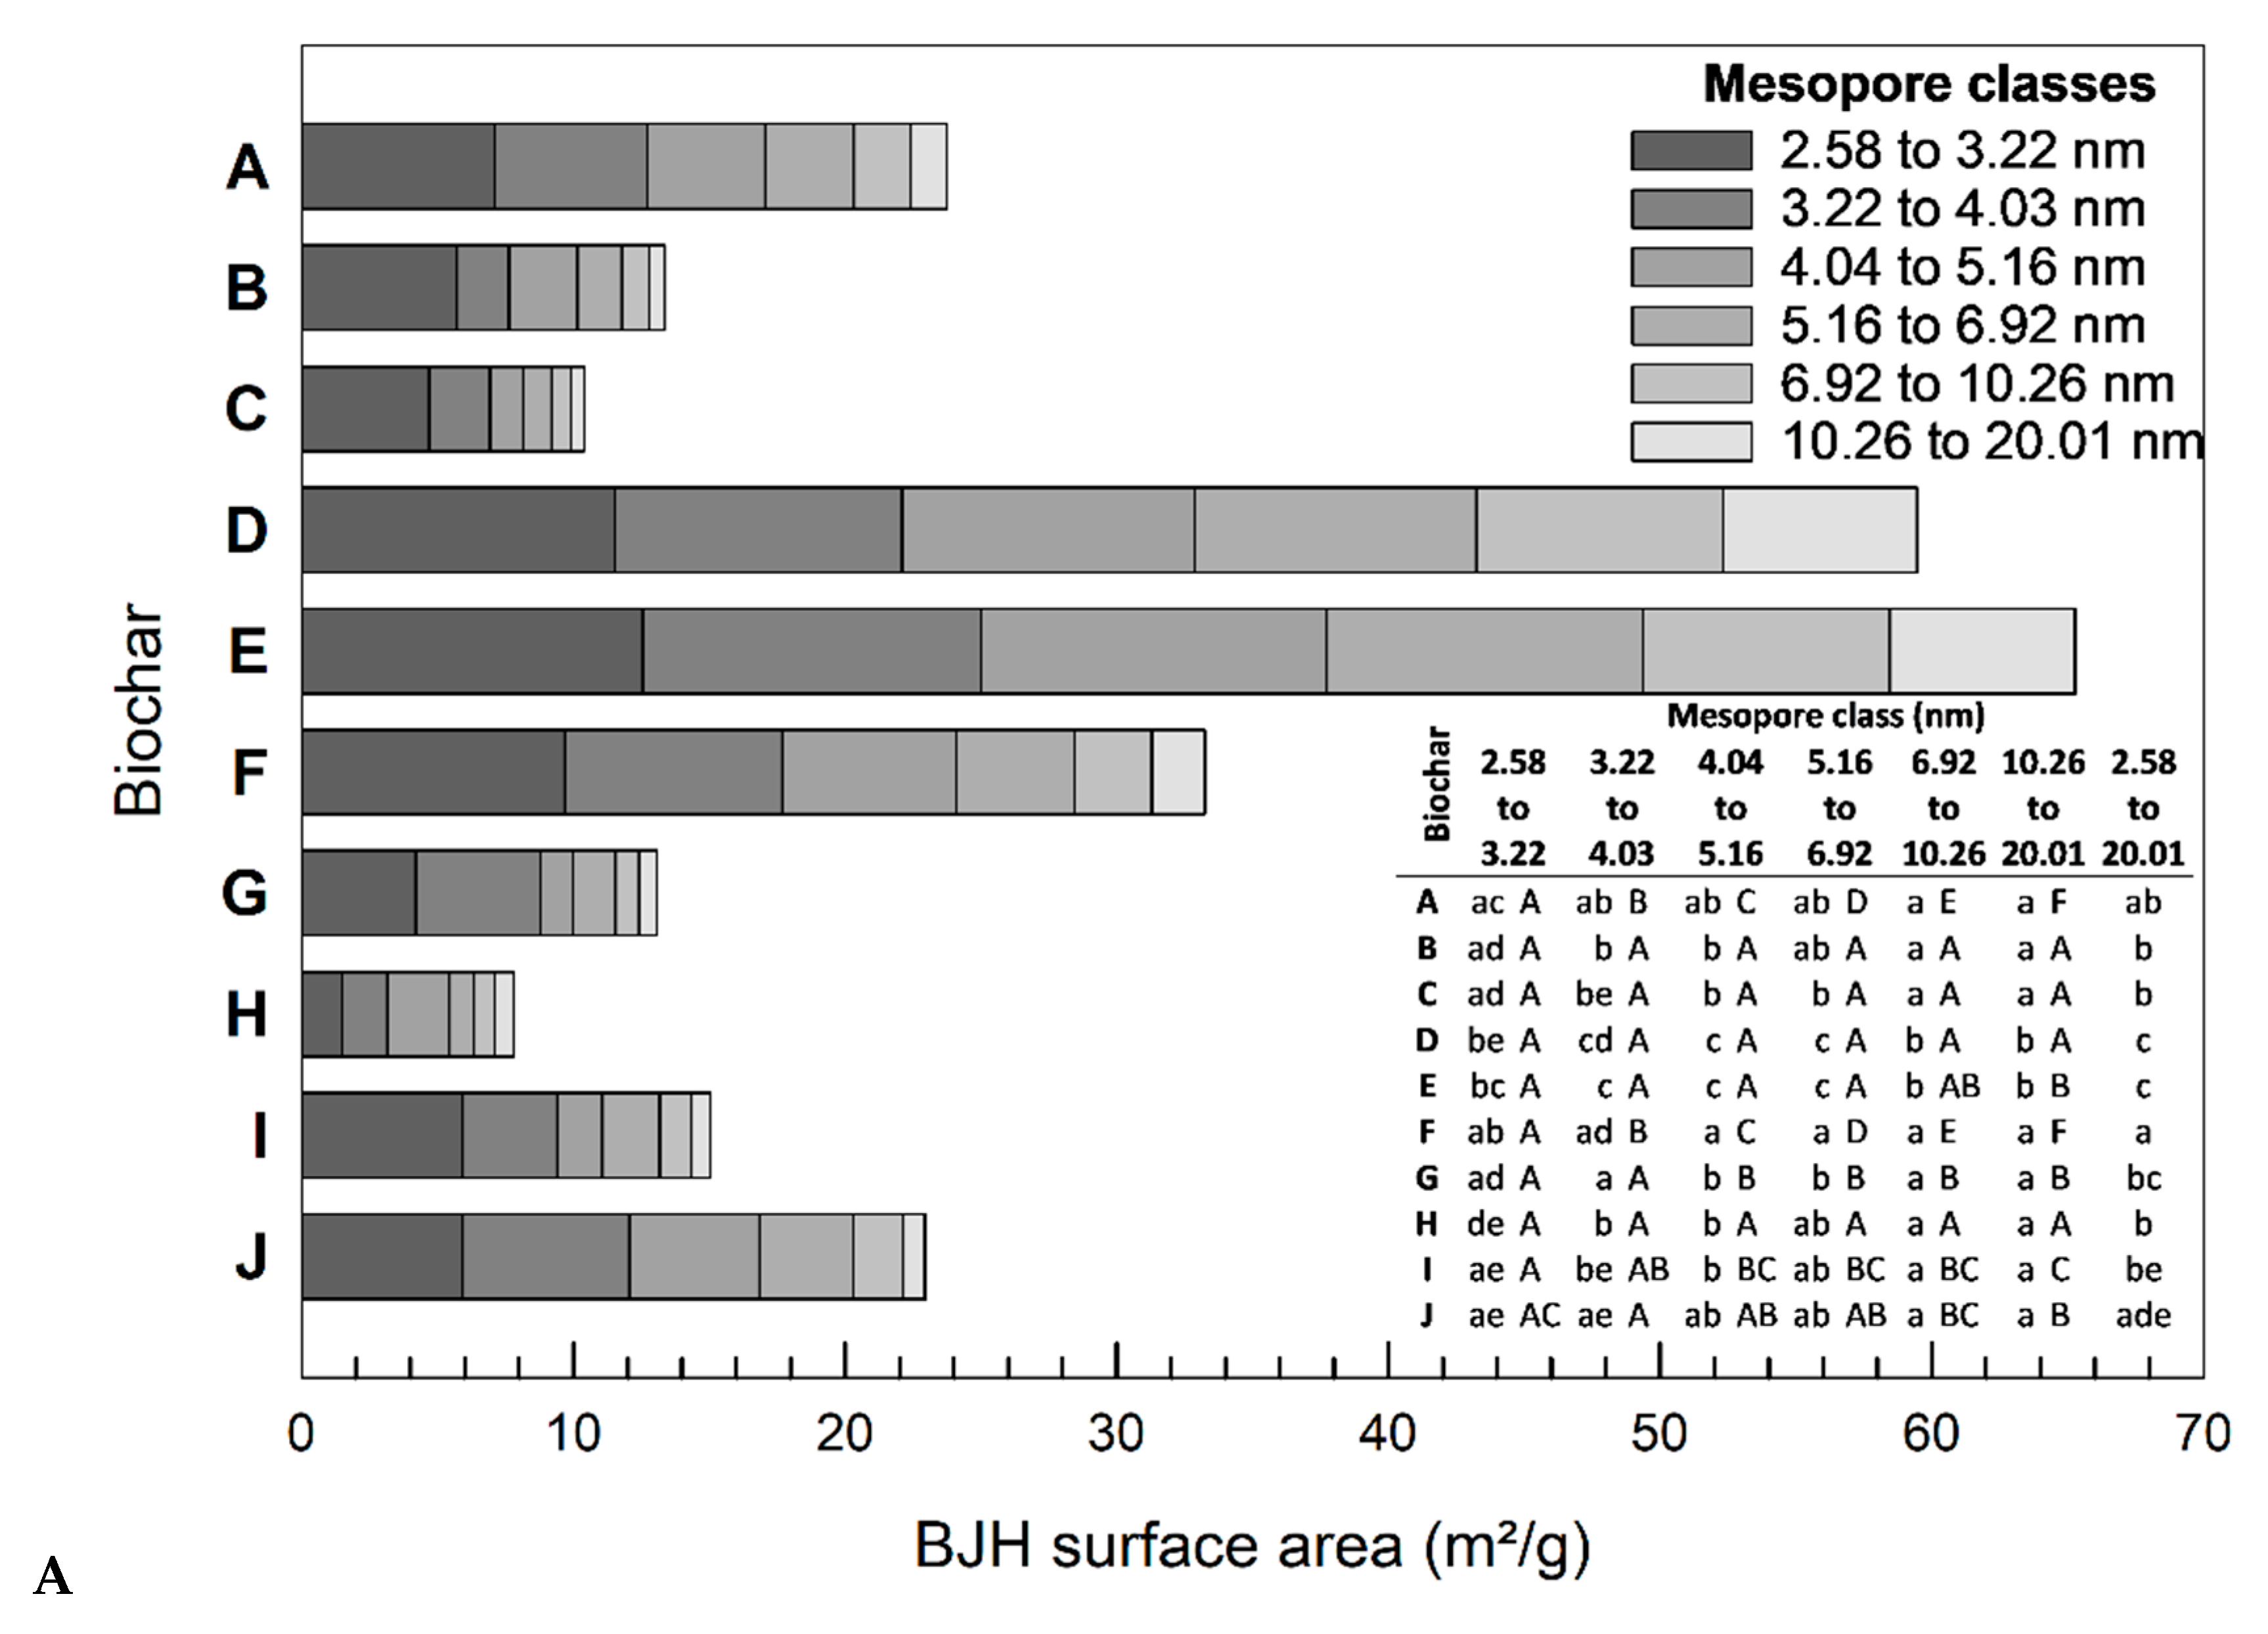
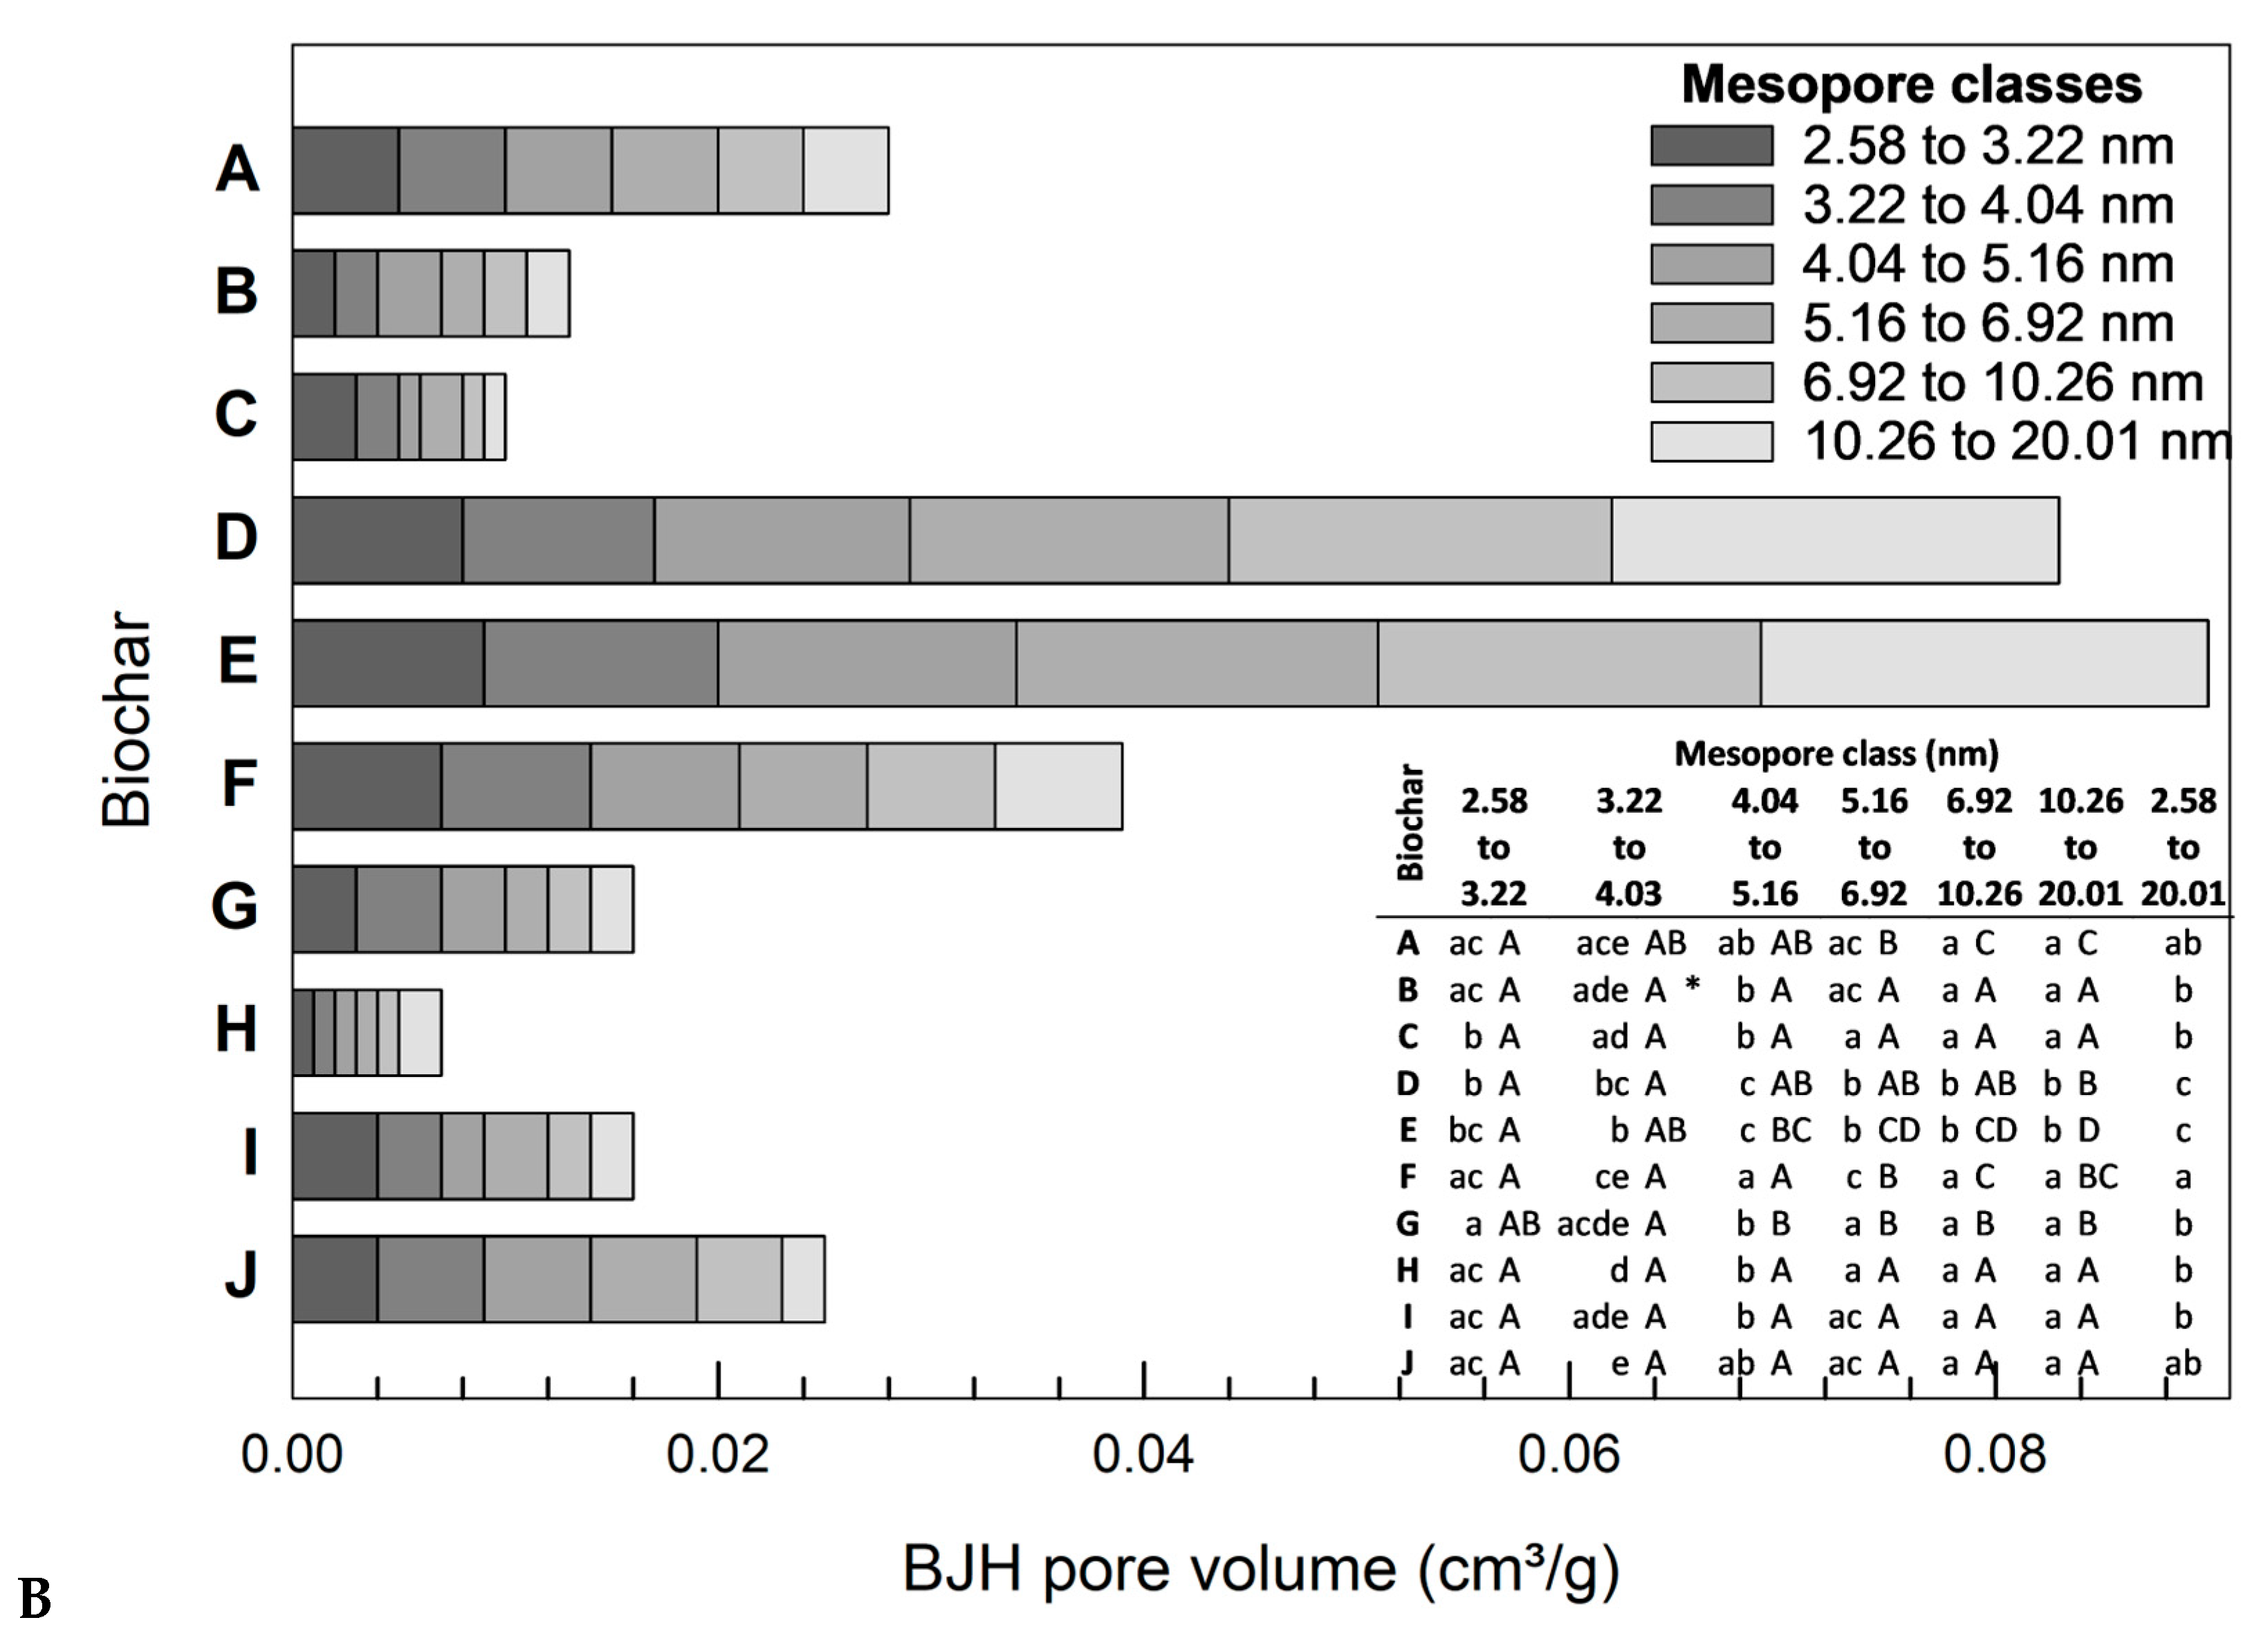
3.2. Mesopore Analysis
3.2.1. Influence of Biomass
3.2.2. Influence of Particle Size Distribution
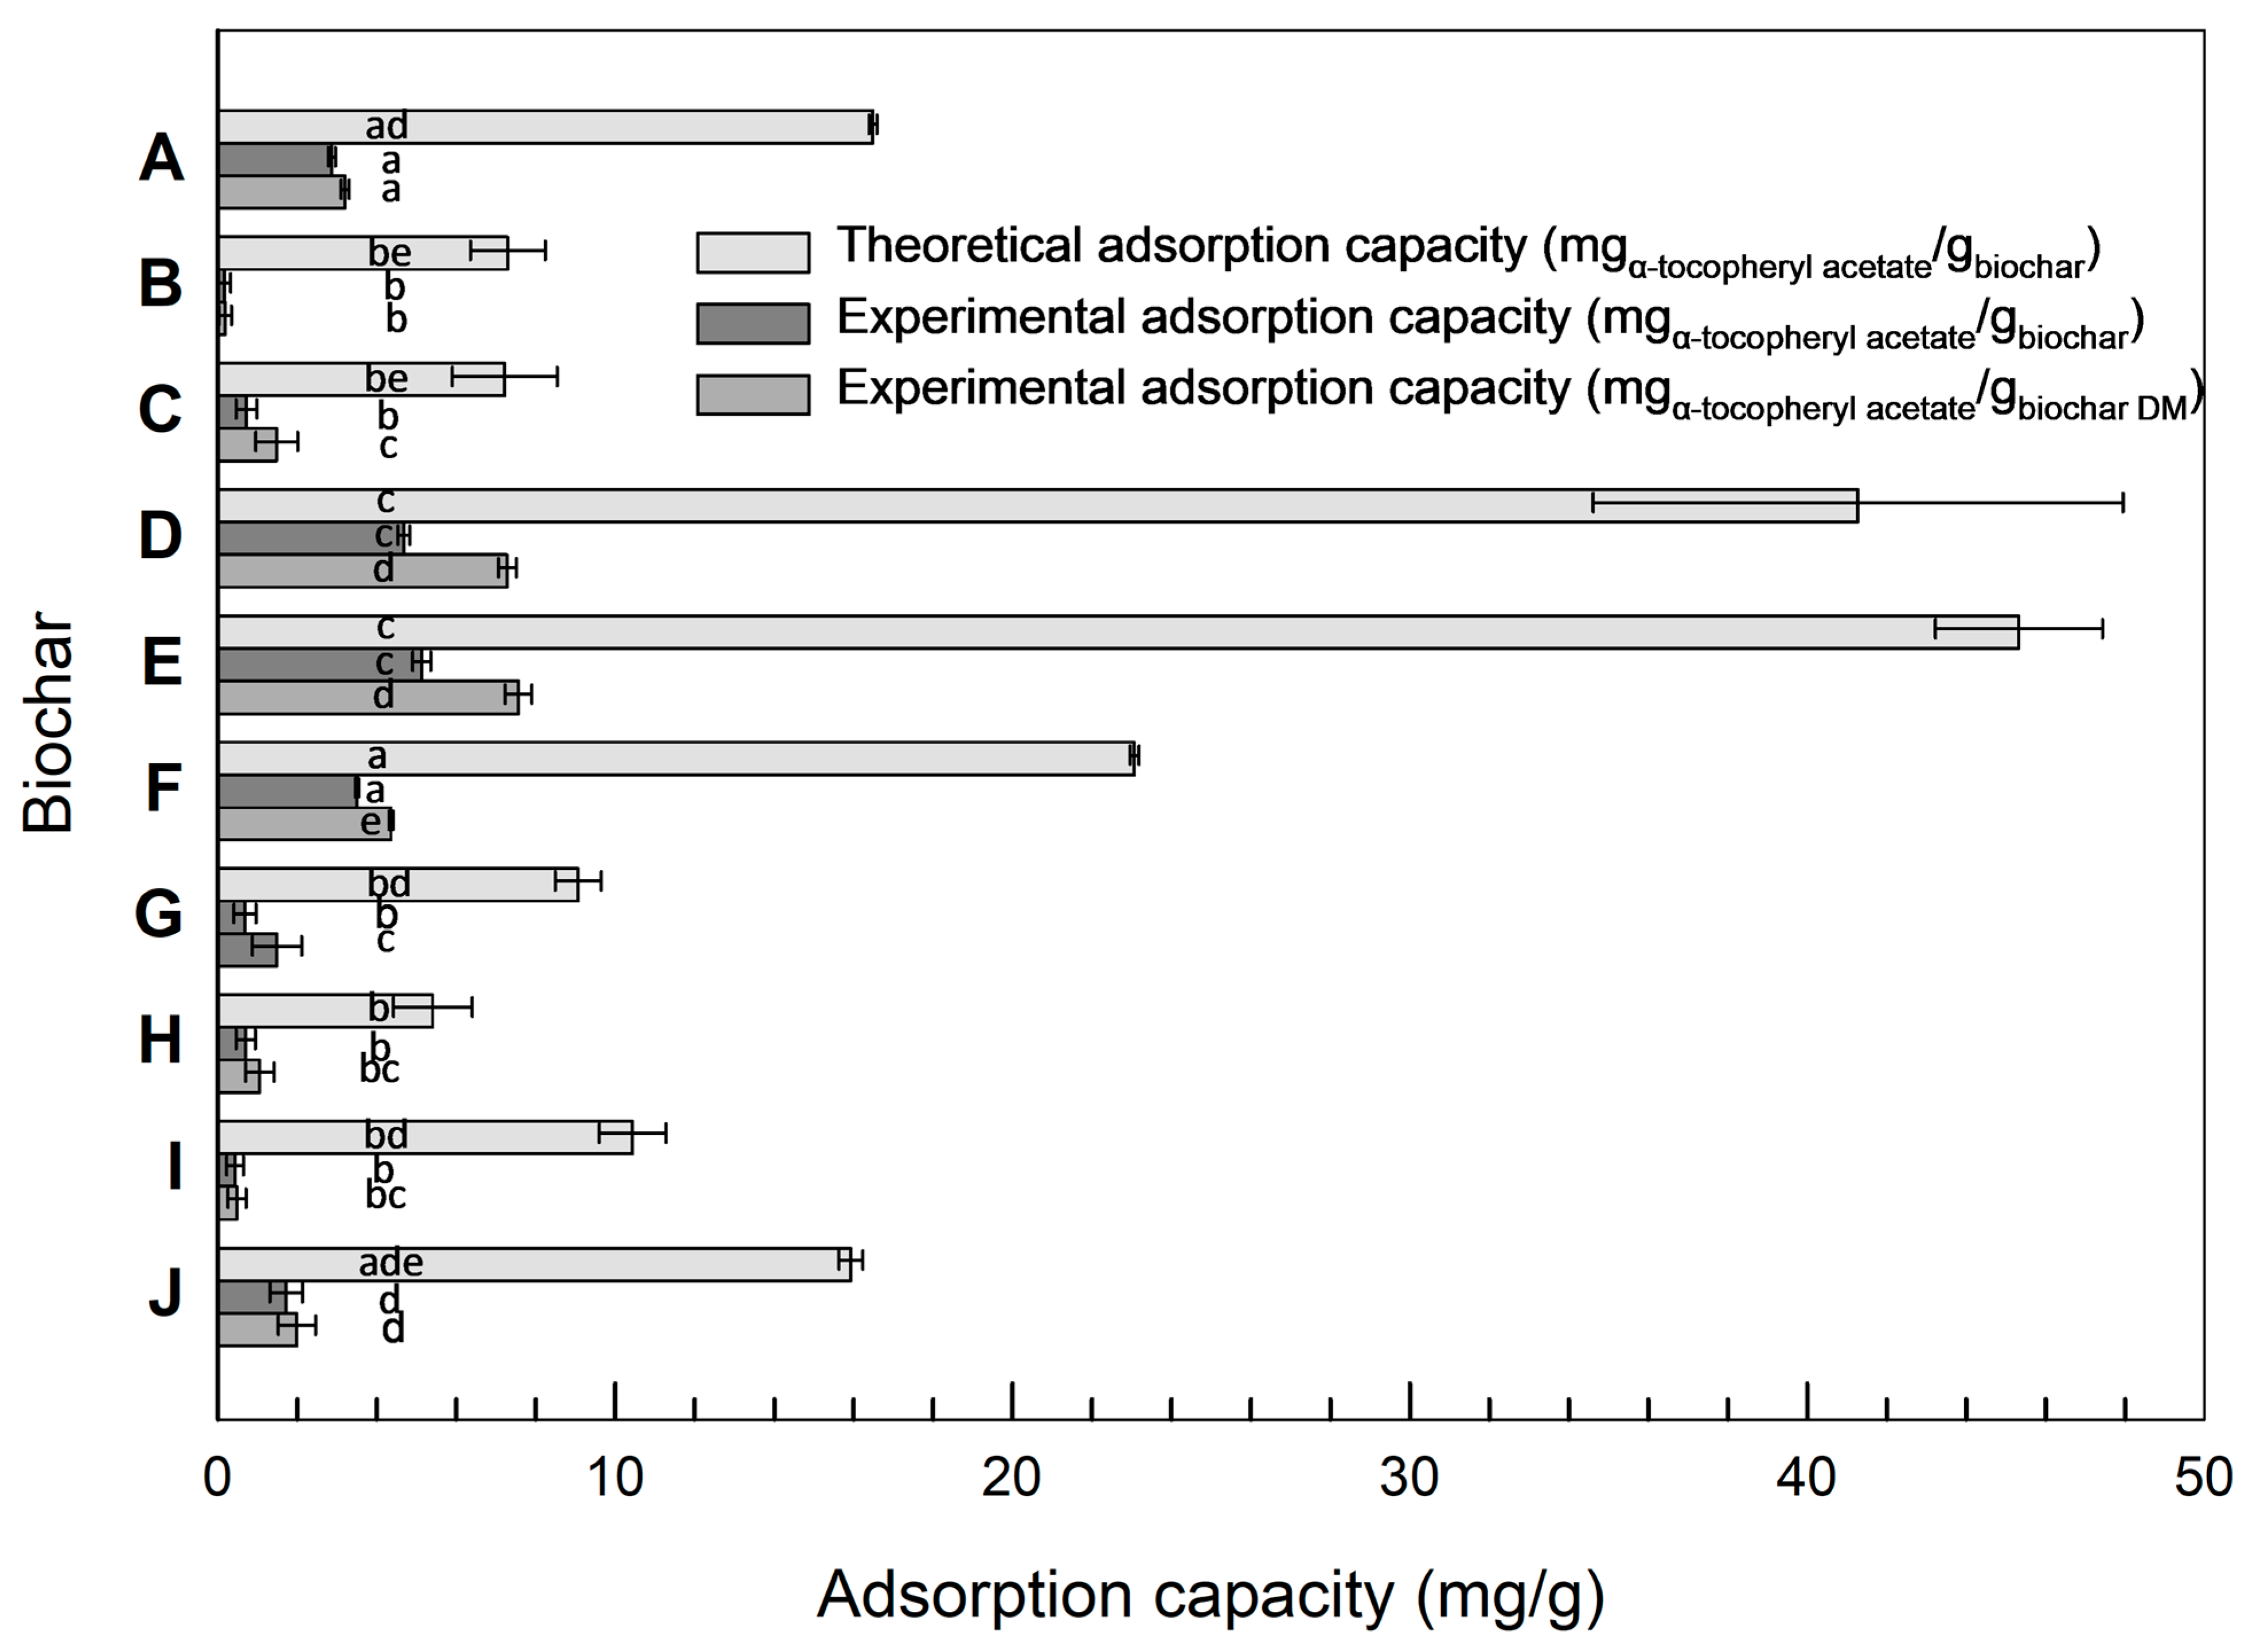
3.3. Theoretical Calculation of Adsorption Capacity
3.4. Adsorption Capacity of α-Tocopheryl Acetate
3.4.1. Correlation of Adsorption Capacity and Total Mesopore Volume
3.4.2. Correlation of Adsorption Capacity and Respective Mesopore Class
3.4.3. Correlation of Adsorption Capacity and Biomass and Pyrolysis Processes
3.5. Limitations of the Study
4. Conclusions
Author Contributions
Funding
Institutional Review Board Statement
Informed Consent Statement
Data Availability Statement
Acknowledgments
Conflicts of Interest
Abbreviations
| BET | Brunauer–Emmett–Teller |
| BJH | Barrett–Joyner–Halenda |
| SEM | Scanning electron microscopy |
References
- Emanuelson, U.; Funke, H. Effect of milk yield on relationship between bulk milk somatic cell count and prevalence of mastitis. J. Dairy Sci. 1991, 74, 2479–2483. [Google Scholar] [CrossRef] [PubMed]
- Shum, L.; McConnel, C.; Gunn, A.; House, J. Environmental mastitis in intensive high-producing dairy herds in New South Wales. Aust. Veter J. 2009, 87, 469–475. [Google Scholar] [CrossRef]
- Vlasova, A.N.; Saif, L.J. Bovine immunology: Implications for dairy cattle. Front. Immunol. 2021, 12, 643206. [Google Scholar] [CrossRef] [PubMed]
- Pyörälä, S. Indicators of inflammation in the diagnosis of mastitis. Veter Res. 2003, 34, 565–578. [Google Scholar] [CrossRef]
- Kester, H.; Sorter, D.; Hogan, J. Activity and milk compositional changes following experimentally induced Streptococcus uberis bovine mastitis. J. Dairy Sci. 2015, 98, 999–1004. [Google Scholar] [CrossRef]
- Sharma, N.; Singh, N.K.; Bhadwal, M.S. Relationship of somatic cell count and mastitis: An overview. Asian-Australas. J. Anim. Sci. 2011, 24, 429–438. [Google Scholar] [CrossRef]
- Le Maréchal, C.; Thiéry, R.; Vautor, E.; Le Loir, Y. Mastitis impact on technological properties of milk and quality of milk products—A review. Dairy Sci. Technol. 2011, 91, 247–282. [Google Scholar] [CrossRef]
- Ma, Y.; Ryan, C.; Barbano, D.; Galton, D.; Rudan, M.; Boor, K. Effects of Somatic Cell Count on Quality and Shelf-Life of Pasteurized Fluid Milk. J. Dairy Sci. 2000, 83, 264–274. [Google Scholar] [CrossRef]
- Töpel, A. Chemie und Physik der Milch; Behr’s Verlag: Hamburg, Germany, 2004; Volume 98. [Google Scholar]
- Zeiler, E. Einfluss der Supplementation von Vitamin E und Selen auf die Eutergesundheit von Milchkühen; Ludwig-Maximillians-Universität München: München, Germany, 2010. [Google Scholar]
- Chen, Y.-H.; Chen, Y.-M.; Tu, P.-A.; Lee, K.-H.; Chen, J.-Y.; Hsu, J.-T. Effect of supplementing vitamin E, selenium, Copper, zinc, and manganese during the transition period on dairy cow reproductive performance and immune function. Veter Sci. 2023, 10, 225. [Google Scholar] [CrossRef]
- Baldi, A. Vitamin E in dairy cows. Livest. Prod. Sci. 2005, 98, 117–122. [Google Scholar] [CrossRef]
- Wu, Z.; Guo, Y.; Zhang, J.; Deng, M.; Xian, Z.; Xiong, H.; Liu, D.; Sun, B. High-dose vitamin E supplementation can alleviate the negative effect of subacute ruminal acidosis in dairy cows. Animals 2023, 13, 486. [Google Scholar] [CrossRef] [PubMed]
- Hidiroglou, M.; Jenkins, K.J.; Lessard, J.R.; Carson, R.B. Metabolism of vitamin E in sheep. Br. J. Nutr. 1970, 24, 917–928. [Google Scholar] [CrossRef] [PubMed]
- Alderson, N.E.; Mitchell, G.E.; Little, C.O.; Warner, R.E.; Tucker, R.E. Preintestinal disappearance of vitamin E in ruminants. J. Nutr. 1971, 101, 655–659. [Google Scholar] [CrossRef]
- Man, K.Y.; Chow, K.L.; Man, Y.B.; Mo, W.Y.; Wong, M.H. Use of biochar as feed supplements for animal farming. Crit. Rev. Environ. Sci. Technol. 2021, 51, 187–217. [Google Scholar] [CrossRef]
- Yaneva, Z.; Georgieva, N.; Staleva, M. Development of d,l-α-tocopherol acetate/zeolite carrier system: Equilibrium study. Monatshefte Fuer. Chem./Chem. Mon. 2016, 147, 1167–1175. [Google Scholar] [CrossRef]
- Papaioannou, D.; Katsoulos, P.; Panousis, N.; Karatzias, H. The role of natural and synthetic zeolites as feed additives on the prevention and/or the treatment of certain farm animal diseases: A review. Microporous Mesoporous Mater. 2005, 84, 161–170. [Google Scholar] [CrossRef]
- Smart, L.E.; Moore, E.A. Microporous and Mesoporous Solids. In Solid State Chemistry: An Introduction; CRC Press: Boca Raton, FL, USA, 2012; pp. 271–314. [Google Scholar] [CrossRef]
- Simona, M.; Camelia, T. Zeolites Applications in Veterinary Medicine. In Zeolites-New Challenges; Margeta, K., Farkas, A., Eds.; InTechOpen: London, UK, 2020. [Google Scholar] [CrossRef]
- Grabherr, H.; Spolders, M.; Lebzien, P.; Hüther, L.; Flachowsky, G.; Fürll, M.; Grün, M. Effect of zeolite A on rumen fermentation and phosphorus metabolism in dairy cows. Arch. Anim. Nutr. 2009, 63, 321–336. [Google Scholar] [CrossRef]
- Szymula, A.; Wlazło, Ł.; Sasáková, N.; Wnuk, W.; Nowakowicz-Dębek, B. The use of natural sorbents to reduce ammonia emissions from cattle faeces. Agronomy 2021, 11, 2543. [Google Scholar] [CrossRef]
- Damato, A.; Vanzani, P.; Giaretta, E.; Novelli, E.; Gianesella, M.; Gabai, G.; Zennaro, L. Possible interferences of bentonite on rumen metabolome highlighted by 1H-NMR spectroscopy in dairy Holstein cows. In Proceedings of the 74th SISVet Congress, Virtual, 23–26 June 2021. [Google Scholar]
- Bathen, D.; Breitbach, M. Technische Adsorbentien. In Adsorptionstechnik; Springer: Berlin/Heidelberg, Germany, 2001; pp. 13–48. [Google Scholar] [CrossRef]
- Sarker, M.; Shin, S.; Jhung, S.H. Functionalized mesoporous metal-organic framework PCN-100: An efficient carrier for vitamin E storage and delivery. J. Ind. Eng. Chem. 2019, 74, 158–163. [Google Scholar] [CrossRef]
- Haber, J. Manual on catalyst characterization (Recommendations 1991). Pure Appl. Chem. 1991, 63, 1227–1246. [Google Scholar] [CrossRef]
- Quinn, P.J. Molecular associations of vitamin E. Vitam. Horm. 2007, 76, 67–98. [Google Scholar] [CrossRef] [PubMed]
- Maggio, B.; Diplock, A.T.; Lucy, J.A. Interactions of tocopherols and ubiquinones with monolayers of phospholipids. Biochem. J. 1977, 161, 111–121. [Google Scholar] [CrossRef] [PubMed]
- Kovalenko, G.A.; Kuznetsova, E.V. Adsorption of antiseptics (furacilin, chlorhexidine) and vitamin E on carbon-containing enterosorbents. Pharm. Chem. J. 2000, 34, 327–331. [Google Scholar] [CrossRef]
- Huang, X.; Teng, X.; Chen, D.; Tang, F.; He, J. The effect of the shape of mesoporous silica nanoparticles on cellular uptake and cell function. Biomaterials 2010, 31, 438–448. [Google Scholar] [CrossRef]
- Li, J.; Shen, S.; Kong, F.; Jiang, T.; Tang, C.; Yin, C. Effects of pore size on in vitro and in vivo anticancer efficacies of mesoporous silica nanoparticles. RSC Adv. 2018, 8, 24633–24640. [Google Scholar] [CrossRef]
- Mersmann, A.; Kind, M.; Stichlmair, J. Adsorption, Chromatography, Ion Exchange. In Thermal Separation Technology; Springer: Berlin/Heidelberg, Germany, 2011; pp. 483–560. [Google Scholar]
- Burton, G.W.; Ingold, K.U. Vitamin E: Application of the principles of physical organic chemistry to the exploration of its structure and function. Acc. Chem. Res. 1986, 19, 194–201. [Google Scholar] [CrossRef]
- Hartmann, M.; Vinu, A.; Chandrasekar, G. Adsorption of vitamin E on mesoporous carbon molecular sieves. Chem. Mater. 2005, 17, 829–833. [Google Scholar] [CrossRef]
- Weber, K.; Eichenauer, S.; Stadlbauer, E.; Schulten, M.-A.; Echterhof, T.; Kammann, C.; Schmidt, H.-P.; Gerlach, A.; Gerlach, H. Verwendung von Biomassekarbonisaten. In Biokohle; Quicker, P., Weber, K., Eds.; Springer: Wiesbaden, Germany, 2016; pp. 213–346. [Google Scholar] [CrossRef]
- Lao, E.J.; Mbega, E.R. Biochar as a feed additive for improving the performance of farm animals. Malays. J. Sustain. Agric. 2020, 4, 86–93. [Google Scholar] [CrossRef]
- Weiss, W.; Hogan, J.; Todhunter, D.; Smith, K. Effect of Vitamin E Supplementation in Diets with a Low Concentration of Selenium on Mammary Gland Health of Dairy Cows. J. Dairy Sci. 1997, 80, 1728–1737. [Google Scholar] [CrossRef]
- Khan, M.Z.; Ma, Y.; Xiao, J.; Chen, T.; Ma, J.; Liu, S.; Wang, Y.; Khan, A.; Alugongo, G.M.; Cao, Z. Role of Selenium and Vitamins E and B9 in the Alleviation of Bovine Mastitis during the Periparturient Period. Antioxidants 2022, 11, 657. [Google Scholar] [CrossRef]
- Schmidt, H.-P.; Hagemann, N.; Draper, K.; Kammann, C. The use of biochar in animal feeding. PeerJ 2019, 7, e7373. [Google Scholar] [CrossRef] [PubMed]
- Islam, M.M.; Ahmed, S.T.; Kim, Y.J.; Mun, H.S.; Yang, C.J. Effect of sea tangle (Laminaria japonica) and charcoal supplementation as alternatives to antibiotics on growth performance and meat quality of ducks. Asian-Australas. J. Anim. Sci. 2014, 27, 217–224. [Google Scholar] [CrossRef] [PubMed]
- EBC. Positivliste zulässiger Biomassen zur Herstellung von Pflanzenkohle; Ithaka Institute, Ed.; EBC: Arbaz, Switzerland, 2022. [Google Scholar]
- EBC. European Biochar Certificate-Richtlinien für die Zertifizierung von Pflanzenkohle; Ithaka Institute, Ed.; in 10.4G, 21.12.2024; EBC: Arbaz, Switzerland, 2024. [Google Scholar]
- GMP+. B Dokumente. Available online: https://www.gmpplus.org/feed-certification-scheme/about-the-scheme/ (accessed on 18 May 2025).
- Schimmelpfennig, S.; Glaser, B. One Step Forward toward characterization: Some important material properties to distinguish biochars. J. Environ. Qual. 2012, 41, 1001–1013. [Google Scholar] [CrossRef]
- Wiedenhoeft, A. Structure and function of wood. In Wood Handbook: Wood as an Engineering Material: Chapter 3; Centennial, Ed.; General Technical Report FPL; GTR-190; US Department of Agriculture, Forest Service, Forest Products Laboratory: Madison, WI, USA, 2010; Volume 190, pp. 3.1–3.18. [Google Scholar]
- Müller, B.R. Preparation and characterization of K2CO3-doped powdered activated carbon for effective in-vitro adsorption of deoxynivalenol. Bioresour. Technol. Rep. 2021, 15, 100703. [Google Scholar] [CrossRef]
- Webb, P.A.; Orr, C. Analytical Methods in Fine Particle Technology; Micromeritics Instrument Corporation: Norcross, GA, USA, 1997. [Google Scholar]
- Barrett, E.P.; Joyner, L.G.; Halenda, P.P. The Determination of Pore Volume and Area Distributions in Porous Substances. I. Computations from Nitrogen Isotherms. J. Am. Chem. Soc. 1951, 73, 373–380. [Google Scholar] [CrossRef]
- Chandrasekar, G.; Vinu, A.; Murugesan, V.; Hartmann, M. Adsorption of vitamin E on mesoporous silica molecular sieves. Stud. Surf. Sci. Catal. 2005, 158, 1169–1176. [Google Scholar] [CrossRef]
- Bono, A.; Ming, C.C.; Sundang, M. Liquid Phase Adsorption of α-Tocopherol by Activated Carbon. J. Appl. Sci. 2007, 7, 2080–2083. [Google Scholar] [CrossRef]
- Langmuir, I. The adsorption of gases on plane surfaces of glass, mica and platinum. J. Am. Chem. Soc. 1918, 40, 1361–1403. [Google Scholar] [CrossRef]
- Van Metre, D.C.; Callan, R.J. Selenium and vitamin E. Veter Clin. N. Am. Food Anim. Pract. 2001, 17, 373–402. [Google Scholar] [CrossRef]
- Duhem, N.; Danhier, F.; Préat, V. Vitamin E-based nanomedicines for anti-cancer drug delivery. J. Control. Release 2014, 182, 33–44. [Google Scholar] [CrossRef]
- Stangl, G. Mineralstoffe, Vitamine und sonstige Wirkstoffe. In Tierernährung; Kirchgessner, M., Stangl, G., Schwarz, F.J., Roth, F.X., Südekum, K.-H., Eds.; DLG Verlag: Frankfurt am Main, Germany, 2014; pp. 177–242. [Google Scholar]
- Yang, X.; Zhang, H.; Cheng, S.; Zhou, B. Optimization of the adsorption and removal of Sb(iii) by MIL-53(Fe)/GO using response surface methodology. RSC Adv. 2022, 12, 4101–4112. [Google Scholar] [CrossRef] [PubMed]
- Witte, F.; Smetana, S.; Heinz, V.; Terjung, N. High-pressure processing of usually discarded dry aged beef trimmings for subsequent processing. Meat Sci. 2020, 170, 108241. [Google Scholar] [CrossRef] [PubMed]
- Czepkowshi, T.; Słówko, W. Some limitations of surface profile reconstruction in scanning electron microscopy. Scanning J. Scanning Microsc. 1996, 18, 433–446. [Google Scholar] [CrossRef]
- Cetin, E.; Moghtaderi, B.; Gupta, R.; Wall, T. Influence of pyrolysis conditions on the structure and gasification reactivity of biomass chars. Fuel 2004, 83, 2139–2150. [Google Scholar] [CrossRef]
- Wildman, J.; Derbyshire, F. Origins and functions of macroporosity in activated carbons from coal and wood precursors. Fuel 1991, 70, 655–661. [Google Scholar] [CrossRef]
- Downie, A.; Crosky, A.; Munroe, P. Munroe, Physical properties of biochar. In Biochar for Environmental Management; Routledge: London, UK, 2015; pp. 45–64. [Google Scholar] [CrossRef]
- Byrne, C.; Nagle, D. Carbonized wood monoliths—Characterization. Carbon 1997, 35, 267–273. [Google Scholar] [CrossRef]
- McFarlane, Z.D.; Myer, P.R.; Cope, E.R.; Evans, N.D.; Bone, T.C.; Biss, B.E.; Mulliniks, J.T. Effect of biochar type and size on in vitro rumen fermentation of orchard grass Hay. Agric. Sci. 2017, 8, 316–325. [Google Scholar] [CrossRef]
- Gezahegn, S.; Sain, M.; Thomas, S.C. Variation in feedstock wood chemistry strongly influences biochar liming potential. Soil Syst. 2019, 3, 26. [Google Scholar] [CrossRef]
- Panwar, N.L.; Pawar, A.; Salvi, B.L. Comprehensive review on production and utilization of biochar. SN Appl. Sci. 2019, 1, 168. [Google Scholar] [CrossRef]
- Roberts, K.G.; Gloy, B.A.; Joseph, S.; Scott, N.R.; Lehmann, J. Life Cycle assessment of biochar systems: Estimating the energetic, economic, and climate change potential. Environ. Sci. Technol. 2010, 44, 827–833. [Google Scholar] [CrossRef]
- Agirre, I.; Griessacher, T.; Rösler, G.; Antrekowitsch, J. Production of charcoal as an alternative reducing agent from agricultural residues using a semi-continuous semi-pilot scale pyrolysis screw reactor. Fuel Process. Technol. 2013, 106, 114–121. [Google Scholar] [CrossRef]
- Maschio, G.; Koufopanos, C.; Lucchesi, A. Pyrolysis, a promising route for biomass utilization. Bioresour. Technol. 1992, 42, 219–231. [Google Scholar] [CrossRef]
- Cely, P.; Gascó, G.; Paz-Ferreiro, J.; Méndez, A. Agronomic properties of biochars from different manure wastes. J. Anal. Appl. Pyrolysis 2015, 111, 173–182. [Google Scholar] [CrossRef]
- Song, W.; Guo, M. Quality variations of poultry litter biochar generated at different pyrolysis temperatures. J. Anal. Appl. Pyrolysis 2012, 94, 138–145. [Google Scholar] [CrossRef]
- Wang, S.; Gao, B.; Zimmerman, A.R.; Li, Y.; Ma, L.; Harris, W.G.; Migliaccio, K.W. Physicochemical and sorptive properties of biochars derived from woody and herbaceous biomass. Chemosphere 2015, 134, 257–262. [Google Scholar] [CrossRef]
- Shaaban, A.; Se, S.-M.; Dimin, M.; Juoi, J.M.; Husin, M.H.M.; Mitan, N.M.M. Influence of heating temperature and holding time on biochars derived from rubber wood sawdust via slow pyrolysis. J. Anal. Appl. Pyrolysis 2014, 107, 31–39. [Google Scholar] [CrossRef]
- Mukome, F.N.D.; Zhang, X.; Silva, L.C.; Six, J.; Parikh, S.J. Use of chemical and physical characteristics to investigate trends in biochar feedstocks. J. Agric. Food Chem. 2013, 61, 2196–2204. [Google Scholar] [CrossRef]
- Zeng, K.; Minh, D.P.; Gauthier, D.; Weiss-Hortala, E.; Nzihou, A.; Flamant, G. The effect of temperature and heating rate on char properties obtained from solar pyrolysis of beech wood. Bioresour. Technol. 2015, 182, 114–119. [Google Scholar] [CrossRef]
- Zhang, T.; Walawender, W.; Fan, L.; Fan, M.; Daugaard, D.; Brown, R. Preparation of activated carbon from forest and agricultural residues through CO2 activation. Chem. Eng. J. 2004, 105, 53–59. [Google Scholar] [CrossRef]
- Tripathi, M.; Sahu, J.; Ganesan, P. Effect of process parameters on production of biochar from biomass waste through pyrolysis: A review. Renew. Sustain. Energy Rev. 2016, 55, 467–481. [Google Scholar] [CrossRef]


| Mesopore Class (nm) | r | r2 | r2adj | Function |
|---|---|---|---|---|
| 2.58 to 3.22 | 0.907 | 0.822 | 0.800 | f(x) = −24.614 + 9.163x |
| 3.22 to 4.03 | 0.954 | 0.910 | 0.899 | f(x) = −12.182 + 8.925x |
| 4.04 to 5.16 | 0.952 | 0.907 | 0.895 | f(x) = −0.547 + 8.127x |
| 5.16 to 6.92 | 0.923 | 0.853 | 0.834 | f(x) = 4.817 + 8.320x |
| 6.92 to 10.26 | 0.904 | 0.818 | 0.795 | f(x) = 10.445 + 9.510x |
| 10.26 to 20.01 | 0.887 | 0.787 | 0.761 | f(x) = 13.327 + 11.834x |
Disclaimer/Publisher’s Note: The statements, opinions and data contained in all publications are solely those of the individual author(s) and contributor(s) and not of MDPI and/or the editor(s). MDPI and/or the editor(s) disclaim responsibility for any injury to people or property resulting from any ideas, methods, instructions or products referred to in the content. |
© 2025 by the authors. Licensee MDPI, Basel, Switzerland. This article is an open access article distributed under the terms and conditions of the Creative Commons Attribution (CC BY) license (https://creativecommons.org/licenses/by/4.0/).
Share and Cite
Witte, F.; Dinh, N.H.A.; Juadjur, A.; Heinz, V.; Visscher, C.; Weiss, J.; Terjung, N. Investigation of Biochars in Terms of Vitamin E Adsorption Capacity. Appl. Sci. 2025, 15, 5983. https://doi.org/10.3390/app15115983
Witte F, Dinh NHA, Juadjur A, Heinz V, Visscher C, Weiss J, Terjung N. Investigation of Biochars in Terms of Vitamin E Adsorption Capacity. Applied Sciences. 2025; 15(11):5983. https://doi.org/10.3390/app15115983
Chicago/Turabian StyleWitte, Franziska, Ngoc Huyen Anh Dinh, Andreas Juadjur, Volker Heinz, Christian Visscher, Jochen Weiss, and Nino Terjung. 2025. "Investigation of Biochars in Terms of Vitamin E Adsorption Capacity" Applied Sciences 15, no. 11: 5983. https://doi.org/10.3390/app15115983
APA StyleWitte, F., Dinh, N. H. A., Juadjur, A., Heinz, V., Visscher, C., Weiss, J., & Terjung, N. (2025). Investigation of Biochars in Terms of Vitamin E Adsorption Capacity. Applied Sciences, 15(11), 5983. https://doi.org/10.3390/app15115983