Abstract
Phosphogypsum leachate significantly accelerates carbonate rock dissolution in karst regions. The dissolution mechanism of phosphogypsum leachate associated with carbonate rock interaction and the corresponding numerical simulation need further study. In this study, 3D digital core imaging was used to scan undisturbed carbonate rock specimens from phosphogypsum landfill sites, and corresponding 3D structural models were constructed. We carried out indoor dissolution experiments in which we used Scanning Electron Microscopy as well as Energy Dispersive Spectrometer to observe changes in the surface micromorphology and elemental content of the rock specimens under different dissolution conditions. A reactive numerical model was developed based on the 3D structural model obtained from 3D digital core imaging, and numerical simulation studies were conducted. The dissolution reaction between phosphogypsum leachate and carbonate rocks exhibited an initial rapid phase followed by gradual stabilization. The pH of the leachate showed an exponential negative correlation with the dissolution amount per unit area of the rock specimens, while a power-law negative correlation was observed between pH and chemical dissolution rates. The numerical model effectively reproduced the reactant concentration states observed in experiments, confirming its capability to simulate reaction processes within rock specimens. Simulation results demonstrated that preferential flow through fracture channels led to higher reactant concentrations near fractures due to incomplete reactions, whereas lower concentrations occurred in sub-fracture regions. As the fracture aperture increased, the concentration disparity between these regions became more pronounced, with higher concentration of reactants at the outlet.
1. Introduction
Phosphogypsum leachate significantly accelerates carbonate rock dissolution in karst regions [1,2,3]. Despite global reliance on landfill disposal for phosphogypsum waste management, frequent leakage incidents from storage sites have been documented to accelerate carbonate rock dissolution [4,5,6], thereby compromising the geological integrity of karst terrains [7]. This process fundamentally arises from the evolution of geotechnical structures and hydrochemical compositions [8,9], which alter water–rock interaction mechanisms by exacerbating heterogeneity in both hydrodynamic parameters (e.g., flow rate, velocity) and solute transport processes (chemical component distribution) [10,11,12]. To systematically investigate these phenomena, this study integrates experimental investigations with numerical simulations, which in recent years have proven effective in characterizing a range of geological dynamics [13].
The evolution of carbonate rock dissolution constitutes a complex, multi-process coupled system involving fluid percolation, solute transport and diffusion, and multiphase chemical reactions at mineral–fluid interfaces [14]. Extensive research has been conducted through static and dynamic dissolution experiments to investigate macro-/microstructural evolution and physico-mechanical property alterations in rocks under varying chemical and coupled field conditions [15,16]. In this field, researchers employ diverse methodologies: Scanning Electron Microscopy (SEM) [17,18], computed tomography with digital image processing (CT) [19,20,21], Raman spectroscopy [22,23], and nuclear magnetic resonance (NMR) techniques [24,25]. These investigations have yielded insights into acetic acid–carbonate reaction dynamics [26], fractal characteristics of karst morphologies [27], dissolution rate quantification [28], and kinetic model development [29]. Notably, most existing carbonate dissolution experiments [30,31,32] under reservoir conditions employ plug-flow [33] or rotating disk reactors [34]. These setups primarily replicate surface-mediated reactions. However, these surface-focused approaches fail to replicate the intrinsic petrogenetic processes in which acidic fluids migrate through pore networks characterized by hydrodynamically constrained pathways or conditions. Extensive research on factors influencing chemical dissolution processes has demonstrated that carbonate rock dissolution rates exhibit strong dependencies on solution pH, chemical composition [35,36], lithology (mineralogical constitution) [37], structural characteristics, CO2 partial pressure [38], temperature, and hydrodynamic conditions. Experimental studies [39,40] demonstrate that pH critically controls carbonate dissolution rates. Kinetic analysis of dolomite dissolution [41] reveals limestone’s faster reaction kinetics compared to dolomite, necessitating strict mineralogical control in this study. Acetic acid-based dissolution experiments on four carbonate types show inverse temperature dependence and positive pressure correlation for dissolution efficiency, with temperature exerting greater influence than pressure [42]. Consequently, our experimental design incorporates pressure modulation while maintaining temperature constraints.
Building upon previous experimental findings, this study combines physical experimentation and numerical simulations to investigate the mechanism of interaction between phosphogypsum leachate and fractured carbonate rock. Unlike conventional surface reaction simulations, our approach incorporates critical factors influencing dissolution (e.g., fracture aperture variations) while systematically quantifying phosphogypsum–carbonate dissolution characteristics under different geochemical conditions. This methodology thereby provides more realistic representations of subsurface reactive transport processes compared to idealized surface reaction models.
This study consists of two main components: (1) physical experimentation and numerical modeling framework establishment, and (2) dissolution mechanism analysis. The first part focuses on static/dynamic dissolution experiment designs and numerical model setup (initial conditions, boundary constraints). The second part clarifies the reaction mechanisms between phosphogypsum leachate and carbonate rocks, with experimental data and simulations cross-validated to confirm results reliability.
2. Materials and Methods
2.1. Experimental Material
2.1.1. Carbonate Rock
All rock specimens used in the experiment were Nanling Formation limestone, obtained from core specimens of the same stratum at a depth of 30–50 m in an industrial solid waste landfill. The specimens were selected for their relatively intact condition, with a height exceeding 30 mm and differing only in fracture aperture. The overall color of the rock specimens ranged from grayish-white to grayish-black, and they exhibited a microcrystalline structure. On the surface of the rocks, small areas of yellowish-brown weathering could be observed, likely caused by long-term natural erosion and oxidation, which altered the color of certain parts of the rock surface. Additionally, the rocks contained numerous calcite veins, with apertures ranging from 1–5 mm, which appeared as distinct linear patterns within the rock. Figure 1 illustrates some of the rock specimen: (a) shows the specimen with fracture apertures of 0.6 ~0.2 mm, (b) shows the specimen with fracture apertures of 0.2~0.05 mm, and (c) shows the specimen with fracture apertures of 0.05~0.01 mm.

Figure 1.
Limestone specimens with varying fracture apertures used in dissolution experiments (fracture aperture ranges: 0.2–0.6 mm for Specimen (a), 0.05–0.2 mm for (b), and 0.01–0.05 mm for (c)).
The rock specimens were analyzed using an X-ray Diffractometer (XRD, DX-2700, Dandong Haoyuan Instrument Co., Ltd., Dandong, China). To minimize the impact of subjective factors on the analysis results of rock specimen mineral composition during XRD analysis, a Scanning Electron Microscopy (SEM, SU8010, Hitachi, Tokyo, Japan) equipped with an Energy Dispersive Spectrometer (EDS) was used to analyze the chemical composition of the rock specimens (see Table 1). The mineral composition of the rocks was then determined by combining the EDS analysis results with the XRD analysis results, as shown in Table 2. After measurement, it was found that the main component of all collected rock specimens is calcite, with the proportion of CaCO3 ranging from 60% to 69%.

Table 1.
The EDS analysis results.

Table 2.
Mineral composition analysis table.
2.1.2. Phosphogypsum Leachate
The collected phosphogypsum leachate was placed in a refrigerator for low-temperature storage, and 300 mL of leachate was removed and sent to the testing center to determine the concentration of pH, Ca2+, Mg2+, total P, SO42−, F−, PO43−, and TDS. The test results are shown in Table 3.

Table 3.
Results of ion concentration tests in phosphogypsum leachate.
According to the results of ion concentration tests in phosphogypsum leachate, the phosphogypsum leachate obtained from the field is acidic. The concentrations of calcium ions, total P, and sulfate radicals in the solution are very high, and it also contains a certain amount of fluoride ions. Therefore, this paper focuses mainly on the concentrations of the above four substances.
2.2. Physical Experiment
2.2.1. Static Dissolution Experiments
Due to the limitations of natural conditions and indoor experimental conditions, the experiments were conducted in a closed indoor environment at 20 °C. Before the start of the experiment, rock specimens with different fracture widths were cut and polished, and a total of six specimens were prepared. Acid solutions with pH gradients of 2, 3, and 4 were prepared using 36% HCl dripped into the phosphogypsum leachate collected from the field. These solutions were then poured into six beakers, each with a capacity of 5000 mL. Among them, one beaker contained solution with pH 4, one beaker contained solution with pH 3, and four beakers contained solution with pH 2, making a total of six beakers. The duration of the static corrosion experiment was set to 30 days, and the experimental conditions are shown in Table 4. Notably, in static dissolution experiments, reactions between phosphogypsum leachate and carbonate rock stabilize within 30 days, enabling systematic analysis of dissolution characteristics. After 30 days of reaction, parameter variations diminish to marginal rates, rendering mechanistic trends statistically indistinguishable and insufficient for extrapolating dissolution dynamics. Therefore, the experimental duration was set to 30 days. A tiered monitoring strategy was adopted: high-frequency sampling and measuring during the preliminary stage (Days 0–2) captured critical value transitions, followed by reduced measurement frequency (Days 2–30) to track equilibrium trends as the system approached steady-state conditions.

Table 4.
Static dissolution experimental conditions.
In addition to the above two groups of experiments, a control group was also set up, also using carbonate rocks as specimens, with distilled water as solution.
2.2.2. Dynamic Dissolution Experiments
In a closed indoor space with the temperature controlled at 20 °C, dynamic dissolution experiments were conducted on six rock specimens with different fracture apertures using a homemade acrylic cylindrical mold reactor device. The experiments were divided into six groups.
Unlike the static dissolution experiment conditions mentioned above, the dynamic dissolution experiments introduced hydrodynamic conditions to the solution, with a pressure differential of 0.1 MPa between the inlet and outlet. The duration of the dynamic dissolution experiment was set to 15 days, and the experimental conditions are shown in Table 5. It should be noted that in dynamic dissolution experiments, extending the reaction beyond 15 days causes fracturing of rock specimens, resulting in loss of cylindrical integrity. This structural degradation compromises systematic analysis of reactive transport mechanisms governing percolating fluids within fractures and pores. Consequently, the experimental duration was limited to 15 days. To ensure data reliability, a monitoring strategy combining high-frequency sampling and measuring during the preliminary stage (Days 0–2) with progressively reduced measurement intervals (Days 2–15) was implemented for periodic parameter quantification.

Table 5.
Dynamic dissolution experimental conditions.
The equipment for this indoor dissolution experiment includes several 5000 mL beakers and an acrylic cylindrical mold reactor device. In the static dissolution experiment, phosphogypsum percolate and rock specimens were placed in beakers for reaction. In the dynamic dissolution experiment, phosphogypsum percolate and rock specimens were reacted in the acrylic cylindrical mold reactor device. The device (BT100-2J, Dichuang Technology Co., Ltd., Chengdu, China) is shown in Figure 2. It mainly consists of an adjustable peristaltic pump, a pressure gauge, a homemade acrylic cylindrical mold, and silicone tubes. The homemade acrylic cylindrical mold is made of acrylic sheet, also known as polymethyl methacrylate (PMMA), which has good light transmission, high plasticity, acid and alkali resistance, and strong ageing resistance. The acrylic cylindrical mold has an inner diameter of 8.5 cm, an outer diameter of 9.5 cm, and a wall thickness of 1 cm. The silicone tube has an inner diameter of 0.32 cm, an outer diameter of 0.64 cm, and a wall thickness of 0.16 cm. Both the inlet on the left side and the outlet on the right side of the acrylic cylindrical mold can be opened, allowing easy access to specimens with a diameter of approximately 85 mm.
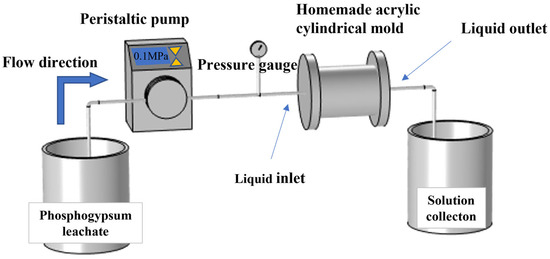
Figure 2.
Dynamic dissolution experimental setup, comprising an adjustable peristaltic pump, pressure gauge, homemade acrylic cylindrical mold, and silicone tubing.
2.3. Calculation Method of Dissolution Evaluation Parameters
To quantitatively reflect the dissolution process and characteristics, the following four parameters are involved: rock dissolution amount per unit area, dissolution rate, chemical dissolution rate, and the relative change rate of fracture aperture. The formulas are as follows:
(1) Dissolution amount per unit area
Dissolution amount per unit area refers to the mass or volume of rock lost due to dissolution per unit area. It is an important indicator that reflects the dissolution speed and intensity of rock specimens under experimental conditions [43], expressed as follows:
where K is the dissolution amount per unit area [g/cm2], shows the mass of the rock specimen before dissolution [g], refers the mass of the rock specimen after dissolution [g], and S is the surface area of the rock specimen [cm2].
(2) Dissolution rate
The dissolution of rocks by acid is characterized by the amount of rock that can be dissolved by the acid solution, which is expressed as the dissolution rate. Under different pH conditions, the dissolution rates of different lithologies vary. Through this static and dynamic dissolution experiment, we can understand the size of the dissolution rate of phosphogypsum leachate on carbonate rock, as well as analyze the dissolution capacity of phosphogypsum leachate on carbonate rock. The dissolution rate is one of the methods to quantitatively evaluate the characteristics of this dissolution reaction:
where W1 shows the mass of the drying specimen before the experiment [g], and W2 is the mass of the drying specimen after the experiment [g].
(3) The chemical dissolution rate
The chemical dissolution rate R serves as a quantitative indicator of the solubility strength of carbonate rocks [44], and is given by the following:
where R shows the chemical dissolution rate of the main minerals in carbonate rocks [mg/(s·L)], X gives the content of Ca2+ in the dissolution solution [mg/L], Y shows the content of Mg2+ in the dissolution solution [mg/L], t is the time of dissolution action [s]. For ease of subsequent calculations and plotting, this study converts the unit of R to mg/(d∙L) (where 1 d = 86,400 s).
(4) The relative change rate of fracture aperture
The relative change rate of fracture aperture can be used to express the relative change degree of rock specimen fracture aperture before and after the experiment, which is a dimensionless parameter:
where is relative change rate of fracture aperture; shows the initial average fracture aperture [mm], is the measured average aperture at the end of the reaction [mm].
2.4. Numerical Simulation
2.4.1. Control Equations
The governing equations for mass conservation and Darcy flux are expressed as follows:
where t is the time [s], denotes the porosity, is the liquid density [kg/m3], shows the reaction source [kg/(m3·s)], k gives the permeability [m2], represents the leachate kinetic viscosity [MPa·s], and is the pressure differential, which in this study is 0.1 MPa, u shows Darcy flux [m/s2]. k and are from geotechnical tests and engineering reports.
The governing equation for diluted solute transport through porous media is expressed as follows:
where is the liquid density [kg/m3], C equals the concentration of the substance [mol/m3], t is time [s], v is the velocity vector of the leachate [m/s], D is diffusion coefficient [m2/s], R shows the reaction source [mol(m3·s)].
2.4.2. Initial and Boundary Conditions
This numerical simulation study focuses on the transport and transformation processes of selected reactive species (HF, H2SO4) in phosphogypsum leachate under dynamic dissolution conditions. The anisotropic flow behavior in fractured rock masses is primarily controlled by fracture network characteristics. Considering the substantial variations in fracture orientation, density, and connectivity among different rock specimens, we systematically selected specimens with nearly identical fracture attributes (including quantity, spatial distribution, and developmental direction) for dynamic dissolution experiments to ensure analytical consistency. This selection protocol justified the exclusive use of the HY10 specimen for subsequent numerical modeling. While pH variations influence reaction kinetics, they do not fundamentally modify solute transport mechanisms within the rock matrix. Consequently, the numerical simulations specifically addressed phosphogypsum leachate–carbonate rock dissolution interactions under pH = 2 conditions.
The HY10 rock specimen was imaged using a multi-scale high-resolution X-ray 3D digital core imaging system (X-CT, NanoVoxel4561, Sanying Precision Instruments Co., Ltd., Tianjin, China). The reconstructed 3D fracture model generated through Avizo’s image processing pipeline was subsequently exported in STL formats. These files were then imported into COMSOL Multiphysics (version 6.2) to establish a refined fracture mesh model. But the mesh model contained excessive mesh elements with incomplete curves and unclosed geometries, preventing direct conversion into a physical model. To address this, the fracture model was simplified. The rock specimen’s fracture parameters, including average fracture aperture (0.50 mm), dominant fracture orientation, and cumulative fracture length, were quantified using the Label Analysis module in Avizo software (version 2020.1). The original complex fracture network was replaced with five rectangular thin plates whose apertures matched the measured average value (0.50 mm), with identical spatial orientations and positions. A cylindrical host rock measuring 85 mm in diameter and 30 mm in height, consistent with the actual specimen dimensions, was then incorporated. By varying the plate thickness while maintaining aperture consistency, three models with fracture apertures of 0.20 mm, 0.50 mm, and 0.05 mm were established. Gravitational effects were excluded from all simulations. The cylindrical rock specimen model’s top surface was assigned as the inflow boundary (pressure inlet), and the bottom surface was designated as the outflow boundary (pressure outlet).
Fine hierarchy in COMSOL Multiphysics was selected based on a balanced consideration of average mesh quality and solver performance, prioritizing optimal trade-offs between numerical accuracy and computational efficiency. The meshing strategy employs a physics-controlled mesh generation approach, where the software automatically generates the computational grid based on predefined boundary conditions of the Darcy flow field and solute concentration field.
The model parameters were primarily derived from geotechnical experimental data, engineering reports, and empirical correlations. In COMSOL Multiphysics, the pH value and temperature were defined as global parameters, set to 2 and 293.15 K, respectively, under the Global Definitions node to establish consistent environmental conditions throughout the model. For the Darcy flow field configuration, the permeability (k), porosity (), and specific storativity () were adopted from Table 6, while other hydrodynamic parameters utilized standard water properties from the COMSOL Multiphysics material library, neglecting the physicochemical discrepancies between phosphogypsum leachate and deionized water.

Table 6.
Seepage calculation parameters table.
The reaction rates for chemical species must be configured within the Dilute Species Transport interface. Given that the pH of phosphogypsum leachate in our experiments varied within the range of 2–7, and considering only the first dissociation step of phosphoric acid, the dissolution interactions between phosphogypsum leachate and carbonate rock primarily involve three key chemical reactions,
the quantification of reaction parameters was achieved through ion concentration measurements conducted prior to and at specific intervals during the dynamic dissolution experiments. The inflow concentration of Ca2+ was determined as 7.73 mol/m3, with the overall average dissolution rate of CaCO3 in phosphogypsum leachate reaching 2.13 × 10⁻⁴ mol/(m3·s). Concurrently, the HF inflow concentration measured 0.6147 mol/m3, exhibiting an average reaction rate of 2.51 × 10⁻⁶ mol/(m3·s). For H2SO4, the inflow concentration was recorded at 18.62 mol/m3, with its average reaction rate calculated as 9.17 × 10⁻⁵ mol/(m3·s) using the empirical formula cited in references [45,46]. These derived values provide critical inputs for constraining the geochemical reaction kinetics in subsequent numerical simulations. The other initial and boundary conditions are organized in Table 7.
CaCO3 + H2SO4 ⇌ CaSO4 + H2O + CO2↑
CaCO3 + 2HF ⇌ CaF2 + H2O + CO2↑
CaCO3 + 2H3PO4 ⇌ Ca(H2PO4)2 + H2O + CO2↑

Table 7.
Initial and boundary conditions.
3. Analysis and Discussion
3.1. Characteristics of Surface Micro-Morphological Changes
Figure 3 shows micro-morphological changes of rock specimens before and after reaction under different pH conditions. Macroscopic observations revealed distinct dissolution patterns: specimens from static dissolution experiments exhibited minimal surface alteration, primarily manifesting as slight color lightening, whereas dynamic dissolution specimens showed pronounced morphological changes, particularly in the HY10 specimen with the largest fracture aperture, where protruded particles, intensive etching pits, and dissolution striations developed along fracture margins.

Figure 3.
Micro-morphological changes of rock specimens before and after reaction under different pH conditions (HY01-HY03 in static experiments, HY07-HY09 in dynamic experiments). These SEM images captured at 1.00 k magnification.
Microscopic analysis further corroborated enhanced dissolution under hydrodynamic conditions. Pre-experiment specimens displayed intact mineral grains with well-defined polyhedral crystal boundaries and tightly packed micro-lamination structures. Post-static dissolution, the HY03 specimen exhibited the most severe micro-scale degradation among static groups, featuring fragmented crystal integrity and dense etching pits. In contrast, the dynamically treated HY09 specimen, despite only 15 days of reaction, demonstrated catastrophic surface erosion: complete obliteration of primary grain boundaries, extensive leaching of soluble components leaving insoluble skeletal frameworks, and pervasive micro-fracture networks.
EDS analysis (as summarized in Table 8) revealed a systematic increase in surface oxygen content across all specimens, with static dissolution experiments demonstrating a more pronounced enhancement compared to dynamic dissolution counterparts.

Table 8.
Surface oxygen content of each specimen before and after the experiment.
3.2. Characteristics of Changes in Dissolution Amount per Unit Area and Dissolution Rate
As demonstrated in Figure 4, the dissolution amount per unit area and dissolution rate both exhibit a positive correlation with increasing acidity of phosphogypsum leachate, indicating enhanced carbonate rock dissolution under more acidic conditions. In static experiments, comparative analyses of specimens with varying fracture apertures at identical pH revealed a distinct inverse relationship between fracture aperture and dissolution intensity, following the order HY04 < HY05 < HY06. This phenomenon may be attributed to the preferential accumulation of flocculent reaction precipitates within narrow fractures and pores, which artificially inflates measured specimen mass through pore-clogging effects. Conversely, the dynamic experiments demonstrated that larger fracture apertures resulted in higher dissolution amounts per unit area and higher dissolution rates in the rock specimens.
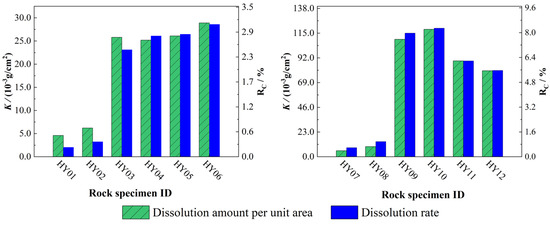
Figure 4.
Dissolution amount per unit area and dissolution rate for each rock specimen. Static dissolution group (HY01−HY06): HY01–HY03 with different pH; HY04−HY06 with identical pH and different fracture apertures. Dynamic dissolution group (HY07−HY12): HY07−HY09 with different pH; HY10−HY12 with identical pH and different fracture apertures.
Comparative analysis of dissolution amounts per unit area between static dissolution and dynamic dissolution experimental results (Table 9) revealed that under identical pH conditions and fracture apertures, rock specimens subjected to 15-day dynamic dissolution exhibited 10- to 15-fold higher areal dissolution values compared to those from 30-day static experiments. This significant disparity quantitatively demonstrates that hydrodynamic conditions substantially enhance carbonate rock dissolution intensity relative to stagnant systems, with advective solute transport mechanisms dominating the accelerated dissolution processes.

Table 9.
Dissolution amount per unit area for selected rock specimens.
3.3. Characterization of Fracture Aperture Changes
The average fracture aperture of each specimen was quantified before and after experiments using X-CT, and the relative fracture aperture variation rates were calculated and plotted in Figure 5.

Figure 5.
Relative change rate of fracture aperture (HY01~HY06 in static experiments, HY07~HY012 in dynamic experiments).
Both static and dynamic dissolution experiments exhibited similar trends in fracture aperture variation rates. Higher initial acidity of the phosphogypsum leachate correlated with greater relative aperture variation rates, while specimens with larger initial fracture apertures demonstrated higher post-reaction variation magnitudes. Notably, dynamic experiments yielded systematically higher aperture variation rates than static experiments, conclusively demonstrating that dissolution intensity under hydrodynamic conditions significantly exceeds that in stagnant systems.
3.4. Characterization of Changes in Phosphogypsum Leachate
3.4.1. Characterization of pH Changes
The experiments monitored pH variations in the leachate, generating characteristic pH evolution curves over time under different initial pH conditions (Figure 6). The time in the graph represents the time from the discovery of the lysate in the outlet section of the reactor. Specimens HY10, HY11, and HY12 required 2 h, 4 h, and 5 h, respectively, to reach leachate breakthrough, while other specimens exhibited comparable breakthrough times (2–3 h) (where 1 d = 24 h).
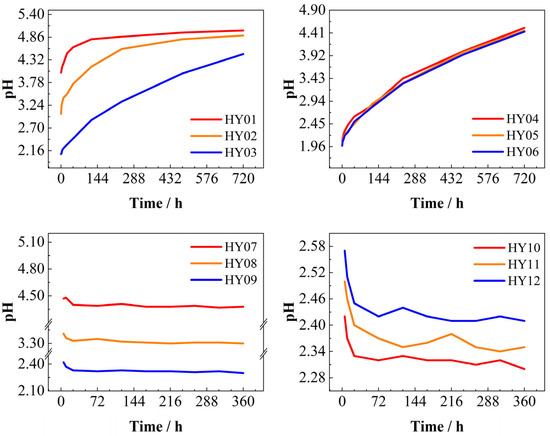
Figure 6.
pH vs. time. Static dissolution group (HY01–HY06): HY01–HY03 with different pH; HY04–HY06 with identical pH and different fracture apertures. Dynamic dissolution group (HY07–HY12): HY07–HY09 with different pH; HY10–HY12 with identical pH and different fracture apertures.
In static dissolution experiments, higher initial acidity of the phosphogypsum leachate correlated with extended effective reaction durations, prolonged equilibrium attainment times, and greater pH increases. This occurred due to progressive H+ ion consumption during acid–carbonate neutralization, which elevated pH over time. Notably, fracture aperture exerted negligible influence on dissolution rates in static systems.
Conversely, dynamic dissolution experiments demonstrated pH decreases throughout the reaction period, opposing the static trend. Leachates with higher initial acidity exhibited more pronounced pH declines. Additionally, smaller fracture apertures amplified pH variation magnitudes, extended stabilization periods, and resulted in higher stabilized pH values compared to wider apertures.
3.4.2. Characterization of TDS Changes
Figure 7 illustrates the variation of TDS over time. In static dissolution experiments employing phosphogypsum leachate at pH = 2, TDS exhibited an initial rapid decline followed by stabilization, a pattern attributed to accelerated H+-carbonate mineral reactions causing ionic depletion during the early stage, succeeded by reaction rate decay and ion-exchange equilibrium. Contrastingly, systems at pH = 3–4 demonstrated V-shaped TDS trajectories: an initial decrease succeeded by a gradual rebound. Notably, the inflection point marking the transition from TDS decline to recovery occurred earlier under pH = 4 conditions compared to pH = 3, indicating accelerated geochemical transformations in higher-pH environments. Higher initial acid concentrations in closed systems led to faster depletion of reactive acids and lower subsequent reaction rates [47]. This TDS reversal mechanism suggests early-stage H+ consumption and common-ion effects suppress Ca2+ dissolution, while later CO2 dissolution promotes HCO3− accumulation.
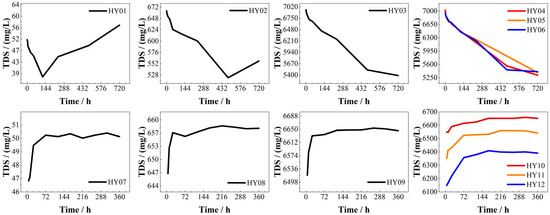
Figure 7.
TDS vs. time (HY01~HY06 on static experiments, HY07~HY12 on dynamic experiments).
Conversely, dynamic dissolution experiments showed opposing TDS evolution patterns characterized by an initial rapid increase followed by stabilization. Higher initial leachate pH enhanced TDS variation magnitudes, while smaller fracture apertures prolonged stabilization periods, reduced stabilized TDS values, and amplified cumulative TDS fluctuations compared to wider apertures.
3.4.3. Characteristics of Changes in Ca2+, SO42−, F−, and Total P Concentrations
Figure 8 delineates changes in the concentration of each ion. In static dissolution experiments, lower initial pH values of phosphogypsum leachate correlated with greater increases in Ca2+ concentrations and more pronounced decreases in F− concentrations as the reaction progressed. Concurrently, SO42− and total phosphorus concentrations stabilized but exhibited an overall declining trend, likely attributable to calcium sulfate precipitation (gypsum) from sulfuric acid–calcium carbonate reactions. The positively charged surfaces of calcium sulfate and calcium fluoride precipitates may electrostatically adsorb negatively charged ions, forming surface complexes characterized by P-O-Ca bonding. Additionally, partial incorporation of dihydrogen phosphate ions into the crystal lattice during gypsum growth could further contribute to phosphorus retention.
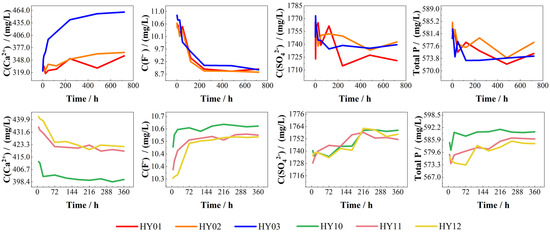
Figure 8.
Changes in the concentration of each ion (HY01−HY03 on static experiments, HY10−HY12 on dynamic experiments).
Conversely, dynamic dissolution experiments demonstrated inverted ion concentration trends relative to static conditions: Ca2+ concentrations decreased while F− concentrations increased over time. Specimens with smaller fracture apertures required extended durations to reach concentration stabilization, and higher initial leachate acidity amplified concentration variations for both Ca2+ and F−. SO42− and total P concentrations showed minimal fluctuations, gradually increasing throughout the experiments.
3.5. Discussion
3.5.1. Relationship Between Conductivity, pH, and Chemical Dissolution Rate
The chemical dissolution rates of carbonate rocks are significantly influenced by external environmental conditions. In static dissolution experiments conducted with phosphogypsum leachate at an initial pH of 2, post-reaction analyses quantified Ca2+ and Mg2+ concentrations in the leachate and calculated chemical dissolution rates for each rock specimen (Table 10). Liu et al. [48] established a linear correlation between solution electrical conductivity (EC) and calcium ion content. Subsequent analysis of post-static dissolution leachates revealed a strong dependence of electrical conductivity on C(Ca2+), as evidenced by the positive correlation between these parameters in Figure 9. Conversely, an inverse relationship was observed between electrical conductivity and C(Mg2+).

Table 10.
Electrical conductivity and chemical dissolution rate.
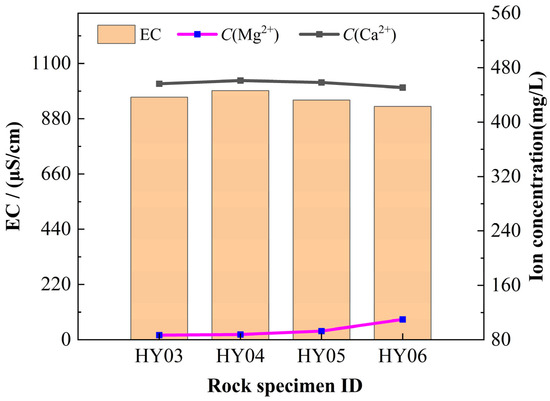
Figure 9.
Electrical conductivity, C(Ca2+) and C(Mg2+) concentration. Specimens HY03–HY06 under static dissolution conditions: identical pH (2.0) with varying fracture apertures.
Throughout the rock dissolution process, the continuous ionization of H+ from phosphogypsum leachate drives chemical reactions with carbonate minerals, consuming substantial H+ ions while releasing newly generated ions into the solution. These dynamic ionic exchanges critically modulate the leachate’s electrical conductivity, thereby regulating the dissolution kinetics between phosphogypsum leachate and carbonate rocks. Linear regression analysis of electrical conductivity versus chemical dissolution rates across four experimental groups revealed a positive correlation, with dissolution rates increasing proportionally to conductivity (slope = 0.08323). The linear fitting results are presented in Figure 10a.
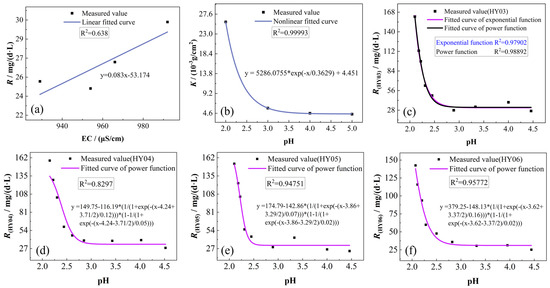
Figure 10.
Fitting analysis: (a) electrolyte conductivity vs. the chemical dissolution rate; (b) pH vs. dissolution amount per unit area; (c–f) pH vs. the chemical dissolution rate.
3.5.2. Relationship Between pH and Chemical Dissolution Rate
Fitting analysis of dissolution per unit area for three rock specimens under static dissolution conditions across varying acidity levels of phosphogypsum leachate revealed an exponential relationship between leachate pH and areal dissolution rates. As illustrated by the fitted equations in Figure 10b, the dissolution per unit area decreased progressively with increasing leachate pH, exhibiting a diminishing rate of decrease that asymptotically approached stability at higher pH values.
To investigate whether an exponential relationship exists between pH and chemical dissolution rates, we conducted statistical analysis of pH variations and corresponding dissolution rates under leachate conditions with initial pH = 2. The results demonstrated a rapid initial decline in dissolution rates with increasing pH, followed by progressive stabilization. Comparative fitting of experimental data using both power function (Asym2Sig model) and exponential functions revealed superior correlation coefficients for the power function model (Figure 10c), indicating that the pH-dissolution rate relationship adheres more closely to the Asym2Sig power-law formulation. Further validation through analogous fitting analyses across multiple leachate pH groups (Figure 10d–f) consistently yielded high correlation coefficients, confirming the generalized applicability of the power function in describing these geochemical interactions.
3.5.3. Influence of the Presence or Absence of Hydrodynamic Conditions on Dissolution Effects
Significant disparities in dissolution efficacy were observed between static and dynamic experimental conditions. Comparative analysis of chemical dissolution rates at 24 h post-experiment initiation revealed that dynamic systems consistently exhibited 7.37–12.26 times higher rates than static systems across varying initial leachate pH levels (2~4), with the discrepancy amplifying under lower pH conditions, as demonstrated in Figure 11.
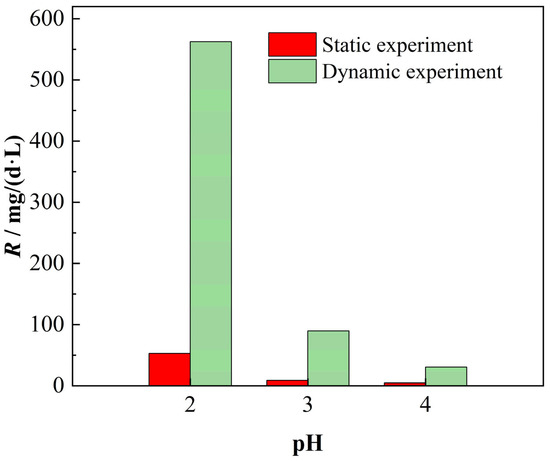
Figure 11.
Chemical dissolution rates with and without hydrodynamic conditions.
The pronounced disparity in chemical dissolution rates between static and dynamic experimental conditions arises from three interconnected mechanisms. Primarily, the transition to hydrodynamic conditions facilitates enhanced leachate penetration into rock pores and fractures, substantially expanding reactive interfacial areas between H+ ions and carbonate mineral surfaces, thereby accelerating dissolution kinetics. Additionally, the intensified dissociation of weak acids (e.g., hydrofluoric acid, phosphoric acid) under dynamic flow elevates leachate H+ concentrations, further amplifying proton-driven dissolution processes. Crucially, hydrodynamic forcing induces advective mass transport dominance, which dramatically enhances H+ delivery efficiency to reactive sites through accelerated convective transfer, synergistically elevating overall dissolution rates. This mechanistic cascade explains the order-of-magnitude enhancement in chemical dissolution rates observed under dynamic conditions compared to static systems.
3.6. Numerical Simulation Results
Post-simulation analyses yielded fracture-specific volumetric flow rates through cross-sectional integration: 3.15 × 10⁻⁶ m3/h for the 0.50 mm aperture model, 1.58 × 10⁻⁶ m3/h for the 0.20 mm model, and 1.26 × 10⁻⁶ m3/h for the 0.05 mm model.
The temporal evolution of bottom-surface Ca2+ concentrations is detailed in Figure 12. The 0.50 mm aperture model achieved concentration stabilization (9.98 mol/m3) at 27 h, consistent with dynamic dissolution experimental results. Similarly, the b = 0.20 mm and b = 0.05 mm models stabilized at 10.48 mol/m3 (60 h) and 10.6 mol/m3 (68 h), respectively, aligning with experimental observations. These results confirm the inverse correlation between fracture aperture and stabilization duration, where narrower apertures prolong equilibration periods while amplifying concentration variation magnitudes, mirroring patterns observed in experiments.
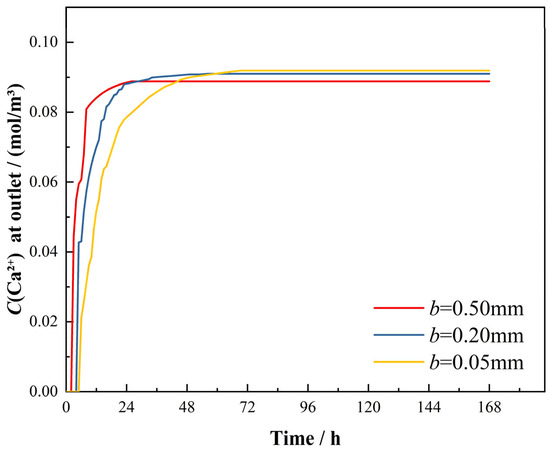
Figure 12.
Dynamic variation of Ca2+ concentration at numerical model base.
The spatial-temporal evolution of HF concentrations is presented in Figure 13, illustrating concentration distributions at three critical stages: initial conditions, leachate breakthrough at the reactor outlet, and steady-state equilibrium. Notably, specimens with varying fracture apertures exhibited distinct breakthrough times at the outlet, aligning temporally with observations from dynamic dissolution experiments. The HF concentration gradients demonstrate a consistent spatial attenuation from the inflow to outflow boundaries, with lower concentrations detected in the rock matrix beneath fractures. Following leachate breakthrough at the reactor outlet, preferential flow through fracture channels can be observed.
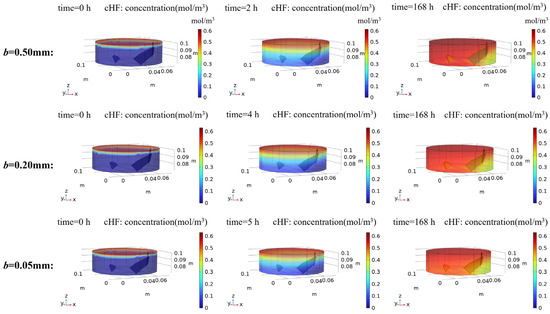
Figure 13.
HF simulation results of rock specimens modeled with different fracture apertures. The spatial-temporal evolution of HF concentrations is presented, illustrating concentration distributions at three critical stages: initial conditions, leachate breakthrough at the reactor outlet, and steady-state equilibrium.
Further analysis reveals a positive correlation between fracture aperture and HF concentrations at the outlet, consistent with experimental measurements. Additionally, widening fracture apertures amplified concentration differentials between fracture zones and adjacent rock matrices, reflecting enhanced mass transport efficiency in larger flow pathways. The presence of preferential flow pathways fundamentally alters reactant transport dynamics in rock specimens. These findings quantitatively validate the critical role of fracture aperture in governing solute transport mechanisms during acid–rock interactions.
Numerical simulations predict the sulfuric acid (H2SO4) concentration evolution during reactive transport (Figure 14), revealing spatial attenuation patterns analogous to HF but differing significantly in concentration magnitudes and reaction kinetics. The H₂SO₄ concentration decreases progressively from inflow to outflow boundaries with notably lower concentrations observed in sub-fracture matrix regions. Similarly, preferential flow through fracture channels can be observed when the leachate breaks through to the reactor outlet. Based on the experimental framework, where only the first dissociation step of phosphoric acid was considered for reaction participation, it is hypothesized that sulfuric acid concentration dynamics mirror phosphate’s attenuation patterns under identical hydrodynamic and geochemical constraints.
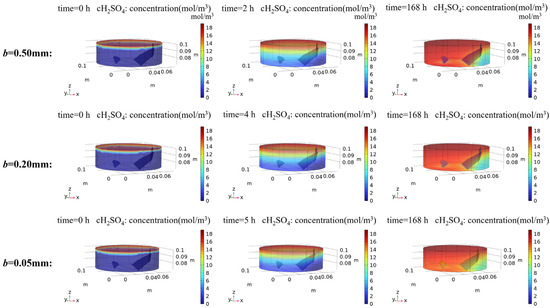
Figure 14.
H2SO4 simulation results of rock specimens modeled with different fracture apertures. The spatial-temporal evolution of H2SO4 concentrations is presented, illustrating concentration distributions at three critical stages: initial conditions, leachate breakthrough at the reactor outlet, and steady-state equilibrium.
4. Conclusions
This study employed an integrated approach combining physical experiments and numerical simulations to investigate the dissolution mechanisms of carbonate rocks with varying fracture apertures under phosphogypsum leachate exposure across different pH levels. Key findings are summarized as follows:
- (1)
- It is known from physical experiments that phosphogypsum leachate–carbonate rock interactions exhibit rapid initial dissolution followed by progressive stabilization. In this study, lower leachate pH correlated with accelerated dissolution rates, a phenomenon directly evidenced by microscale morphological alterations on carbonate rock surfaces. EDS analysis confirmed that dissolution-induced secondary minerals accumulate extensively on rock specimen surfaces. Fracture aperture minimally affects static dissolution patterns but critically influences dynamic systems—smaller apertures exhibit limited enlargement and delayed pH stabilization with higher final pH.
- (2)
- Comparative analysis of different physical experiments shows that the hydrodynamic conditions dramatically intensify dissolution. Dynamic systems exhibit 10–15 times greater dissolution amount per unit area than static conditions. Notably, the evolution trends of key geochemical parameters (pH, Ca2+, SO42−, F−, and total P concentrations) displayed opposing patterns between dynamic and static systems. Static dissolution experiments revealed a linear positive correlation between chemical dissolution rates of carbonate rocks and solution conductivity. Concurrently, phosphogypsum leachate pH demonstrated an exponential negative correlation with rock dissolution amount per unit area, while exhibiting a power-law negative correlation with chemical dissolution rates.
- (3)
- Numerical simulation results demonstrated that preferential flow through fracture channels led to higher reactant concentrations near fractures due to incomplete reactions, whereas lower concentrations occurred in sub-fracture regions. As the fracture aperture increased, the concentration disparity between these regions became more pronounced, with higher concentration of reactants at the outlet.
This study innovatively combines physical experimentation with numerical simulations to analyze and characterize the transport and transformation mechanisms of phosphogypsum leachate within rock fractures, employing more practical conditions for the reaction of phosphogypsum leachate with carbonate rock. This study provides novel insights into the geochemical interaction mechanisms of acidic fluids within geological matrices, providing a theoretical basis for the research of other acidic aqueous solutions. The findings offer critical guidelines for sustainable phosphogypsum management strategies and provide technical guidance for optimizing site selection and safety protocols in tailings disposal engineering, particularly in karst terrain with active dissolution processes.
This study acknowledges limitations in physical experimentation and numerical modeling:
- (1)
- The experimental analysis focused exclusively on limestone, excluding other carbonate variants (e.g., dolomite, magnesite). Future investigations should incorporate diverse carbonate lithologies with varying mineralogical compositions to comprehensively characterize dissolution mechanisms.
- (2)
- The numerical model simplified environmental variables, omitting temperature gradients, CO2 partial pressure, and chemo-hydro-mechanical couplings. Enhanced simulations integrating these multi-physics interactions are required to improve predictive accuracy.
Author Contributions
W.Y.: Software, Experiment, Formal Analysis, Writing-Original Draft. G.D.: Conceptualization Methodology, Validation. C.Z.: Formal Analysis, Writing—Review & Editing. M.J.: Software, Experiment. Z.C.: Conceptualization, Validation, Writing-Original Draft, Writing—Review & Editing, Visualization. All authors have read and agreed to the published version of the manuscript.
Funding
This research was funded by the National Key R&D Program of China (Grant number 2023YFC3706004); the National Natural Science Foundation of China (Grant number 42377079); the Jiangsu Provincial Natural Science Foundation General Project (Grant Number BK20221507).
Institutional Review Board Statement
Not applicable.
Informed Consent Statement
Not applicable.
Data Availability Statement
The datasets presented in this article are not readily available because the data are part of an ongoing study. Requests to access the datasets should be directed to the corresponding author of the research.
Conflicts of Interest
Author Guangfu Duan was employed by the company Changjiang Survey Planning Design and Research, Co., Ltd. The remaining authors declare that the research was conducted in the absence of any commercial or financial relationships that could be construed as a potential conflict of interest.
References
- Alotaibi, A.M.; Aljabbab, A.A.; Alajmi, M.S.; Qadrouh, A.N.; Farahat, M.; Abdel Khalek, M.A.; Baioumy, H.; Alzahrani, R.Y.; Mana, T.H.; Almutairi, R.S. Utilization of Phosphogypsum as Sustainable Adsorbent for Removal of Crystal Violet Dye from Wastewater: Kinetics, Thermodynamics, and Applications in Textile Effluent Treatment. Sustainability 2025, 17, 3320. [Google Scholar] [CrossRef]
- Samira, M.; Moncef, G. Impact Assessment of Phosphogypsum Leachate on Groundwater of Sfax-Agareb (Southeast of Tunisia): Using Geochemical and Isotopic Investigation. J. Chem. 2018, 2018, 2721752. [Google Scholar]
- Maria, P.; Georgios, G. Examination of the environmental behavior of phosphogypsum with the application of lab-scale experiment. J. Environ. Sci. health Part A Toxic/Hazard. Subst. Environ. Eng. 2023, 58, 706–714. [Google Scholar]
- Zhao, M.; Li, X.; Yu, J.X.; Li, F.; Guo, L.; Song, G.; Xiao, C.; Zhou, F.; Chi, R.; Feng, G. Highly efficient recovery of phosphate and fluoride from phosphogypsum leachate: Selective precipitation and adsorption. J. Environ. Manag. 2024, 367, 122064. [Google Scholar] [CrossRef] [PubMed]
- Ke, H.; Zheng, S.N.; Zhang, P.Z.; Xiao, B.; Lan, J.W.; Zhang, S.; Hu, J. Leaching behavior and release mechanism of pollutants from different depths in a phosphogypsum stockpile. Waste Manag. 2024, 189, 230–242. [Google Scholar] [CrossRef]
- Pérez-Moreno, S.M.; Romero, C.; Guerrero, J.L.; Barba-Lobo, A.; Gázquez, M.J.; Bolivar, J.P. Evolution of the waste generated along the cleaning process of phosphogypsum leachates. J. Environ. Chem. Eng. 2023, 11, 111485. [Google Scholar] [CrossRef]
- Sharapov, R. Indicators for karst processes evaluation. In Proceedings of the 14th International Multidisciplinary Scientific Geoconference (SGEM), Albena, Bulgaria, 17–26 June 2014; pp. 519–525. [Google Scholar]
- Ren, J.; Li, J.; Xi, B.; Yang, Y.; Lu, H.; Shi, J. Groundwater Pollution Prevention and Control in China: Current Status and Countermeasures. Strateg. Study CAE 2022, 24, 161–168. [Google Scholar] [CrossRef]
- Fleury, P.; Pistre, S.; Bakalowicz, A. Coastal karst aquifers and submarine springs: What future for their water resources? C. R. Geosci. 2023, 355, 487–500. [Google Scholar] [CrossRef]
- Zhou, N.; Lu, S.; Cai, Y.; Zhao, S. Site Investigation and Remediation of Sulfate-Contaminated Groundwater Using Integrated Hydraulic Capture Techniques. Water 2022, 14, 2989. [Google Scholar] [CrossRef]
- Chabaux, F.; Viville, D.; Lucas, Y.; Ackerer, J.; Ranchoux, C.; Bosia, C.; Pierret, M.C.; Labasque, T.; Aquilina, L.; Wyns, R.; et al. Geochemical tracing and modeling of surface and deep water-rock interactions in elementary granitic watersheds (Strengbach and Ringelbach CZOs, France). Acta Geochim. 2017, 36, 363–366. [Google Scholar] [CrossRef]
- Berrone, S.; Canuto, C.; Pieraccini, S.; Scialo, S. Uncertainty Quantification in Discrete Fracture Network Models: Stochastic Geometry. Water Resour. Res. 2018, 54, 1338–1352. [Google Scholar] [CrossRef]
- Tomassi, A.; de Franco, R.; Trippetta, F. High-resolution synthetic seismic modelling: Elucidating facies heterogeneity in carbonate ramp systems. Pet. Geosci. 2025, 31, petgeo2024-047. [Google Scholar] [CrossRef]
- Ford, D. Characteristics of dissolutional cave systems in carbonate rocks. In Paleokarst; Springer: New York, NY, USA, 1988; pp. 25–57. [Google Scholar]
- Dreybrodt, W. Processes in Karst Systems (Series in Physical Environment); Springer: Heidelberg, Germany, 1988; pp. 140–182. [Google Scholar]
- Dreybrodt, W.; Buhmann, D. A mass transfer model for dissolution and precipitation of calcite from solutions in turbulent motion. Chem. Geol. 1991, 90, 107–122. [Google Scholar] [CrossRef]
- Shi, M.; Min, X.; Tian, C.; Hao, T.; Zhu, S.; Ge, Y.; Wang, Q.; Yan, X.; Lin, Z. Mechanisms of Pb(II) coprecipitation with natrojarosite and its behavior during acid dissolution. J. Environ. Sci. 2022, 122, 128–137. [Google Scholar] [CrossRef] [PubMed]
- Renard, F.; Royne, A.; Putnis, C.V. Timescales of interface-coupled dissolution-precipitation reactions on carbonates. Geosci. Front. 2019, 10, 17–27. [Google Scholar] [CrossRef]
- Lin, W.; Yang, Z.; Li, X.; Wang, J.; He, Y.; Wu, G.; Xiong, S.; Wei, Y. A method to select representative rock samples for digital core modeling. Fractals-Complex Geom. Patterns Scaling Nat. Soc. 2017, 25, 1740013. [Google Scholar] [CrossRef]
- Siddiqui, S.; Funk, J.J.; Al-Tahini, A.M. Use of X-Ray CT To Measure Pore Volume Compressibility of Shaybah Carbonates. Spe Reserv. Eval. Eng. 2010, 13, 155–164. [Google Scholar] [CrossRef]
- Elkady, Y.; Kovscek, A.R. Multiscale study of CO2 impact on fluid transport and carbonate dissolution in Utica and Eagle Ford shale. J. Pet. Sci. Eng. 2020, 195, 107867. [Google Scholar] [CrossRef]
- Dufresne, W.J.; Rufledt, C.J.; Marshall, C.P. Raman spectroscopy of the eight natural carbonate minerals of calcite structure. J. Raman Spectrosc. 2018, 49, 1999–2007. [Google Scholar] [CrossRef]
- Su, W.; Heinrich, C.A.; Pettke, T.; Zhang, X.; Hu, R.; Xia, B. Sediment-Hosted Gold Deposits in Guizhou, China: Products of Wall-Rock Sulfidation by Deep Crustal Fluids. Econ. Geol. 2009, 104, 73–93. [Google Scholar] [CrossRef]
- Kwak, H.; Hursan, G.; Shao, W.; Chen, S.H.; Balliet, R.; Eid, M.; Guergueb, N. Predicting Carbonate Rock Properties Using NMR Data and Generalized Interpolation-Based Techniques. Petrophysics 2016, 57, 351–368. [Google Scholar]
- Müller-Huber, E.; Schön, J.; Börner, F. Pore space characterization in carbonate rocks—Approach to combine nuclear magnetic resonance and elastic wave velocity measurements. J. Appl. Geophys. 2016, 127, 68–81. [Google Scholar] [CrossRef]
- Fredd, C.N.; Fogler, H.S. The kinetics of calcite dissolution in acetic acid solutions. Chem. Eng. Sci. 1998, 53, 3863–3874. [Google Scholar] [CrossRef]
- Li, C.; Wu, F.; Zhao, Y.; Wang, F.; Cao, Y. Fractal and Hydro-Chemical Characteristics of Microscopic Karst Morphology Based on Dissolution Experiments. Mod. Tunn. Technol. 2018, 55, 110–120. [Google Scholar]
- Larson, E.B.; Emmons, R.V. Dissolution of Carbonate Rocks in a Laboratory Setting: Rates and Textures. Minerals 2021, 11, 605. [Google Scholar] [CrossRef]
- Yue, G.; Zhu, X.; Wang, G.; Ma, F. Mineral reaction kinetics during aciding of the Gaoyuzhuang carbonate geothermal reservoir in the xiong’an new area, northern China. Water 2022, 14, 3160. [Google Scholar] [CrossRef]
- Alkattan, M.; Oelkers, E.H.; Dandurand, J.-L.; Schott, J. An experimental study of calcite and limestone dissolution rates as a function of pH from −1 to 3 and temperature from 25 to 80 °C. Chem. Geol. 1998, 151, 199–214. [Google Scholar] [CrossRef]
- Eisenlohr, L.; Meteva, K.; Gabrovšek, F.; Dreybrodt, W. The inhibiting action of intrinsic impurities in natural calcium carbonate minerals to their dissolution kinetics in aqueous H2O–CO2 solutions. Geochim. Cosmochim. Acta 1999, 63, 989–1001. [Google Scholar] [CrossRef]
- Pokrovsky, O.S.; Golubev, S.V.; Schott, J. Dissolution kinetics of calcite, dolomite and magnesite at 25 °C and 0 to 50 atm pCO2. Chem. Geol. 2005, 217, 239–255. [Google Scholar] [CrossRef]
- Gong, Q.; Deng, J.; Wang, Q.; Yang, L.; She, M. Experimental determination of calcite dissolution rates and equilibrium concentrations in deionized water approaching calcite equilibrium. J. Earth Sci. 2010, 21, 402–411. [Google Scholar] [CrossRef]
- Taylor, K.C.; Nasr-El-Din, H.A.; Mehta, S. Anomalous acid reaction rates in carbonate reservoir rocks. SPE J. 2006, 11, 488–496. [Google Scholar] [CrossRef]
- Arvidson, R.S.; Ertan, I.E.; Amonette, J.E.; Luttge, A. Variation in calcite dissolution rates: A fundamental problem? Geochim. Cosmochim. Acta: J. Geochem. Soc. Meteorit. Soc. 2003, 67, 1623–1634. [Google Scholar] [CrossRef]
- Ma, C.; Kang, Z.; Zhang, L.; Xuan, H.; Nong, P.; Pan, S.; Kong, Q.; Zhu, Y.; Zhu, Z. Dissolution and precipitation of calcite in different water environments. Carsologica Sin. 2023, 42, 29. [Google Scholar]
- Gautelier, M.; Oelkers, E.H.; Schott, J. An experimental study of dolomite dissolution rates as a function of pH from −0.5 to 5 and temperature from 25 to 80 °C. Chem. Geol. 1999, 157, 13–26. [Google Scholar] [CrossRef]
- Dreybrodt, W. Processes in Karst Systems: Physics, Chemistry, and Geology; Springer Science & Business Media: Berlin, Germany, 2012; Volume 4. [Google Scholar]
- MacInnis, I.N.; Brantley, S.L. The role of dislocations and surface morphology in calcite dissolution. Geochim. Cosmochim. Acta 1992, 56, 1113–1126. [Google Scholar] [CrossRef]
- Schott, J.; Brantley, S.; Crerar, D.; Guy, C.; Borcsik, M.; Willaime, C. Dissolution kinetics of strained calcite. Geochim. Cosmochim. Acta 1989, 53, 373–382. [Google Scholar] [CrossRef]
- Plummer, L.N.; Busenberg, E. The solubilities of calcite, aragonite and vaterite in CO2-H2O solutions between 0 and 90 °C, and an evaluation of the aqueous model for the system CaCO3-CO2-H2O. Geochim. Cosmochim. Acta 1982, 46, 1011–1040. [Google Scholar] [CrossRef]
- She, M.; Shou, J.; Shen, A.; Pan, L.; Hu, A.; Hu, Y. Experimental simulation of dissolution law and porosity evolution of carbonate rock. Pet. Explor. Dev. 2016, 43, 616–625. [Google Scholar] [CrossRef]
- Rabie, A.; Gomaa, A.; Nasr-El-Din, H. Determination of reaction rate of in-situ gelled acids with calcite using the rotating disk apparatus. In Proceedings of the SPE International Production and Operations Conference and Exhibition, Florence, Italy, 20–22 September 2010; p. SPE–133501-MS. [Google Scholar]
- Chen, R.; Luo, M.; Luo, Z.; Chen, Z.; Zhou, H. Response relationship between chemical composition and dissolution rate of carbonate rocks in the Three Gorges Area. Carsologica Sin. 2019, 38, 258–264. [Google Scholar]
- Yoo, H.; Kim, Y.; Lee, W.; Lee, J. An experimental study on acid-rock reaction kinetics using dolomite in carbonate acidizing. J. Pet. Sci. Eng. 2018, 168, 478–494. [Google Scholar] [CrossRef]
- Guldberg, C.M.; Waage, P. Uber die chemische Affinität. J. Prakt. Chem. 1879, 127, 69–114. [Google Scholar] [CrossRef]
- Fan, Y.; Peng, H.; Chen, G.; Peng, J.; Han, H.; Qin, Y.; Wang, L.; Liu, D. Experimental study of the influences of different factors on the acid-rock reaction rate of carbonate rocks. J. Energy Storage 2023, 63, 107064. [Google Scholar] [CrossRef]
- Zaihua, L.I.U.; Dreybrodt, W.; Huaju, L.I. Comparison of Dissolution Rate-Determining Mechanisms between Limestone and Dolomite. Earth Sci. 2006, 31, 411–416. [Google Scholar]
Disclaimer/Publisher’s Note: The statements, opinions and data contained in all publications are solely those of the individual author(s) and contributor(s) and not of MDPI and/or the editor(s). MDPI and/or the editor(s) disclaim responsibility for any injury to people or property resulting from any ideas, methods, instructions or products referred to in the content. |
© 2025 by the authors. Licensee MDPI, Basel, Switzerland. This article is an open access article distributed under the terms and conditions of the Creative Commons Attribution (CC BY) license (https://creativecommons.org/licenses/by/4.0/).