Article

Improvement of the Cross-Scale Multi-Feature Stereo Matching Algorithm

1
School of Mechanical Engineering, Qilu University of Technology (Shandong Academy of Sciences), Jinan 250300, China
2
School of Electronics and Information, Aerospace Information Technology University, Jinan 250200, China
3
School of Information and Automation Engineering, Qilu University of Technology (Shandong Academy of Sciences), Jinan 250300, China
*
Author to whom correspondence should be addressed.
Appl. Sci. 2025, 15(11), 5837; https://doi.org/10.3390/app15115837
Submission received: 14 April 2025 / Revised: 19 May 2025 / Accepted: 21 May 2025 / Published: 22 May 2025
(This article belongs to the Special Issue Advances in Computer Vision and Digital Image Processing)

Abstract

:
With the continuous advancement of industrialization and intelligentization, stereo-vision-based measurement technology for large-scale components has become a prominent research focus. To address weak-textured regions in large-scale component images and reduce mismatches in stereo matching, we propose a cross-scale multi-feature stereo matching algorithm. In the cost-computation stage, the sum of absolute differences (SAD), census, and modified census cost aggregation are employed as cost-calculation methods. During the cost-aggregation phase, cross-scale theory is introduced to fuse multi-scale cost volumes using distinct aggregation parameters through a cross-scale framework. Experimental results on both benchmark and real-world datasets demonstrate that the enhanced algorithm achieves an average mismatch rate of 12.25%, exhibiting superior robustness compared to conventional census transform and semi-global matching (SGM) algorithms.

1. Introduction

Stereo matching is a technique for recovering depth information of real-world scenes from planar images. It operates by identifying corresponding pixel pairs across two or more images of the same scene, then calculating the depth of spatial physical points through the triangulation principle. This technology is widely utilized in domains such as robotic navigation, autonomous vehicles, and medical imaging.
With the rapid advancement of computer vision, stereo-vision-based 3D measurement has emerged as a prominent research frontier. As an implementation approach of this technology, binocular vision is gaining widespread adoption. Stereo matching serves as a pivotal step bridging binocular vision and 3D reconstruction, exerting substantial influence on point cloud generation. The theoretical framework proposed by Scharstein et al. [1] comprises four stages: cost computation, cost aggregation, disparity computation, and disparity refinement. During the cost-computation stage, a cost volume is constructed by calculating the matching costs for each pixel across its possible disparity range. During the cost-aggregation phase, matching costs from pixel neighborhoods are aggregated using specialized algorithms to enhance local disparity consistency. The pipeline ultimately yields high-quality disparity maps through disparity computation and refinement processes [2].
Each of the four processes in the theoretical framework plays a critical role in stereo matching algorithms. Particularly in weakly textured regions, variations in cost-computation methods can lead to significantly divergent matching outcomes. The cost-aggregation process serves as a central component in numerous algorithms [3], exerting substantial influence on the final results. Therefore, this study primarily focuses on the impacts of cost-computation and -aggregation processes on cross-scale measurement of components [4].
Among the various cost aggregation approaches, Gaussian filtering and mean filtering currently dominate linear filtering implementations, although these conventional methods often induce edge blurring artifacts at image boundaries [5]. Pham et al. [6] proposed the guided image filtering algorithm, which demonstrates effective edge preservation, superior computational efficiency compared to the aforementioned methods, and maintains applicability in smooth image regions. This technique currently stands as a state-of-the-art edge-preserving filtering approach [7].
Owing to the computational efficiency and superior edge-preserving performance of guided image filtering, stereo matching algorithms leveraging this technique have garnered substantial research attention in recent years. In 2014, Tan P. and Monasse P. et al. [8] introduced guided filtering for cost aggregation in local stereo matching algorithms. Leveraging the adaptive weighting mechanism of the guided filter, their method demonstrated superior performance on texture-rich image pairs. However, this approach employed simplistic cost computation and neglected application scenarios involving weakly textured stereo pairs. In 2012, Yang et al. [9] proposed a novel cost-computation method by integrating SAD (sum of absolute differences) with gradient information. However, this approach merely performed a straightforward fusion of color intensity and gradient data, without incorporating the census transform cost, which demonstrates superior performance in weakly textured regions. The limitations of traditional stereo matching algorithms become particularly pronounced when processing images containing extensive weakly textured areas.
The existing methods mentioned above are confined to single-scale image processing, neglecting multi-scale information. Their cost computation relies on limited feature representations and superficially applies guided filtering algorithms to the stereo matching stage. With no consideration of weakly textured images, these approaches exhibit inherent limitations, resulting in compromised matching accuracy in weakly textured regions. To address these limitations, this paper proposes an improved cross-scale guided filtering stereo matching algorithm for mechanical component measurement. The method first integrates hybrid cost computation combining SAD and modified census transform. A cross-scale guided filtering framework is adopted for cost aggregation, where scale-specific aggregation parameters are configured according to multi-scale feature characteristics. The algorithm fuses multi-scale [10] cost volumes to ensure enhanced robustness in weakly textured regions. During the disparity computation stage, the algorithm employs multiple optimization strategies to ensure robustness in processing weakly textured images, ultimately yielding high-quality disparity maps with minimized mismatch rates.

2. Algorithm Description

The proposed algorithm employs a binocular system constructed with two monocular cameras as the experimental setup. Taking rectified left-right image pairs as the input, it sequentially performs cost computation, cost aggregation, disparity calculation, and disparity post-processing [11], ultimately outputting the final disparity map. The detailed workflow is illustrated in Figure 1. The workflow starts by computing matching costs across candidate disparities using distinct cost functions between pixels in the target image and their correspondences in the reference image. Subsequently, the cost-aggregation phase fuses SAD (sum of absolute differences) with an enhanced census transform metric. A multi-scale representation of the input stereo pair is then constructed, where cost aggregation is performed through a cross-scale guided filtering framework. Finally, the winner-takes-all (WTA) strategy is applied for disparity selection, followed by post-processing operations to refine the disparity map.

2.1. Cost Computation

Cost computation measures the similarity between the corresponding pixels in the left and right images, but it is often influenced by factors such as image noise and illumination variations, which can result in mismatches. Common cost-computation methods include simple measures like absolute difference (AD), census, and normalized cross-correlation (NCC) [12]. The traditional census transform [13], a non-parametric local transform, is widely adopted for matching cost computation. The core idea is as follows: A rectangular window is defined within the image region and slides across the entire image. For each position, it takes the central pixel p within the window as the reference pixel, then compares the intensity value of p against those of all neighboring pixels q in the window. If the intensity value of a neighboring pixel is less than or equal to the reference value, it is assigned a value of 0; otherwise, it is marked as 1. This operation can be formally expressed as:
δ I p ,   I q = 1 ,   I p I q 0 ,   I p I q
Here, p denotes the central pixel of the window, q represents the non-central pixels within the window, and I · indicates the intensity value at a given pixel. δ I p ,   I q represents the result of census transformation.
A binary bit-string of the input image, known as the census transform, is obtained via Equation (1). The census-based matching cost-computation method involves calculating the H a m m i n g distance [14] between the census transform values of the corresponding pixels in the left and right images, which can be formulated as:
C C e n c u s u , v , d = H a m m i n g C S R u , v , C S T u d , v
In the equation, d denotes the disparity value, C S R u , v represents the binary bit-string generated from the left image, C S T u d , v corresponds to the binary bit-string from the right image, and the H a m m i n g distance quantifies the number of positions at which the corresponding bits in the two bit-strings differ.
In traditional implementations, the census transform constructs a bit-string representation by comparing the intensity of each pixel within a local window against the central pixel’s intensity value, as illustrated in Figure 2.
In challenging environments, however, images are subject to noise and other adverse factors that may induce abrupt intensity variations, as demonstrated in Figure 3.
When the central pixel’s intensity abruptly changes from 121 to 101, the corresponding bit-string transitions from 11,100,000 to 11,111,110, and this drastic numerical variation significantly impacts the matching error.
To address the over-reliance on the central pixel in conventional census transform operations (as manifested in bit-string generation), this paper proposes an improved census transform methodology. Based on the continuous and coherent intensity distribution characteristics of local neighborhoods, our method first computes the average intensity within the processing window. A dynamic threshold is then established according to the statistical deviation between individual pixel intensities and this average intensity. When the intensity difference between any pixel and the average exceeds the predefined threshold, the central pixel’s intensity is adaptively reassigned to match the computed mean value.
As demonstrated in Figure 4, the enhanced census transform employs a predefined threshold of 12. The computed mean intensity within the local window is 112.7. Given the original central pixel intensity of 101, the absolute difference (|112.7 − 101| = 11.7) exceeds the threshold. Consequently, the central pixel intensity is adaptively updated to the mean value (112.7). This adjustment modifies the generated bit-string from 11,111,110 to 11,110,010, thereby significantly improving robustness against abrupt pixel variations caused by adverse environmental conditions.
The traditional SAD and improved census joint matching cost function can be expressed as:
C A D ( p i , d ) = 1 3 c r , g , b I l C ω i I r C ω i
I ω i = 1 N j ϵ ω i p j
C p i , d = α C c e n c u s p l , d , λ c e n c u s + 1 α C A D ( p l , d , λ A D )
where α is the weighting coefficient. In this formulation, C A D ( p i , d ) represents the sum of absolute differences (SAD) cost, C c e n c u s p l , d represents the improved cost of census, and C p i , d represents the cost after fusion.
The fused cost is normalized via the natural exponential function, yielding the final composite cost-computation function as:
C p , d = 2 e x p C A D p , d e x p C c e n c u s p , d
In the matching computation, the enhanced census transform cost exhibits superior performance over its conventional counterpart in weakly textured regions, while the SAD cost ensures higher matching accuracy in areas with repetitive patterns compared to the census-based approach. Through the fusion of these complementary cost modalities, the proposed method achieves an enhanced matching capability for weakly textured surfaces and significantly improves the algorithm’s robustness.
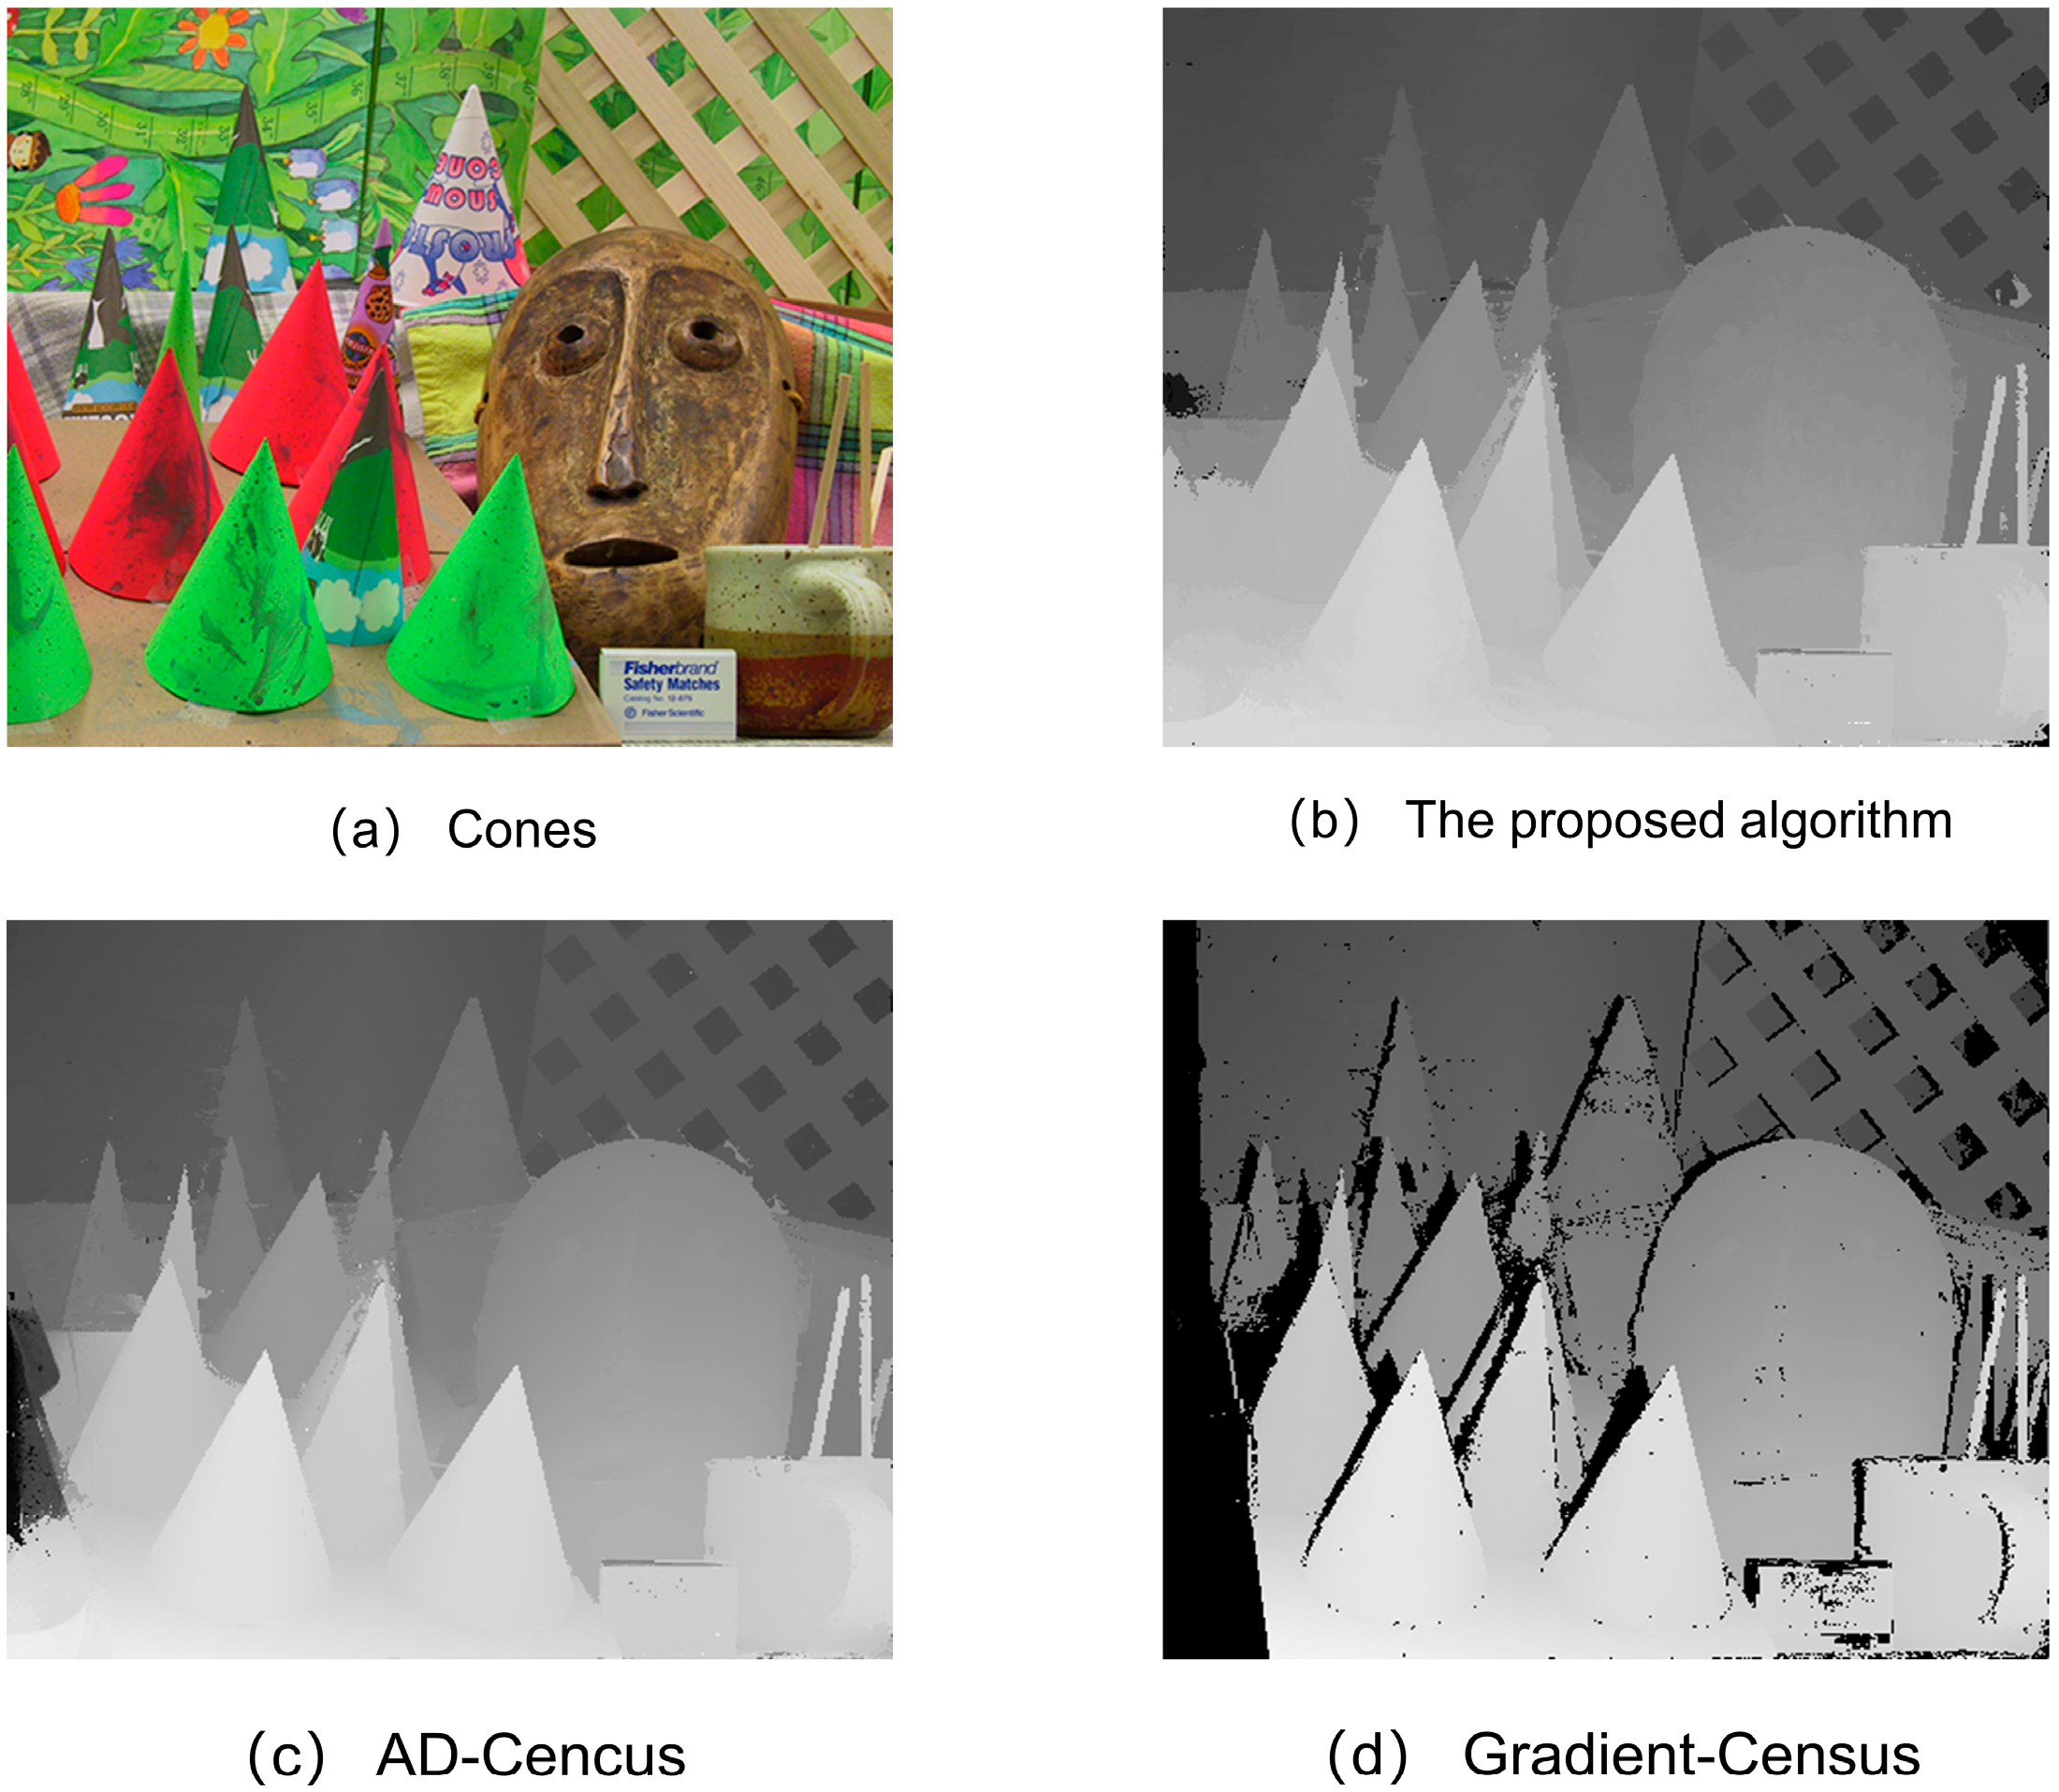
To validate the effectiveness of the proposed algorithm, we conducted experiments on weakly textured images selected from the Middlebury benchmark dataset. Figure 5 compares the disparity maps generated by three methods: AD-Census, Gradient-Census, and our algorithm. While the AD-Census cost partially reduces mismatch rates in weakly textured regions compared to conventional approaches, it still exhibits significantly higher mismatch errors than our method in these areas. Furthermore, the Gradient-Census method fails to effectively handle large-scale weakly textured surfaces due to its limited texture discrimination capability.

2.2. Cost Aggregation

Cost aggregation is a critical step in stereo matching algorithms, which aims to mitigate the impact of erroneous cost measurements by integrating information from multiple data points [15]. In addition to local filtering-based methods, semi-global matching (SGM) [16] has been widely adopted for disparity estimation. A local cost aggregation strategy typically involves considering disparity costs within the neighborhood of each pixel, where the aggregated costs from neighboring pixels are incorporated into the current pixel. This process recomputes the pixel-wise cost values to enhance the consistency of matching costs. In contrast to local aggregation strategies, semi-global matching (SGM) [17] employs a semi-global optimization framework that aggregates costs along multiple 1D paths (8 or 16 directions) using dynamic programming [18]. The core idea is to minimize the energy function [19]:
E D = p C p , D p + q N p P 1 T Δ X = 1 + q N p P 2 T Δ X > 1  
where C p , D p denotes the matching cost of pixel p at disparity D p , N p represents the neighborhood centered at p , P 1 and P 2 represent penalty terms, and T · is an indicator function that outputs 1 if the specified condition is satisfied and 0 otherwise.
However, SGM’s reliance on single-scale cost volumes may lead to over-smoothing in fine structures or insufficient constraints in weakly textured areas.
Park et al. [20] proposed a guided image-filtering-based cost aggregation method within a multi-scale framework. To better preserve edge contours in weakly textured regions, their approach first constructs an image pyramid via Gaussian downsampling to capture multi-scale representations [21]. Cost-aggregation values are computed independently across different scale spaces, while a regularization term is introduced to enforce cross-scale consistency, ultimately deriving the optimal aggregated cost through inter-scale optimization [22].
The guided image filtering function can be expressed as
C p , d = m G p + n   ,   p   ω k    
where m and n represent the coefficients of the linear function, G p denotes the input guidance image, and C p , d corresponds to the cost-aggregated matching cost volume. The guided filtering algorithm is employed for cost aggregation across multi-scale images.
During the cost aggregation stage, a cross-scale aggregation model is proposed to integrate spatial information across different scales. Specifically, distinct aggregation parameters are employed for cost volumes at varying scales, while a regularization term is introduced to reinforce inter-scale relationships. This formulation maximizes cost consistency within neighboring scales, namely:
B S z = λ z s z s 1 2 2
where λ denotes the regularization factor, s represents the ordinal index in scale space, and z s indicates the difference in corresponding pixel costs across scale spaces. A larger λ value enforces stronger cross-scale consistency constraints on identical pixels, thereby enhancing the improved algorithm’s capacity for visual estimation in weakly textured regions and boosting its overall robustness.
Following multi-scale cost aggregation, the disparity map generated through the winner-takes-all (WTA) strategy is illustrated in Figure 6. A comparative analysis of weakly textured regions between the baseline and improved methods reveals that the proposed cross-scale cost aggregation achieves:
  • Reduced mismatch rate compared to the unmodified approach
  • Smooth disparity transitions in continuous regions
  • Effective restoration of disparity values in weakly textured areas.
By employing scale-specific aggregation parameters for multi-scale images, our method significantly enhances matching accuracy in texture-deficient regions while maintaining computational efficiency.

2.3. Disparity Computation and Post-Processing

Conventional algorithms typically adopt the winner-takes-all (WTA) strategy for disparity computation [23], with the calculation method formulated as follows:
d p = arg   m i n   C p , d   d ϵ 0 , R d
where R d denotes the range of disparity values, and C p , d represents the aggregated matching cost for pixel p at disparity level d after cost computation and aggregation.
Occluded regions in the initial disparity map inevitably induce unmatched areas and erroneous pixel matches during disparity computation. This necessitates post-processing operations to refine disparity estimates and achieve precision-enhanced results.
Therefore, our pipeline implements the following refinement stages:
  • Left−right consistency check to eliminate mismatched pixels,
  • Guided hole filling with valid disparity values for occluded regions,
  • Median filtering to enhance smoothness consistency in weakly textured areas.
This multi-stage approach effectively addresses:
  • Discontinuous mismatches caused by residual noise in initial disparity maps
  • Smoothness degradation in low-texture zones
  • Boundary artifacts around occlusion boundaries
The integrated post-processing framework ultimately yields high-precision disparity maps with subpixel accuracy. Figure 7 shows the flowchart of the stereo matching algorithm.

3. Experimental Results and Analysis

To validate the effectiveness of improvements in the proposed algorithm, we conducted experiments using calibrated image pairs from the Middlebury 3.0 benchmark [24]. The algorithmic framework was implemented in C++ with the OpenCV computer vision library, adhering to the standardized evaluation protocol for stereo matching. The proposed algorithm was comparatively evaluated against the SGM algorithm [25] and the conventional AD-Census [26] cost metric.
The following evaluation metrics were employed to assess matching accuracy improvements:
  • Non-occluded region error rate
  • All-region error rate
The mismatch rate M is formally defined as:
M = 1 N d c x , y d r x , y > T d ,
Here, d r x , y is the true disparity value of the image, d c x , y is the disparity value obtained by the improved algorithm, and N represents the total number of pixels in non-occluded regions or across all regions.
The main experimental parameters of the proposed algorithm are listed in Table 1. In the experiments, the disparity threshold was set to 1 pixel—this means that when the experimental data were compared with the ground-truth disparity map, a pixel would be identified as a mismatched point if its error exceeded 1 pixel.
Three standard stereo image pairs (Teddy, Conces, and Venus) from the Middlebury3.0 platform were selected for the experiments. The mismatch rates in both non-occluded regions and all regions were calculated for each image set. Experimental results obtained using three distinct cost-computation methods are presented in Table 2 and Table 3.
An analysis of the experimental results in the figures above demonstrates that the proposed algorithm achieves higher-quality disparity maps when processing weakly textured regions compared to the other two algorithms. Furthermore, parameter adjustments in our algorithm can yield disparity maps comparable to those generated by the other two methods.
To further validate the runtime superiority of the proposed algorithm, the execution times required for the aforementioned two experimental sets were calculated and are presented in Table 4 and Table 5.
From the runtime comparison of different algorithms in the figure above, it can be observed that the proposed algorithm achieves a higher average computational efficiency compared to the other two methods. Furthermore, for the same image, the proposed method demonstrates a more pronounced improvement in computational efficiency when processing weakly texture regions. Nevertheless, further optimizations will be conducted to ensure a robust performance in practical industrial environments.
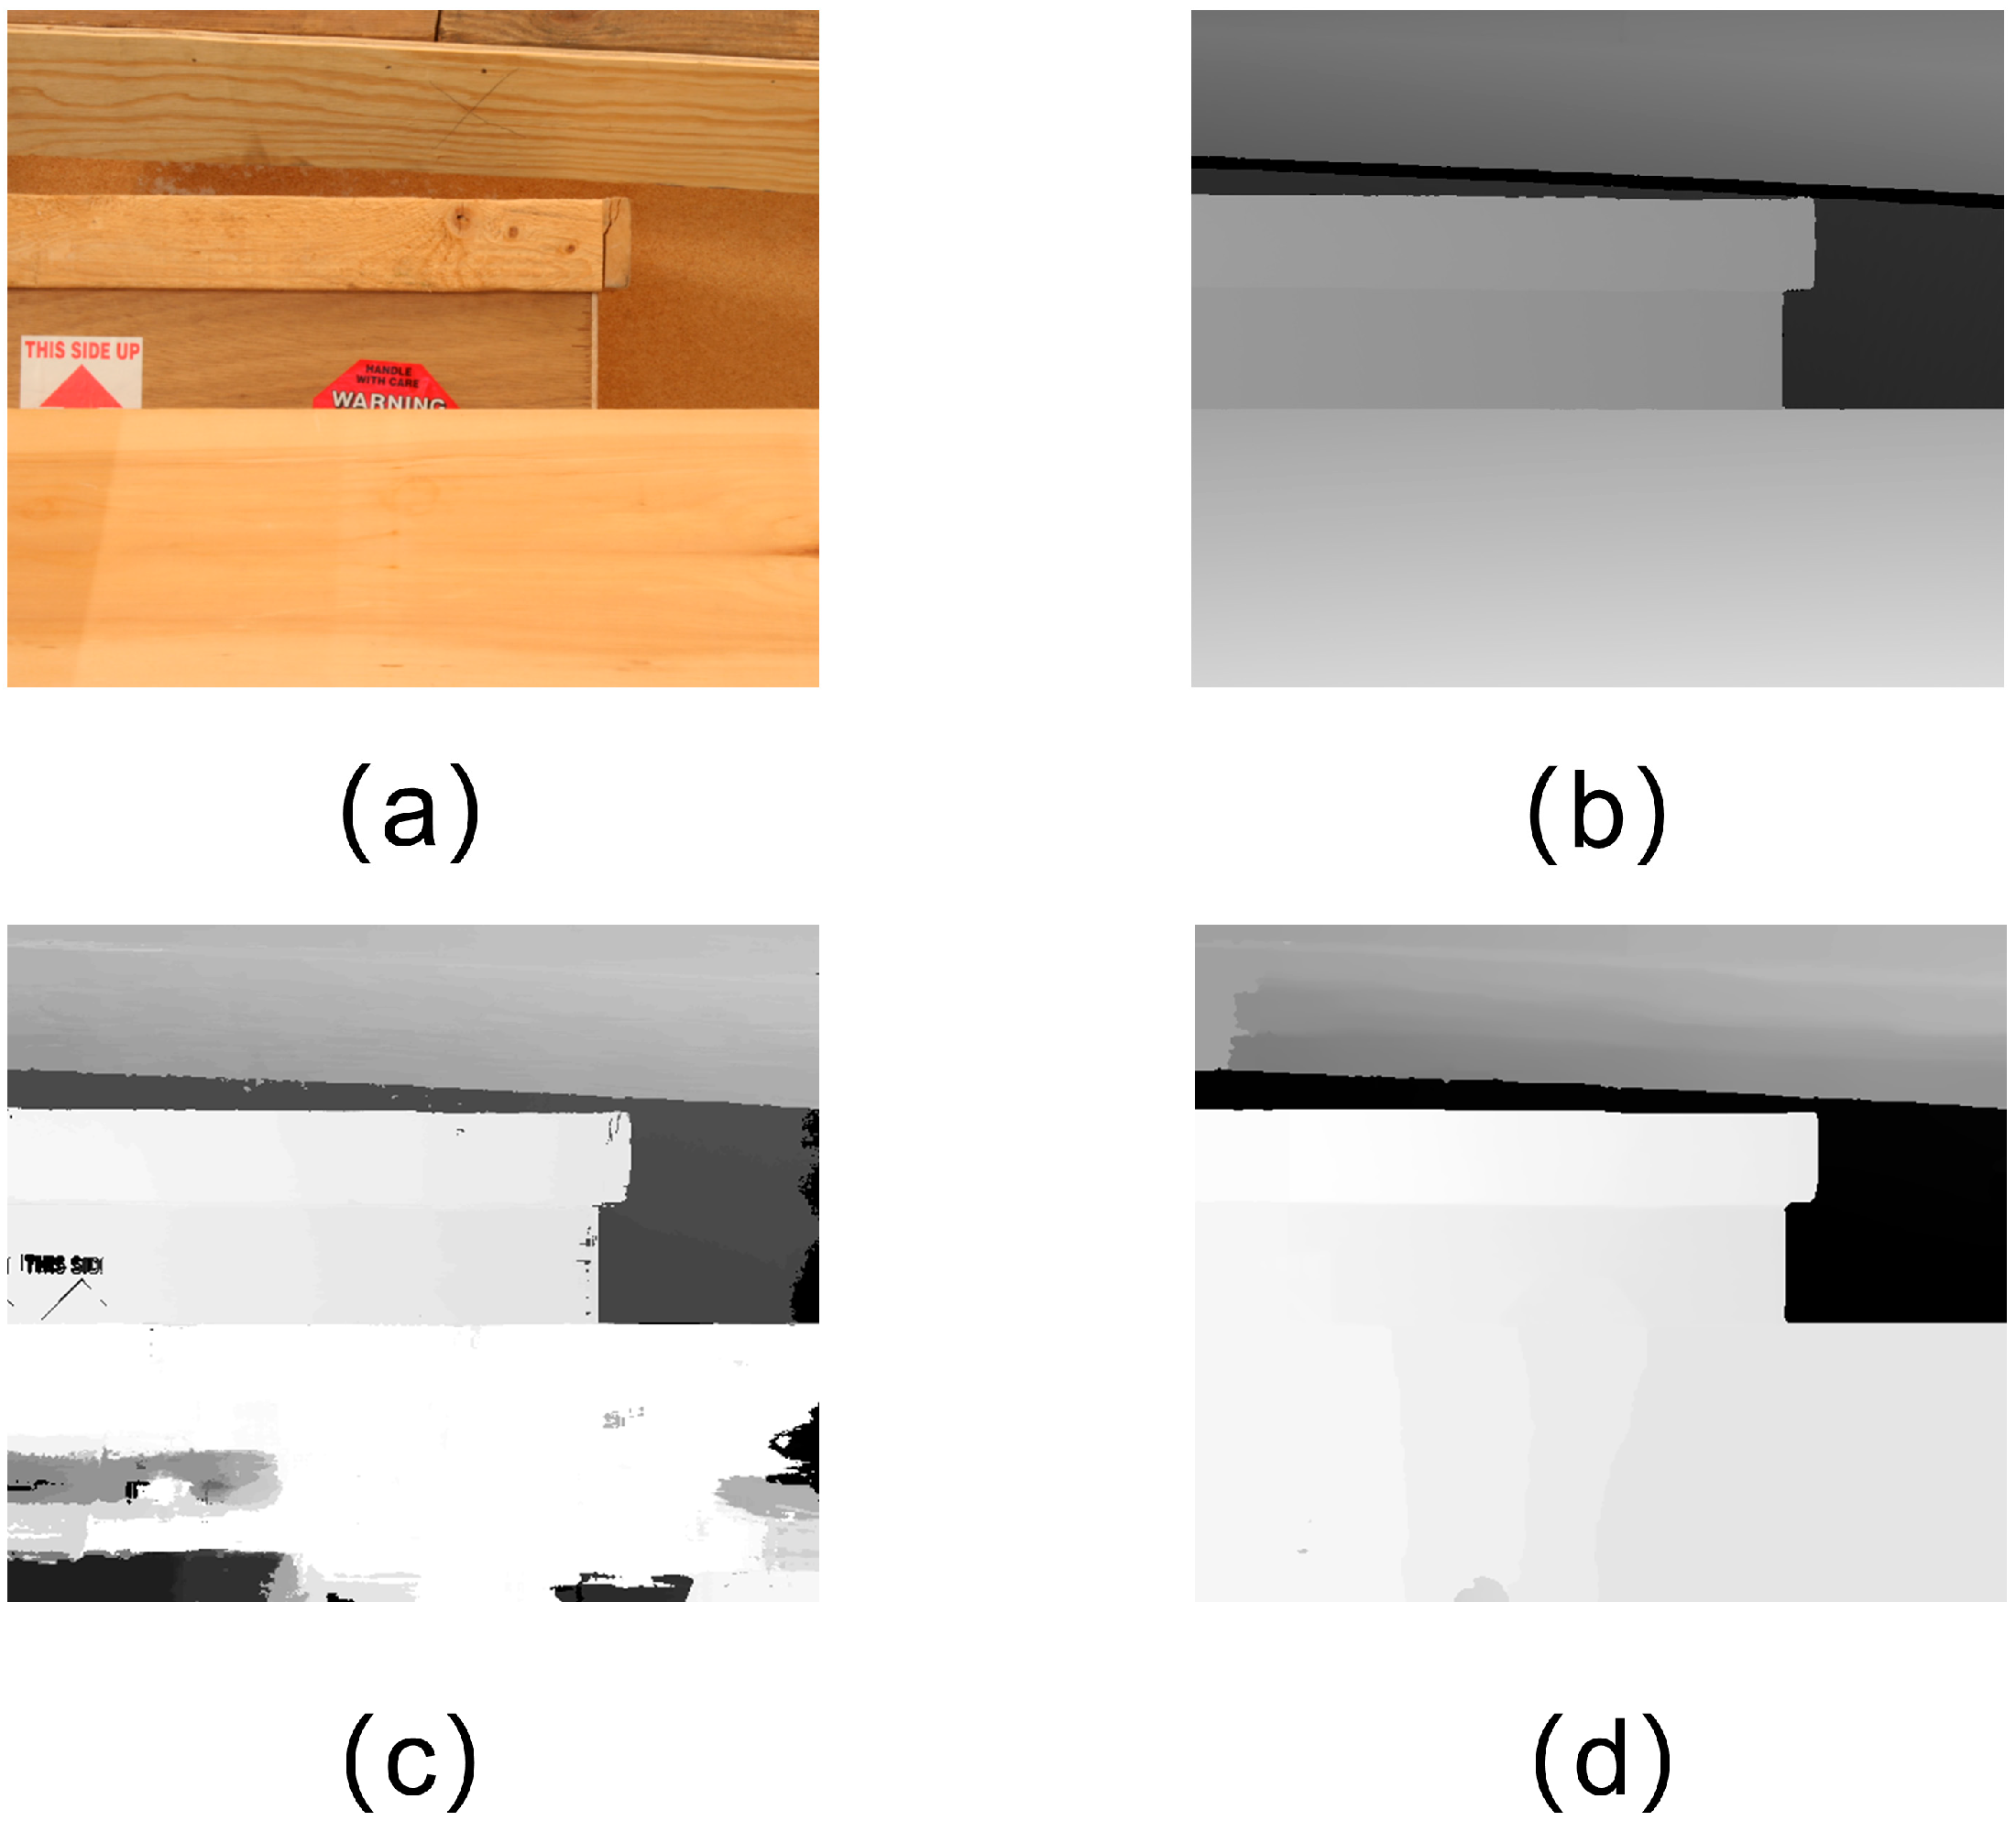
To validate the stability of the proposed algorithm and its performance in real-world environments, experimental tests were conducted using two datasets: a set of low-texture images (Wood) from the Middlebury3.0 platform and a collection of mechanical parts images acquired by a binocular camera. The disparity maps generated by the proposed algorithm are presented in Figure 8 and Figure 9, respectively.
A comparison between the experimental results in Figure 8 and the ground-truth disparity map demonstrates that the improved algorithm produces globally smoother disparity maps, achieving a satisfactory performance in both disparity discontinuity regions and flat areas. As illustrated by the mechanical parts comparison in Figure 9, the enhanced algorithm exhibits a superior capability in preserving the contour information of mechanical components. However, residual mismatch artifacts persist in the disparity maps, necessitating further refinement in subsequent research.
A quantitative analysis reveals that in non-occluded regions of the low-texture Wood images, the average mismatch rate of the SGM algorithm measures 14.7%, while the proposed algorithm achieves 11.2%, demonstrating a 3.5% reduction. Furthermore, for mechanical component images, the proposed algorithm attains an average mismatch rate of 13.3% in non-occluded areas, representing a 4.1% improvement over the SGM algorithm’s 17.4%. Collectively, the proposed method achieves an average mismatch rate of 12.25% across both datasets. Comparative evaluations of disparity map quality and quantitative metrics confirm that the proposed algorithm significantly reduces mismatch artifacts (with a statistically significant average error reduction of 3.8%) while better preserving structural contours, which validates the efficacy of our methodological enhancements.

4. Conclusions

To address the challenges of extensive weakly textured regions and low stereo matching accuracy in large-scale components, this paper proposes an improved cross-scale multi-feature fusion stereo matching algorithm designed for practical industrial deployment. Although neural-network-based methods dominate current research, their reliance on large datasets and high-end hardware to some extent limits their further development in industrial environments. The developed method strategically enhances the traditional census transform through a hardware-compatible adaptive threshold mechanism. By calculating the mean value of all surrounding pixels and dynamically replacing the central pixel value based on statistical deviation analysis, this data-efficient approach significantly improves matching precision without requiring computationally intensive training procedures.
The multi-scale optimization framework further demonstrates the industrial implementation advantages through the adaptive parameter selection of different image scales. Compared with neural methods that require complete retraining of the new environment, our guided filtering-based cost aggregation and inter-scale regularization maintain operational stability while reducing the mismatch rate between datasets to 12.25%. Under standard lighting conditions, this improved method retains edge consistency and structural integrity more effectively than the traditional SGM method, thereby enhancing the fidelity of point cloud reconstruction.
The compatibility of this algorithm with hardware-aware optimization has established a reliable foundation for industrial measurement, especially in the dimensional measurement of large mechanical components, where predictable performance exceeds the theoretical advantages of neural-network-based methods. The subsequent work will continue to study the performance of this method under extreme conditions such as strong light. Under the core principle of maintaining the minimum dependence on the data set, the accuracy and operational flexibility of actual industrial production will be further improved.

Author Contributions

Conceptualization, N.C. and D.S.; methodology, N.C. and P.Z.; software, N.C.; validation, N.C. and D.S.; formal analysis, N.C. and P.Z.; investigation, N.C.; resources, D.S. and P.Z.; data curation, N.C.; writing—original draft preparation, N.C.; writing—review and editing, D.S. and P.Z.; visualization, N.C.; supervision, D.S. and P.Z.; project administration, D.S.; funding acquisition, D.S. All authors have read and agreed to the published version of the manuscript.

Funding

This work is supported by the Key R&D Plan of Shandong Province Major Science and Technology Innovation Project (no. 2023CXGC010701) and the 2024 City-University Integration Development Strategic Engineering Project (no. JNSX2024066).

Institutional Review Board Statement

Not applicable.

Informed Consent Statement

Not applicable.

Data Availability Statement

Data available upon request due to privacy. The data presented in this study are available upon request from the corresponding author.

Conflicts of Interest

The authors declare no conflicts of interest.

References

  1. Scharstein, D.; Szeliski, R. A Taxonomy and Evaluation of Dense Two-Frame Stereo Correspondence Algorithms. Int. J. Comput. Vis. 2002, 47, 7–42. [Google Scholar] [CrossRef]
  2. Cheng, Z.Y.; Lu, R.S.; Mao, C.L. Measurement Method of Three-Dimensional Shape of Bright Surface with Binocular Stereo Vision. Laser Optoelectron. Prog. 2020, 57, 204–211. [Google Scholar]
  3. Jin, Y.; Zhao, H.; Bu, P. Spatial-tree filter for cost aggregation in stereo matching. IET Image Process. 2021, 15, 2135–2145. [Google Scholar] [CrossRef]
  4. Xu, Y.Y.; Xu, X.Y.; Yu, R. Disparity optimization algorithm for stereo matching using improved guided filter. J. Adv. Comput. Intell. Inform. 2019, 23, 625–633. [Google Scholar] [CrossRef]
  5. Yu, W.J.; Ye, S.; Guo, Y.; Guo, J. Stereo Matching Algorithm Based on Improved Census Transform and Multi-Feature Fusion. Laser Optoelectron. Prog. 2022, 59, 0810011. [Google Scholar]
  6. Pham, C.C.; Jeon, J.W. Efficient image sharpening and denoising using adaptive guided image filtering. IET Image Process. 2015, 9, 71–79. [Google Scholar] [CrossRef]
  7. Cho, H.; Lee, H.; Kang, H.; Lee, S. Bilateral texture filtering. ACM Trans. Graph. 2014, 33, 128. [Google Scholar] [CrossRef]
  8. Tan, P.; Monasse, P. Stereo disparity through cost aggregation with guided filter. Image Process. Line 2014, 4, 252–275. [Google Scholar] [CrossRef]
  9. Yang, C.Y.; Song, Z.R.; Zhang, X. A stereo matching algorithm for coal mine underground images based on threshold and weight under census Transform. Coal Sci. Technol. 2024, 52, 216–225. [Google Scholar]
  10. Wang, Y.; Gu, M.; Zhu, Y.F.; Chen, G.; Xu, Z.D.; Guo, Y.Q. Improvement of AD-census algorithm based on stereo vision. Sensors 2022, 22, 6933. [Google Scholar] [CrossRef]
  11. Zhang, S.M.; Wu, M.X.; Wu, G.X.; Liu, F. Fixed window aggregation AD-census algorithm for phase-based stereo matching. Appl. Opt. 2019, 58, 8950–8958. [Google Scholar] [CrossRef]
  12. Zhu, S.P.; Yan, L. Local stereo matching algorithm with efficient matching cost and adaptive guided image filter. Vis. Comput. 2017, 33, 1087–1102. [Google Scholar] [CrossRef]
  13. Xiao, X.W.; Guo, B.X.; Li, D.R.; Li, L.H.; Yang, N.; Liu, J.C.; Zhang, P.; Peng, Z. Multi-view stereo matching based on self-adaptive patch and image grouping for multiple unmanned aerial vehicle imagery. Remote Sens. 2016, 8, 89. [Google Scholar] [CrossRef]
  14. Irfan, M.A.; Magli, E. Exploiting color for graph-based 3D point cloud denoising. J. Vis. Commun. Image Represent. 2021, 75, 103027. [Google Scholar] [CrossRef]
  15. Deng, C.G.; Liu, D.Y.; Zhang, H.D.; Li, J.R.; Shi, B.J. Semi-Global Stereo Matching Algorithm Based on Multi-Scale Information Fusion. Appl. Sci. 2023, 13, 1027. [Google Scholar] [CrossRef]
  16. Liu, Z.G.; Li, Z.; Ao, W.G.; Zhang, S.S.; Liu, W.L.; He, Y.Z. Multi-Scale Cost Attention and Adaptive Fusion Stereo Matching Network. Electronics 2023, 12, 1594. [Google Scholar] [CrossRef]
  17. Guo, Y.Q.; Gu, M.J.; Xu, Z.D. Research on the Improvement of Semi-Global Matching Algorithm for Binocular Vision Based on Lunar Surface Environment. Sensors 2023, 23, 6901. [Google Scholar] [CrossRef]
  18. Bu, P.H.; Wang, H.; Dou, Y.H.; Wang, Y.; Yang, T.; Zhao, H. Weighted omnidirectional semi-global stereo matching. Signal Process. 2024, 220, 109439. [Google Scholar] [CrossRef]
  19. Zhou, Z.Q.; Pang, M. Stereo Matching Algorithm of Multi-Feature Fusion Based on Improved Census Transform. Electronics 2023, 12, 4594. [Google Scholar] [CrossRef]
  20. Park, I.K. Deep self-guided cost aggregation for stereo matching. Pattern Recognit. Lett. 2018, 112, 168–175. [Google Scholar]
  21. Stentoumis, C.; Grammatikopoulos, L.; Kalisperakis, I.; Karras, G. On accurate dense stereo-matching using a local adaptive multi-cost approach. ISPRS J. Photogramm. Remote Sens. 2014, 91, 29–49. [Google Scholar] [CrossRef]
  22. Liu, J.; Zhang, J.X.; Dai, Y.; Su, H. Dense stereo matching based on cross-scale guided image filtering. Acta Opt. Sin. 2018, 38, 0115004. [Google Scholar]
  23. Hou, Y.G.; Liu, C.Y.; An, B.; Liu, Y. Stereo matching algorithm based on improved Census transform and texture filtering. Optik 2022, 249, 168186. [Google Scholar] [CrossRef]
  24. Kong, L.Y.; Zhu, J.P.; Ying, S.C. Stereo matching based on guidance image and adaptive support region. Acta Opt. Sin. 2020, 40, 0915001. [Google Scholar] [CrossRef]
  25. Zhu, C.T.; Chang, Y.Z. Simplified High-Performance Cost Aggregation for Stereo Matching. Appl. Sci. 2023, 13, 1791. [Google Scholar] [CrossRef]
  26. Hamid, M.S.; Abd Manap, N.F.; Hamzah, R.A.; Kadmin, A.F. Stereo matching algorithm based on deep learning: A survey. J. King Saud Univ. Comput. Inf. Sci. 2022, 34, 1663–1673. [Google Scholar] [CrossRef]
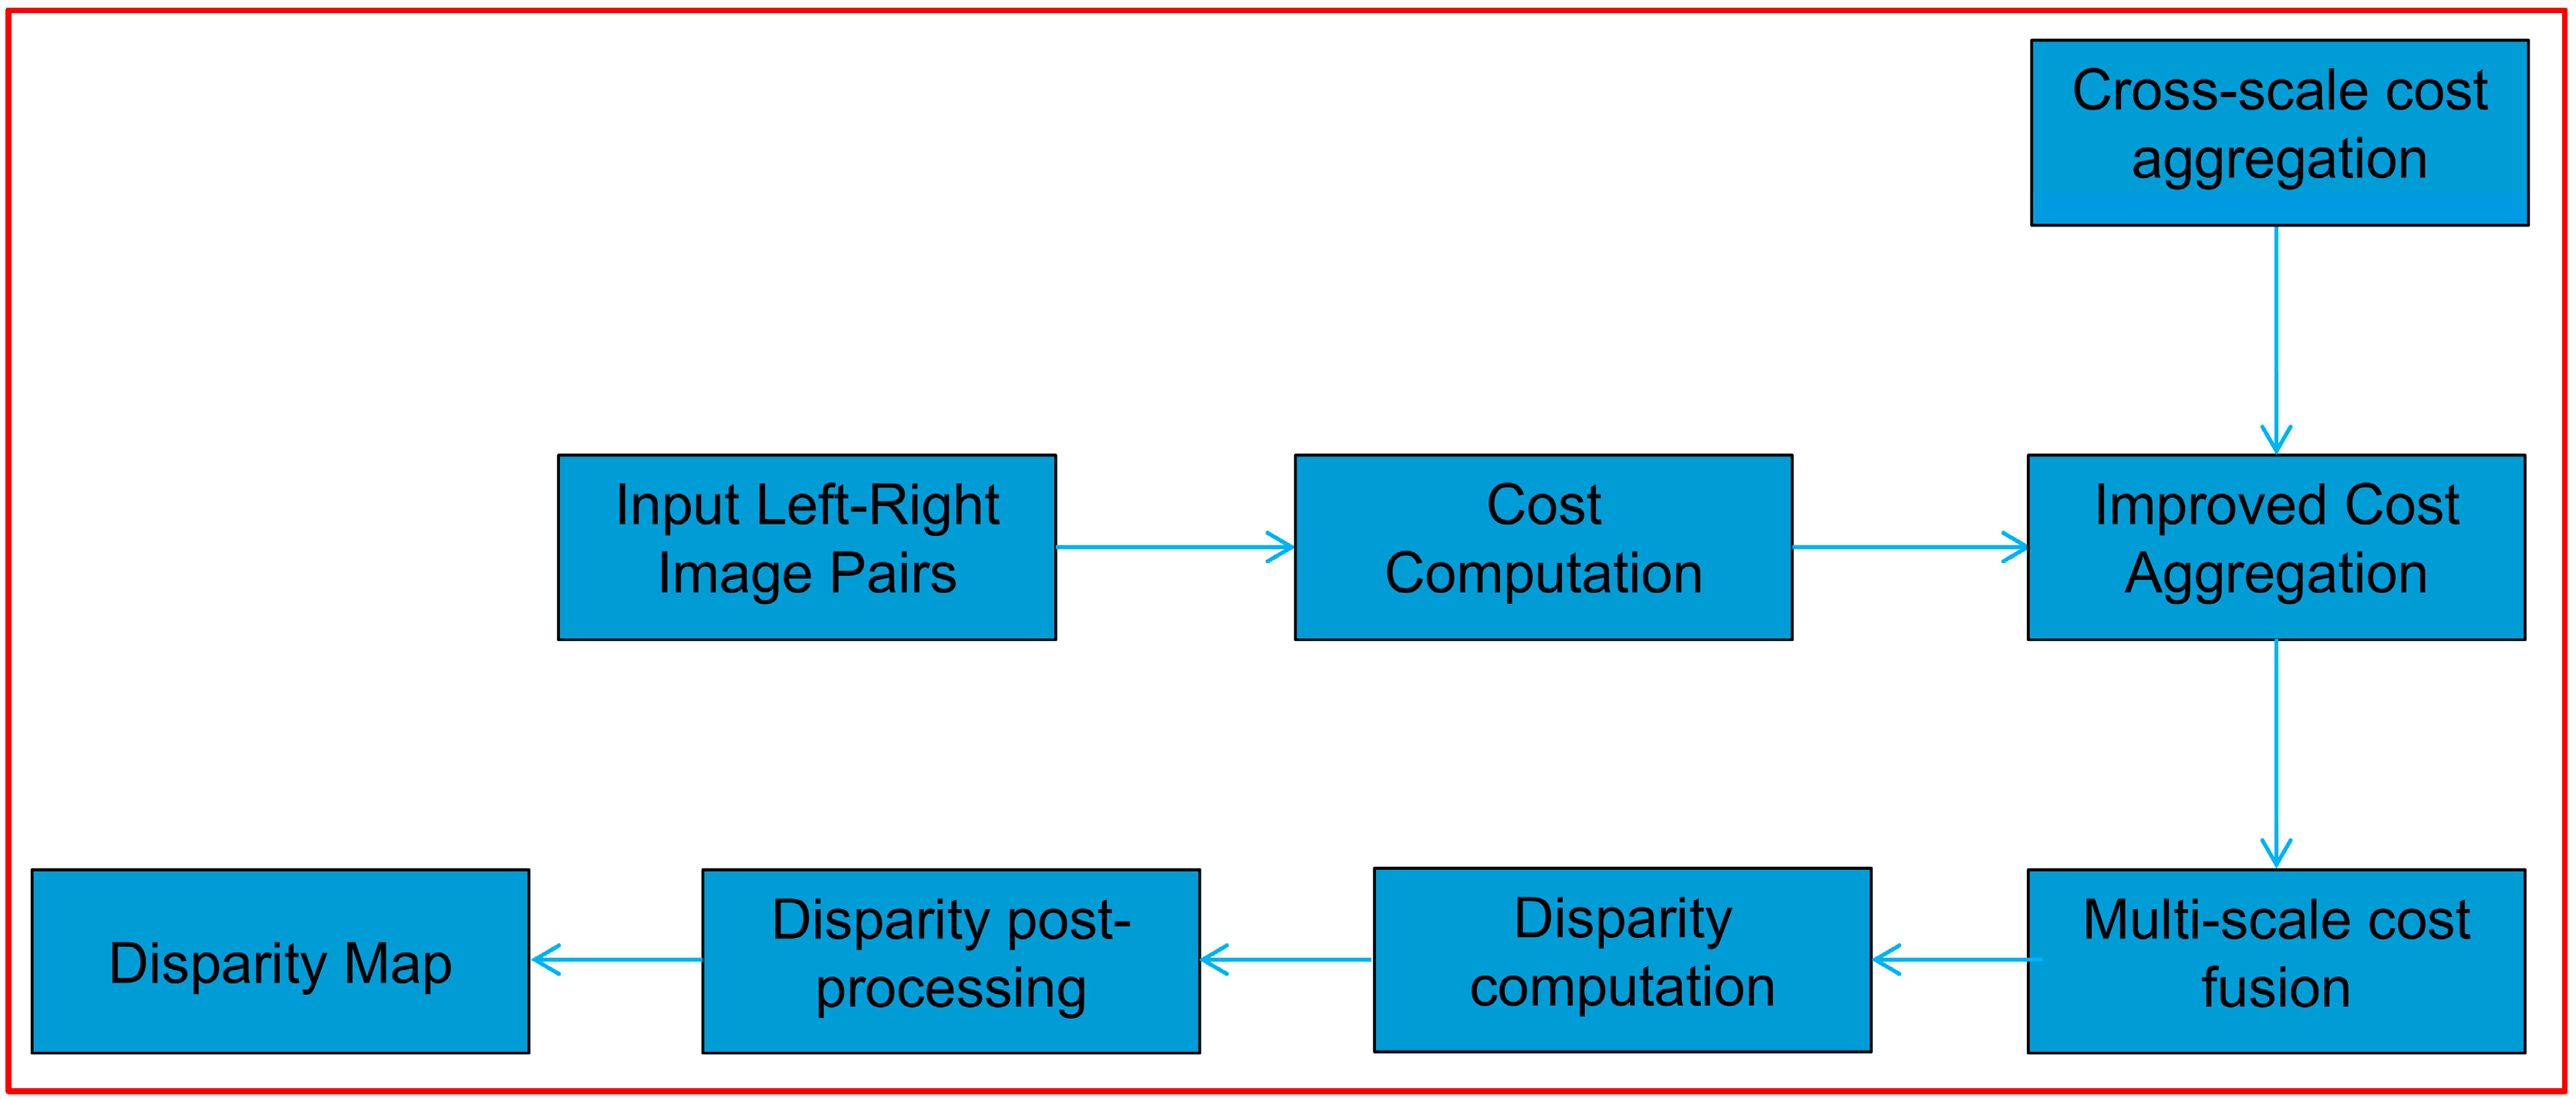
Figure 1. Flowchart of the proposed algorithm.
Applsci 15 05837 g001
Figure 2. Census transform.
Applsci 15 05837 g002
Figure 3. Census transform under central pixel mutation.
Applsci 15 05837 g003
Figure 4. Improved census transform.
Applsci 15 05837 g004
Figure 5. Disparity maps with different cost-computation methods.
Applsci 15 05837 g005
Figure 6. Comparative analysis of the baseline versus proposed cost-aggregation maps.
Applsci 15 05837 g006
Figure 7. Schematic diagram of the stereo matching algorithm pipeline.
Applsci 15 05837 g007
Figure 8. Wood: (a) left image; (b) standard disparity; (c) disparity of stereo matching by SGM; (d) disparity of stereo matching in this paper.
Applsci 15 05837 g008
Figure 9. Mechanical parts: (a) left image; (b) disparity of stereo matching by SGM; (c) disparity of stereo matching in this paper.
Applsci 15 05837 g009
Table 1. Key parameter settings of the proposed algorithm in this study.
Parameter ω k T d αs λ
Value910.740.9
Table 2. Mismatch rates of different cost algorithms in non-occluded regions.
AlgorithmTeddyConesVenusAverage
Census6.343.490.363.40
SGM7.233.710.793.91
Proposed5.942.710.312.99
Table 3. Mismatch rates of different cost algorithms in all regions.
AlgorithmTeddyConesVenusAverage
Census10.49.430.536.79
SGM11.29.070.917.06
Proposed11.48.360.486.75
Table 4. Runtime of different cost algorithms in non-occluded regions.
AlgorithmTeddyConesVenusAverage
Census23.132.427.327.6
SGM36.839.235.137.03
Proposed5.942.710.312.99
Table 5. Runtime of different cost algorithms in all regions.
AlgorithmTeddyConesVenusAverage
Census37.445.341.741.47
SGM44.653.746.548.27
Proposed28.936.231.632.23
Disclaimer/Publisher’s Note: The statements, opinions and data contained in all publications are solely those of the individual author(s) and contributor(s) and not of MDPI and/or the editor(s). MDPI and/or the editor(s) disclaim responsibility for any injury to people or property resulting from any ideas, methods, instructions or products referred to in the content.