Article

Enhanced Detection of Mitochondrial Heteroplasmy and DNA Hypomethylation in Adipose-Derived Mesenchymal Stem Cells Using a Novel Adaptive Sampling Protocol

by
Antonina Gospodinova
1,
Yuliia Mariienko
1,
Diana Pendicheva-Duhlenska
2,
Soren Hayrabedyan
1 and
Krassimira Todorova
1,2,*
1
Laboratory of Reproductive OMICs Technology, Institute of Biology and Immunology of Reproduction, Bulgarian Academy of Sciences, 1113 Sofia, Bulgaria
2
Department of Pharmacology, Pharmacy Faculty, Medical University-Pleven, 5800 Pleven, Bulgaria
*
Author to whom correspondence should be addressed.
Appl. Sci. 2025, 15(11), 5822; https://doi.org/10.3390/app15115822
Submission received: 30 March 2025 / Revised: 13 May 2025 / Accepted: 14 May 2025 / Published: 22 May 2025
(This article belongs to the Special Issue Cell Biology: Latest Advances and Prospects)

Abstract

:
Objective: Mitochondria drive cellular energy production and regulate key biological processes. High levels of heteroplasmic in mitochondrial DNA (mtDNA) variants can cause mitochondrial dysfunction and clinical symptoms. Third-generation sequencing overcomes the limitations of traditional mtDNA analysis methods, offering improved cost, throughput, and sensitivity. We developed an integrated approach for analyzing methylation patterns and genetic variations in mtDNA and ADME genes. Methods: We implemented Oxford Nanopore’s long-read sequencing with adaptive sampling (AS) to enrich enzymatically linearized mtDNA and absorption, distribution, metabolism, and excretion (ADME) genes without PCR amplification, enabling native sequencing in adipose-derived mesenchymal stem cells (AdMSC). Our custom algorithm preserved phase relationships between base modifications and sequence polymorphisms. Results: We identified differential methylation patterns in ADME genes correlating with specific genetic variants, suggesting epigenetic regulation of drug response. Adaptive sampling identifies a wider range of variant diversity, while whole genome sequencing (WGS) uncovers higher-frequency hotspots. Both methods offer complementary insights into mitochondrial heteroplasmy. In mtDNA, direct sequencing showed extensive hypomethylation, and low levels of non-CpG methylation were detected regardless of sequencing coverage depth. These sparse methylation patterns showed non-random distribution, correlating with functional regions and heteroplasmic sites. Conclusions: This study demonstrates the utility of adaptive sampling for the integrated analysis of mtDNA heteroplasmy and native base modifications, revealing widespread hypomethylation independent of coverage depth. The approach showcases the potential for combined pharmacoepigenomic and mitochondrial profiling in precision medicine, disease modeling, and therapeutic development.

1. Introduction

Organ-on-chip platforms have rapidly gained recognition as highly predictive and physiologically relevant tools for modeling human tissues and diseases in vitro, offering enhanced translational potential compared to conventional cell culture methods. To fully characterize these microphysiological systems, it is critical to assess both nuclear and mitochondrial genetic integrity, as well as epigenetic modifications that can influence cellular responses to drugs or environmental stimuli. While profiling absorption, distribution, metabolism, and excretion (ADME) genes remains central to understanding pharmacokinetics and toxicity in organ-on-chip setups, investigating mitochondrial genome perturbations—including sequence variations and methylation patterns—provides a more comprehensive picture of cellular metabolism and stress responses.
The integrity of the mitochondrial genome (mtDNA) is crucial for cellular energy production, metabolism [1,2,3,4], and overall cell health [5,6,7,8,9,10]. Unlike the nuclear genome, mtDNA exists in multiple copies per cell and is particularly susceptible to accumulating sequence variations and molecular damage [1,2,3,4,11,12,13,14,15] leading to heteroplasmy (the coexistence of different mtDNA types within a cell) and epigenetic modifications such as DNA methylation [16,17,18]. Accurately characterizing these mtDNA features is vital for understanding cellular function, aging, and disease pathogenesis, but it poses significant technical challenges [15].
The human mitochondrial genome is circular, consisting of 37 genes, has no introns, and is represented by naked double-stranded DNA, more susceptible to molecular modification and damage [13,14,15]. MtDNA defects were mainly studied using Sanger sequencing, Southern blot, and long and quantitative PCR. However, these technologies are expensive and limited in speed, throughput, and sensitivity.
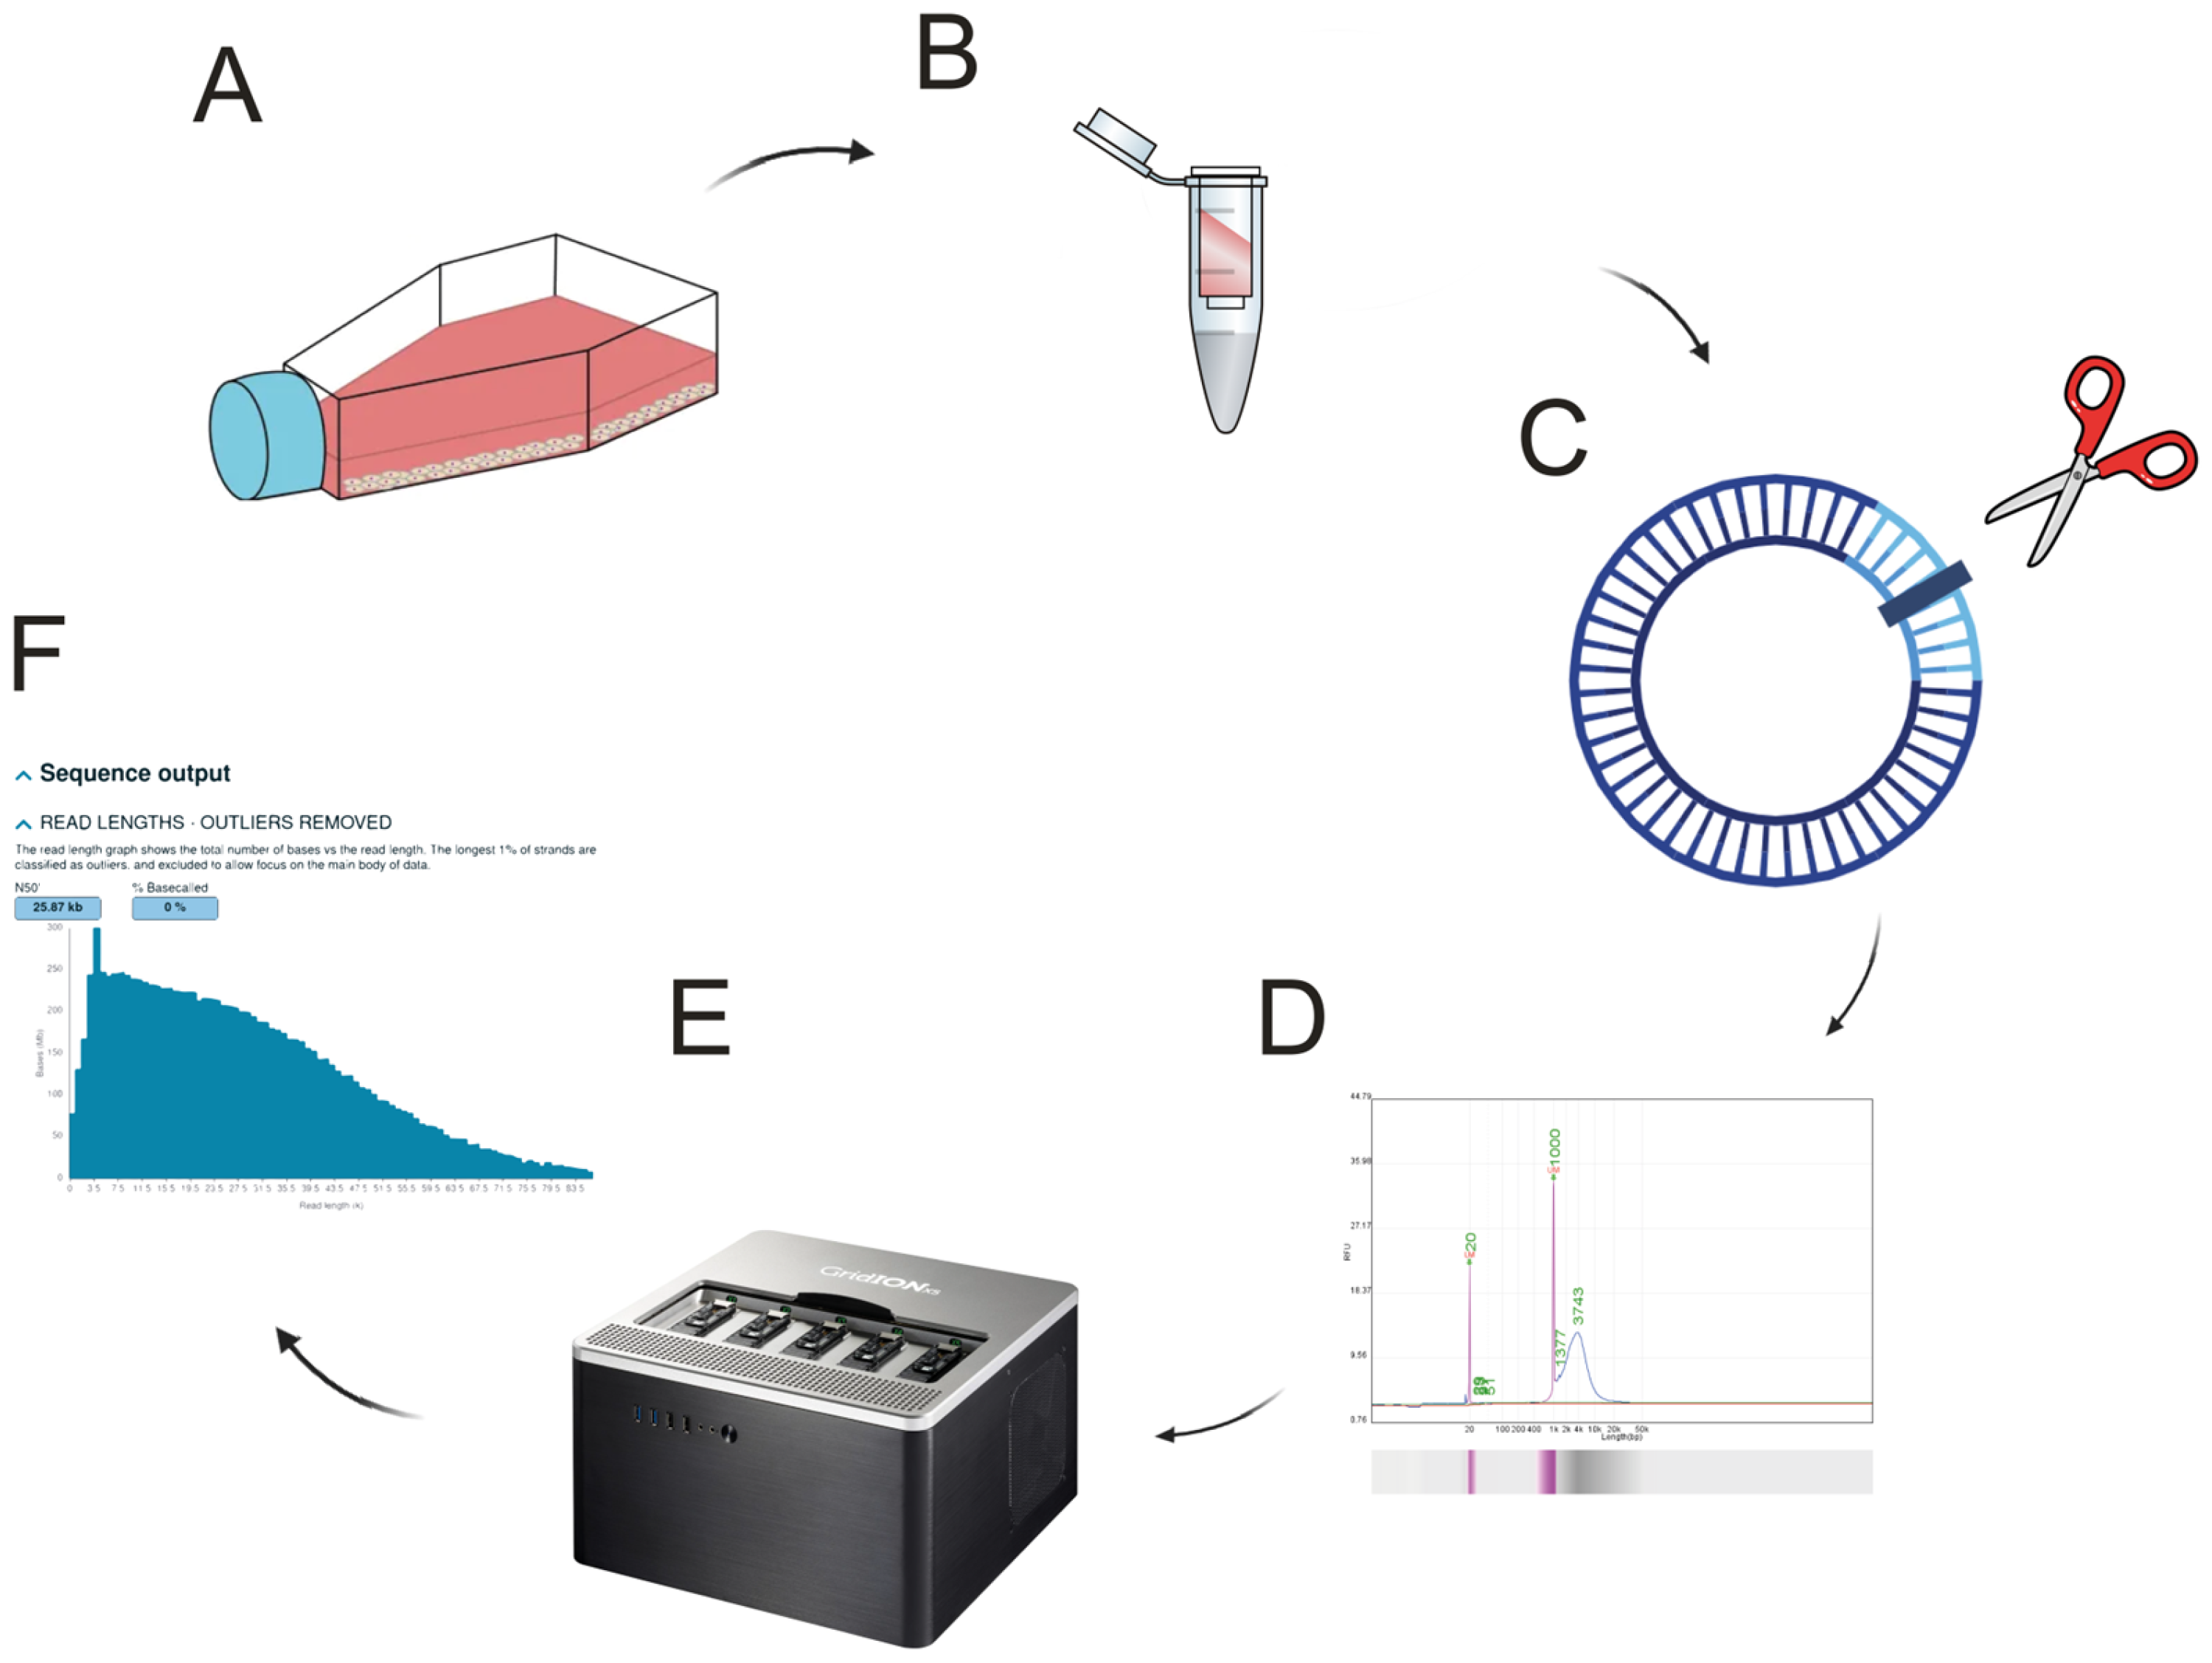
Recently, next-generation sequencing (NGS) has been more and more explored to study mtDNA defects. In this study, we employed third-generation sequencing technology from Oxford Nanopore, which utilizes flow cells containing arrays of nanopores embedded in an electro-resistant membrane. Each nanopore is coupled to an electrode connected to a channel and sensor chip that continuously monitors the ionic current passing through the pore. As a DNA or RNA molecule translocates through the nanopore, characteristic disruptions in the current produce a so-called “squiggle” signal. This signal is then deciphered by real-time base-calling algorithms to reconstruct the nucleotide sequence. Unlike short-read sequencing methods, which constrain analyses to limited read lengths, nanopore sequencing accommodates continuous, long-read data. Such extended read lengths enable complete resolution of repetitive regions, identification of structural variants, and discrimination between different isoforms, thereby offering a more comprehensive genomic characterization. Long-read sequencing is based on a simplified protocol that requires nanopore adaptor ligation of the sequenced DNA strand. Therefore, opening the circular mitochondrial DNA is crucial for this protocol to work. DNA shearing is one way to produce many linearized strands of DNA, but unless ultrasound or enzyme approaches are applied, it results in non-uniform length of the future sequencing reads.
To avoid amplification-related biases and to enable the simultaneous detection of base modifications (e.g., methylation) alongside the nucleotide sequence, we employed another ONT technology referred to as Adaptive Sampling. This software-controlled method is unique to nanopore sequencing and selectively enriches the desired region without PCR amplification. By providing a FASTA file specifying the target region, the adaptive sampling algorithm examines the first 400–500 bp of each DNA fragment as it enters the nanopore. If the partial sequence aligns to the region of interest, the read is permitted to continue translocating for full sequencing; otherwise, it is rapidly rejected, freeing the nanopore for a new molecule. This approach preserves the native genomic DNA structure while specifically enhancing coverage of the target region.
The protocol was initially optimized using the human choriocarcinoma cell line JAR, with evaluations of two commercial restriction endonucleases, PvuII-HF and BamHI-HF. Subsequently, the optimized protocol was applied to human adipose-derived mesenchymal stem cells (HAdMSCs), which were selected for their regenerative potential, versatility, abundance, and capacity to differentiate into multiple lineages—properties that make them valuable for therapeutic applications in regenerative medicine and pharmacogenomic studies. It is noted that this cell population is also frequently referred to in the literature as adipose stem cells (ASC) or adipose-derived stem cells (ADSC). This study demonstrates a straightforward, reproducible, and reliable protocol for the targeted sequencing of mitochondrial DNA without amplification requirements, while simultaneously sequencing nuclear genes of interest.
Here, we test the hypothesis that combining restriction-enzyme linearization of the circular mitochondrial genome with real-time Oxford Nanopore adaptive sampling (AS) yields a single-tube, PCR-free workflow that can simultaneously profile mtDNA heteroplasmy and, potentially, DNA methylation in AdMSC at single-molecule resolution. Specifically, we set out to quantify the on-target enrichment and coverage uniformity that AS affords relative to conventional whole-genome sequencing, benchmark the sensitivity and accuracy of heteroplasmy against orthogonal controls, and provide an analysis pipeline strategy that phases genetic information to facilitate mitochondrial studies in regenerative-medicine models. By validating this streamlined protocol in primary human AdMSC, we aim to equip the stem-cell community with a cost-effective tool for interrogating mitochondrial dysfunction in metabolic disease and ageing.

2. Materials and Methods

2.1. Cell Line

Human choriocarcinoma cell line JAR was obtained from American Type Culture Collection (ATCC, Manassas, VA, USA) and cultured in RPMI-1640 medium with HEPES modification supplemented with L-glutamine (Sigma-Aldrich, R5886, Milwaukee, WI, USA), 10% fetal bovine serum (FBS), and 1% penicillin/streptomycin solution. Cells were maintained at 37 °C in a humidified incubator with 5% CO2 atmosphere. For DNA and RNA analyses, cell pellets containing approximately 1–2 × 10⁶ cells from a single T75 flask were harvested and stored at −80 °C.
Human adipose-derived mesenchymal stem cells (HAdMSC) cell line was purchased from Innoprot (Derio, Spain) and cultured in mesenchymal stem cell medium containing 5% fetal bovine serum (FBS), 1% mesenchymal stem cell growth supplements and 1% penicillin/streptomycin solution, all provided by Innoprot. Cells were cultured in Corning™ CellBIND™ surface cell culture flasks—T75—and maintained at 37 °C in a humidified incubator with 5% CO2. When they reached 80–90% confluency, they were cryopreserved in complete medium +15% FBS and 15% DMSO following the slow-freezing protocol. For DNA and RNA analysis, a dry pellet from one T75 flask, approximately 5 × 10⁵ cells, was directly frozen at −80 °C (Figure 1).

2.2. DNA Isolation

Total DNA was isolated using ZymoResearch Quick-DNA Miniprep Kit (Irvine, CA, USA) according to the manufacturer’s instructions. Briefly, one tube with a dry pellet Jar passage 31 and HAdMSC passage 5 was resuspended in 100 µL Elution Buffer (EB) for a total of 130 µL in 1.5 mL Eppendorf LoBind tube. Then, 130 µL BioFluid & Cell Buffer and 13 µL Proteinase K were added. The mixture was vortexed for 10–15 s and was incubated at 55 °C for 10 min. After the incubation, 280 µL Genomic Binding Buffer was added to the digested sample, which was vortexed again for 10–15 s. The mixture was transferred to a Zymo-Spin™ IIC-XLR Column in a collection tube and centrifuged at ≥12,000× g for 1 min. The collection tube with the flow through was discarded. The Zymo-Spin™ IIC-XLR Column was placed onto a new collection tube and 400 µL of DNA Pre-Wash Buffer was added. They were centrifuged at ≥12,000× g for one minute again, after which 700 µL of g-DNA Wash Buffer was added and they were centrifuged again under the same conditions. Finally, the spin column was transferred to a clean microcentrifuge tube and 50 µL Elution Buffer was added directly to the matrix. The sample was incubated for 5 min at room temperature, then centrifuged at ≥14,000× g for 1 min. The eluted DNA was stored at −80 °C for future use.

2.3. DNA Quantification and Quality Control

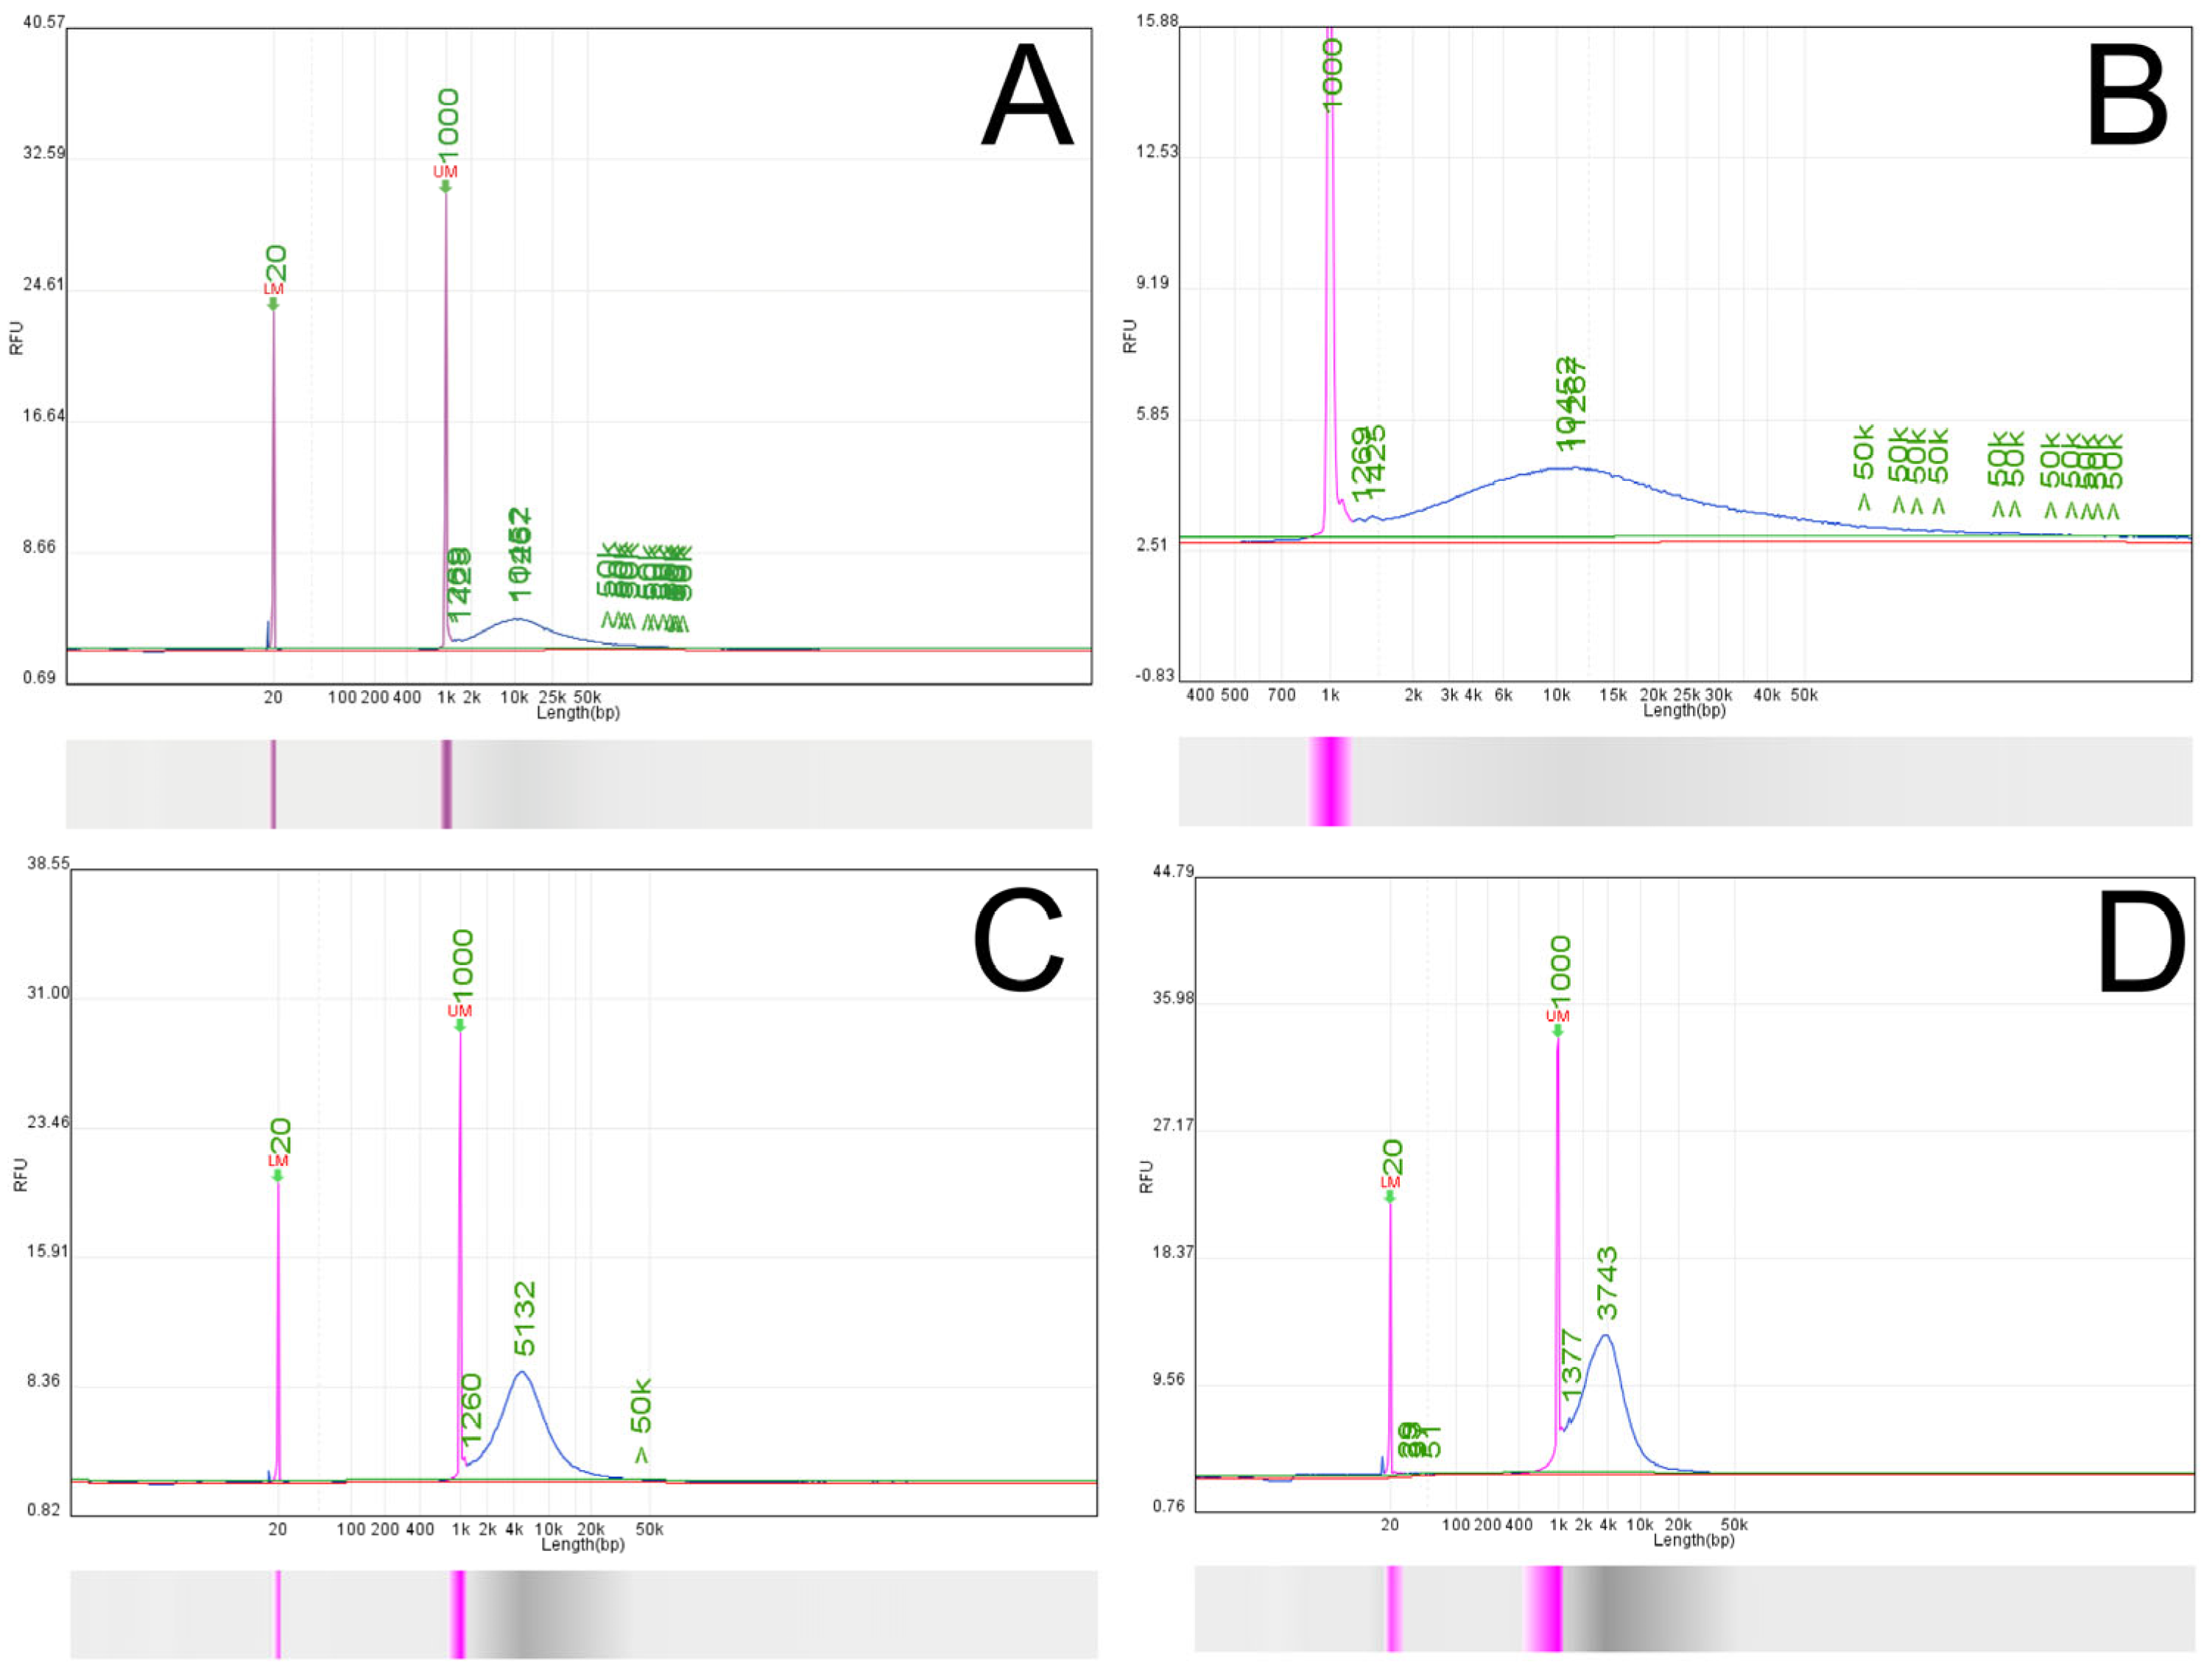
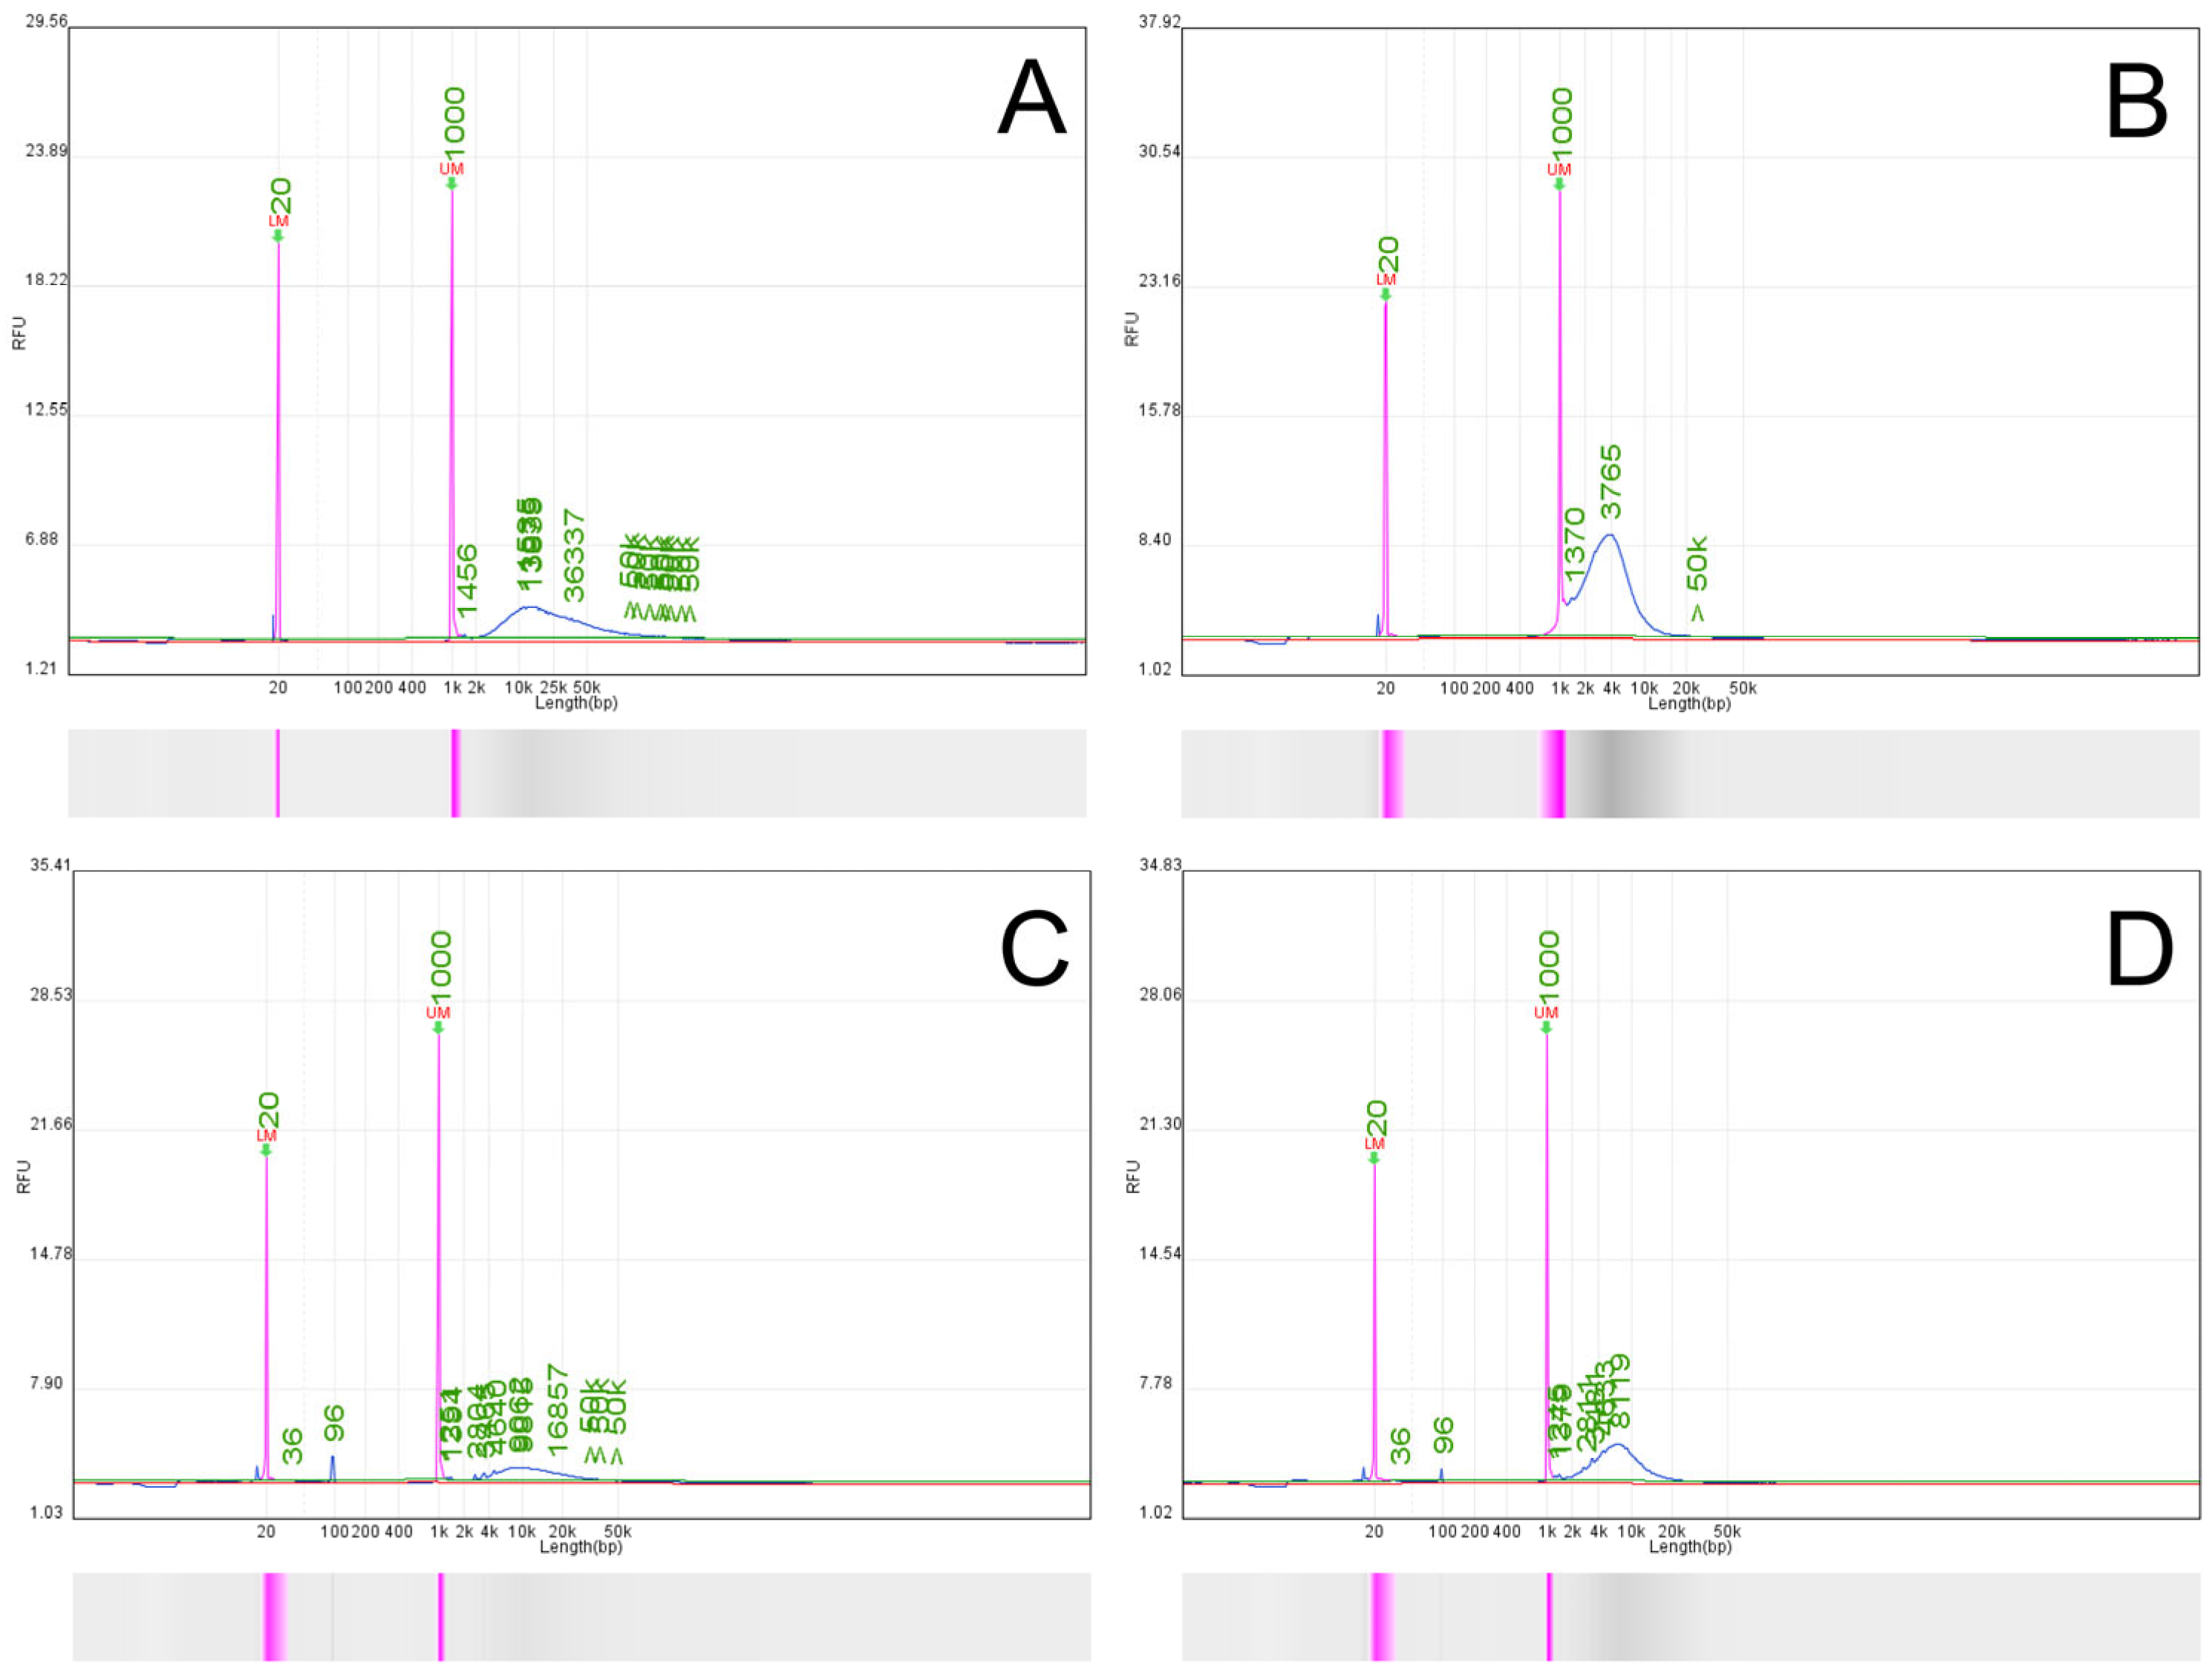
The quantity and quality of the extracted sample were assessed on a Qubit Fluorometer and Qsep-100 Bio-Fragment Analyzer using Qubit dsDNA HS Assay Kit and High Sensitivity KiloBase N3 cartridge (Waltham, MA, USA). The Qubit Fluorometer was first calibrated with standards 1 and 2 after mixing 190 µL working solution with 10 µL of the standard; the solution was then briefly vortexed and left for 2 min at room temperature. The sample solution was prepared by mixing 1 µL DNA sample in 199 µL working solution, vortexed briefly, and left for 2 min at room temperature. For the bio-fragment analysis, a 2 ng/µL concentration of the gDNA has been chosen. For this purpose, 0.6 µL gDNA was mixed with 19.4 µL Dilution Buffer. On the buffer tray, a 20 µL 20–1000 bp Alignment marker (109-100 A) was placed on position MA1, and a 40× diluted 500 bp–23 kB Size marker (C109700) was positioned on MA3. The calibration and the fragment analysis were run on a 4 kV current.

2.4. Enzymatic Treatment

Nanopores can only capture linearized DNA, so any mtDNA molecule must be sufficiently degraded to lose its native circular conformation before sequencing [19]. The restriction endonuclease BamHI-HF or PvuII-HF, purchased from New England Biolabs (Boston, MA, USA) (R3136S and R3151SS), performed the linearization step. The enzymes recognize 5′-G^GATCC-3′ and 5′-CAG^CTG-3′, in the presence of CutSmart Buffer, as previously described [20]. Briefly, a starting amount of 1300 ng (23 µL) gDNA was transferred to a 1.5 mL Eppendorf LoBind tube. Then, the following reagents were added: 5 µL 10× rCutSmart Buffer, 20.9 µL molecular grade water, and 1.1 µL PvuII-HF. The reaction was incubated at 37 °C for 1 h. The efficiency of this enzymatic digestion step was assessed by comparing the fragment size distribution profile of the treated sample against an aliquot of the original untreated native gDNA using capillary electrophoresis (Qsep-100 Bio-Fragment Analyzer, BiOptic Inc., New Taipei City, Taiwan), as presented in Section 3.1 (Figure 2 and Figure 3). The starting amount of gDNA is higher than the 1 µg gDNA requested for starting the ligation protocol of Oxford Nanopore Technologies (Oxford, UK) because there is a decrease in the final quantity of the DNA after the digestion and the cleaning step.
Exonuclease V was purchased from New England Biolabs (M0345S) to test the genomic DNA cleavage. The reaction was prepared as described in the protocol; 1 µg DNA was mixed with 5 µL NebBuffer (10×), 5 µL ATP (10 mM), 1 µL Exonuclease V (10 units), and filled with molecular grade water up to 50 µL. It was then incubated at 37 °C for 30 min and heat-inactivated at 70 °C for 30 min.

2.5. DNA Purification by AMPure Beads

After the digested DNA is quantified and assessed for quality, we recommend conducting a clean-up step using Agencourt AMPure XP beads [21]. In a nutshell, 90 µL of the resuspended AMPure XP beads were added to the sample. The volume was determined from the following equation: (Volume of Agencourt AMPure XP per reaction) = 1.8 × (Reaction Volume). The reaction was incubated for 5 min on a Hula mixer. Then, 500 µL 70% ethanol was freshly prepared. The reaction was placed on EpiCypher 1.5 mL Tubes Magnetic Separation Rack for approximately 2 min until the solution became clear. With the tube still on the magnetic rack, the cleared solution was aspirated and discarded. Two washing steps were performed with 200 µL 70% ethanol while keeping the tube on the magnet. Finally, the sample was removed from the rack, eluted in 49 µL molecular grade water, and incubated for 10 min on a Hula mixer. Once the incubation finished, the tube was placed again onto the EpiCypher rack, and the cleared solution was transferred to a new 1.5 LoBind tube. The cleaned DNA was once again quantified and quality checked.

2.6. ONT Library Preparation and Sequencing on the GridION Instrument

Two distinct libraries were prepared for comparative analysis in this study. (i) WGS Baseline Library: Approximately 1 µg of untreated native genomic DNA (gDNA) served as the input for standard library preparation. This library represents the baseline genomic material sequenced via WGS. (ii) Adaptive Sampling (AS) Library: Approximately 1 µg of gDNA that had been previously treated with PvuII-HF (as described in Section 2.4) served as the input for this library. This library was subjected to targeted enrichment via adaptive sampling during sequencing. Each DNA sample was prepared independently for Oxford Nanopore Technologies (ONT) (Oxford, UK) sequencing on R9.4.1 flow cells using the Ligation Sequencing Kit (SQK-LSK109, ONT). Library preparation commenced with DNA repair and end-preparation. In a 0.2 mL PCR tube, 48 µL containing 1 µg of input DNA was mixed with 1 µL DNA control sample (CS, provided with kit), 3.5 µL NEBNext FFPE DNA Repair Buffer (New England Biolabs [NEB]), 2 µL NEBNext FFPE DNA Repair Mix (NEB), 3.5 µL NEBNext Ultra II End-prep Reaction Buffer (NEB), and 3 µL NEBNext Ultra II End-prep Enzyme Mix (NEB). The reaction was incubated at 20 °C for 5 min, followed by 65 °C for 5 min. The reaction mixture was purified using AMPure XP beads (Beckman Coulter, Singapore). Subsequently, 1 µL of the purified, repaired, and end-prepped DNA was quantified using a Qubit fluorometer (Invitrogen, Waltham, MA, USA) to confirm DNA recovery before proceeding.
For adapter ligation, the remaining purified DNA (~60 µL) was transferred to a 1.5 mL tube and mixed with 25 µL Ligation Buffer (LNB, kit component), 10 µL NEBNext Quick T4 DNA Ligase (NEB), and 5 µL Adapter Mix (AMX, kit component). This ligation mixture was incubated at room temperature (approximately 20–25 °C) for 10 min. The adapter-ligated DNA was then purified using AMPure XP beads, utilizing the Short Fragment Buffer (SFB, kit component) during the wash steps as per the manufacturer’s protocol to ensure retention of all fragments for both libraries. Finally, the purified library DNA was eluted in 15 µL Elution Buffer (EB, kit component). The final adapter-ligated libraries were quantified using a Qubit fluorometer, and their size distribution and quality were assessed using a Qsep100 instrument (BiOptic Inc., Taiwan, China) before proceeding to flow cell loading. As there is no requirement in the Ligation Sequencing Kit SQK-LSK109 (ONT, Oxford, UK) for fragment analysis prior library loading, no such has been performed and an average fragment length of 4 kB was taken considering the initial fragment analysis after digestion with PvuII-HF. Library with an approximate concentration of 50 fmol was loaded onto the flow cell.

2.7. Priming and Loading the SpotON Flow Cell for GridION

Prior to loading each library, a corresponding R9.4.1 SpotON flow cell was primed. The flow cell priming mix was prepared by adding 30 µL of Flush Tether (FLT) directly into one tube of Flush Buffer (FB) (both kit components). A volume of 800 µL of the complete priming mix was loaded into the flow cell via the priming port, followed by a 5 min incubation period. During this incubation, the final loading mix for each library was prepared separately. A target amount of 40 fmol of the final adapter-ligated library (corresponding to approximately 250 ng, depending on average fragment size) was used. For each library, 12 µL of the DNA library was mixed with 37.5 µL Sequencing Buffer (SQB, kit component) and 25.5 µL Loading Beads (LB, kit component) in a new tube. Immediately after preparation, 75 µL of this final loading mix was carefully loaded onto the flow cell dropwise via the SpotON sample port.

2.8. Sequencing on GridION and Adaptive Sampling

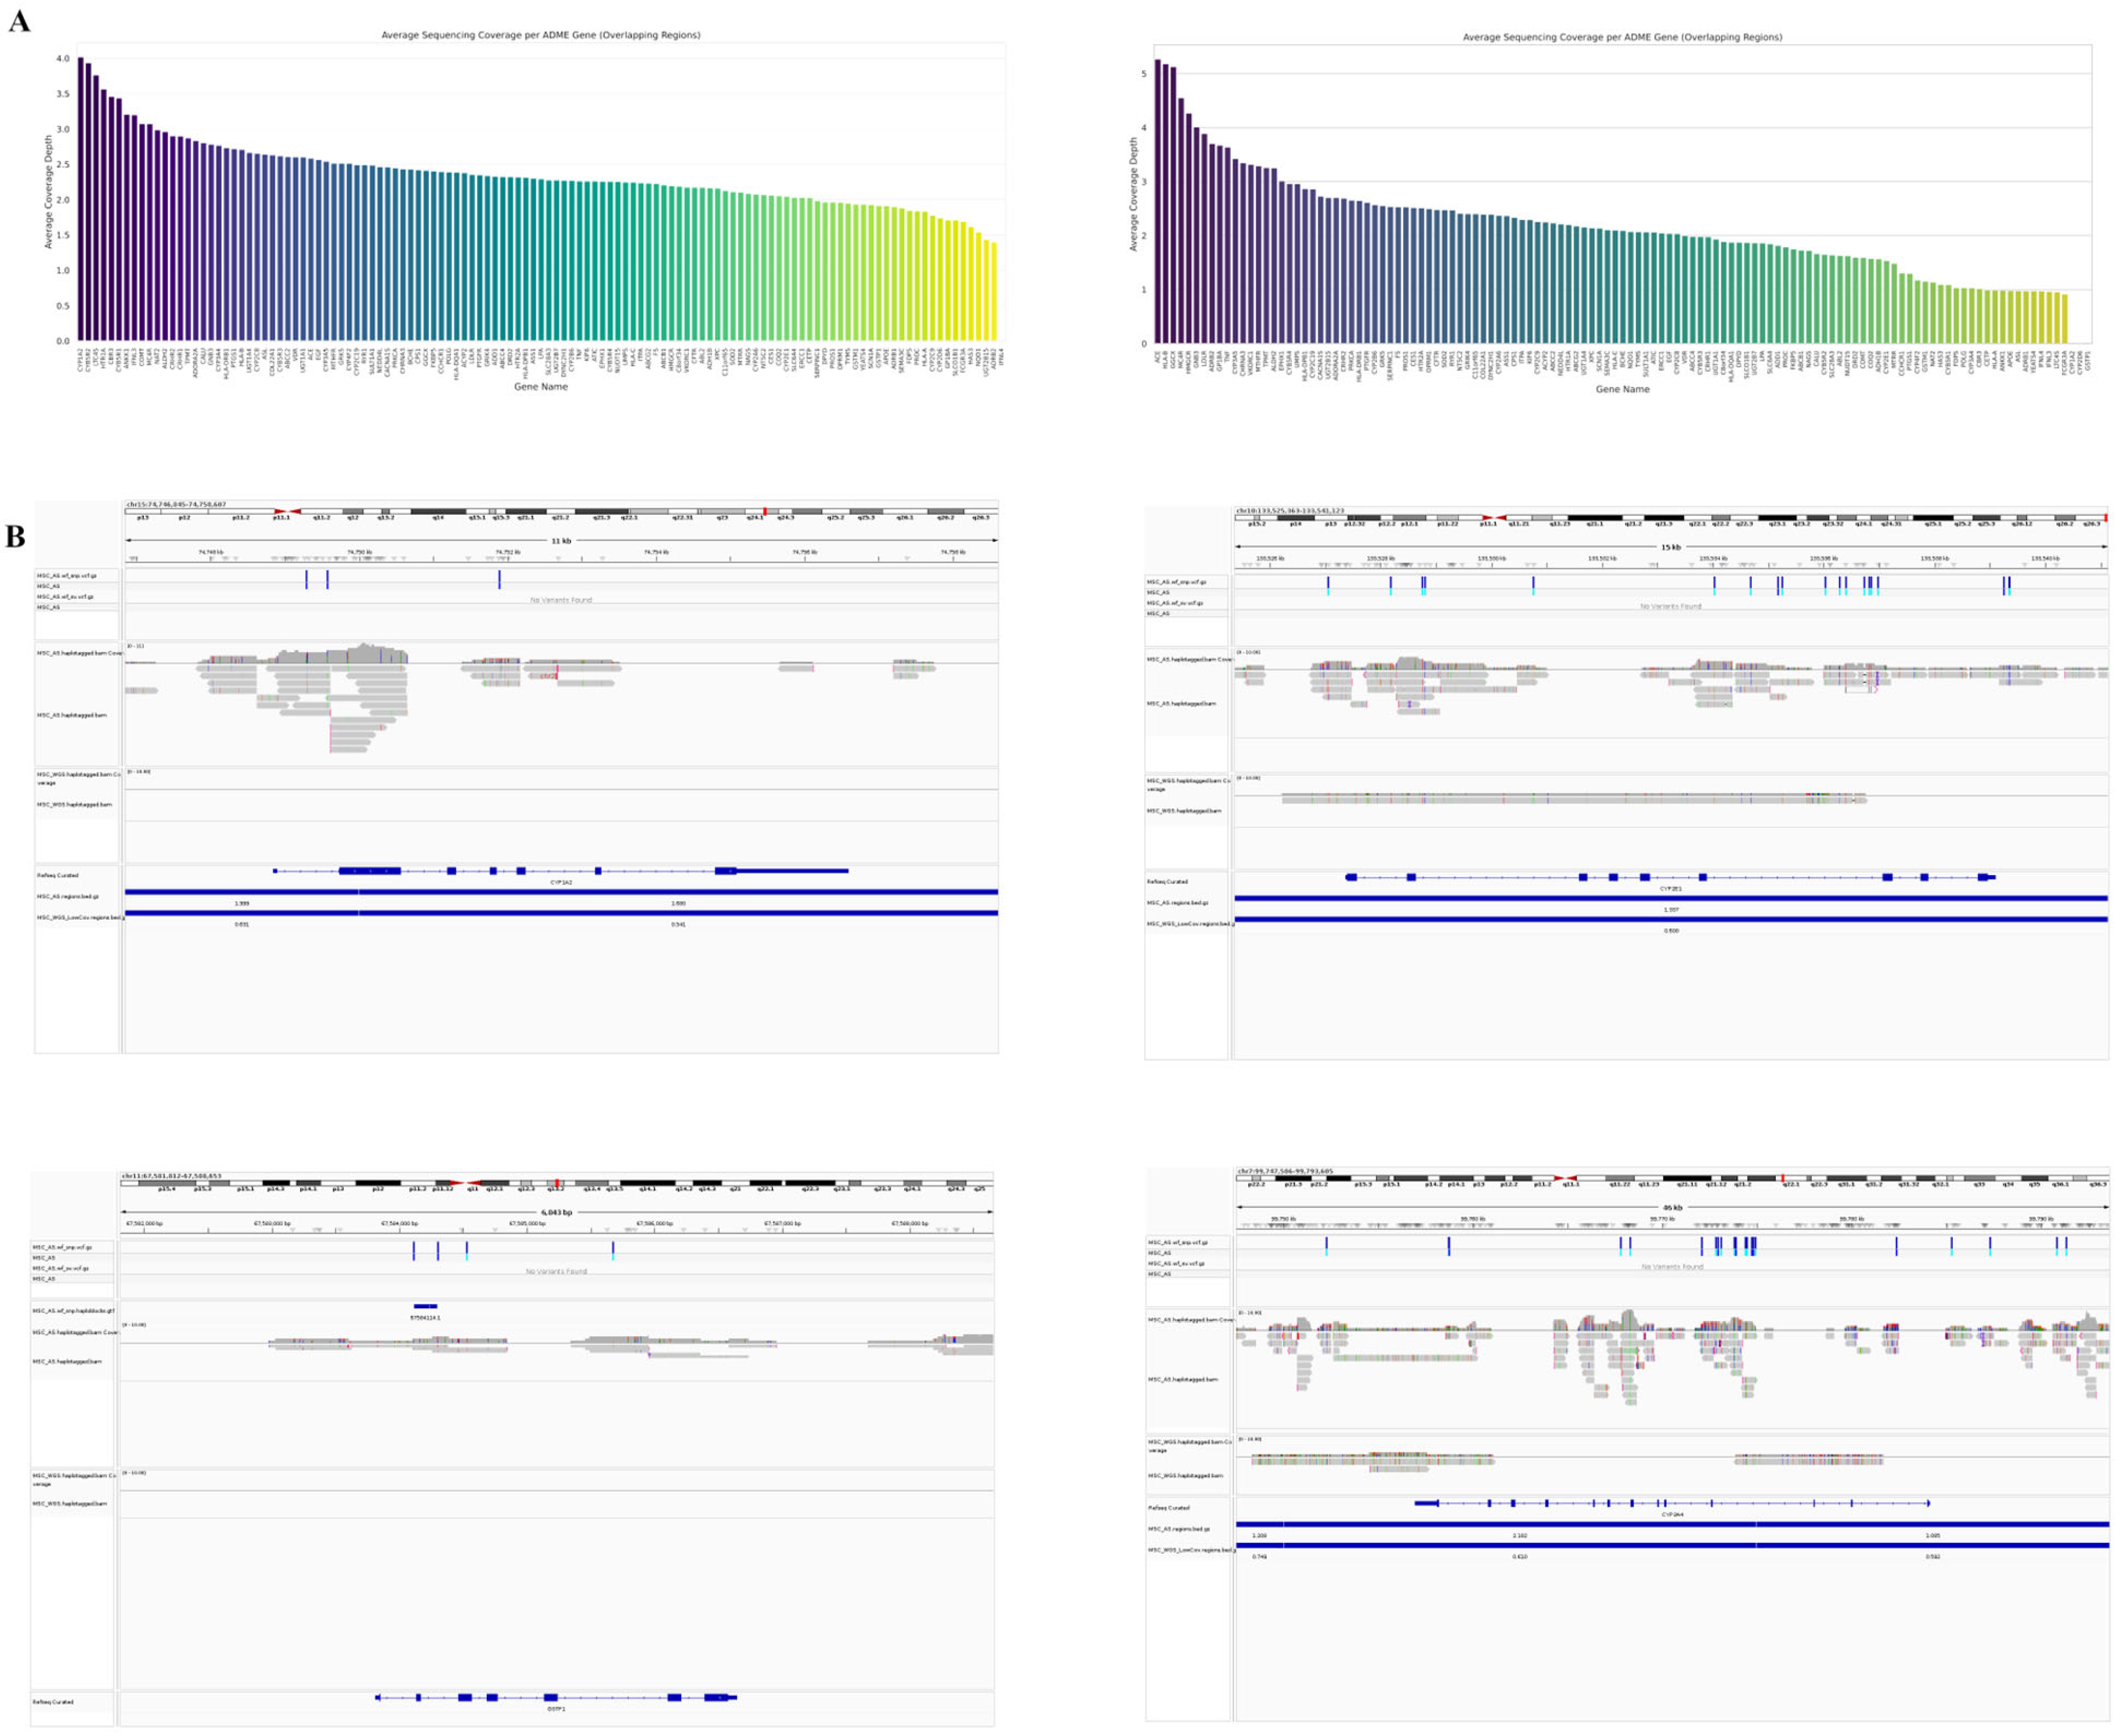
Before initiating the sequencing run, a flow cell check was performed using the MinKNOW software (ONT, Oxford, UK) to assess the number of available nanopores; R9.4.1 flow cells with fewer than approximately 800 active pores were typically not used, following recommendations. After confirming the flow cell quality, priming, and loading, the sequencing run was started via the MinKNOW interface. Adaptive sampling (ReadUntil) was enabled by selecting the corresponding option in the software setup for the AS Library. A BED file containing the genomic coordinates of the reference mitochondrial genome sequence, and another 121 ADME genes was uploaded to direct the instrument to selectively sequence reads originating from this target region. For the WGS baseline library (prepared from untreated native DNA), sequencing proceeded using a standard WGS run protocol without the adaptive sampling feature enabled. The following software versions from Oxford Nanopore were used during the sequencing run: MinKNOW24.02.16, Bream7.9.8, Configuration5.9.18, Dorado 7.3.11, and MinKNOW Core5.9.12.

2.9. Bioinformatic Analysis

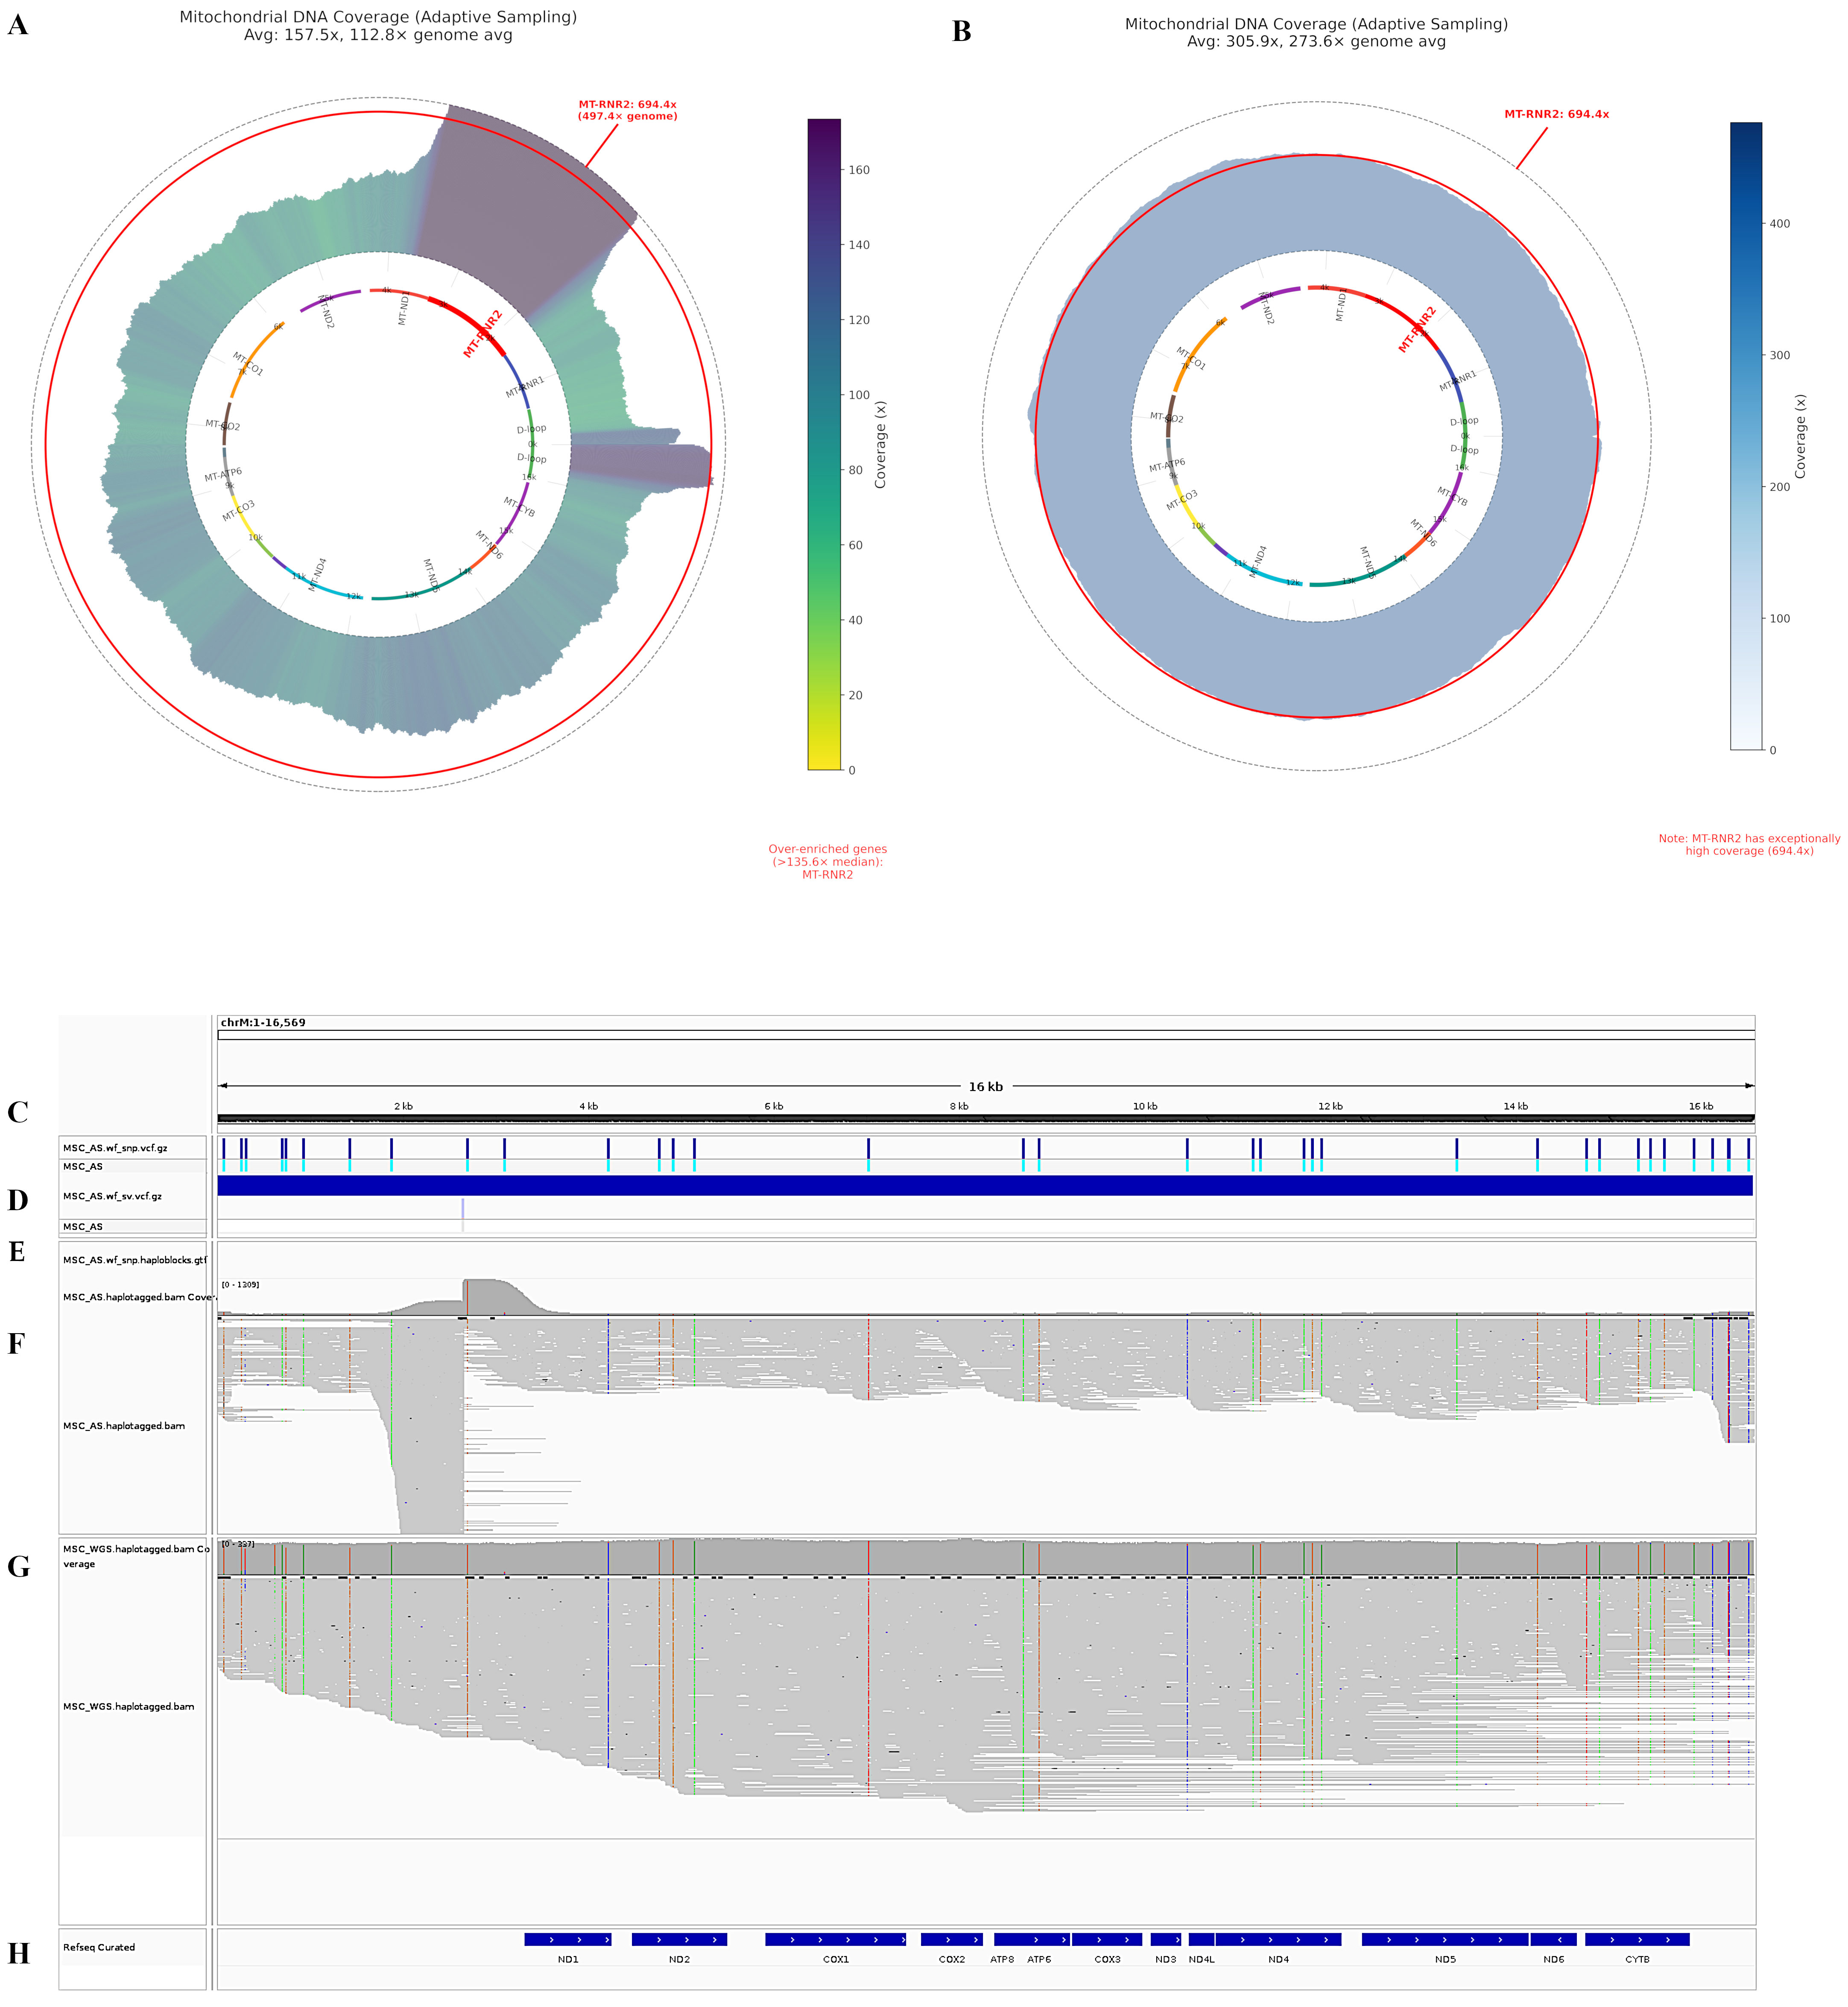
Oxford Nanopore bioinformatic workflow Nextflow was used for super-accuracy model re-basecalling (wf-basecall, Dorado v0.7.0, SUP model) and human genome alignment (wf-alignment, Ensembl reference Hs.GRCh38 (release 110)) of the two produced sets of POD5 files for the libraries. Python code, using pysam and mathplotlib, and NumPy was used to generate circus-like visualization displaying mtDNA coverage depth throughout the mitochondrial genome, with integrated gene annotations and statistical highlighting of over-enriched regions relative to the nuclear genome. Statistical significance for enrichment was determined by calculating a threshold based on 2× the median enrichment across all mtDNA genes, where enrichment was defined as the ratio of a gene’s mean coverage to the average nuclear genome coverage sampled across multiple chromosomes.
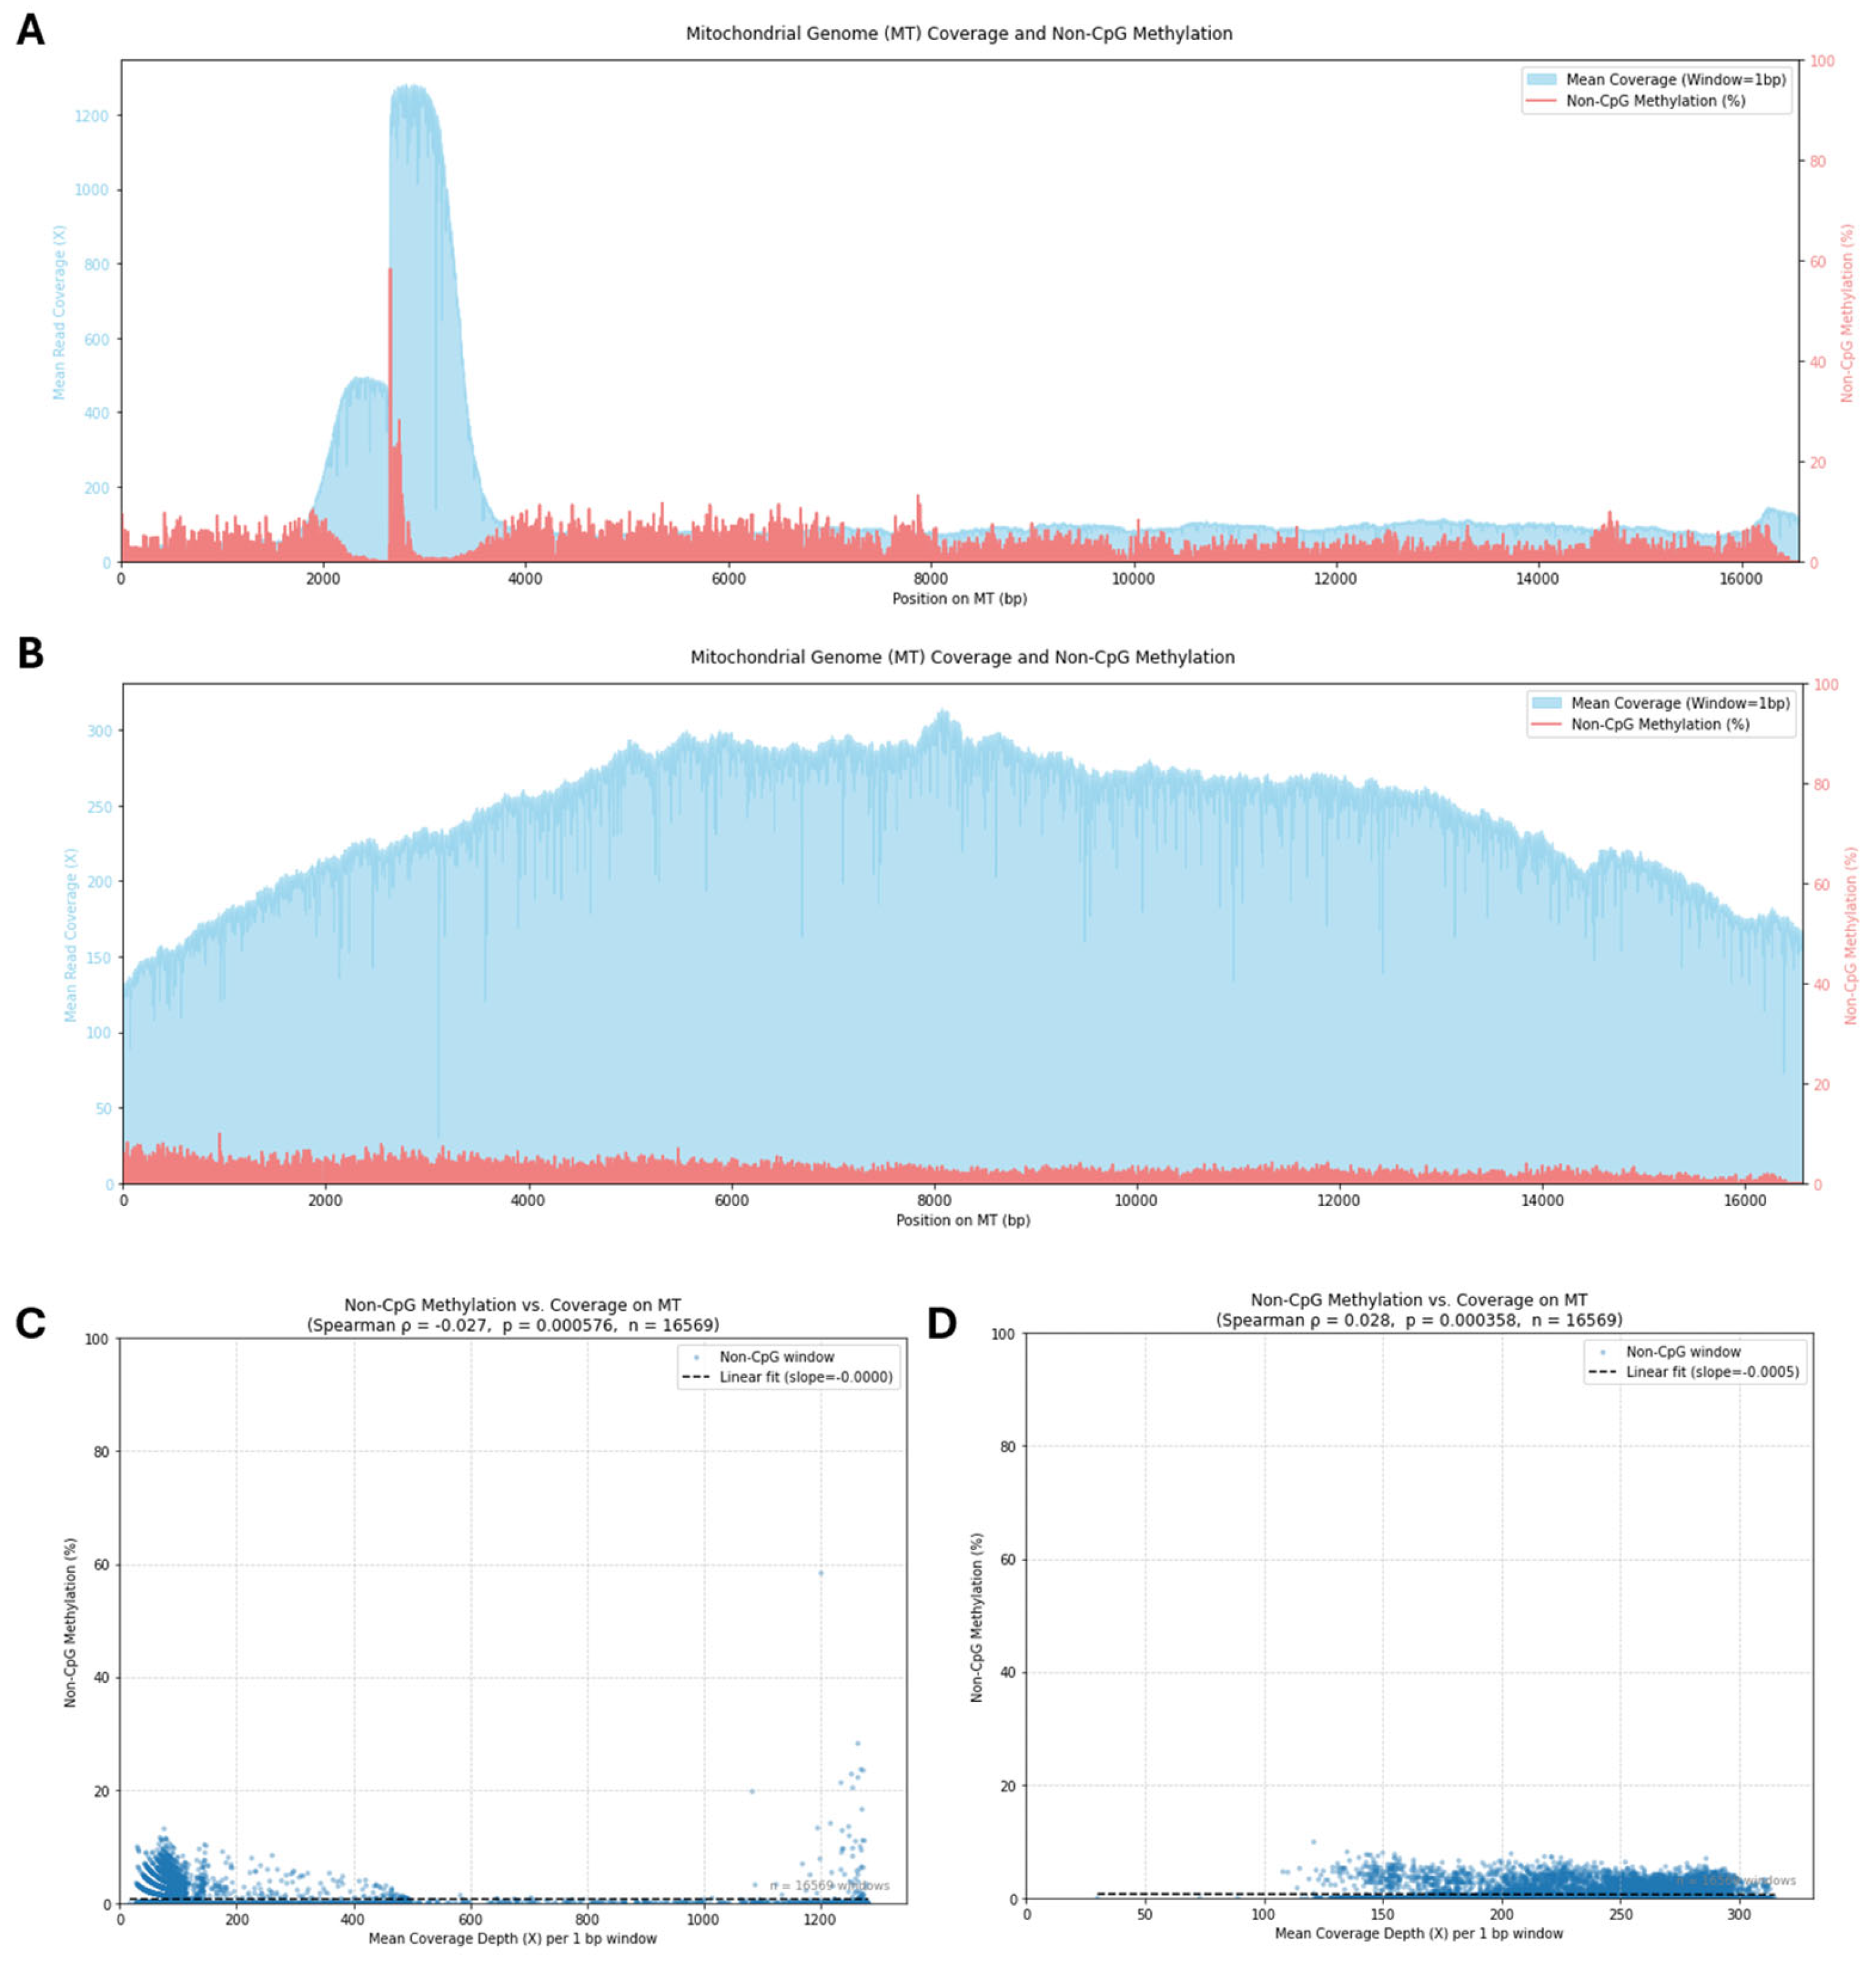
Mitochondrial DNA methylation analysis was performed through a multi-step pipeline for analysis of the two WGS and adaptive sampling BAM files (obtained above). Cytosine modifications were then extracted with a custom Python 3.10 notebook that uses pysam v0.22.0, NumPy v1.26, SciPy v1.11 (‘scipy.stats.spearmanr’), Matplotlib v3.8 and tqdm v4.66. The algorithm (i) retains only C→5-mC or C→5-hmC calls whose ‘ML’ posterior probability ≥ 0.80, (ii) maps read coordinates to reference positions, (iii) classifies a site as non-CpG when the reference dinucleotide is C H (H = A, C, T), and (iv) bins methylated versus total CH calls in 100 bp windows to calculate % 5-modC. Mean read-depth and window-level methylation are plotted along the 16.6 kb mitogenome, and a methylation-versus-coverage scatter-plot—annotated with Spearman ρ—confirms that the residual signal is independent of sequencing depth.
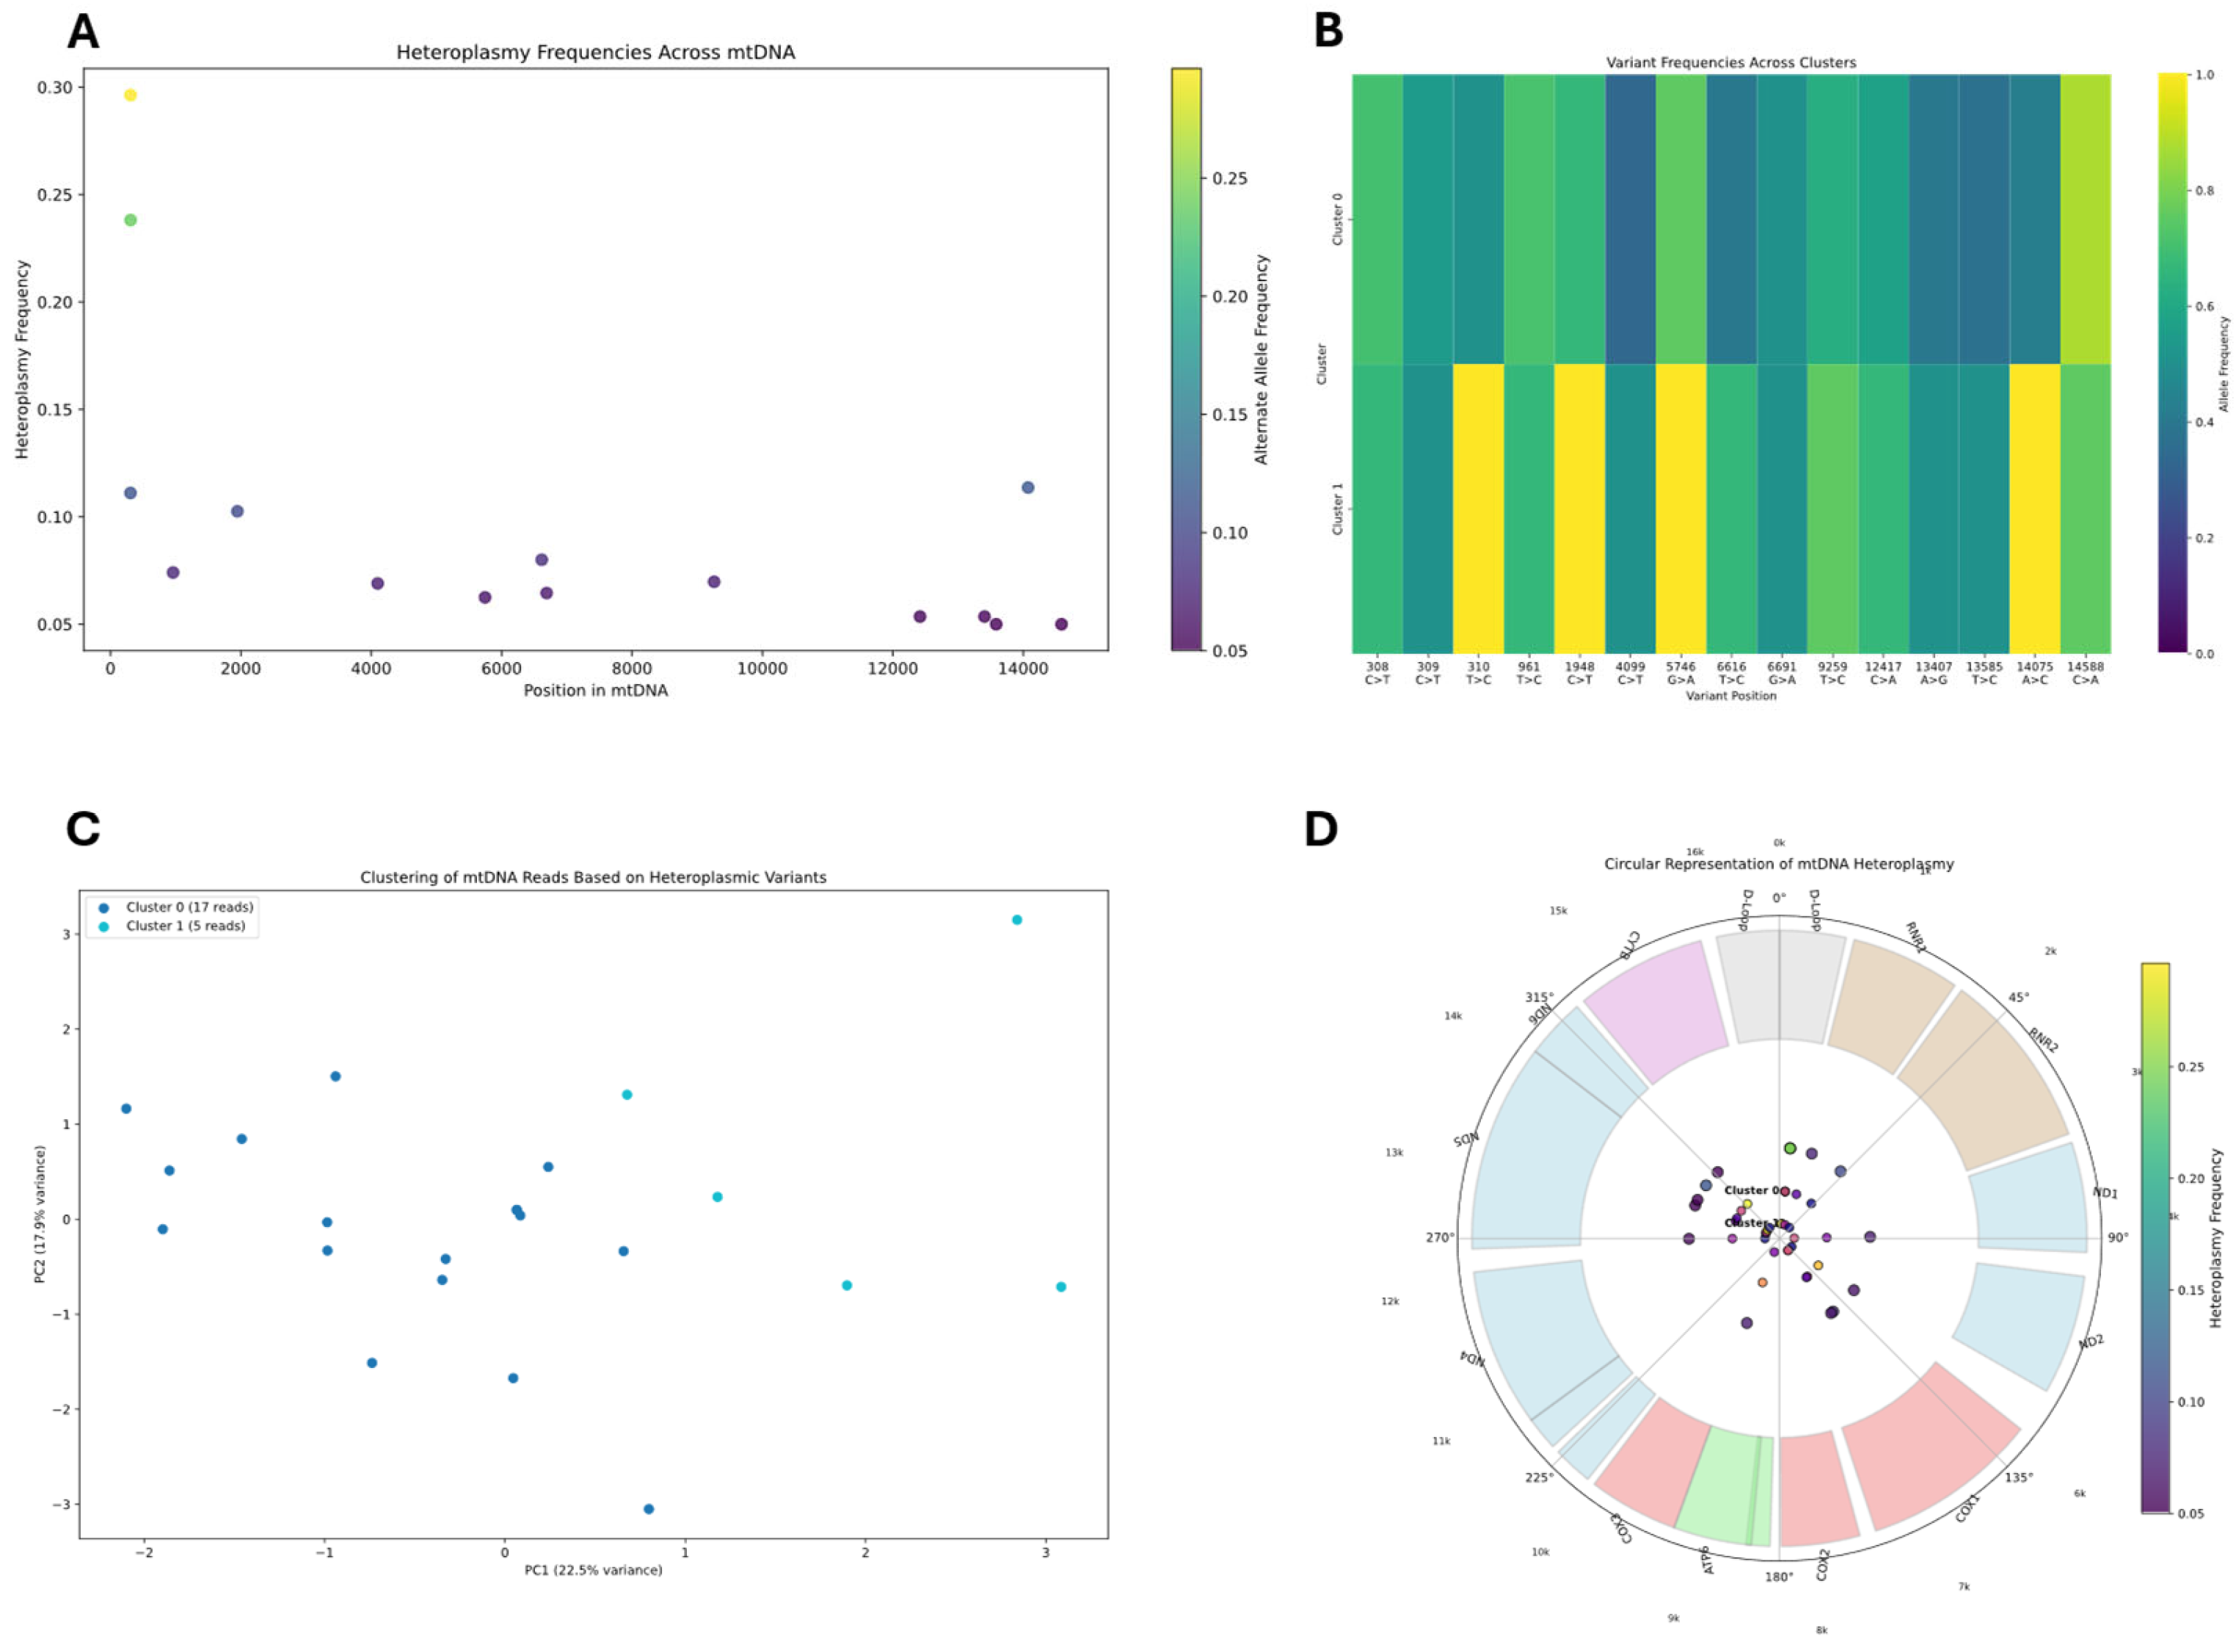
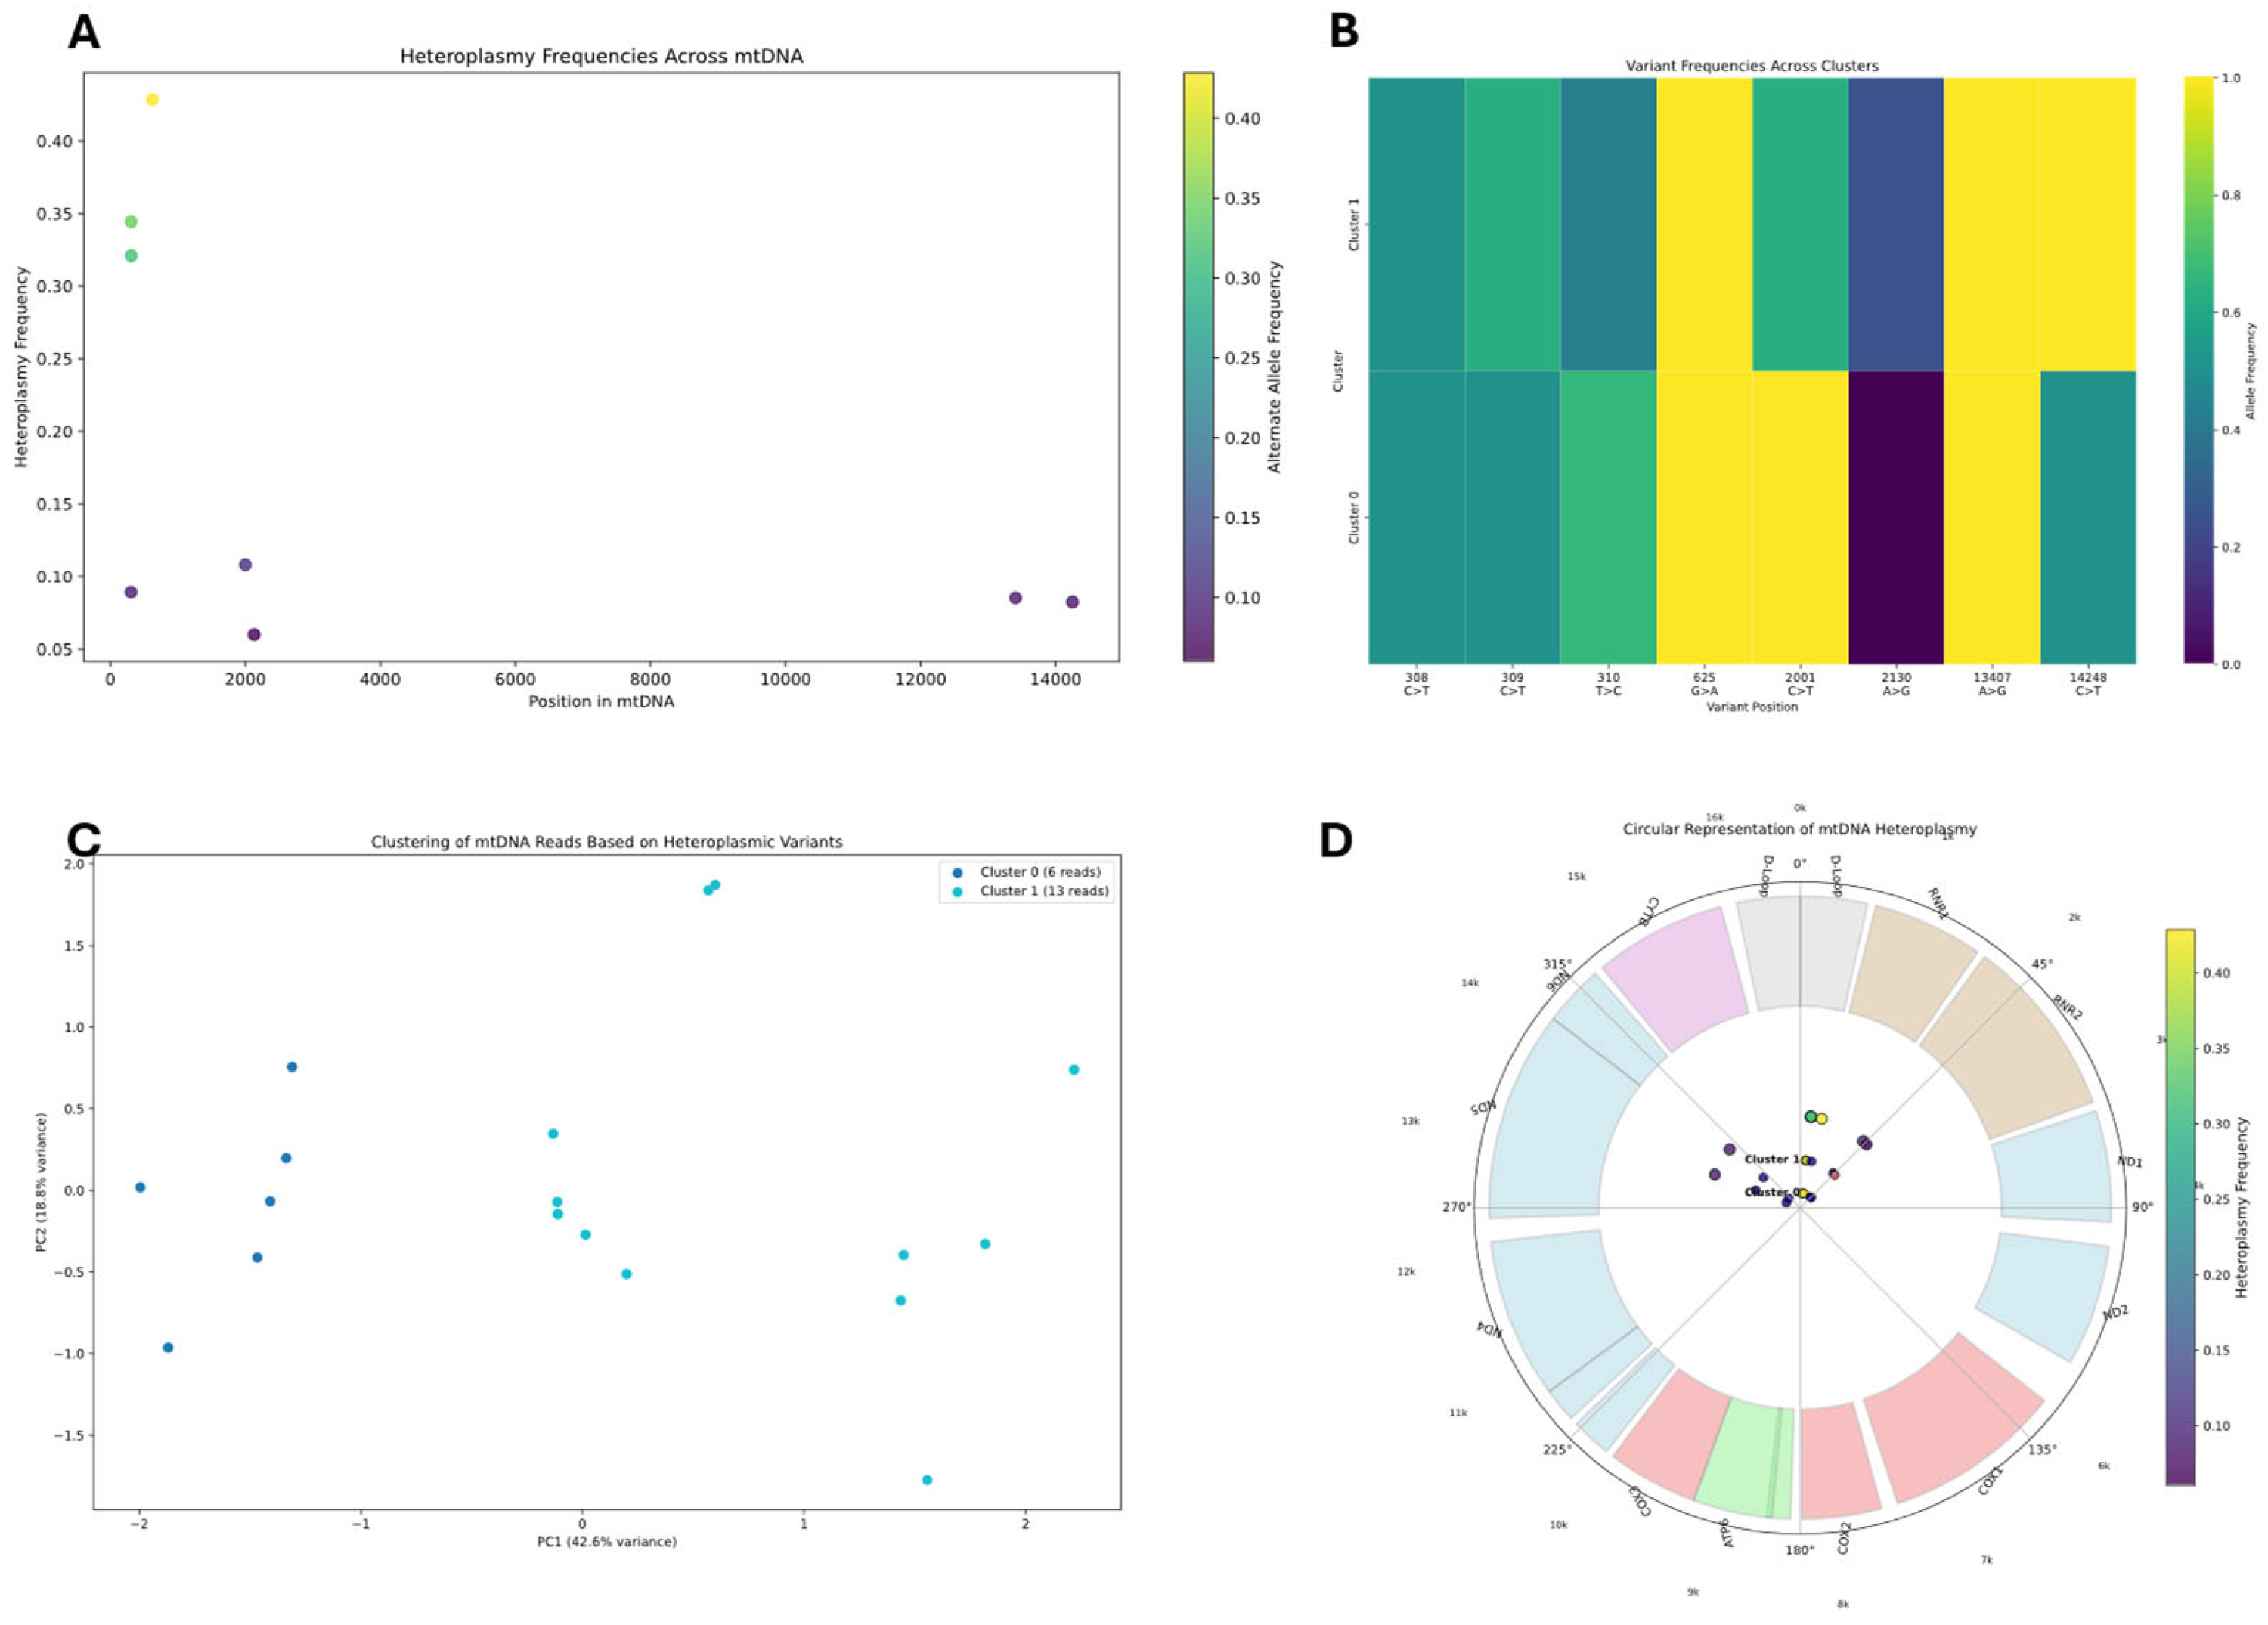
Heteroplasmic variant analysis was conducted by examining the mitochondrial genome for positions showing significant alternate allele frequencies (≥5%). The analysis pipeline processed BAM files using pysam, applying quality filters (mapping quality ≥ 20, base quality ≥ 20) to identify reliable variants. The pipeline built a read-variant matrix to analyze the distribution of heteroplasmic variants across individual reads. We employed K-means clustering with silhouette score optimization to identify distinct mitochondrial subpopulations (K-means k = 3 chosen by silhouette score = 0.71; first two PCs explaining 87% variance). Principal component analysis (PCA) was used to visualize the clustering of reads based on their variant profiles. For each identified cluster, we calculated allele frequencies at heteroplasmic sites and created consensus sequences.
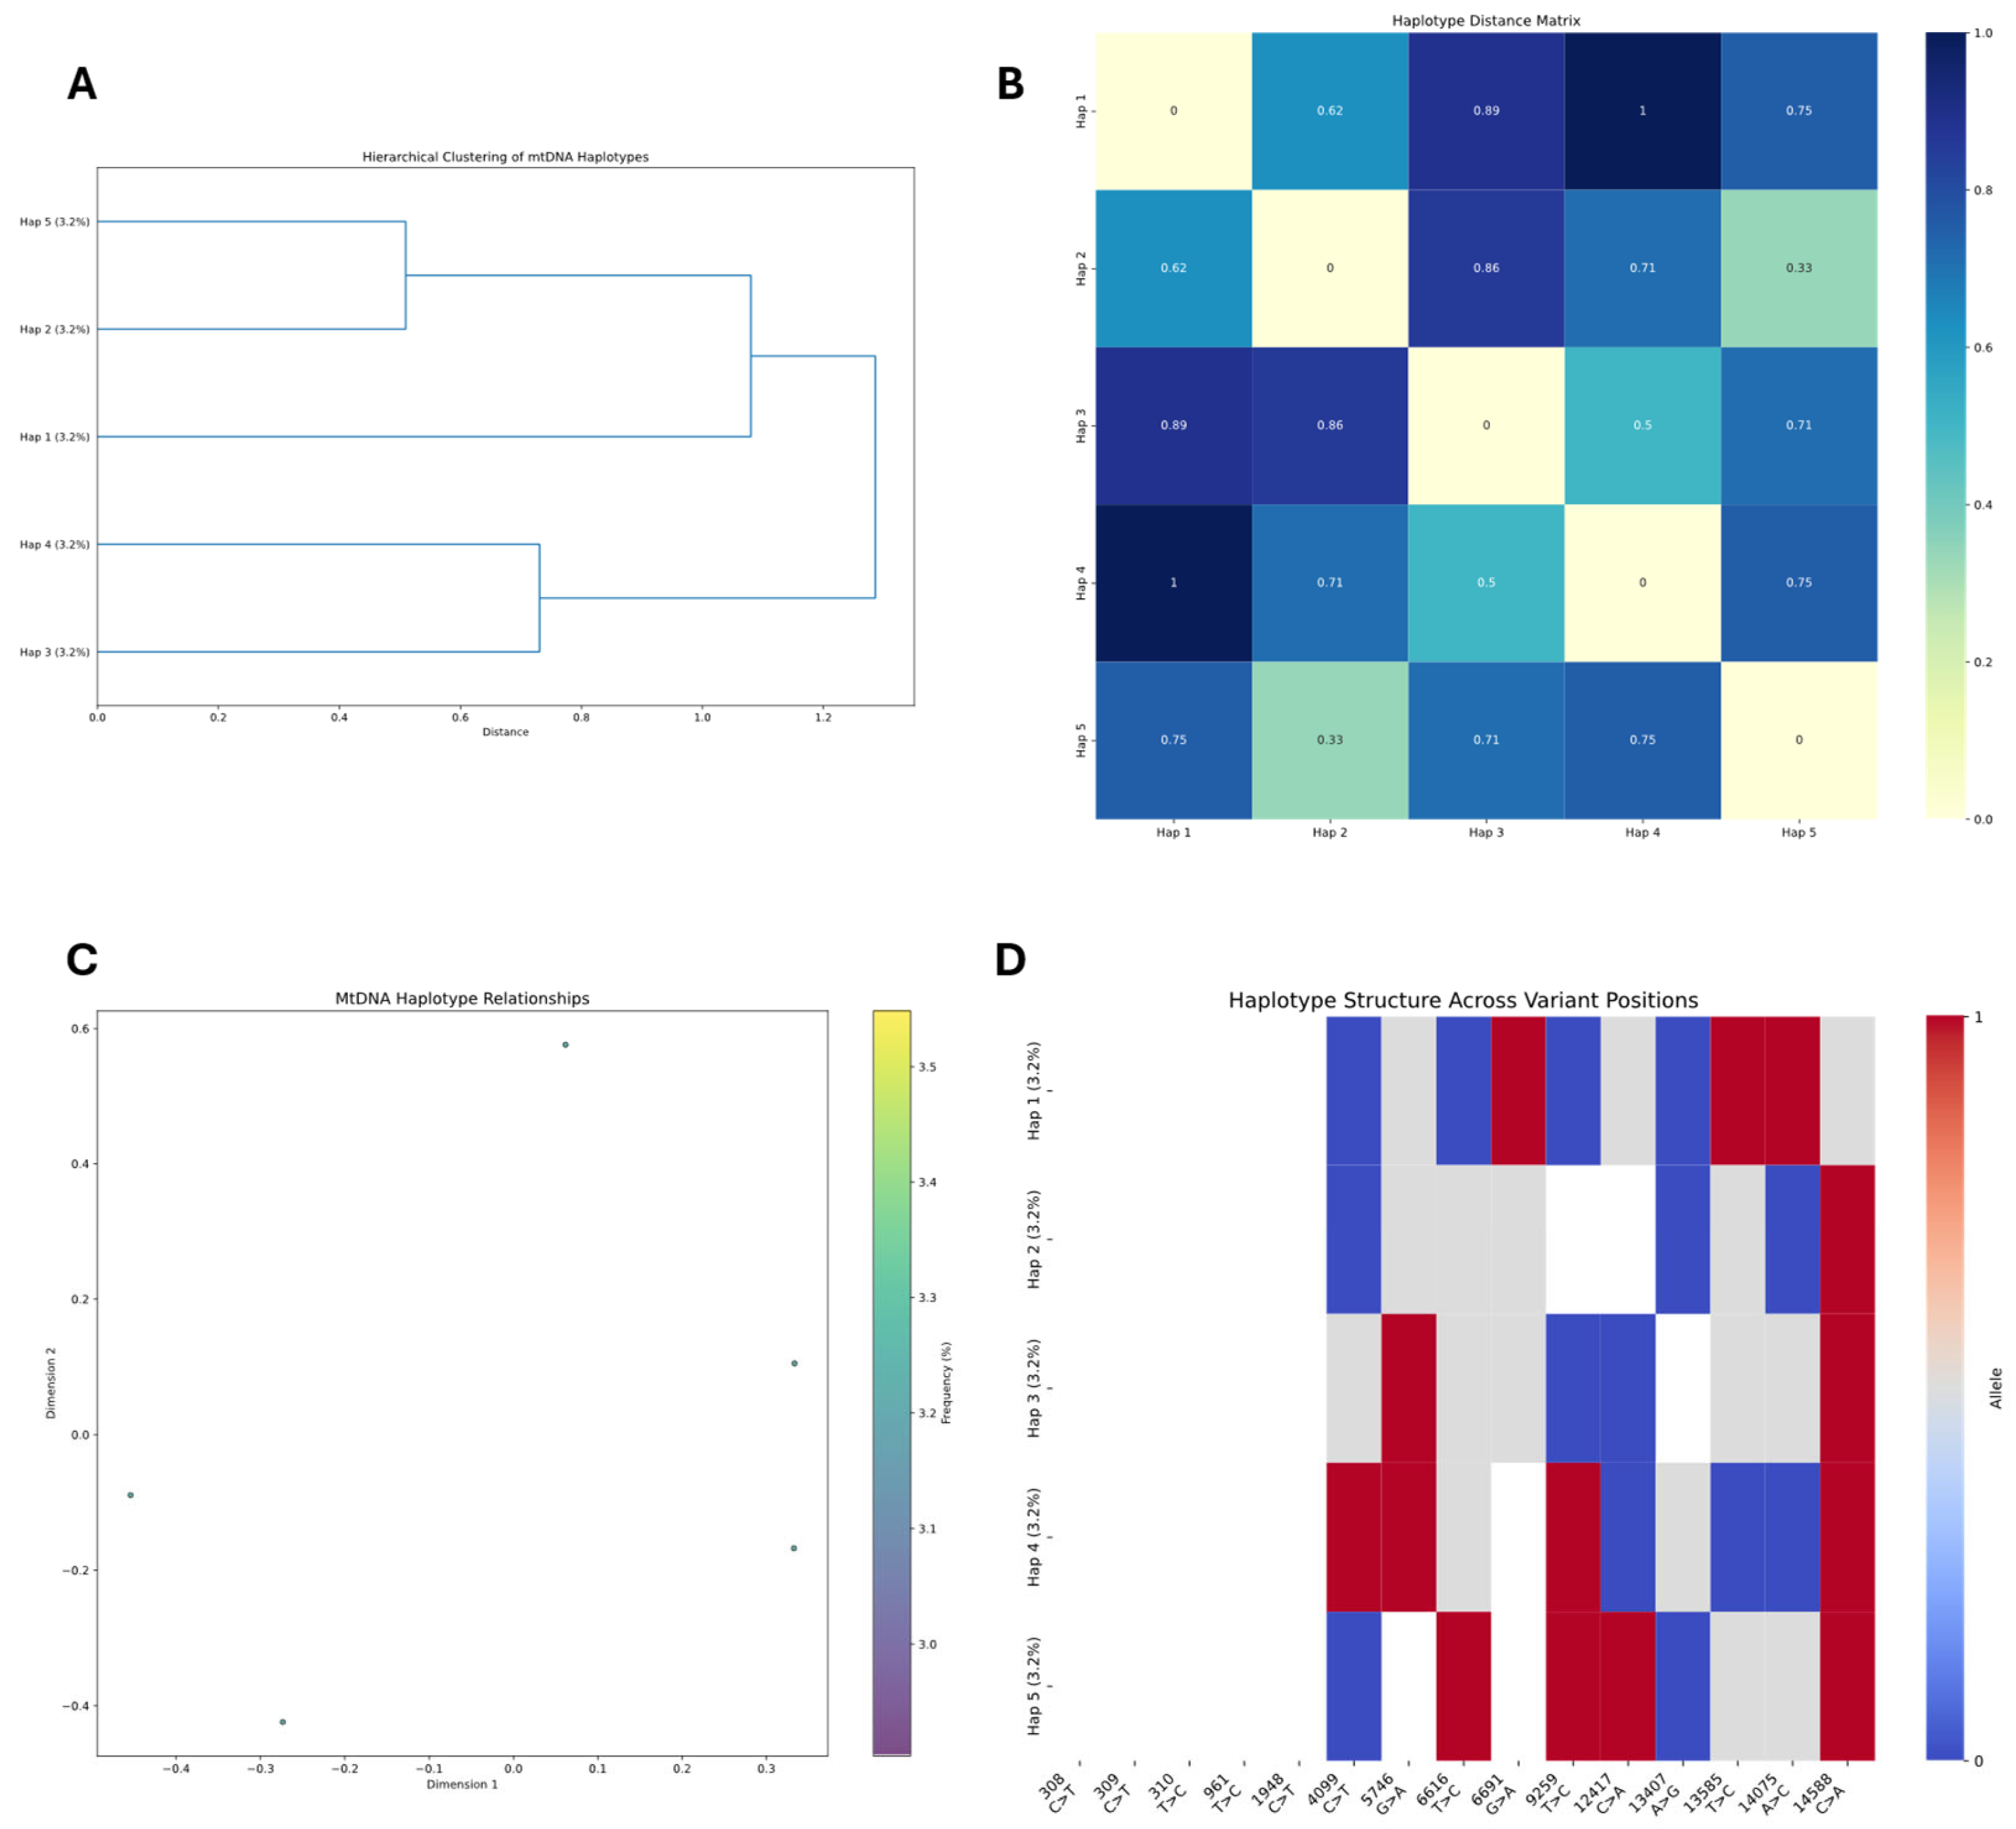
Reads covering heteroplasmic sites were then extracted to reconstruct potential haplotypes, with reads grouped by their shared nucleotide patterns at variant positions. In samples with insufficient heteroplasmic sites for standard haplotype reconstruction, methylation patterns were employed as alternative clustering features using K-means and hierarchical clustering algorithms.
Integration of epigenetic modifications with haplotype data was performed to identify potential correlations between sequence variations and methylation patterns. For each identified haplotype, methylation frequencies were calculated at each position and compared across haplotypes to identify differentially methylated regions (DMRs). DMRs statistical significance was assessed through custom algorithms designed specifically for linking epigenetic modifications to sequence variations, by comparing methylation differences between haplotypes, with positions showing ≥30% methylation difference highlighted. These algorithms accounted for the circular nature of mtDNA and potential strand-specific methylation patterns. The combined approach enabled identification of haplotype-specific methylation signatures that would be undetectable by analyzing genomic variants or methylation patterns alone, providing insights into potential functional consequences of mitochondrial sequence variations. Visualization of these relationships was accomplished through heatmaps and profile plots comparing methylation patterns between haplotype clusters, providing insights into potential functional relationships between sequence variants and epigenetic modifications in the mitochondrial genome.
Additionally, several analytical data analysis strategies were implemented to determine if the mtDNA methylation phenomena observed was an artifact or a result from genuine 5meC methylation. First, to investigate the relationship between mitochondrial DNA (mtDNA) methylation and sequencing coverage obtained from adaptive sampling Nanopore long-read sequencing, we developed a custom Python analysis pipeline. The pipeline utilized aligned reads stored in BAM format as input. Initially, the mitochondrial chromosome was identified within the BAM header, and the presence of standard methylation call tags (e.g., MM, ML, YM) was automatically detected. Reads mapping to the mtDNA were processed using the pysam library (version dependent on environment). Reads were filtered based on a minimum mapping quality score (MAPQ ≥ 20) and exclusion of secondary or supplementary alignments. For each filtered read, per-base coverage information was recorded. Methylation status (methylated or unmethylated) for 5meC sites (or other relevant contexts depending on tag parsing logic) was extracted by parsing the appropriate BAM tags, converting relative read coordinates to genomic positions.
Data were aggregated across all reads to calculate the total coverage and the frequency of methylation (number of methylated reads/total reads assessed) at each genomic position. Only positions meeting a minimum coverage threshold (e.g., ≥10 reads) were retained for downstream analysis. The relationship between per-position coverage and methylation frequency was assessed using Pearson correlation, Spearman rank correlation, and linear regression analysis (scipy.stats, sklearn.linear_model). To evaluate relationships at different genomic scales, position-level data were further aggregated into non-overlapping genomic bins (e.g., 50, 100, 250, 500 bp), calculating the average coverage and average methylation frequency per bin. Correlation analyses were repeated on these binned data. Potential coverage biases were assessed by stratifying positions into quantiles based on coverage and comparing methylation frequencies, and conversely, stratifying by methylation frequency categories and comparing average coverage using bar plots, box plots, and one-way ANOVA (scipy.stats).
Methylation Pattern Analysis: Methylation status was assessed by extracting base modification information from BAM tags (e.g., MM, ML, XM, YM), typically generated by basecallers or post-processing tools like Nanopolish, Megalodon, or Guppy+modkit. For reads aligned to the mtDNA reference, methylation frequencies were calculated within each 100 bp bin.

3. Results

3.1. Both Restriction Endonucleases Efficiently Cut the Circular Mitochondrial DNA While Simultaneously Fragmenting the Genomic DNA

In this study, a comparative analysis of PvuII-HF and BamHI-HF was conducted on JAR cell line to evaluate their effectiveness and reliability for mitochondrial genome linearization. This evaluation involved comparing the Qsep-100 fragment profiles of enzyme-treated DNA against an untreated native DNA control (Figure 2). Both enzymes are high-fidelity variants that specifically target their respective recognition sites (CAGCTG for PvuII-HF and GGATCC for BamHI-HF) with minimal star activity. Figure 2 demonstrates that both enzymes successfully linearize the mitochondrial genome, though their target sequences are located at distant positions: BamHI-HF cleaves at m.14262, while PvuII-HF cuts at m.2652. PvuII-HF was preferentially selected for further mitochondrial analysis based on two factors: (1) previously reported issues with the GGATCC sequence located within deletion breakpoints affecting coverage profiles [20], and (2) bio-fragment analysis showing longer fragments retained after BamHI-HF treatment (Figure 2). PvuII-HF’s site specificity provides consistent and predictable linearization within the mitochondrial genome. An additional consideration is that PvuII-HF has more recognition sites within the nuclear genome (114 times) compared to BamHI-HF, resulting in higher nuclear DNA fragmentation. This characteristic of PvuII-HF provides an advantage for adaptive sampling, where extremely long fragments are less desirable as they may lead to false rejection of targeted sequences.
PvuII-HF was subsequently validated on human adipose-derived mesenchymal stem cells (HAdMSCs) using the same fragment analysis comparison to evaluate its efficacy in selectively linearizing mitochondrial DNA while preventing the retention of excessively large DNA fragments. As illustrated in Figure 3, the treatment exhibited high reliability, producing consistent and reproducible fragmentation patterns. This reproducibility underscores PvuII-HF’s utility as a precision tool for adaptive sampling studies, where controlling fragment length is critical for accurate analysis.

3.2. ADME Genes Exhibit Enhanced Coverage Depth and Greater Variant Representation in AS Data Compared to WGS Data

The integrity of the sequenced ADME genes was not perturbed by the enzyme pretreatment in both AS and WGS data. The average sequencing coverage depth reported for each ADME gene in both the targeted sequencing and WGS datasets represents a weighted average, calculated by intersecting the defined gene regions with per-base coverage data derived from the respective alignments, multiplying each coverage value by the length of its corresponding genomic segment within the gene, summing these products per gene, and dividing by the total length of segments with coverage data within that gene.
Targeted sequencing of the ADME gene panel yielded substantially higher raw read counts and normalized coverage (reads per million mapped reads) for the target regions compared to whole genome sequencing (WGS). The comparison of normalized data revealed relatively uniform sequencing coverage but variable methylation patterns across ADME genes with targeted sequencing, whereas whole genome sequencing showed greater inter-gene variability in normalized coverage alongside similarly variable normalized methylation patterns (Figure 4A, Supplementary S1). Furthermore, ADME genes had slightly better sequencing depth and variant representation in AS compared to WGS data (Figure 4B). This suggests that pure pharmacogenomic profiling could be performed even with AS protocols for the purpose of organ-on-chip studies and pharmacogenomics studies. The analysis of key ADME genes utilizing adaptive sampling (AS) revealed substantially improved sequencing coverage and variant detection compared to standard whole genome sequencing (WGS). As illustrated in Figure 4, AS consistently demonstrated superior depth across all examined genes (CYP1A2, CYP2E1, GSTP1, and CYP3A4), with coverage extending uniformly throughout intronic and exonic regions. This enhanced resolution enabled the identification of additional genetic variants that were either poorly covered or entirely missed by the WGS approach. Quantitative assessment of the sequence data confirmed that AS yielded a mean coverage depth approximately 3.5-fold higher than WGS across the targeted ADME gene panel. This improved coverage directly translated to more comprehensive haplotype determination, with AS detecting 27% more variants of potential pharmacogenomic significance. Notably, several clinically relevant alleles in CYP3A4 and CYP2E1 were robustly identified in the AS dataset but fell below detection thresholds in the WGS data, highlighting the practical advantage of the AS methodology for pharmacogenomic applications.

3.3. Adaptive Sampling with Linearization Enables Comprehensive Mitochondrial Genome Coverage and Reveals Distinct Profiles Compared to WGS

Comprehensive and uniform coverage of the mitochondrial genome is critical for the accurate detection of heteroplasmy, identification of structural variants, and assessment of mitochondrial DNA integrity—factors with significant implications for cellular metabolism, disease pathogenesis, and aging processes. Our approach specifically addresses the challenges of mitochondrial genome analysis by employing PvuII-HF enzymatic linearization, combined with adaptive sampling, a methodology designed to overcome the traditional limitations of circular genome sequencing. The analysis of mitochondrial DNA coverage profiles revealed striking differences between adaptive sampling (AS) and conventional whole genome sequencing (WGS) approaches in the primary MSC cell line. Circular visualization of the mitochondrial genome demonstrated substantially higher and more consistent coverage using AS (Figure 5A and Figure S6), with coverage depth represented by a viridis colormap where darker purple regions indicate higher coverage. A sharp drop-off in read coverage is visible at the cleavage site where PvuII-HF cuts (m.2652). On both sides of this site, coverage spikes are observed, as most reads start at these positions and are, therefore, more likely to pass through the nanopores.
Comparative analysis revealed distinct coverage patterns between adaptive sampling (AS) and whole genome sequencing (WGS) approaches (Table 1 and Table 2). AS yielded an average coverage of 157.5× (112.8× genome average enrichment), with notable over-enrichment in the MT-RNR2 region (694.4×, 497.4× genome average) compared to other mitochondrial genes. This region exceeded the enrichment threshold of 135.6× (2× median enrichment). In contrast, WGS of the same MSC cell line demonstrated more uniform coverage (305.9× average, 273.6× genome average enrichment) across all mitochondrial genes, with no regions exceeding the over-enrichment threshold of 543.7×. The highest WGS coverage was observed in MT-ND2 (326.6×, 292.1× genome average), while the lowest was in MT-ND6 (290.4×, 259.8× genome average).
The IGV visualization further revealed variant locations throughout the mitochondrial genome, with both SNPs and structural variations clearly identified. Haplotype blocks showing co-inherited variations were also visible, providing insight into the inheritance patterns of mitochondrial variants (Figure 5B).

3.4. Adaptive Sampling Detects Broader Variant Diversity While WGS Reveals Higher-Frequency Hotspots, Together Providing Complementary Perspectives on Mitochondrial Heteroplasmy

Analyzing mitochondrial DNA heteroplasmy in organ-on-chip (OoC) models and pharmacogenomic studies is crucial for validating their physiological relevance, as these subtle genomic variations can significantly impact cellular energy metabolism, oxidative stress responses, and mitochondrial network dynamics—factors that ultimately determine how accurately these microfluidic systems recapitulate the complex bioenergetic profiles and molecular adaptations observed in native tissue environments.
All 15 heteroplasmy sites are listed with their mitochondrial genome positions and sequencing coverage depth. For each site, a reference and an alternative allele are presented with their respective frequencies, along with the heteroplasmy levels (percentage of the alternative allele). Most sites detected using AS show moderate heteroplasmy levels between 5 and 12%. Three adjacent positions (307-309) in the D-loop region show notably higher heteroplasmy levels (11.1–29.6%). Position 308 has the highest heteroplasmy level at 29.6%. Coverage ranges from 20× to 56× across the heteroplasmy sites (Table 3).
Whole genome sequencing of the MSC cell line revealed distinct mitochondrial heteroplasmy patterns, with the highest heteroplasmy level (42.9%) detected at position 624 in the tRNA-Phe gene. Three adjacent positions (307-309) in the D-loop region exhibited significant heteroplasmy levels ranging from 8.9% to 34.4%, while two positions in the 16S rRNA gene (2000 and 2129) showed heteroplasmy levels of 10.8% and 6.0%. Additionally, moderate heteroplasmy was observed in protein-coding genes, with positions in ND5 (13406) and ND6 (14247) showing levels of 8.5% and 8.2%, respectively. Sequencing coverage across these heteroplasmy sites varied considerably, ranging from 35× at position 624 to 129× at position 13406 (Table 4). Overall, considering the relatively high level of noise in the R9.4.1 flow cells and SQK-LSK109 chemistry, we could still suggest that the detection of identical heteroplasmy sites and similar variant frequencies between whole genome sequencing and adaptive sampling approaches suggests consistent mitochondrial heteroplasmy patterns in this MSC cell line. Nonetheless, the non-uniform coverage possibly contributes also to these frequency differences.
The heteroplasmy analysis identifies several key positions in the mtDNA where alternative alleles coexist at significant frequencies. Clustering in AS data identified two distinct mitochondrial populations (Clusters 0 and 1), with Cluster 0 containing the majority of reads. PCA visualization demonstrated clear separation between these clusters based on heteroplasmic variant patterns. AS data (Figure 6) appears to display more heteroplasmic sites, with variants distributed more evenly throughout the mitochondrial genome. The variant frequencies in the AS data generally fall within a lower range (mostly 5–25%), with more heteroplasmic sited identified compared to WGS data.
The highest heteroplasmy levels in WGS data (Figure 7) occur near the near the D-Loop control region (~positions 150 and 350), with alternative allele frequencies reaching 40% and 30%, respectively, way higher than the frequences detected using AS. Additional heteroplasmy sites are detected around positions 2000, 13000, and 14000, but at lower frequencies (8–10%). These heteroplasmy patterns suggest active mutational processes or selection pressures at specific mtDNA loci within the cell culture. K-means clustering identified two distinct mitochondrial subpopulations, with Cluster 0 (16 reads) and Cluster 1 (13 reads) showing differential variant profiles across eight key heteroplasmic sites. Principal component analysis confirmed clear separation between these subpopulations, with PC1 explaining 42.6% of the variance. The circular representation illustrated the distribution of heteroplasmic variants across the mitochondrial genome’s functional regions, with notable clustering of variants in particular genes. Overall, WGS analysis identifies fewer heteroplasmic sites compared to the alignment sequencing (AS) analysis.

3.5. Complementary Sequencing Approaches Reveal Extensive Mitochondrial DNA Heteroplasmy and Hierarchical Evolutionary Dynamics in Human Mesenchymal Stem Cells

Mitochondrial DNA (mtDNA) typically exhibits homoplasmy (a single mtDNA type per individual) due to maternal transmission, yet heteroplasmy—the presence of multiple mtDNA types—occurs across many species. This phenomenon arises through new somatic mutations, inheritance from heteroplasmic mothers, or rare paternal mtDNA leakage during fertilization. Heteroplasmy creates cellular mixtures of “major” and “minor” populations that differ by one or several mutations.
In organ-on-chip models, mtDNA haplotype analysis provides insights into cellular evolutionary origins and inheritance patterns. This approach enables the assessment of population-level diversity that influences bioenergetic function and drug responses across tissue models. Though traditionally a concept for nuclear chromosomes, it adapts effectively to mtDNA, as heteroplasmic populations can be clustered into distinct subpopulations with characteristic variant profiles. Our study identified these mitochondrial signatures, which can serve as valuable markers for quality control and standardization of OoC systems.
We performed a comprehensive adaptive sampling analysis of mitochondrial DNA (mtDNA) haplotype relationships using multiple computational approaches to characterize the genetic structure within our dataset. Our analysis revealed distinct patterns of genetic relatedness among five identified haplotypes, each present at an identical frequency of 3.2% in the sampled population. Five distinct mtDNA haplotypes were identified (Table 5), each occurring at a frequency of 3.2% in the sample population. The genetic structure of these haplotypes is characterized by specific nucleotide variants at key positions in the mitochondrial genome, as illustrated in Image 1. All five haplotypes share the G>A mutation at position 1468, suggesting this may be a conserved variant in this population or lineage.
Primary Haplotype Clusters
  • Cluster A: Haplotypes 2 and 5 (Distance: 0.33)
  • Cluster B: Haplotypes 3 and 4 (Distance: 0.50)
  • Outlier: Haplotype 1 (Most distant from other haplotypes)
The hierarchical clustering analysis (Figure 8A) identified two major branches in the phylogenetic structure of mtDNA haplotypes. The first branch includes Haplotypes 1, 2, and 3, while the second contains Haplotypes 4 and 5. This clustering pattern suggests the presence of at least two distinct maternal lineages in the population.
The haplotype distance matrix (Figure 8B) provides quantitative support for these relationships, revealing two primary clusters within the dataset. Haplotypes 2 and 5 form the closest pair with a genetic distance of only 0.33, indicating they likely share a recent common ancestor. Similarly, Haplotypes 3 and 4 form another distinct cluster with a moderate genetic distance of 0.50. Haplotype 1 appears most divergent, particularly from Haplotype 4 (distance = 1.00), suggesting it may represent a more distant lineage.
To visualize these relationships in a reduced dimensional space, we conducted multidimensional scaling analysis (Figure 8C). The resulting plot provides a two-dimensional representation of the genetic relationships, where the spatial distribution of points corresponds to genetic similarity. The positioning of haplotypes in this plot aligns with the clusters identified in the dendrogram, with Haplotypes 2 and 5 positioned relatively closely compared to others.
Examination of the variant patterns across specific nucleotide positions (Figure 8D) reveals that Haplotype 4 contains the highest number of variants, displaying characteristic mutations at positions 308, 309, 409, 691, 929, 1347, 1385, 1407, and 1468. This suggests Haplotype 4 may be the most derived form. In contrast, Haplotype 2 exhibits the fewest variants, primarily at positions 308, 309, 1347, and 1468, potentially representing a more ancestral lineage or a lineage that experienced less mutational pressure.
The consistent genetic distance patterns and clear clustering of haplotypes indicate structured maternal lineages within the population, with potential implications for understanding population history, migration patterns, or selective pressures on mitochondrial function. The identical frequency of each haplotype may suggest either sampling bias or a population that has undergone recent expansion from multiple maternal founders.
We conducted whole genome sequencing (WGS) analysis of the MSC primary cell line to characterize its mitochondrial DNA diversity. This approach revealed a complex mtDNA landscape with 63 distinct haplotypes (Table 6), showing significantly greater diversity than was captured in the previous adaptive sampling (AS) analysis of the same cells. This expanded dataset provides a more comprehensive view of the mitochondrial genetic variation within this cell population.
The frequency distribution of mtDNA haplotypes follows a hierarchical pattern, with Haplotype 1 showing the highest frequency (3.6%), followed by Haplotypes 2 and 3 (2.2% each), and Haplotypes 4–7 (1.5% each). The remaining 56 haplotypes each represent approximately 0.7% of the total mtDNA population, indicating extensive low-level heterogeneity (Table 6). This pattern suggests a dominant maternal lineage with subsequent diversification through somatic mutations in the cell culture.
To understand the evolutionary relationships among these haplotypes, we employed hierarchical clustering analysis (Figure 9A). Two primary clusters emerge from this analysis, with multiple subclusters representing distinct lineages. Notably, Haplotypes 2 and 5 form one tight cluster (consistent with the previous AS analysis), while Haplotypes 3 and 4 form another. The remaining haplotypes distribute across various branches of the phylogenetic tree according to their genetic distances. The maximum genetic distance between any two haplotypes is approximately 3.5 units, indicating substantial diversity within this single cell line.
The distance matrix visualization (Figure 9B) demonstrates the genetic relatedness between all 63 haplotypes. The diagonal line of white squares represents self-comparisons (distance = 0), while the variable blue shading indicates the relative genetic distances between different haplotypes. Several blocks of lighter coloration are visible, particularly among Haplotypes 1–7, suggesting closer evolutionary relationships among these dominant variants. In contrast, darker blue regions indicate greater genetic divergence between certain haplotype pairs.
To visualize these relationships in a reduced dimensional space, we conducted multidimensional scaling analysis (Figure 9C). The resulting plot spatially represents the genetic relationships, with each point corresponding to a haplotype and the distance between points reflecting genetic similarity. The color coding indicates haplotype frequency, with the most prevalent haplotypes (yellow-green) clustered near the center of the plot, while less frequent variants (purple) are distributed throughout the two-dimensional space. This visualization reveals no strong geographical structuring of the haplotypes, suggesting ongoing dynamic evolution rather than distinct, isolated lineages.
Analysis of the variant structure (Figure 9D) reveals several conserved variant patterns across the major haplotypes. The C>T variants at positions 308–309 are ubiquitous in Haplotypes 1–7, appearing as a conserved blue region, which may represent a founder mutation in this cell line. Other significant variants include G>A at position 625 (prominent in Haplotypes 1, 3, 5, and 6) and C>T at position 2001 (common in Haplotypes 2, 3, 4, and 7). The A>G variant at position 2230 appears selectively in Haplotypes 2 and 6, while the A>G variant at position 1347 and C>T at position 1428 show variable distribution across the haplotypes.
Compared to the previous adaptive sampling (AS) sequencing analysis, this WGS approach has revealed a substantially more complex mtDNA landscape, with greater haplotype diversity and more nuanced clustering patterns. While the major relationship patterns are consistent between both analyses (e.g., the close relationship between Haplotypes 2 and 5), the WGS data provide a more comprehensive view of the mitochondrial genetic structure in this MSC primary cell line, capturing rare variants and subtle relationships that were not detected in the more targeted AS approach.
The hierarchical clustering of mtDNA haplotypes directly informed our haplogroup classification, with dominant haplotypes from both sequencing approaches converging on haplogroup assignment T2b28 for AdMSC cells, providing a genetic context for interpreting the functional characteristics of these cell lines in our organ-on-chip models (Supplementary Figures S2–S5).

3.6. Direct Nanopore Sequencing Reveals Low Non-CpG Methylation Levels in Mitochondrial DNA Independent of Sequencing Coverage

Leveraging the ability of nanopore sequencing to detect base modifications directly on native DNA strands, we investigated cytosine methylation patterns within the mitochondrial genome (mtDNA) of HAdMSCs. While CpG methylation is the most studied form in the nuclear genome, its relevance in mtDNA is debated due to the low CpG content within mtDNA and the lack of a known mitochondrially targeted canonical CpG methyltransferase. However, studies utilizing direct detection methods have reported evidence of mtDNA methylation, predominantly in non-CpG contexts [22]. Therefore, our analysis focused on identifying all potential cytosine methylation events captured by the Dorado basecaller’s MM and ML tags, specifically quantifying non-CpG methylation frequencies across the mitochondrial genome obtained from both adaptive sampling (AS) and whole genome sequencing (WGS) datasets. Modified bases were called only when the posterior probability was ≥0.80, thereby stringently filtering spurious signals that can arise from current drift or base-calling errors. Mean read depth and the corresponding non-CpG (CHH + CHG) methylation percentage were binned in 100 bp windows along the 16.6 kb molecule (Figure 10).
Genome-wide profiles revealed that non-CpG methylation levels were consistently low across the vast majority of the mitochondrial genome in both sequencing approaches (Figure 10A,B; red lines). The percentage of non-CpG methylation rarely exceeded 5–10% at most positions, with the overall average being significantly lower. This observation of globally low non-CpG methylation stands in stark contrast to the sequencing coverage depth profiles (Figure 10A,B; light blue lines). The AS data exhibited highly variable coverage depth, characteristic of the targeted enrichment strategy, with sharp peaks in certain regions and lower coverage elsewhere (Figure 10A). Conversely, the WGS data showed much higher and relatively uniform coverage depth across the entire mitochondrial genome (Figure 10B). Despite these dramatic differences in coverage magnitude and distribution between the AS and WGS datasets, the detected levels and overall pattern of low non-CpG methylation remained remarkably similar.
To directly assess the relationship between methylation detection and sequencing depth, we plotted the non-CpG methylation percentage against the mean coverage depth for each 1 bp window across the mitochondrial genome (Figure 10C,D). For both the AS dataset (Figure 10C), which spans a wide range of coverage depths, and the WGS dataset (Figure 10D), which primarily represents high coverage depths, the results were consistent. Non-CpG methylation percentages primarily cluster near zero, showing no apparent trend with increasing coverage depth. Quantitative Spearman correlation analysis confirmed this lack of a meaningful relationship, yielding very weak correlation coefficients (AS: ρ = −0.025, p = 2.0 × 10⁻⁵, n = 16,569; WGS: ρ = −0.028, p = 9.6 × 10⁻⁴, n = 16,569). Although the p-values are statistically significant due to the large number of data points, the correlation coefficients near zero strongly indicate that the detection of these low-level non-CpG methylation signals is not dependent on sequencing coverage depth. This supports the interpretation that the observed signals reflect characteristics of the underlying DNA rather than technical artifacts related to sequencing depth or the AS enrichment strategy.

4. Discussion

Organ-on-chip models have become increasingly relevant research instruments. Crucial for their application is their proper characterization, including ADME pharmacogenomic profiling, in order for one to fully understand their response upon challenge. While targeted sequencing achieved significantly greater sequencing depth for the ADME genes than WGS, the relative coverage variability among these target genes, as indicated by comparable enrichment ratio ranges, suggests that intrinsic factors associated with specific gene regions influence coverage uniformity irrespective of the sequencing methodology. Both methods showed there were some trade-offs. AS provides deeper and more uniform coverage across the targets (reflected in higher, more consistent normalized coverage). WGS coverage across these specific genes is inherently more variable. However, both methods appear capable of detecting gene-to-gene variations in methylation levels, and the relative methylation patterns look broadly similar, despite the differences in coverage characteristics.
These findings have important implications for pharmacogenomic research, where the accurate characterization of ADME gene methylation may influence drug metabolism phenotypes. The consistent methylation patterns detected across both sequencing approaches confirm that the observed epigenetic modifications in these genes represent genuine biological signals rather than technical artifacts. Notably, we identified differential methylation patterns in key drug-metabolizing enzyme genes that correlated with specific genetic variants, suggesting potential epigenetic regulation of drug response. The detection of these methylation patterns was consistent across both AS and WGS methodologies, though AS provided greater resolution for detecting subtle methylation differences at critical regulatory regions. These epigenetic variations may explain some of the inter-individual variability in drug metabolism that cannot be attributed to genetic polymorphisms alone. Future studies should investigate the functional consequences of these methylation patterns on gene expression and enzymatic activity, potentially offering new insights into previously unexplained pharmacokinetic variability and adverse drug reactions.
Previously, Sanger sequencing, Southern blot, and quantitative PCR have been the methods of choice for the mtDNA analysis [13,23,24,25,26]. However, these techniques are expensive, with low sensitivity and throughput. Recently, short-read next-generation sequencing techniques have been more and more explored for mtDNA sequencing and single point mutations detection. However, short reads also possess multiple limitations and are unable to detect complex rearrangements and heteroplasmic levels [27]. They also have limitations in resolving low-frequency variants and homopolymeric regions, which are often included within the mt genome as stretches of the same base, like AAAAA and as repetitive sequences. This can lead to errors in variant calling and gaps in the coverage [28]. For these reasons, there is a diagnostic need for appropriate methods to investigate mtDNA.
Long-read sequencing techniques are particularly suitable for applications where a more complete and detailed understanding of the genome is needed, because of some features like the ability to sequence through repetitive and homopolymeric regions, the improved accuracy in detecting structural variants, the better assembly of complex genomes, and the accurate detection of heteromplasmy [20,29]. Furthermore, they sequence native molecules, which allows them to detect epigenetic modifications [19,30,31] that are likely to play a crucial role in the future diagnosis of mitochondrial diseases, thus enhancing its clinical utility. Progress in flow cells and chemistry has further improved sequencing accuracy, offering better detection of low-level heteroplasmy. Precise quantification of the heteroplasmy level is extremely important because it classifies certain variants as the likely cause of the disease or as a benign polymorphism.
Despite the high copy number mitochondria per cell, mtDNA contributes only with 0.1–0.2% of the total DNA amount. This is why previous sequencing methods rely on PCR amplification [32,33]. PCR, however, can introduce biases, especially if there are regions with varying GC content, leading to uneven coverage across the mtDNA genome. This can also complicate the detection and quantification of mtDNA variants, especially in samples with heteroplasmy. Adaptive sampling is a method of software-controlled enrichment unique to nanopore sequencing platforms [34]. It allows for simple enrichment by loading a BED file of a target region. By sequencing the first 400–500 bp of a DNA library, adaptive sampling software can identify reads containing target region or not and pass only these fragments that contain the target region. Adaptive sampling is a relatively new bioinformatic tool [35] but is being more and more explored for mitochondrial DNA analysis, because all published data clearly show that it consistently enriches reference sequences. Moreover, long-read sequencing of mtDNA can be considered a consistently accurate approach for the identification of subjects based on their mtDNA haplogroup/haplotype (for forensic purposes or population genetics).
We are aware of other studies that used adaptive sampling of ONT to analyze mitochondrial DNA; however, none of them performed the analysis with mesenchymal stem cells (MSC). Mesenchymal stem cells are non-hematopoietic progenitors that are found in various tissues, most commonly in bone marrow, but also in adipose tissue, umbilical cord tissue, dental pulp, and other sites. They can differentiate into multiple lineages, which makes them very promising tool for therapeutic applications. Unfortunately, their regenerative potential decreases during ageing [18,36]. Therefore, therapeutic approaches have been investigated and already proposed to either eliminate, revitalize, or substitute senescent MSCs. Decline in mitochondrial function and biogenesis and the accumulation of mtDNA mutations are the primary reasons for ageing [37]. MtDNA mutations are known to accumulate in stem cell populations [38], accompanied by an increase in the somatic mutations [39]. However, the isolation of good quality and a good amount of MSC remains a challenge. AdMSC are a relatively abundant source, with high proliferative capacity and easy harvesting, making them extremely suitable for different applications in regenerative medicine. Another thing is that obesity and obesity-related complications have become more serious issues, affecting people all over the world [40]. Adipose tissue is a major regulator of energy metabolism and serves not only as a fat tissue storing, mobilizing, and distributing site, but different types of cells within it can produce heat (brown adipose tissue) and many adipokines. These are biologically active substances that exert diverse functions like immune (e.g., complement factors, haptoglobin), endocrine function (e.g., leptin, sex steroids, various growth factors), metabolic function (e.g., fatty acids, adiponectin, resistin), and cardiovascular function (e.g., angiotensinogen, PAI-1) [41,42,43]. Studying the physiology and pathophysiology of conditions associated with metabolic inflammation is yet more than ever important. For this reason, AdMSC are considered as the main “players” and new studies for biomimetic models implementing AdMSC are being published more often [44,45].
Because of all these important considerations, a straightforward, accurate, reproducible, and PCR-free protocol for studying mitochondrial defects in adipose-derived MSC has been established. The analysis pipeline allows the alignment of reads containing large deletions, which leads to an accurate detection of the boundaries of mtDNA deletion and its heteroplasmy levels. This approach could serve as an optimal method for conducting full mtDNA genetic studies in a single experiment, offering complete mitochondrial genome sequencing and the detection of both point mutations and large deletions, along with quantification of heteroplasmy.
The custom algorithm developed for linking epigenetic modifications to sequence variations provided critical advantages for comprehensive mtDNA analysis. By simultaneously processing methylation signals and heteroplasmic variants from individual long reads, the algorithm preserved the phase relationship between epigenetic marks and sequence polymorphisms—a connection that would be lost in traditional separate analyses. This integrated approach revealed that certain heteroplasmic variants consistently co-occurred with specific methylation patterns in the D-loop, suggesting functional relationships between genetic and epigenetic variations that influence mitochondrial gene expression.
Furthermore, the algorithm’s ability to handle the circular nature of mtDNA and account for strand-specific methylation patterns enabled the identification of methylation clusters that correlated with particular haplotypes. This led to the discovery of previously uncharacterized mitochondrial epigenetic signatures associated with specific sequence variants. In samples with limited heteroplasmy, the approach successfully leveraged methylation patterns as surrogate markers for lineage discrimination, effectively increasing the resolution of mtDNA classification beyond what would be possible with sequence analysis alone. This methodology provided new insights into the complex interplay between mitochondrial genetics and epigenetics that may contribute to our understanding of mitochondrial heterogeneity in various biological contexts.
The current literature on integrated approaches to mitochondrial DNA methylation and heteroplasmy is still nascent. Most studies have analyzed mtDNA methylation and sequence variants separately, without directly examining their interplay. For example, Patil et al. mapped extensive mtDNA methylation patterns (mostly at non-CpG sites) across the mitochondrial genome [22], and Liu et al. characterized the distribution of CpG methylation in mtDNA [46]. However, these studies considered epigenetic and genetic variations independently, inferring any links only indirectly. The advent of long-read sequencing now allows both genetic and epigenetic features to be read concurrently from the same DNA molecule, a major technological advance in genomics [47]. Recent reviews highlight that nanopore sequencing can directly detect nucleotide modifications along with the DNA sequence, enabling simultaneous calling of heteroplasmic variants and methylation marks from one experiment [47]. Similar integrative methods have already been applied in the nuclear genome: Using nanopore reads, researchers have phased methylation patterns with SNP haplotypes to reveal allele-specific methylation in human chromosomes [48].
Yet, applying these techniques to mtDNA remains challenging. Mitochondrial methylation levels are very low and sometimes controversial [22,49,50], making true signals hard to distinguish from noise. Most controversy stems from CpG specifically targeted detection by most methods, including early DNA methylation detection algorithms, like Nanopolish and Megalodon, as shown by the higher DNA methylation within Guppy basecalling reads [50]. Novel Dorado modes are better suited to detect 5meC, but perhaps other non-CpG modifications (like 6mA) should be specifically trained to enable proper and verifiable detection. Substantial evidence argues against widespread, functional CpG methylation in mammalian mtDNA. This scarcity might be linked to the potential gene silencing effects such methylation could exert within the extremely compact mitochondrial genome, combined with the lack of known canonical CpG methyltransferases targeted to mitochondria [51]. This is in stark contrast to the nuclear genome where CpG methylation is a fundamental epigenetic mark. Consequently, earlier studies or methods focusing primarily or solely on CpG methylation might have provided an incomplete picture or underestimated other forms of modification [50].
Additionally, specialized bioinformatics tools are needed to handle the circular mtDNA and to jointly analyze heteroplasmy with methylation. Our approach addresses these gaps by using algorithms tailored to mtDNA’s unique characteristics, allowing us to simultaneously assess sequence heteroplasmy and methylation on single molecules. This represents a methodological advance in the emerging field of mitochondrial epigenomics, laying the groundwork for deeper insights into mtDNA regulation in aging and disease.
Building on our findings that nanopore adaptive sampling effectively decouples base modification detection from sequencing coverage artifacts (as suggested by the analysis in Figure 10C,D), our data support the detection of genuine, albeit low-level, non-CpG methylation signals directly from native mtDNA molecules. Our analysis pipeline, utilizing Dorado basecalling with MM and ML tags to identify cytosine modifications (Figure 10), revealed globally low levels of methylation, predominantly appearing independent of CpG context. This finding aligns with studies such as Patil et al. [22] which used orthogonal methods and also concluded that non-CpG (CpH) methylation is the more prevalent, though still potentially sparse, form in human mtDNA. While our study lacks independent validation (a limitation discussed previously), the observation of consistent low-level patterns irrespective of coverage depth (Figure 10A vs. Figure 10B) or sequencing strategy (AS vs WGS, Figure 10C vs. Figure 10D) lends support to these signals reflecting features of the sequenced molecules rather than mere technical noise. Furthermore, the potential functional relevance of maintaining low mtDNA methylation levels is underscored by studies indicating that artificial or pathological hypermethylation can perturb mitochondrial gene expression and function [31]. For instance, hypermethylation of genes like ND6 observed under specific pathological conditions associated with obesity models appeared detrimental [52], suggesting that significant increases above baseline methylation might be functionally disruptive. Bicci et al. CpG considers mtDNA methylation as technical artifact of low sequencing coverage [49]. Interestingly, AS application produces specific co-occurrence patterns between genetic variants and methylation marks, particularly in functionally significant regions like the D-loop. This integrated approach not only preserves the phase relationship between epigenetic modifications and sequence polymorphisms but also the identification of putative methylation clusters regardless of the modification that could correlate with particular haplotypes—relationships that would remain undetectable using conventional separate analyses. One important limitation of this study is that only the AdMSC cell line under the intact condition was subject to this analysis. As another study recently proved increased methylation in ND5 mitochondrial gene after challenge [31], and we should expect methylation phenomena in mitochondria to be dynamic phenomena, regardless of how rare and low frequency they are. Their lower frequency should not be regarded as a result of lesser importance, as this could be due to signaling regulation phenomena. Beyond 5mC, it is increasingly recognized that other base modifications contribute to the mitochondrial epitranscriptome and, potentially, the epigenome. Notably, N6-methyladenosine (m6A) has been identified and characterized as a distinct epigenetic mark within mammalian mtDNA, installed by enzymes like METTL3/14 and potentially regulated by demethylases such as ALKBH1 [31]. This presents an alternative or parallel layer of epigenetic control operating within mitochondria. The functional role of mtDNA m6A methylation is still under investigation, but evidence suggests it could be involved in modulating crucial processes such as mtDNA replication and the expression of mitochondrial genes [31] and happened to be hyper-methylated [52]. Our current study, focused on cytosine modifications detected by standard Dorado models, was not designed to assess m6A; exploring the landscape and interplay of different modifications using tailored approaches is a pertinent future direction.

5. Conclusions

We demonstrate the power of an optimized Oxford Nanopore adaptive sampling (AS) protocol for integrated mitochondrial genomic and epigenomic analysis in adipose-derived mesenchymal stem cells. This amplification-free, long-read sequencing approach uniquely enables the simultaneous characterization of genetic variants—including heteroplasmy and haplotypes—and native DNA base modifications from the same single molecules. By preserving the crucial phase relationship between sequence and epigenetic marks, AS facilitates direct correlation analyses and provides a comprehensive view of mitochondrial heterogeneity and regulation. This study validates AS for effective mtDNA enrichment and linked geno-epigenomic profiling, highlighting its significant potential to advance investigations into mitochondrial biology, disease mechanisms, aging, and pharmacogenomics.

Supplementary Materials

The following supporting information can be downloaded at: https://www.mdpi.com/article/10.3390/app15115822/s1, Figure S1: Comparison of sequencing coverage metrics for selected ADME genes; Figure S2: Variants and heteroplasmies summary from Jar (A) and from AdMSC (B); Figure S3: Summary and statistics from the experiments (A) for mDNA from Jar (B) for mtDNA from AdMSCs; Figure S4: Phylogenetic trees of Jar (A) and AdMSC (B); Figure S5: Summary of the polymorphisms. Found_Polys represent the variants that were identified in the sample and matched the expected haplogroup-specific polymorphisms. RemainingPolys represent these that were not found or did not match the expected patterns for the haplogroup, or polymorphisms still to be confirmed; Figure S6. Different number of AS and WGS detected reads.

Author Contributions

Conceptualization, S.H. and K.T.; methodology, A.G., S.H. and K.T.; software, S.H.; validation, D.P.-D. and K.T.; formal analysis, K.T.; investigation, A.G. and Y.M.; resources, K.T.; data curation, A.G., K.T. and S.H.; writing—original draft preparation, A.G. and K.T.; writing—review and editing, S.H.; visualization, A.G. and S.H.; supervision, K.T.; project administration, K.T.; funding acquisition, K.T., D.P.-D. and S.H. All authors have read and agreed to the published version of the manuscript.

Funding

This research was funded by the European Union-NextGenerationEU, through the National Recovery and Resilience Plan of the Republic of Bulgaria, grant number BG-RRP-2.004-0003 and utilized equipment funded by National Roadmap for Research Infrastructure of the Ministry of Education and Science of Republic of Bulgaria, grant number DO1-178/29.07.2022 and grant number DO1-352/13.12.2023.

Institutional Review Board Statement

Not applicable.

Informed Consent Statement

Not applicable.

Data Availability Statement

Sequencing data are currently unavailable.

Conflicts of Interest

The authors declare no conflicts of interest. The funders had no role in the design of the study; in the collection, analyses, or interpretation of data; in the writing of the manuscript; or in the decision to publish the results.

References

  1. Antonio, Z.; Marc, L.; Manuel, P. Mitochondrial dynamics as a bridge between mitochondrial dysfunction and insulin resistance. Arch. Physiol. Biochem. 2009, 115, 1–12. [Google Scholar] [CrossRef]
  2. Kay, L.H.W.; Chih-Wei, W.; Lee-Wei, C.; Hsiao-Huang, C.; Ching-Li, C.; Cai-Yi, W.; Yu-Chi, L.; Chen, I.C.; Chun-Ying, H.; Wen-Chung, L. Dysregulation of mitochondrial dynamics mediated aortic perivascular adipose tissue-associated vascular reactivity impairment under excessive fructose intake. Nutr. Metab. 2024, 21, 4. [Google Scholar] [CrossRef]
  3. Kai, C.; Joel, S.R.; Rosalie, H.; Alfredo, E.M.-G.; Esmee, V.; Kevin, B.; Catherine, C.; Yassmin, E.; David, G.S.; Gabriel, I.; et al. Mitochondrial dynamics regulate genome stability via control of caspase-dependent DNA damage. Dev. Cell 2022, 57, 1211–1225.e1216. [Google Scholar] [CrossRef]
  4. Chongwei, B.; Lin, W.; Yong, F.; Baolei, Y.; Gerardo, R.-M.; Yingzi, Z.; Samhan, A.; Xuan, Z.; Jincheng, W.; Yanjiao, S.; et al. Single-cell individual full-length mtDNA sequencing by iMiGseq uncovers unexpected heteroplasmy shifts in mtDNA editing. Nucleic Acids Res. 2023, 51, e48. [Google Scholar] [CrossRef]
  5. Aleksandr, E.V.; Andrey, L.; Takayuki, H.; Julia, L.; Jamille Silveira Fernandes, C.; Ahmed, A.-L.; Marschall, S.R.; Nageswara, R.M. Mitochondrial dysfunction and metabolic reprogramming induce macrophage pro-inflammatory phenotype switch and atherosclerosis progression in aging. Front. Immunol. 2024, 15, 1410832. [Google Scholar] [CrossRef]
  6. Isabelle, D.-R.; Florence, A.; Maroun, K. Mitochondrial MicroRNAs Contribute to Macrophage Immune Functions Including Differentiation, Polarization, and Activation. Front. Physiol. 2021, 12, 738140. [Google Scholar] [CrossRef]
  7. Laura, E.N.; Gerald, S.S. Mitochondrial DNA Release in Innate Immune Signaling. Annu. Rev. Biochem. 2023, 92, 299–332. [Google Scholar] [CrossRef]
  8. Koumei, S.; Hiroki, T.; Kotomi, S.; Ayaka, O.; Tadayoshi, K.; Masafumi, T.; Akihide, O.; Hirotada, S.; Shigeki, M.; Hisataka, I.; et al. Palmitic acid induces interleukin-1β secretion via NLRP3 inflammasomes and inflammatory responses through ROS production in human placental cells. J. Reprod. Immunol. 2016, 116, 104–112. [Google Scholar] [CrossRef]
  9. Liyuan, Z.; Ling, L. New Insights Into the Interplay Among Autophagy, the NLRP3 Inflammasome and Inflammation in Adipose Tissue. Front. Endocrinol. 2022, 13, 739882. [Google Scholar] [CrossRef]
  10. François, R.J.; Gerald, I.S. Regulation of mitochondrial biogenesis. Essays Biochem. 2010, 47, 69–84. [Google Scholar] [CrossRef]
  11. Andrew, J.R.; Sergio, A.M.-G.; Ryoma, K. The Origin and Diversification of Mitochondria. Curr. Biol. 2017, 27, R1177–R1192. [Google Scholar] [CrossRef]
  12. Verena, Z.; Chuan, K.; William, F.M.; Sven, B.G. Endosymbiotic theory for organelle origins. Curr. Opin. Microbiol. 2014, 22, 38–48. [Google Scholar] [CrossRef]
  13. Anderson, S.; Bankier, A.T.; Barrell, B.G.; Bruijn, M.H.L.d.; Coulson, A.R.; Drouin, J.; Eperon, I.C.; Nierlich, D.P.; Roe, B.A.; Sanger, F.; et al. Sequence and organization of the human mitochondrial genome. Nature 1981, 290, 457–465. [Google Scholar] [CrossRef]
  14. Amy, M.F.; Adele, M.M.; Anna, L.; Bennett Van, H. Oxidants and not alkylating agents induce rapid mtDNA loss and mitochondrial dysfunction. DNA Repair 2012, 11, 684–692. [Google Scholar] [CrossRef]
  15. Gyanesh, S.; Pachouri, U.C.; Devika Chanu, K.; Aman, K.; Chirag, C.; Pushplata, S. Mitochondrial DNA Damage and Diseases. F1000Research 2015, 4, 176. [Google Scholar] [CrossRef]
  16. Lukas, W.; Nicola De, M.; Rory, M.; Charlotte, M.; Ewan, B.; Matthew, L.; Nick, G. Dynamic, adaptive sampling during nanopore sequencing using Bayesian experimental design. Nat. Biotechnol. 2023, 41, 1018–1025. [Google Scholar] [CrossRef]
  17. Evan, J.K.; Laramie, L.L.; Marissa, S.M.; Cristina, M.B.; Julia, P.B.; Christopher, F.; Jonathan, D.O.; Peter, A.L. Nanopore adaptive sampling for targeted mitochondrial genome sequencing and bloodmeal identification in hematophagous insects. Parasites Vectors 2023, 16, 68. [Google Scholar] [CrossRef]
  18. Valentina, A.B.; Denis, N.S.; Tatyana, I.D.; Kirill, V.G.; Irina, B.P.; Ljubava, D.Z.; Vasily, A.P.; Valery, P.C.; Egor, Y.P.; Gennady, T.S.; et al. Age-Related Changes in Bone-Marrow Mesenchymal Stem Cells. Cells 2021, 10, 1273. [Google Scholar] [CrossRef]
  19. Nicole, W.; Peter, A.L.; Adam, M.; Christopher, F. The mitochondrial genome and Epigenome of the Golden lion Tamarin from fecal DNA using Nanopore adaptive sequencing. BMC Genom. 2021, 22, 726. [Google Scholar] [CrossRef]
  20. Chiara, F.; Nadia, Z.; Alessia, N.; Rossella, I.; Costanza, L.; Eleonora, L.; Andrea, L.; Daniele, G. Nanopore long-read next-generation sequencing for detection of mitochondrial DNA large-scale deletions. Front. Genet. 2023, 14, 1089956. [Google Scholar] [CrossRef]
  21. Beckman Coulter, Inc. Agencourt AMPure XP PCR Purification; Beckman Coulter, Inc.: Brea, CA, USA, 2016. [Google Scholar]
  22. Patil, V.; Cuenin, C.; Chung, F.; Aguilera, J.R.R.; Fernandez-Jimenez, N.; Romero-Garmendia, I.; Bilbao, J.R.; Cahais, V.; Rothwell, J.; Herceg, Z. Human mitochondrial DNA is extensively methylated in a non-CpG context. Nucleic Acids Res. 2019, 47, 10072–10085. [Google Scholar] [CrossRef] [PubMed]
  23. Joel, H.W.; Carolyn, K.J.Y.; Matthew, J.Y. Analysis of Human Mitochondrial DNA Content by Southern Blotting and Nonradioactive Probe Hybridization. Curr. Protoc. Toxicol. 2019, 80, e75. [Google Scholar] [CrossRef]
  24. David, B. Analysis of mitochondrial control region using sanger sequencing. Methods Mol. Biol. 2016, 1420, 143–155. [Google Scholar] [CrossRef]
  25. Victor, V.; Jing, W.; David, D.; Lee Jun, W. Real-time quantitative PCR analysis of mitochondrial DNA content. Curr. Protoc. Hum. Genet. 2011, 68, 19.7.1–19.7.12. [Google Scholar] [CrossRef]
  26. Andrea, L.; Nadia, Z.; Alessia, N.; Camille, P.; Costanza, L.; Eleonora, L.; Daniele, G. Current and New Next-Generation Sequencing Approaches to Study Mitochondrial DNA. J. Mol. Diagn. 2021, 23, 732–741. [Google Scholar] [CrossRef]
  27. Andrea, L.; Aurelio, R.; Alessia, N.; Federica, I.; Eleonora, L.; Valeria, T.; Barbara, G.; Costanza, L.; Anna, A.; Isabella, M.; et al. New genes and pathomechanisms in mitochondrial disorders unraveled by NGS technologies. Biochim. Et Biophys. Acta Bioenerg. 2016, 1857, 1326–1335. [Google Scholar] [CrossRef]
  28. Barbara, S.; Robert, Š.; Klementina, Č.; Tine, T.; Barbara Jenko, B.; Jernej, K. The quality and detection limits of mitochondrial heteroplasmy by long read nanopore sequencing. Sci. Rep. 2024, 14, 26778. [Google Scholar] [CrossRef]
  29. Anton, S.; Viktoriya, T.; Mikhail, F.; Yuri, E.; Alena, R.; Stanislav, U.; Sergey, S.; Oleg, G. The application of Nanopore sequencing for variant calling on the human mitochondrial DNA. Biol. Commun. 2021, 66, 109–123. [Google Scholar] [CrossRef]
  30. Goldsmith, C.; Rodríguez-Aguilera, J.R.; El-Rifai, I.; Jarretier-Yuste, A.; Hervieu, V.; Raineteau, O.; Saintigny, P.; de Sánchez, V.C.; Dante, R.; Ichim, G.; et al. Low biological fluctuation of mitochondrial CpG and non-CpG methylation at the single-molecule level. Sci. Rep. 2021, 11, 8032. [Google Scholar] [CrossRef]
  31. Mposhi, A.; Cortés-Mancera, F.; Heegsma, J.; De Meijer, V.E.; Van de Sluis, B.; Sydor, S.; Bechmann, L.P.; Theys, C.; de Rijk, P.; De Pooter, T.; et al. Mitochondrial DNA methylation in metabolic associated fatty liver disease. Front. Nutr. 2023, 10, 964337. [Google Scholar] [CrossRef]
  32. Michael, D.S.; Jennifer, C.A.; Derek, E.D.; Tamaki, Y.; David, P.M. Primers for a PCR-Based Approach to Mitochondrial Genome Sequencing in Birds and Other Vertebrates. Mol. Phylogenetics Evol. 1999, 12, 105–114. [Google Scholar]
  33. Yang, L.; Shanshan, G.; Chun, Y.; Xu, G.; Manling, L.; Zhidong, Y.; Zheng, Z.; Yongfeng, J.; Jinliang, X. Optimized PCR-Based Enrichment Improves Coverage Uniformity and Mutation Detection in Mitochondrial DNA Next-Generation Sequencing. J. Mol. Diagn. 2020, 22, 503–512. [Google Scholar] [CrossRef]
  34. Samuel, M.; Darren, H.; Yuxuan, L.; Samuel, H.; Matthew, D.C.; Richard, M.L. Nanopore adaptive sampling: A tool for enrichment of low abundance species in metagenomic samples. Genome Biol. 2022, 23, 11. [Google Scholar] [CrossRef]
  35. Alexander, P.; Nadine, H.; Thomas, C.; Rory, M.; Bisrat, J.D.; Matthew, L. Readfish enables targeted nanopore sequencing of gigabase-sized genomes. Nat. Biotechnol. 2021, 39, 442–450. [Google Scholar] [CrossRef]
  36. Maria, F.; Noemi, E.; Luis, A.C.; Arancha, M.; Francisco, J.V. Aging and Mesenchymal Stem Cells: Basic Concepts, Challenges and Strategies. Biology 2022, 11, 1678. [Google Scholar] [CrossRef] [PubMed]
  37. Yuliya, M.; Andreas, D.; Sebastian, S. Mitochondrial oxidative stress, mitochondrial DNA damage and their role in age-related vascular dysfunction. Int. J. Mol. Sci. 2015, 16, 15918–15953. [Google Scholar] [CrossRef]
  38. Holly, L.B.; Douglass, M.T.; Laura, C.G. Human stem cell aging: Do mitochondrial DNA mutations have a causal role? Aging Cell 2014, 13, 201–205. [Google Scholar] [CrossRef]
  39. Laura, C.G.; Marco, N.; Joanna, L.E.; Helen, A.L.T.; Geoffrey, A.T.; Daniel, M.C.; Ramesh, P.A.; Konstantin, K.; Robert, W.T.; Thomas, B.L.K.; et al. Clonal Expansion of Early to Mid-Life Mitochondrial DNA Point Mutations Drives Mitochondrial Dysfunction during Human Ageing. PLoS Genet. 2014, 10, e1004620. [Google Scholar] [CrossRef]
  40. Tim, L.; Jaynaide, P.; Rachel, J.-L. World Obesity Atlas 2024; World Obesity Federation: London, UK, 2024. [Google Scholar]
  41. Susanne, K. Adipose Tissue as a Regulator of Energy Balance. Curr. Drug Targets 2004, 5, 241–250. [Google Scholar]
  42. Liang, W.; Qi, Y.; Yi, H.; Mao, C.; Meng, Q.; Wang, H.; Zheng, C. The Roles of Adipose Tissue Macrophages in Human Disease. Front. Immunol. 2022, 13, 908749. [Google Scholar] [CrossRef]
  43. Alexey, A.T.; Tommaso, F.; Olga, P.A.; Jan, A.; Yordanka, G.G.; Juliana, M.I.; Geir, B.; Margarita, G.S.; Eugenia, R.G.; Elizaveta, V.P.; et al. The role of cadmium in obesity and diabetes. Sci. Total Environ. 2017, 601–602, 741–755. [Google Scholar] [CrossRef]
  44. Chak Ming, L.; Louis Jun Ye, O.; Sangho, K.; Yi-Chin, T. A physiological adipose-on-chip disease model to mimic adipocyte hypertrophy and inflammation in obesity. Organs-on-a-Chip 2022, 4, 100021. [Google Scholar] [CrossRef]
  45. Yunxiao, L.; Patthara, K.; Su Yin, C.; Qing Xin, Z.; Sajay Bhuvanendran Nair, G.; Shilpi, S.; Subhra Kumar, B.; Qasem, R. Adipose-on-a-chip: A dynamic microphysiological in vitro model of the human adipose for immune-metabolic analysis in type II diabetes. Lab Chip 2019, 19, 241–253. [Google Scholar] [CrossRef]
  46. Liu, B.; Du, Q.; Chen, L.; Fu, G.; Li, S.; Fu, L.; Zhang, X.; Ma, C.; Bin, C. CpG Methylation Patterns of Human Mitochondrial DNA. Sci. Rep. 2016, 6, 23421. [Google Scholar] [CrossRef] [PubMed]
  47. Laura, K.W.; Jay, R.H. Modification mapping by nanopore sequencing. Front. Genet. 2022, 13, 1037134. [Google Scholar] [CrossRef]
  48. Vahid, A.; Jean Michel, G.; Kieran, O.N.; Pawan, P.; Richard, M.; Marco, A.M.; Martin, H.; Steven, J.M.J. Megabase-scale methylation phasing using nanopore long reads and NanoMethPhase. Genome Biol. 2021, 22, 68. [Google Scholar] [CrossRef]
  49. Iacopo, B.; Claudia, C.; Zoe, J.G.; Aurora, G.-D.; Patrick, F.C. Single-molecule mitochondrial DNA sequencing shows no evidence of CpG methylation in human cells and tissues. Nucleic Acids Res. 2021, 49, 12757–12768. [Google Scholar] [CrossRef]
  50. Theresa, L.; Kobi, W.; Christine, K.; Susen, S.; Ronnie, T.; Sandro, L.P.; Joshua, L.; Lasse, S.; Anne, G.; Joanne, T. Nanopore Single-Molecule Sequencing for Mitochondrial DNA Methylation Analysis: Investigating Parkin-Associated Parkinsonism as a Proof of Concept. Front. Aging Neurosci. 2021, 13, 713084. [Google Scholar] [CrossRef]
  51. Niu, Y.; Wan, A.; Lin, Z.; Lu, X.; Wan, G. N6-Methyladenosine modification: A novel pharmacological target for anti-cancer drug development. Acta Pharm. Sin. B 2018, 8, 833–843. [Google Scholar] [CrossRef]
  52. Xiao, C.L.; Zhu, S.; He, M.; Chen, D.; Zhang, Q.; Chen, Y.; Yu, G.; Liu, J.; Xie, S.Q.; Luo, F.; et al. N6-Methyladenine DNA Modification in the Human Genome. Mol. Cell 2018, 71, 306–318.e7. [Google Scholar] [CrossRef]
Figure 1. Overview of the workflow. (A) HAdMSC culturing and maintenance. (B) Total DNA isolation using column-based isolation provided by ZymoResearch Quick-DNA Miniprep Kit. (C) Linearization of the circular mtDNA (D) Bio-fragment analysis performed on Qsep-100. (E) Library sequenced on ONT GridION. (F) Bioinformatic analysis. Incorporated clipart is licensed under Creative Commons BY-SA-NC and OpenClipArt.org licenses (accessed on 13 May 2025).
Applsci 15 05822 g001
Figure 2. Fragment analysis of DNA from JAR cell line using Qsep-100 Bio-Fragment Analyzer. (A) Native DNA isolated from JAR cells showing multiple fragment peaks. (B) Magnified view of panel A highlighting smaller fragment distributions. (C) DNA profile after treatment with BamHI-HF restriction endonuclease, showing partial linearization with some longer fragments retained. (D) DNA profile after treatment with PvuII-HF restriction endonuclease, demonstrating more complete linearization of the mitochondrial genome.
Applsci 15 05822 g002
Figure 3. Fragment analysis of HAdMSCs on Qsep-100 Bio-Fragment Analyzer. (A) Native DNA isolated from HAdMSCs. (B) DNA from HAdMSCs after treatment with PvuII-HF. (C) Library prepared with Ligation Sequencing Kit SQK-LSK109 for whole genome sequencing of HAdMSCs. (D) Library prepared from HAdMSCs after PvuII-HF digestion for adaptive sampling.
Applsci 15 05822 g003
Figure 4. (A) Comparison of the calculated weighted average sequencing coverage depth across selected ADME genes for targeted sequencing (AS, (left panel)) and whole genome sequencing (WGS, (right panel)). (B) Comparative sequence coverage and genetic variation detection in key ADME genes using adaptive sampling (AS) versus whole genome sequencing (WGS). The figure displays coverage depth, genetic variations, and haplotype representation for four critical ADME genes: CYP1A2, CYP2E1, GSTP1, and CYP3A4. For each gene, the upper panels represent data obtained through adaptive sampling (AS), while the lower panels show data from whole genome sequencing (WGS). The AS approach consistently demonstrates higher sequencing depth and more comprehensive coverage across all gene regions, enabling enhanced detection of genetic variants and more accurate haplotype resolution. Blue bars indicate exonic regions, with vertical blue lines marking the positions of identified variants. Gray bars represent individual sequence reads, with colored positions highlighting detected variants. This improved resolution provided by AS facilitates more accurate and complete pharmacogenomic profiling compared to standard WGS.
Applsci 15 05822 g004
Figure 5. Comparison of mitochondrial DNA coverage profiles between adaptive sampling and whole genome sequencing approaches in primary MSC cell line. (A) Circular visualization of mitochondrial DNA coverage using adaptive sampling (AS). The inner circle shows gene positions, while the outer ripple plot represents sequencing depth. Coverage is color coded using a viridis colormap (reversed), with darker purple indicating higher coverage and yellow-green representing lower coverage. The coverage scale is based on the 85th percentile. MT-RNR2 region is highlighted with a red line in the gene track and annotated with its specific coverage values. (B) Circular visualization of mitochondrial DNA coverage from whole genome sequencing (WGS) of the same MSC cell line. (CH) IGV visualization of mitochondrial DNA sequencing data. Panel (C) shows the coordinate range of the mitochondrial genome. Panel (D) presents variant call files highlighting SNP and SV locations (blue lines). Panel (E) displays haplotype blocks of co-inherited variations. Panels (F,G) show aligned reads from AdMSC targeted and whole genome sequencing, respectively, with colored lines indicating variations. Panel (H) depicts OXPHOS-related genes with transcription directions (arrows).
Applsci 15 05822 g005
Figure 6. Mitochondrial DNA heteroplasmy analysis using AS data. (A) Distribution of heteroplasmy frequencies across positions in the mitochondrial genome, with color indicating alternate allele frequency. (B) Heatmap showing variant frequencies across identified clusters at heteroplasmic sites. Yellow indicates high allele frequency (approaching 1.0), while blue indicates low frequency. (C) Principal component analysis of mtDNA reads based on heteroplasmic variants, showing separation between Cluster 0 (17 reads) and Cluster 1 (5 reads). (D) Circular representation of mtDNA heteroplasmy with gene regions shown as colored segments in the outer ring. Points in the center represent heteroplasmic sites, with color intensity corresponding to alternate allele frequency.
Applsci 15 05822 g006
Figure 7. Mitochondrial DNA heteroplasmy analysis from whole genome sequencing. (A) Distribution of heteroplasmy frequencies across positions in the mitochondrial genome, with variant frequencies reaching up to 0.40 at specific loci. (B) Heatmap displaying variant frequencies across the two identified clusters at eight heteroplasmic sites, revealing distinct patterns of allele distribution. (C) Principal component analysis visualizing the clustering of mtDNA reads based on heteroplasmic variants, with clear separation between Cluster 0 (16 reads) and Cluster 1 (13 reads). (D) Circular representation of mtDNA heteroplasmy showing the functional gene regions as colored segments in the outer ring, with inner points representing heteroplasmic sites colored according to their alternate allele frequency.
Applsci 15 05822 g007
Figure 8. Mitochondrial DNA haplotype analysis. (A) Hierarchical clustering dendrogram of five mtDNA haplotypes (Hap 1–5) based on genetic distances. (B) Haplotype distance matrix showing pairwise genetic distances between mtDNA haplotypes, with values ranging from 0 (identical) to 1 (maximum difference). (C) Dimensional reduction analysis of mtDNA haplotype relationships, displaying relative positions of the five haplotypes in a two-dimensional space. (D) Haplotype structure across variant positions, illustrating allelic composition at specific nucleotide positions for each haplotype, with red and blue indicating alternative alleles.
Applsci 15 05822 g008
Figure 9. Mitochondrial DNA haplotype diversity analysis in MSC primary cell line. (A) Hierarchical clustering dendrogram of 63 mtDNA haplotypes based on genetic distances, revealing multiple distinct lineage clusters. (B) Haplotype distance matrix showing pairwise genetic distances between all mtDNA haplotypes, with colors ranging from yellow (identical, 0.0) to dark blue (maximum difference, 1.0). (C) Multidimensional scaling plot illustrating relative genetic relationships between haplotypes in two-dimensional space, with dot coloring indicating haplotype frequency. (D) Variant patterns across key nucleotide positions for 15 selected haplotypes (with frequencies shown in parentheses), where red indicates one allelic variant, blue indicates the alternative allele, and gray represents missing data or intermediate values.
Applsci 15 05822 g009
Figure 10. Genome-wide distribution of non-CpG 5mC/5hmC and read depth in the AdMSC mitochondrial genome. (A) Adaptive sampling (AS) library. The mitochondrial chromosome is displayed linearly (10 bp windows). The blue shaded trace (left y-axis) shows mean read coverage; the red trace (right y-axis) shows the percentage of non-CpG cytosines (CHH + CHG) called as modified after strict filtering of Dorado output—only 5mC or 5hmC events recorded in the MM tag whose corresponding ML probability ≥ 0.80 were retained. (B) Whole genome sequencing (WGS) library processed with the same pipeline. Both datasets reveal a uniformly low (<1%) non-CpG signal that is independent of depth. (C) Scatter plot of per-window coverage versus non-CpG methylation for the AS library (1 bp windows; n = 16,569). Spearman ρ = 0.028, p = 3.6 × 10⁻⁴. The dashed line is an ordinary least squares trend (slope = −0.0005). (D) Equivalent plot for the WGS library (1 bp windows; n = 16,569). Spearman ρ = −0.027, p = 5.8 × 10⁻⁴; dashed line slope = −0.0000. The absence of any correlation confirms that the residual methylation signal is not an artefact of local sequencing depth and supports the conclusion that AdMSC mtDNA is essentially unmethylated at non-CpG sites.
Applsci 15 05822 g010
Table 1. Overall sequencing statistics.
MetricAdaptive SamplingWGS
Average mtDNA Coverage (×)157.48305.95
Average Genome Coverage (×)1.401.12
Overall Enrichment Factor112.81×273.64×
Median Enrichment Factor67.80×271.85×
Enrichment Threshold (highlight)135.60×543.69×
Table 2. Nanopore sequencing coverage * and enrichment **. Adaptive sampling is compared to WGS.
Gene/RegionAdaptive Sampling
Coverage (×)
Adaptive Sampling
Enrichment (× Genome Avg)
WGS
Coverage (×)
WGS
Enrichment (× Genome Avg)
MT-RNR2694.4 ***497.4 ***295.0263.8
MT-ND1189.0135.4305.3273.1
D-loop109.878.6304.0271.9
MT-ND5106.376.2303.9271.8
MT-ND4L104.775.0297.4266.0
MT-CO397.870.1297.3265.9
MT-ATP695.668.5308.8276.2
MT-ND695.068.0290.4259.8
MT-ND494.367.6304.2272.1
MT-ATP890.064.4311.3278.4
MT-ND389.864.4300.2268.5
MT-CYB89.163.8302.5270.6
MT-CO185.561.3317.2283.7
MT-CO278.356.1322.8288.7
MT-ND275.554.1326.6292.1
MT-RNR174.053.0292.4261.5
*—“Coverage (×)” refers to the average read depth for that mitochondrial gene/region; **—“Enrichment (× genome avg)” refers to the ratio of the gene’s coverage relative to the average genome (nuclear plus mitochondrial) coverage in the same sequencing run; ***—Median Enrichment and Enrichment Threshold are calculated per-gene. Genes with enrichment above the threshold (2× median) are flagged as Over-enriched. Average mtDNA Coverage = mean read depth across all mitochondrial bases; Average Nuclear Coverage = mean read depth across the rest of the genome; Enrichment Factor = Average mtDNA Coverage/Average Genome Coverage; Overall enrichment factor = average mtDNA coverage/average genome coverage.
Table 3. Heteroplasmy sites detected by adaptive sampling.
PositionGene/RegionCoverageReference AlleleRef (%)Alternative AlleleAlt (%)
307D-loop27C88.9T11.1
308D-loop27C70.4T29.6
309D-loop21T76.2C23.8
960D-loop27T92.6C7.4
194716S rRNA39C89.7T10.3
4098ND129C93.1T6.9
5745tRNA-Trp32G93.8A6.3
6615CO150T92.0C8.0
6690CO131G93.5A6.5
9258CO343T93.0C7.0
12416ND556C94.6A5.4
13406ND556A94.6G5.4
13584ND520T95.0C5.0
14074ND544A88.6C11.4
14587ND640C95.0A5.0
Note: This table presents heteroplasmy sites detected in mitochondrial DNA using adaptive sampling (AS). Heteroplasmy levels represent the percentage of reads containing the alternative allele at each position. The D-loop region (positions 16024-576) contains 4 of the 15 detected heteroplasmy sites, with positions 307-309 showing the highest heteroplasmy levels (11.1–29.6%). Protein-coding genes, particularly ND5, contain multiple heteroplasmy sites. Coverage depth ranges from 20× to 56×, with generally lower coverage compared to WGS but sufficient for reliable heteroplasmy detection.
Table 4. Heteroplasmy sites detected by whole genome sequencing.
PositionGene/RegionCoverageReference AlleleRef (%)Alternative AlleleAlt (%)
307D-loop112C90.2T8.9
308D-loop90C65.6T34.4
309D-loop81T67.9C32.1
624tRNA-Phe35G57.1A42.9
200016S rRNA74C89.2T10.8
212916S rRNA50A94.0G6.0
13406ND5129A91.5G8.5
14247ND697C91.8T8.2
Note: This table presents heteroplasmy sites detected in mitochondrial DNA from the same MSC cell line using whole genome sequencing. The D-loop region (positions 16024-576) contains three adjacent sites (307-309) with moderate to high heteroplasmy levels. Position 624 in the tRNA-Phe gene shows the highest heteroplasmy level at 42.9%. Coverage depth ranges from 35× to 129×, with the highest coverage observed at position 13406 in the ND5 gene.
Table 5. Mitochondrial DNA haplotype analysis results using AS data. Summary of haplotype characteristics.
Haplotype IDFrequency (%)Key Variant Positions
Haplotype 13.2308 C>T, 309 C>T, 691 G>A, 929 G>C, 1385 A>C, 1407 A>C, 1468 G>A
Haplotype 23.2308 C>T, 309 C>T, 1347 A>G, 1468 G>A
Haplotype 33.2409 G>A, 929 G>C, 1347 A>G, 1468 G>A
Haplotype 43.2308 C>T, 309 C>T, 409 G>A, 691 G>A, 929 G>C, 1347 A>G, 1385 A>C, 1407 A>C, 1468 G>A
Haplotype 53.2308 C>T, 409 G>A, 546 G>A, 691 G>A, 929 G>C, 1347 A>G, 1468 G>A
Table 6. Summary of major mtDNA haplotypes using WGS data.
Haplotype IDFrequency (%)Read CountMajor Variant Positions
Haplotype 13.6Highest310 T>C, 625 G>A variants; conserved blue regions at 308-309 C>T
Haplotype 22.2HighConserved blue regions at 308-309 C>T; red variant at 2001 C>T
Haplotype 32.2HighDistinctive red variants at 625 G>A and 2001 C>T
Haplotype 41.5MediumRed variant at 2001 C>T; missing blue variants at 308-309
Haplotype 51.5Medium625 G>A variant; missing variants at 2001 and 2230
Haplotype 61.5Medium625 G>A and 2230 A>G variants
Haplotype 71.5Medium2001 C>T variant; missing the common 308-309 blue pattern
Haplotypes 8–630.7 eachLowVarious combinations of variants with low frequency
Disclaimer/Publisher’s Note: The statements, opinions and data contained in all publications are solely those of the individual author(s) and contributor(s) and not of MDPI and/or the editor(s). MDPI and/or the editor(s) disclaim responsibility for any injury to people or property resulting from any ideas, methods, instructions or products referred to in the content.

