Research on the Vibration Characteristics of Air Spring Suspension Seats Considering Friction Damping


Abstract
1. Introduction
2. Introduction to the Air Spring Suspension and Seat Dynamic Comfort
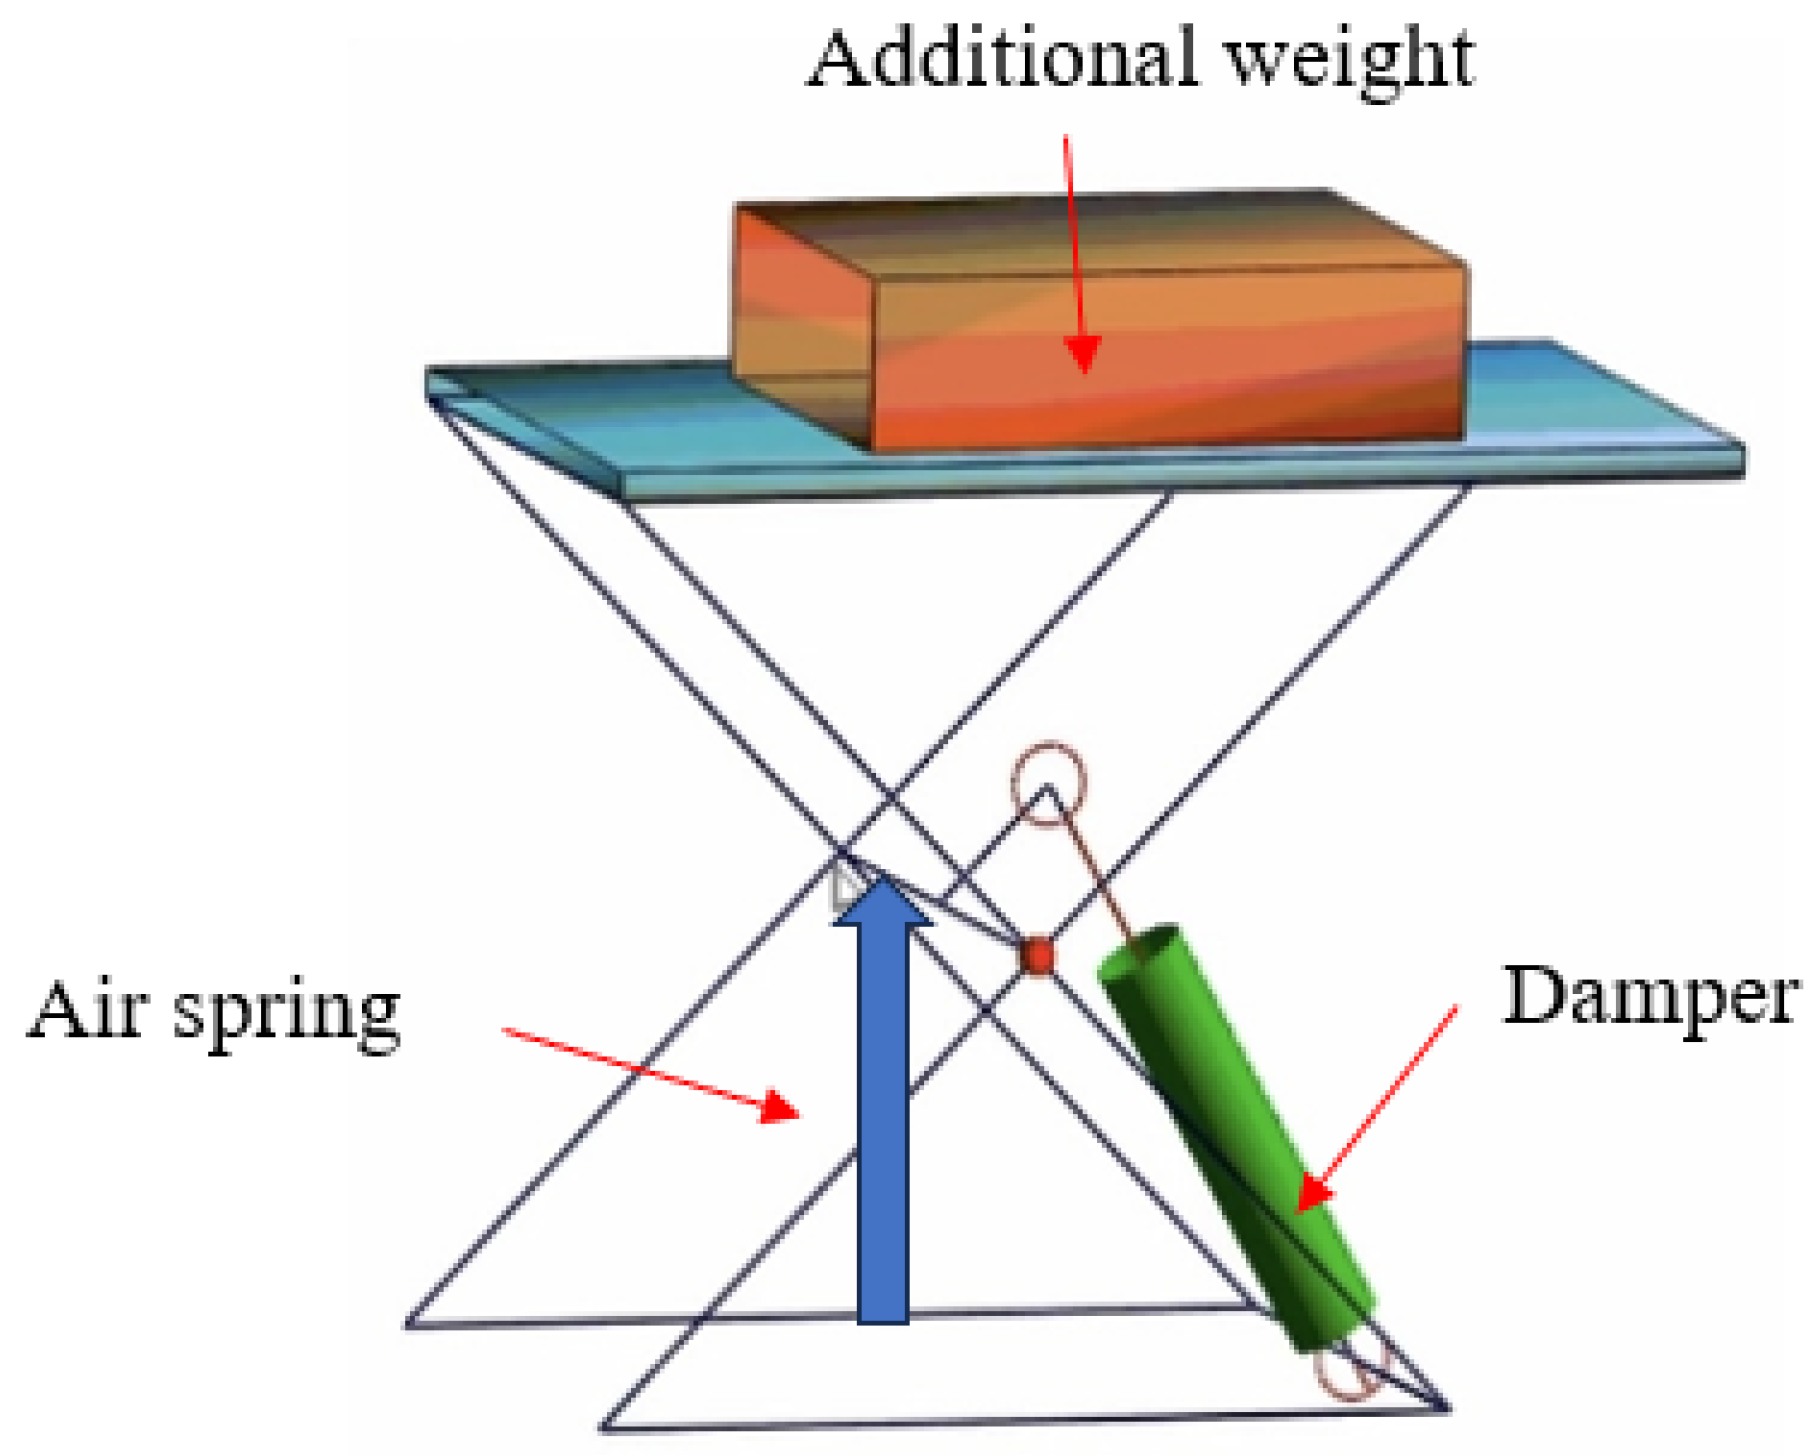
2.1. Air Spring Suspension
2.2. Seat Dynamic Comfort
3. Analysis of Suspension Damping Coefficient
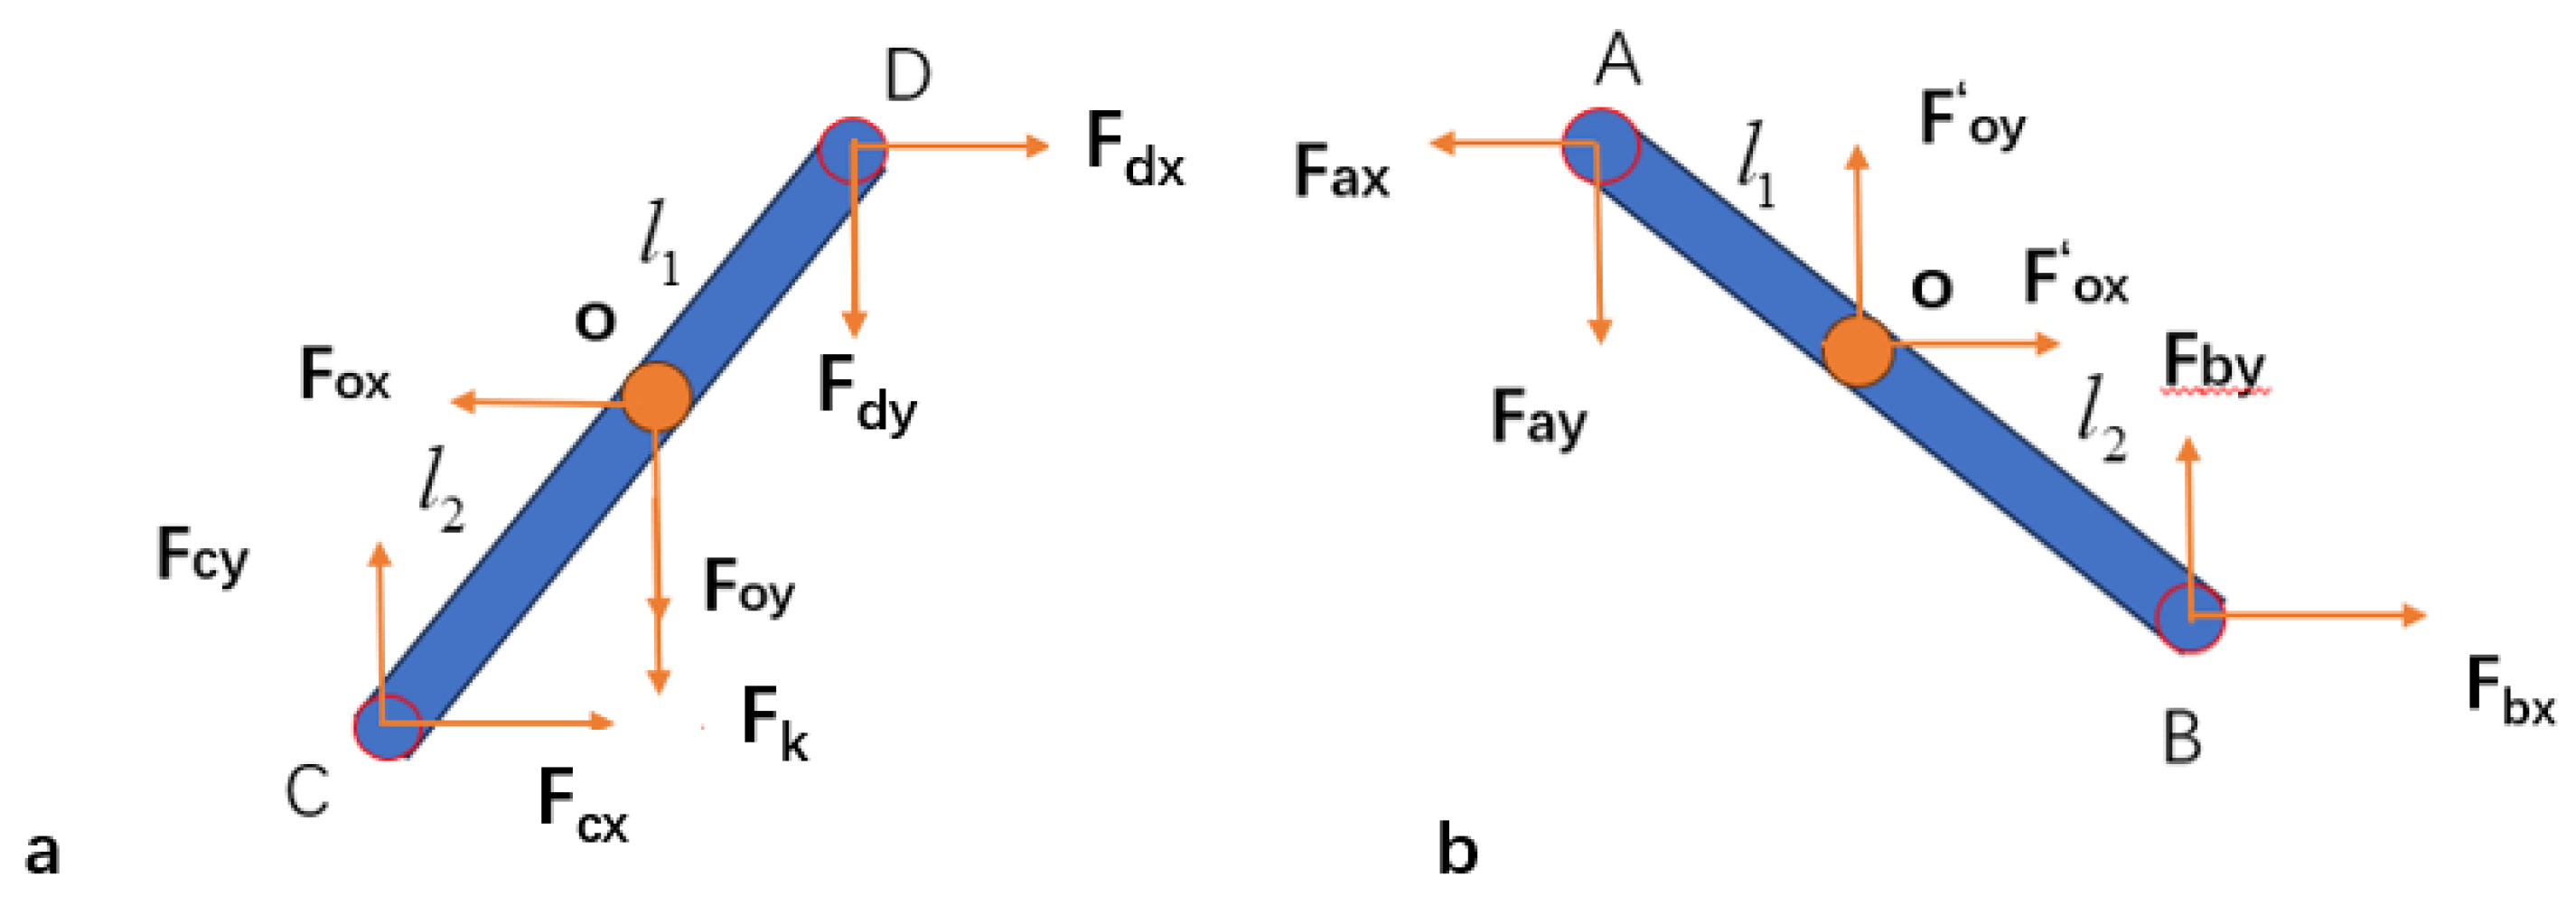
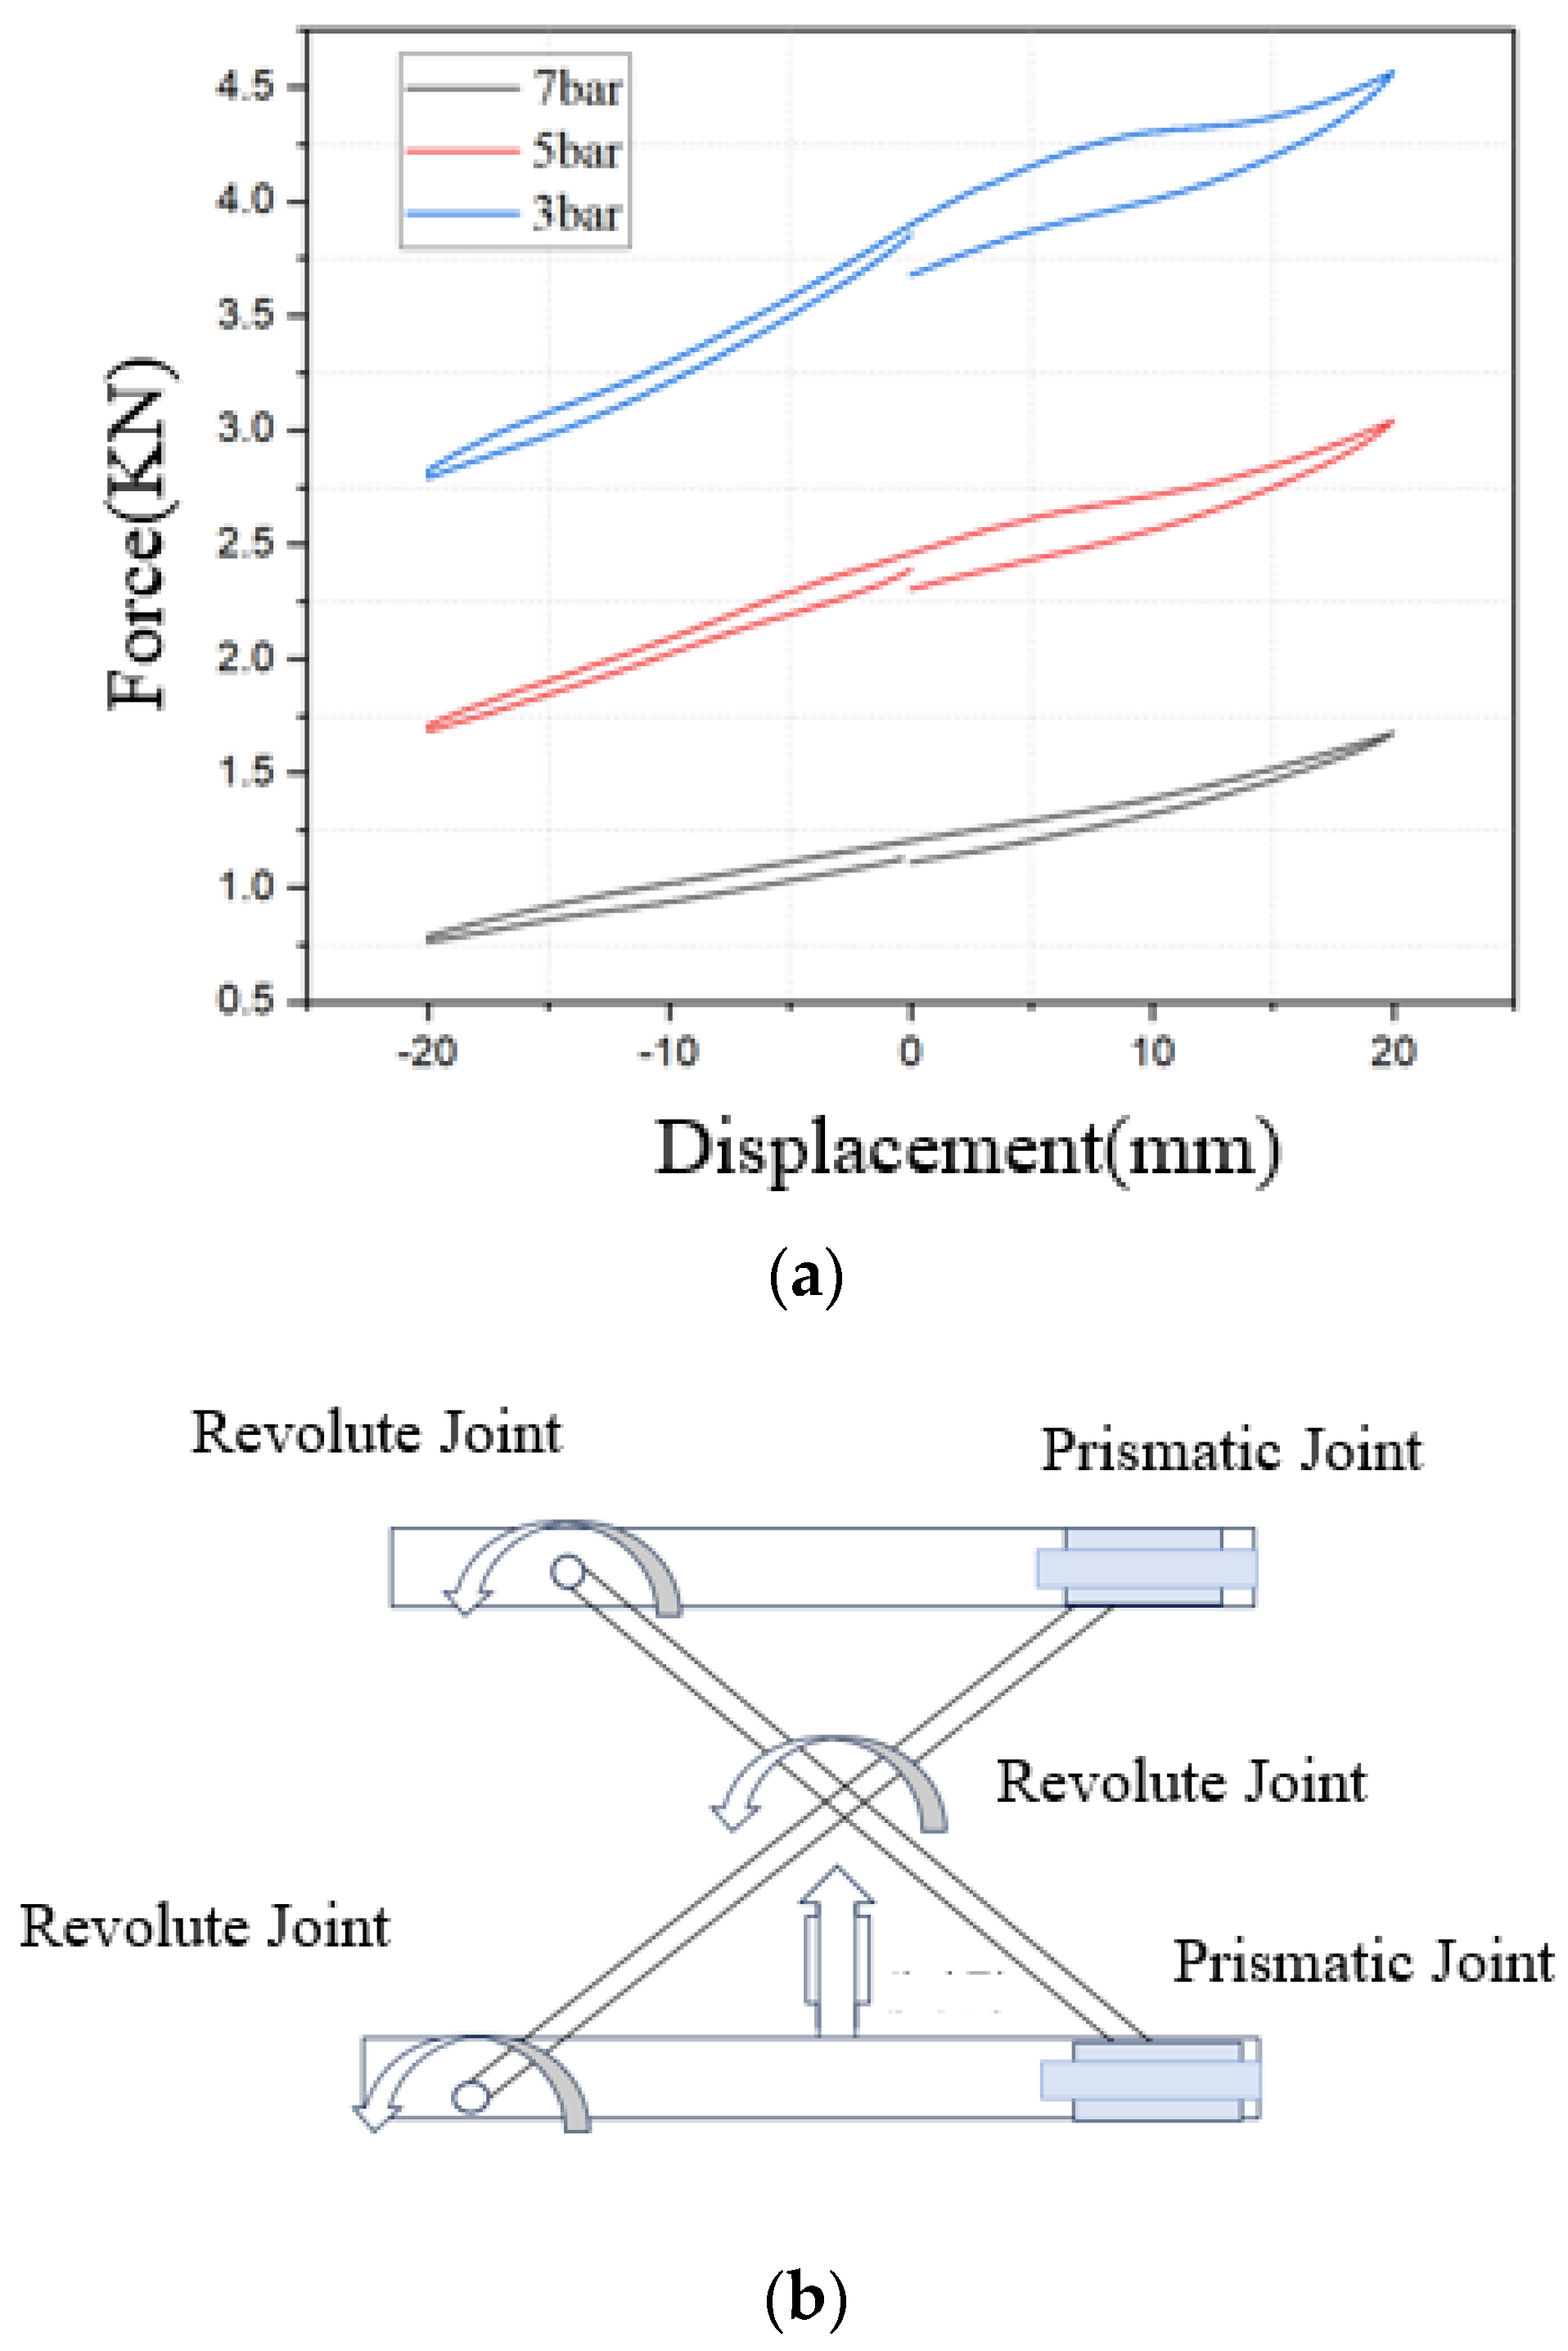
3.1. Calculation of Equivalent Damping Coefficient
3.2. Analysis of Vibration Characteristics of Air Spring Suspension
4. Research on Dynamic Seat Comfort
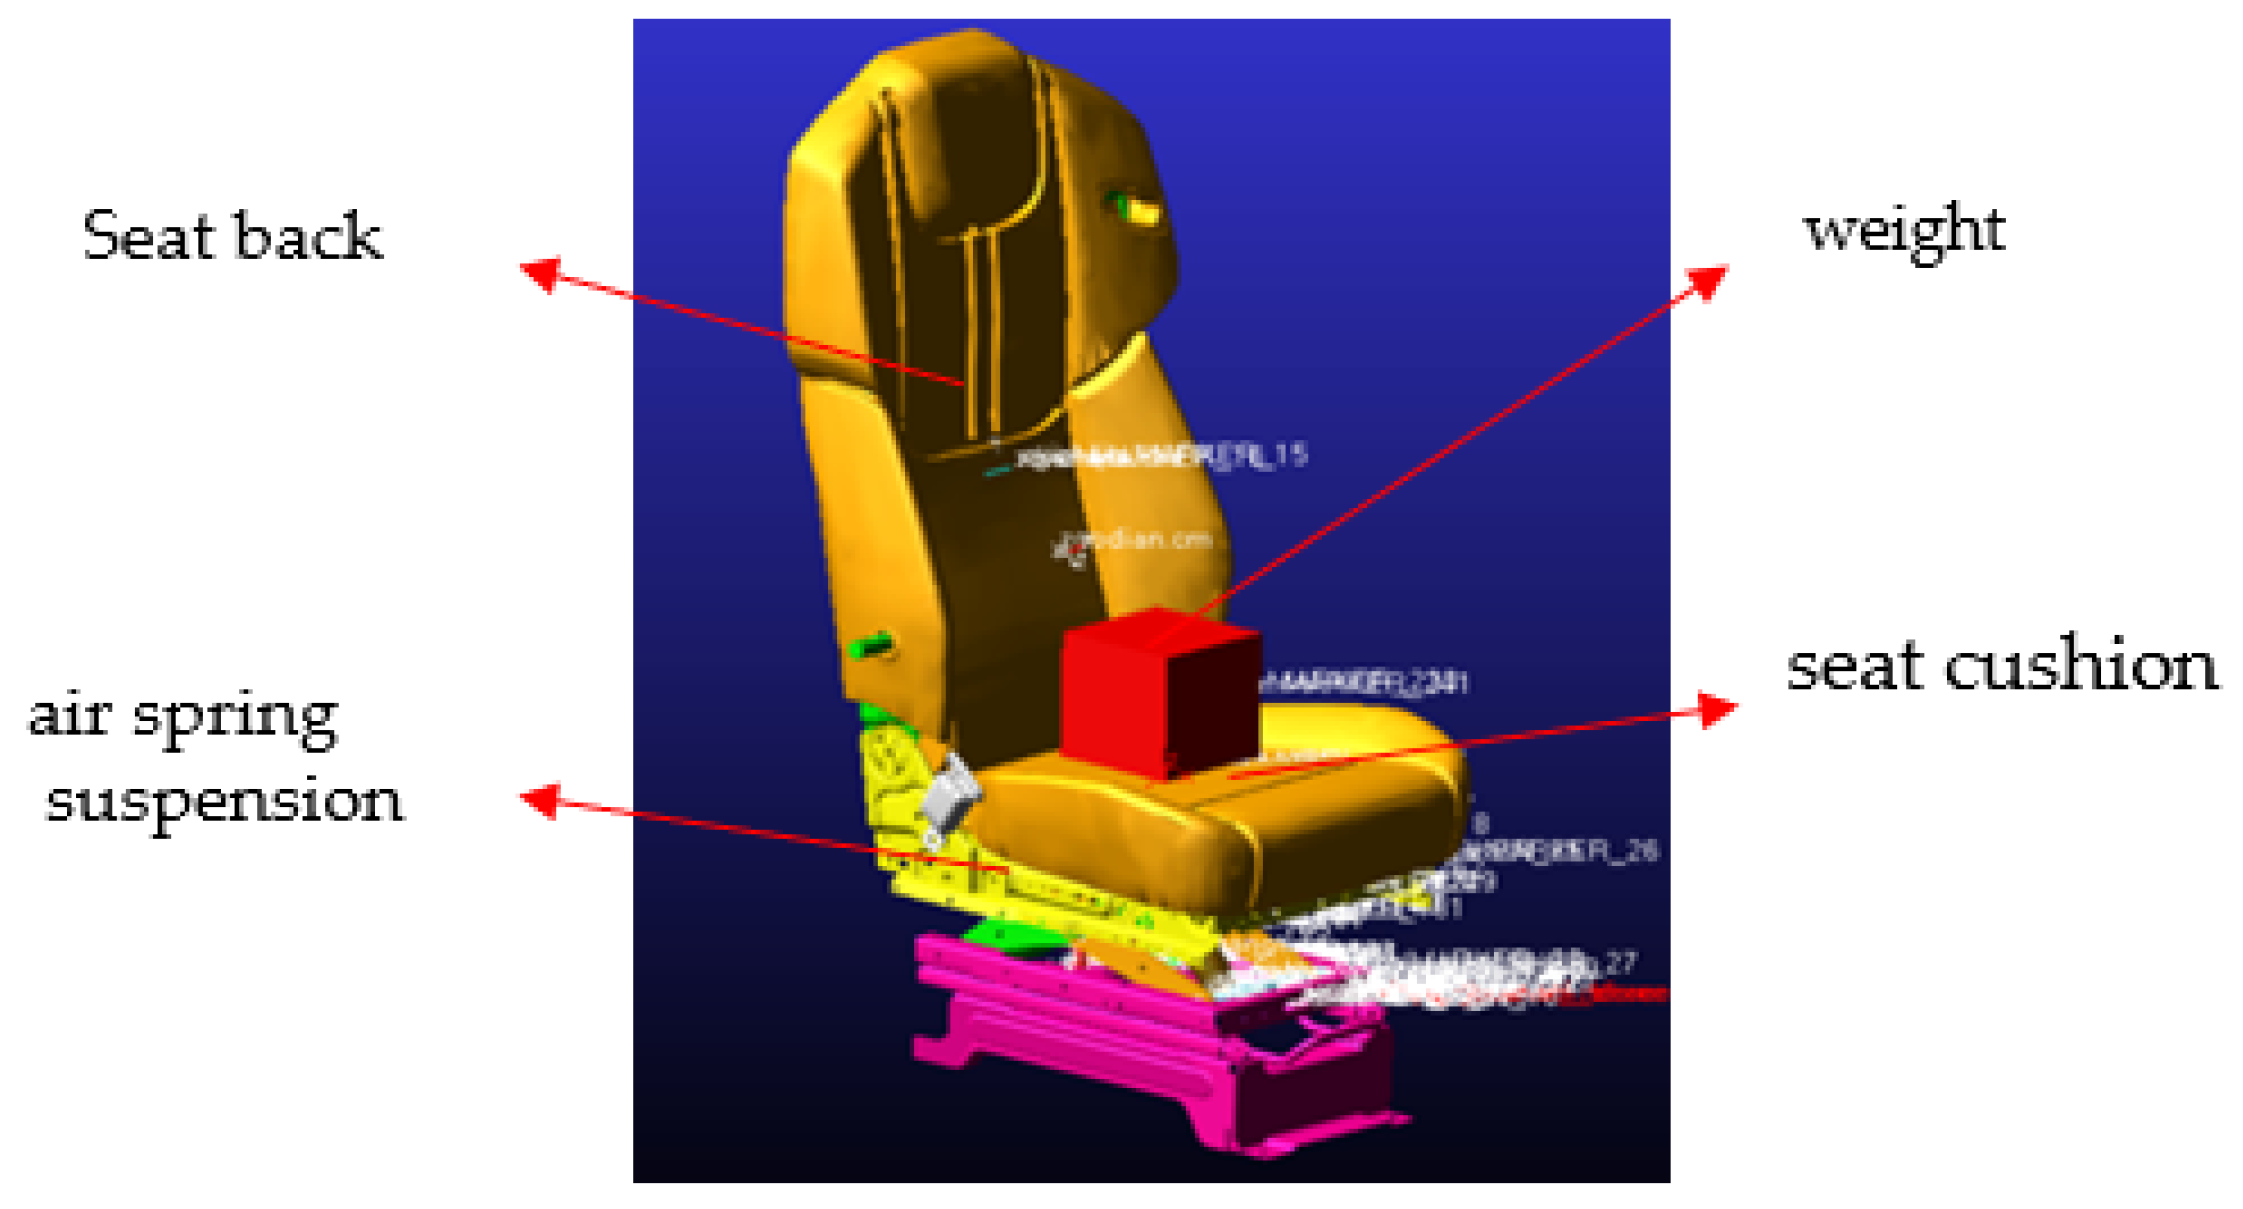
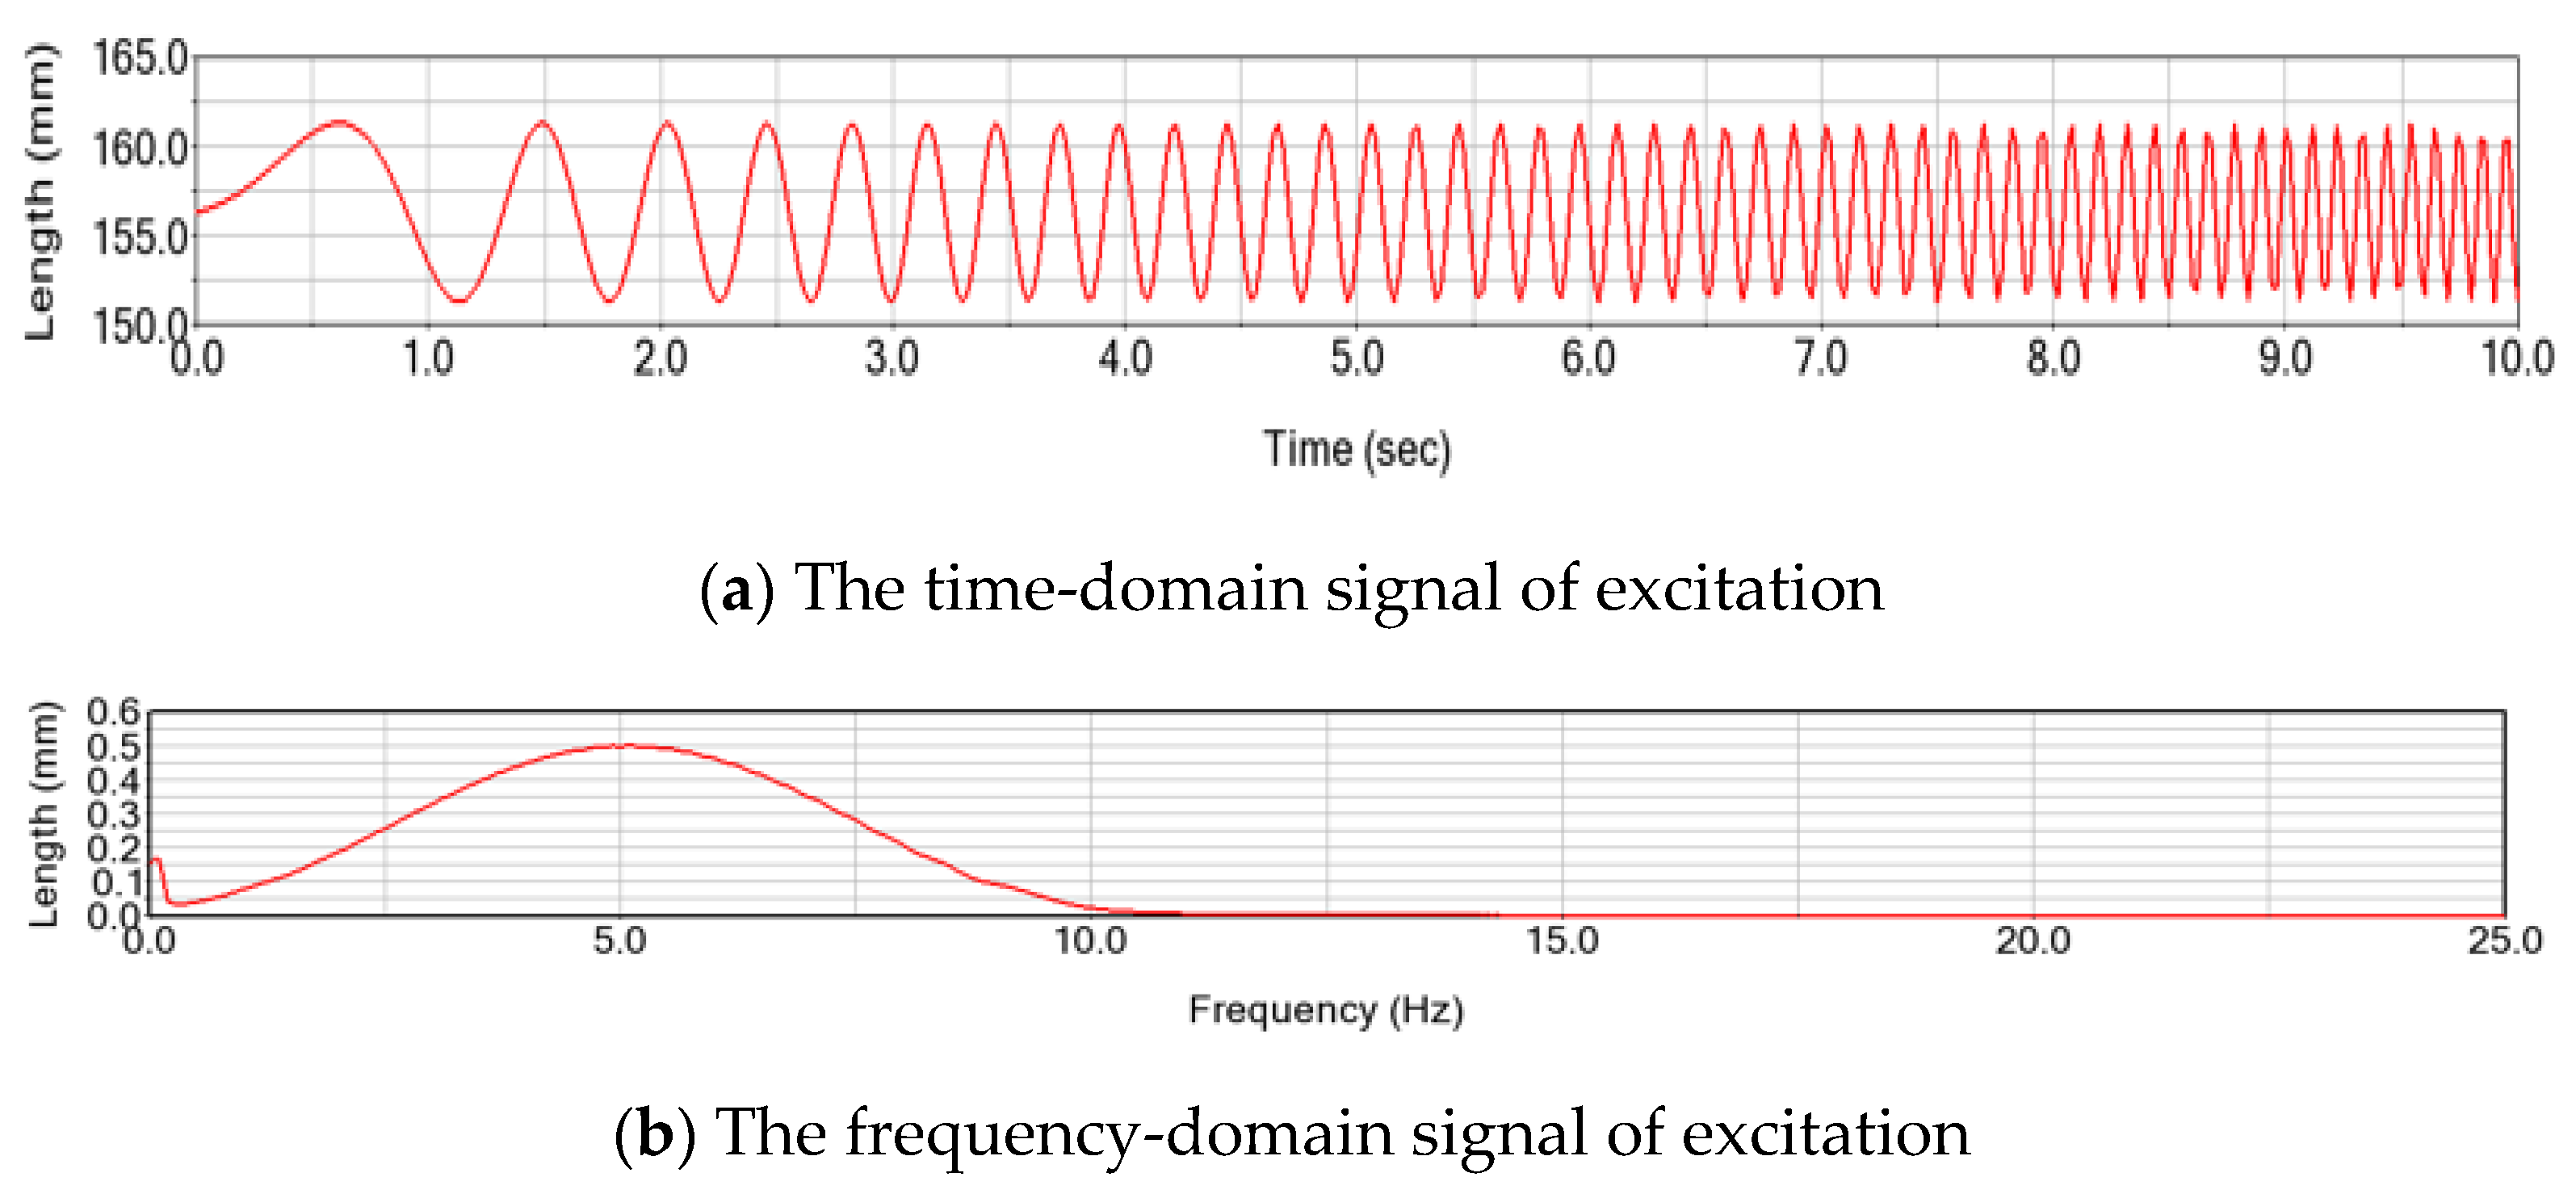
4.1. Dynamic Modeling and Simulation of the Vehicle Seat Systems
- (1)
- Fixed air spring stiffness with varying damper damping coefficient;
- (2)
- Fixed damper damping coefficient with varying air spring stiffness.
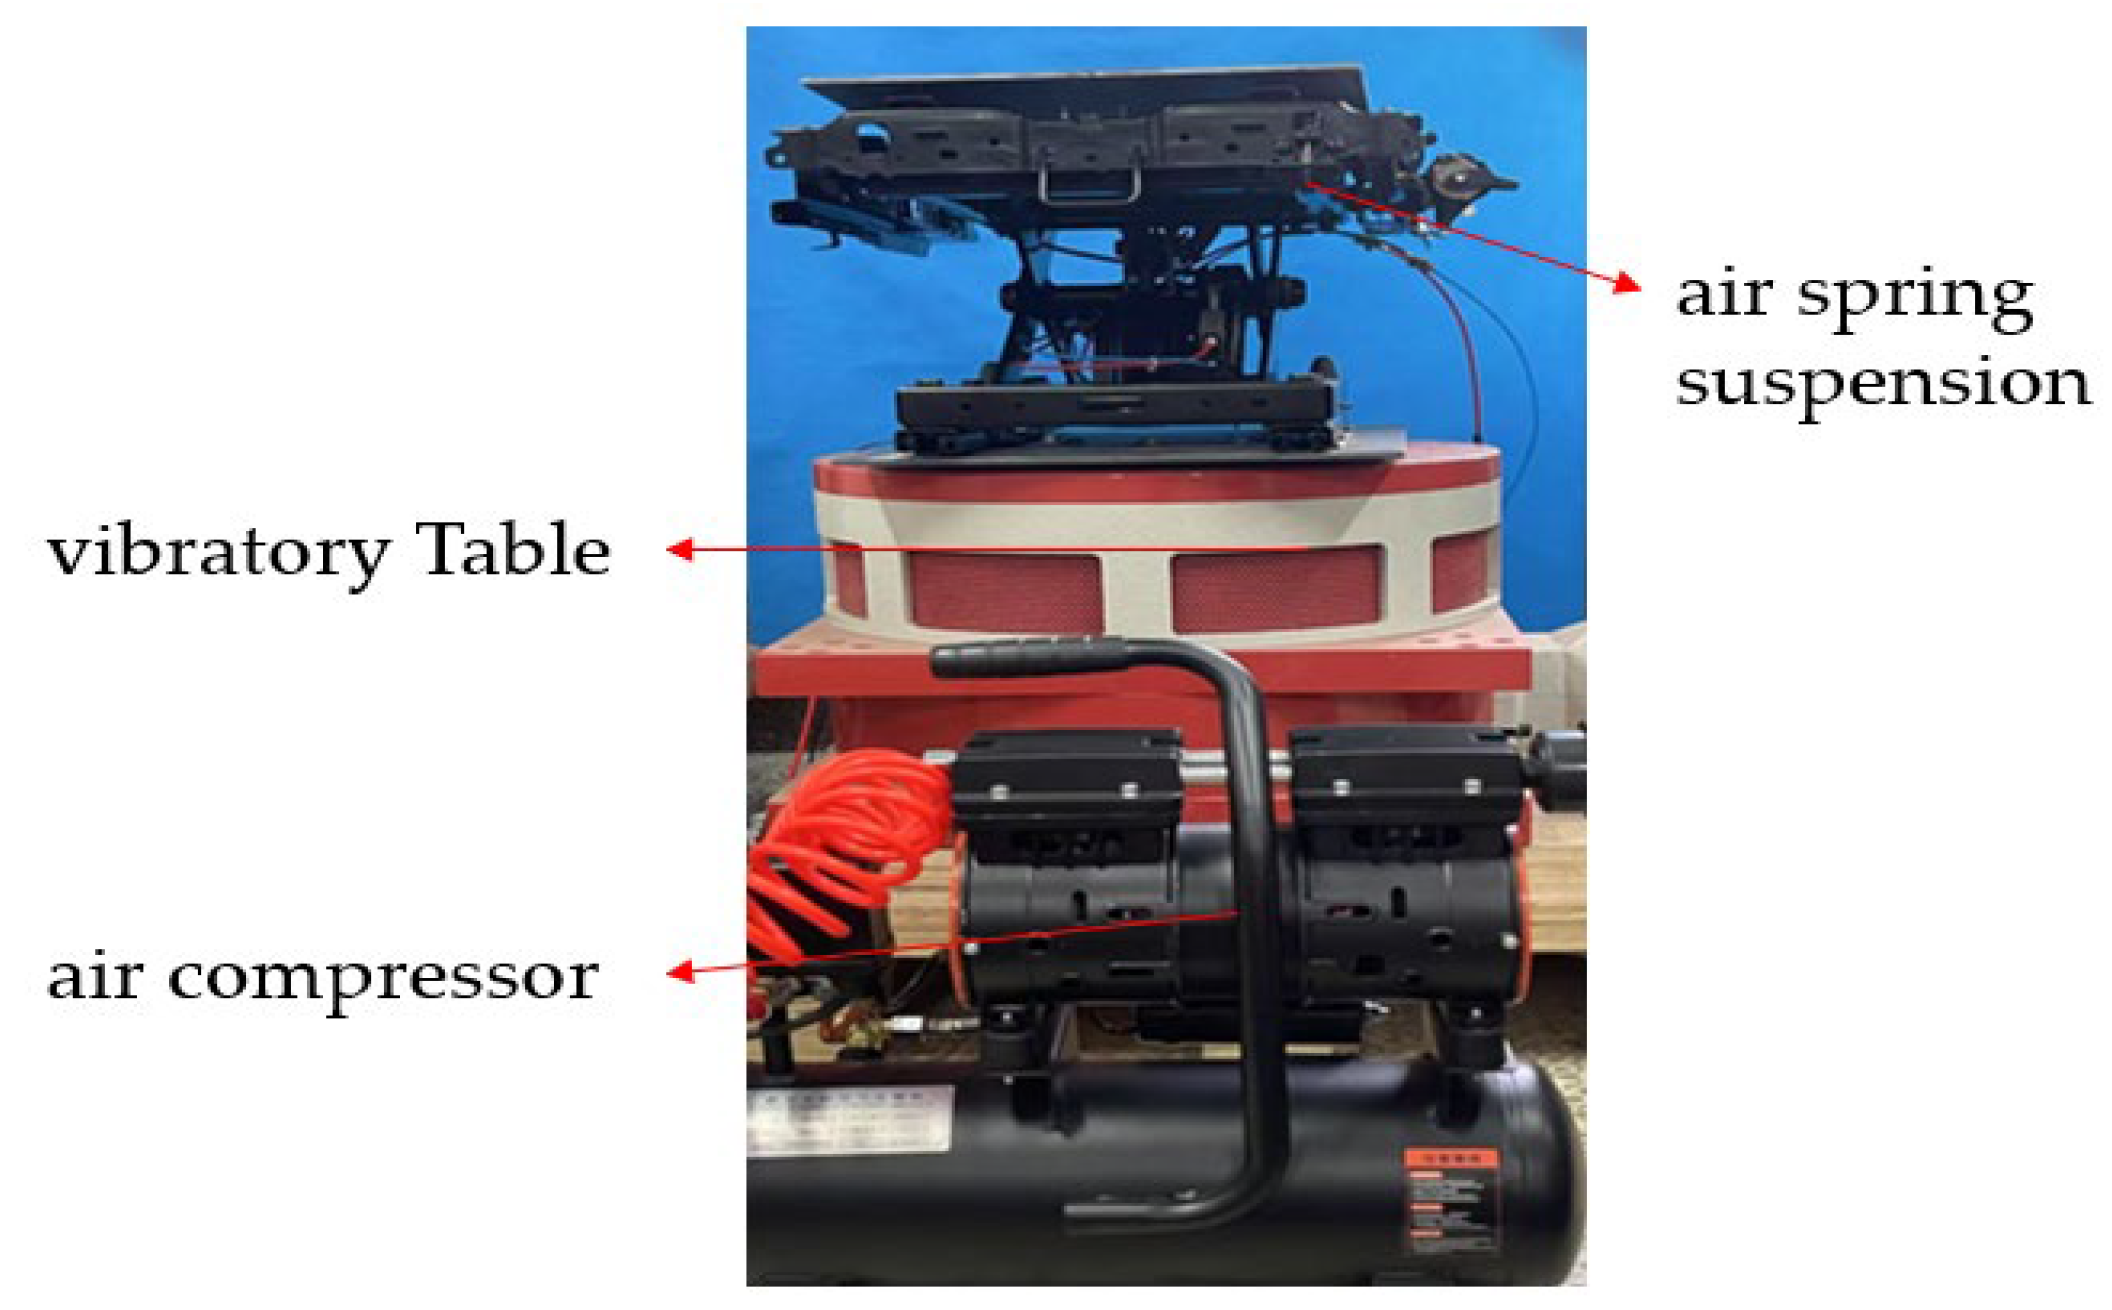
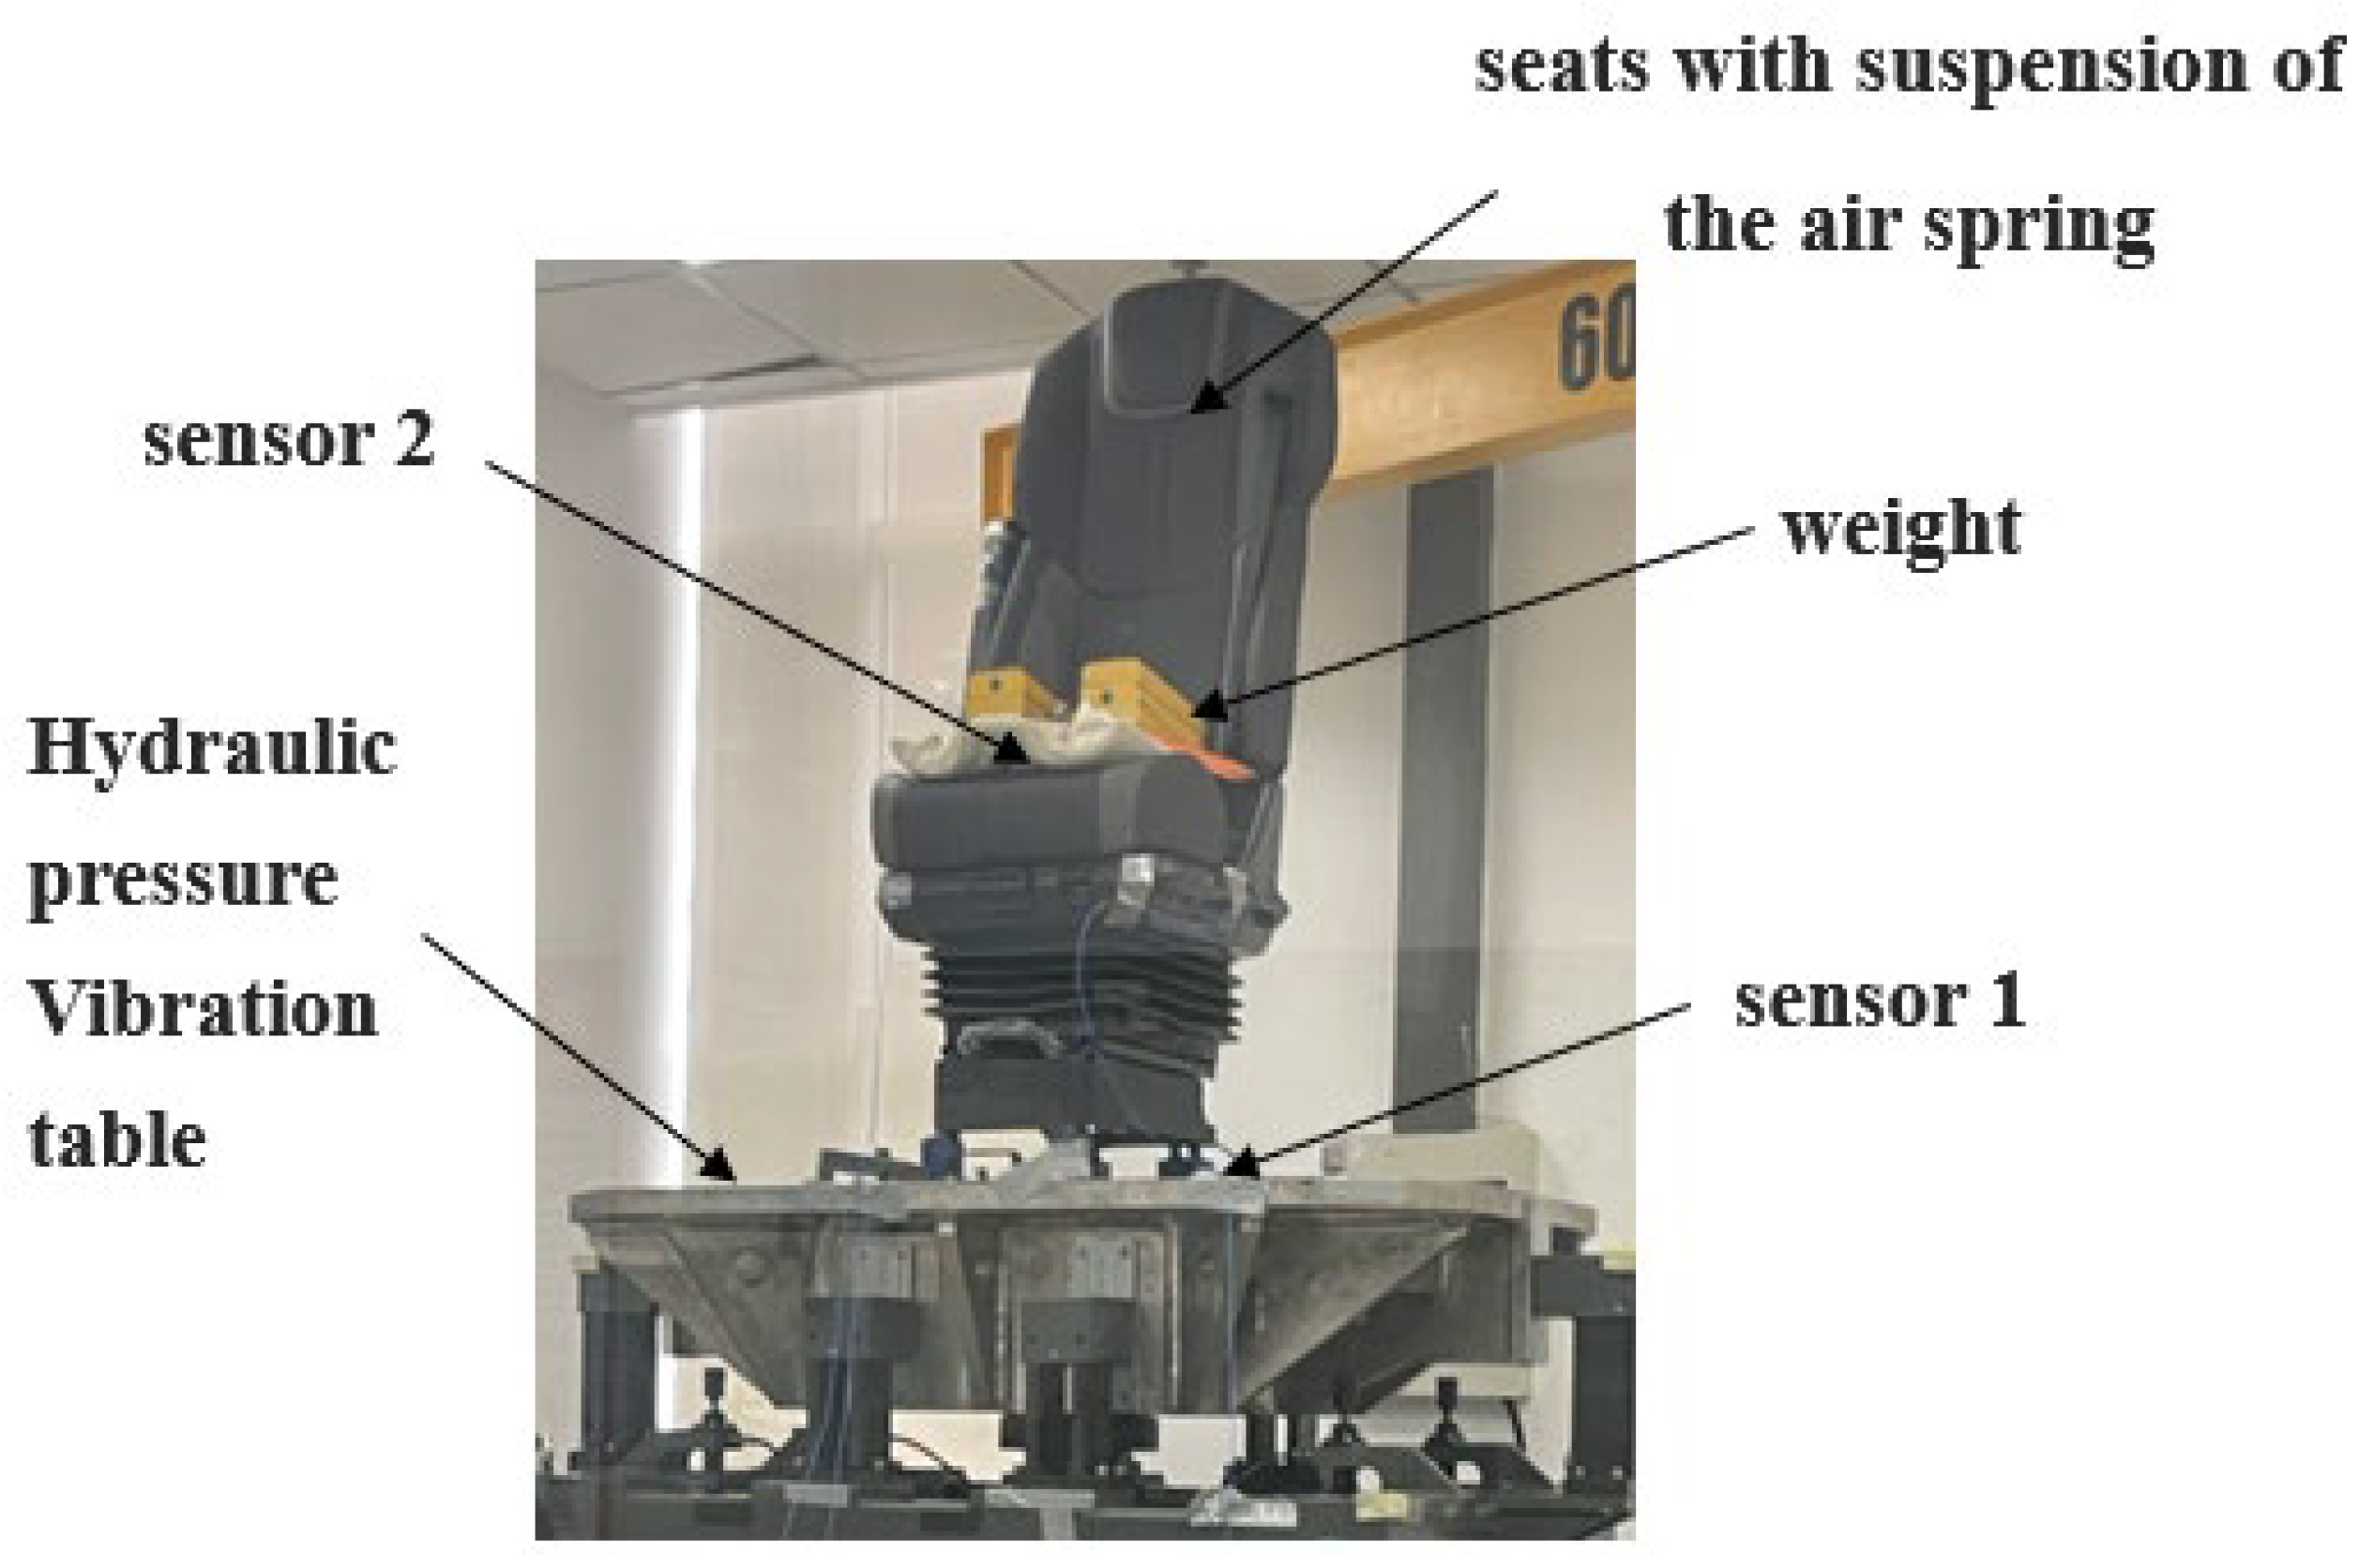
4.2. Experimental Validation of the Dynamic Model
5. Multi-Objective Optimization of Seat Dynamic Comfort Parameters
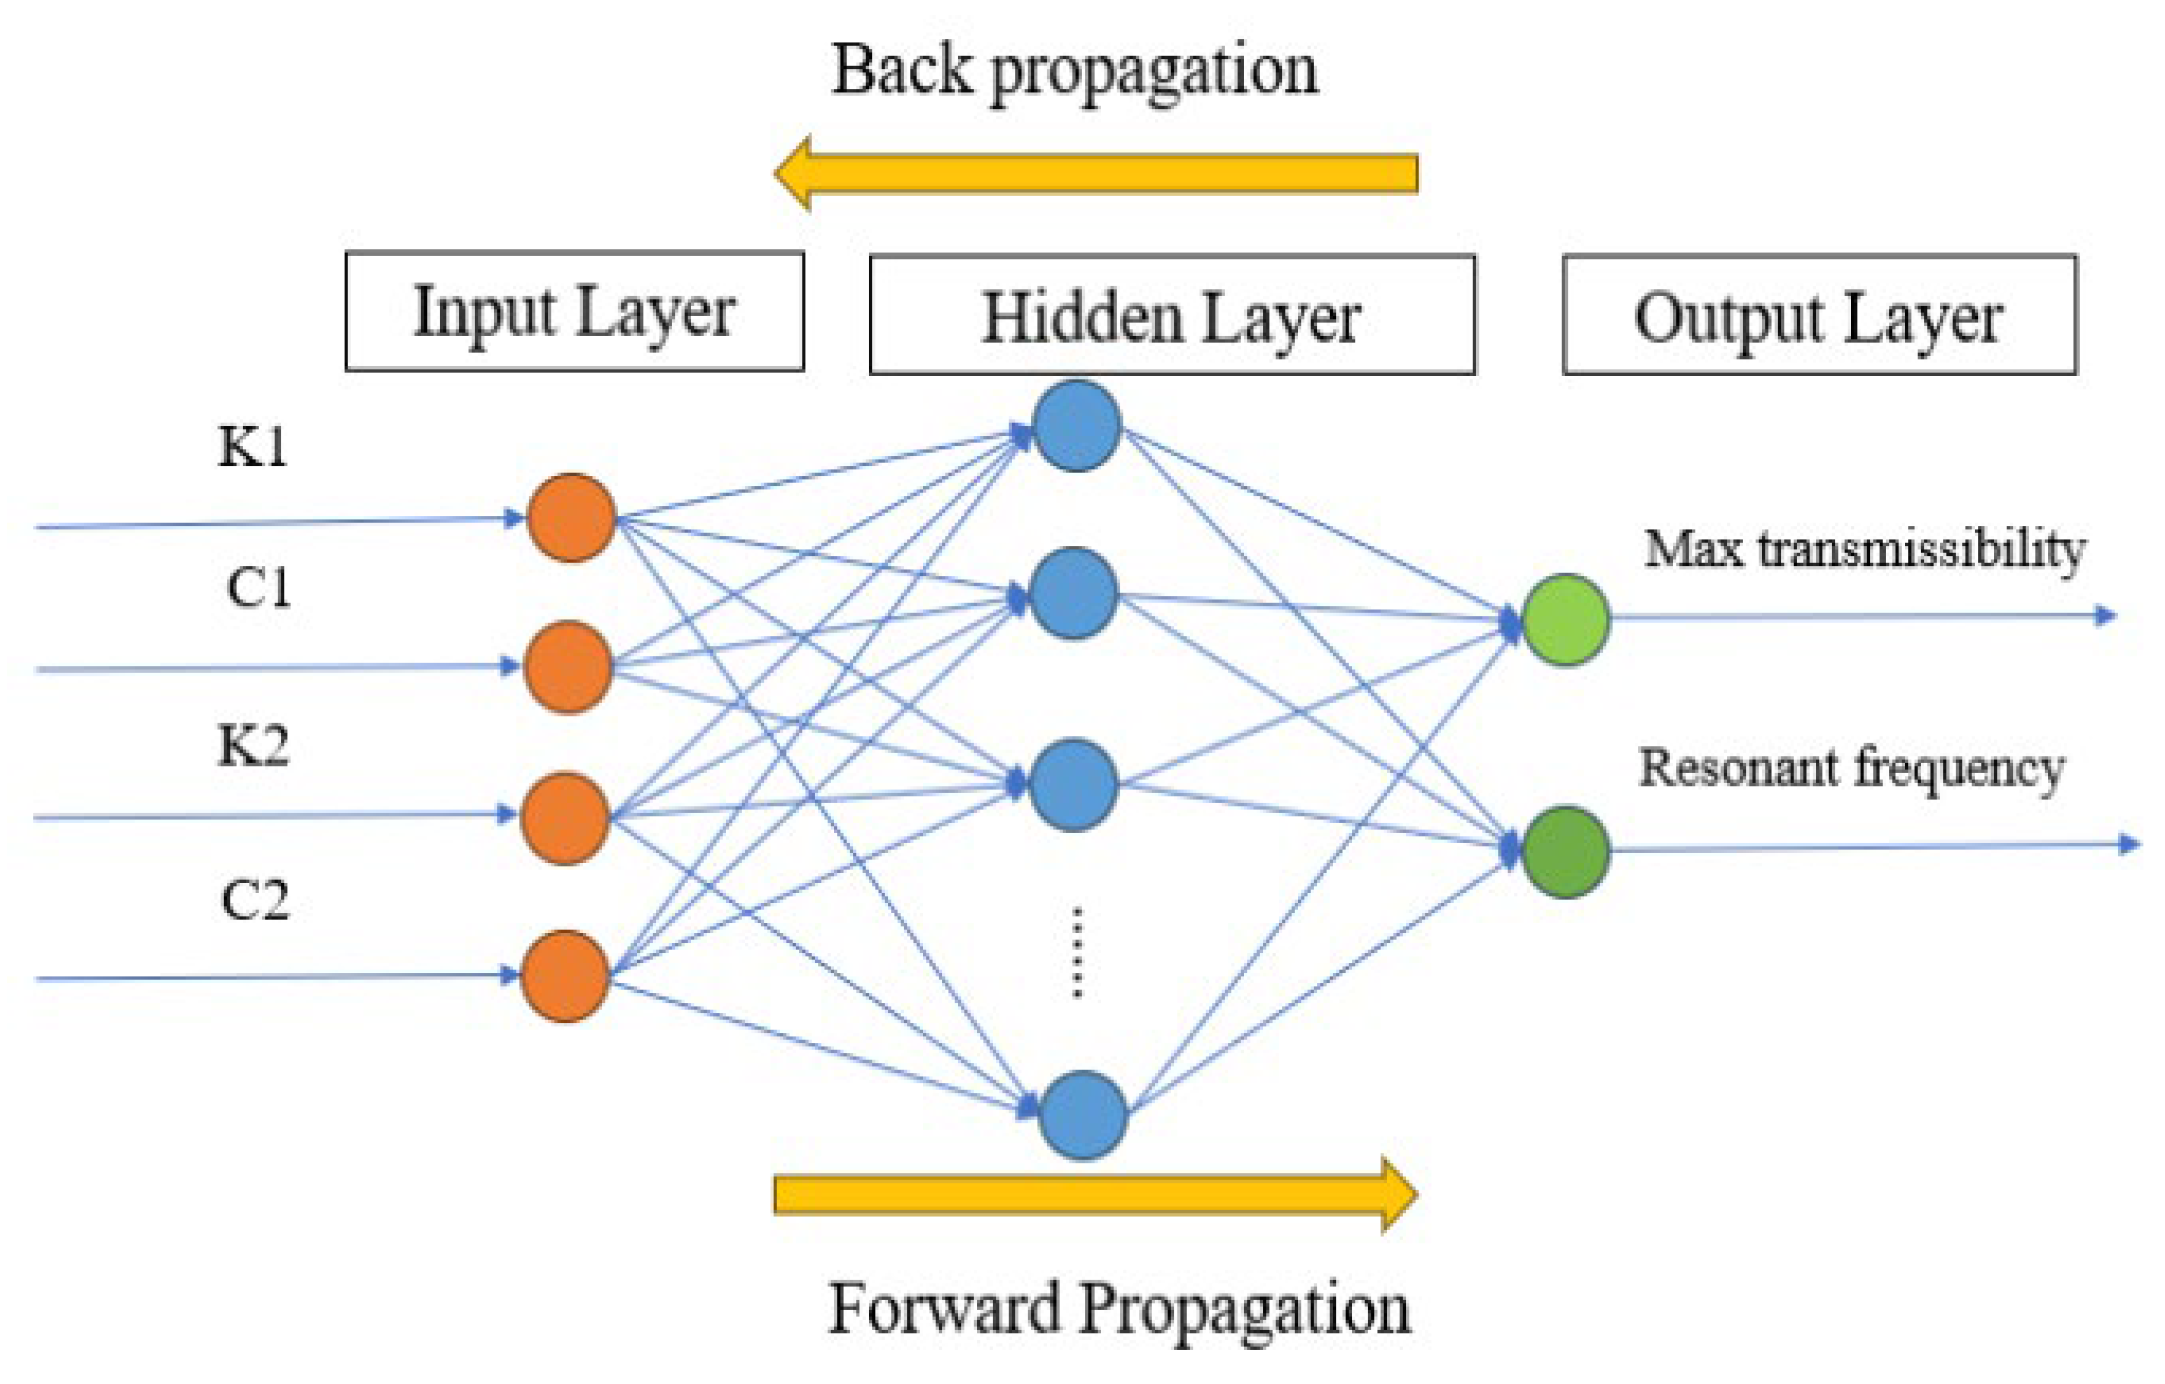
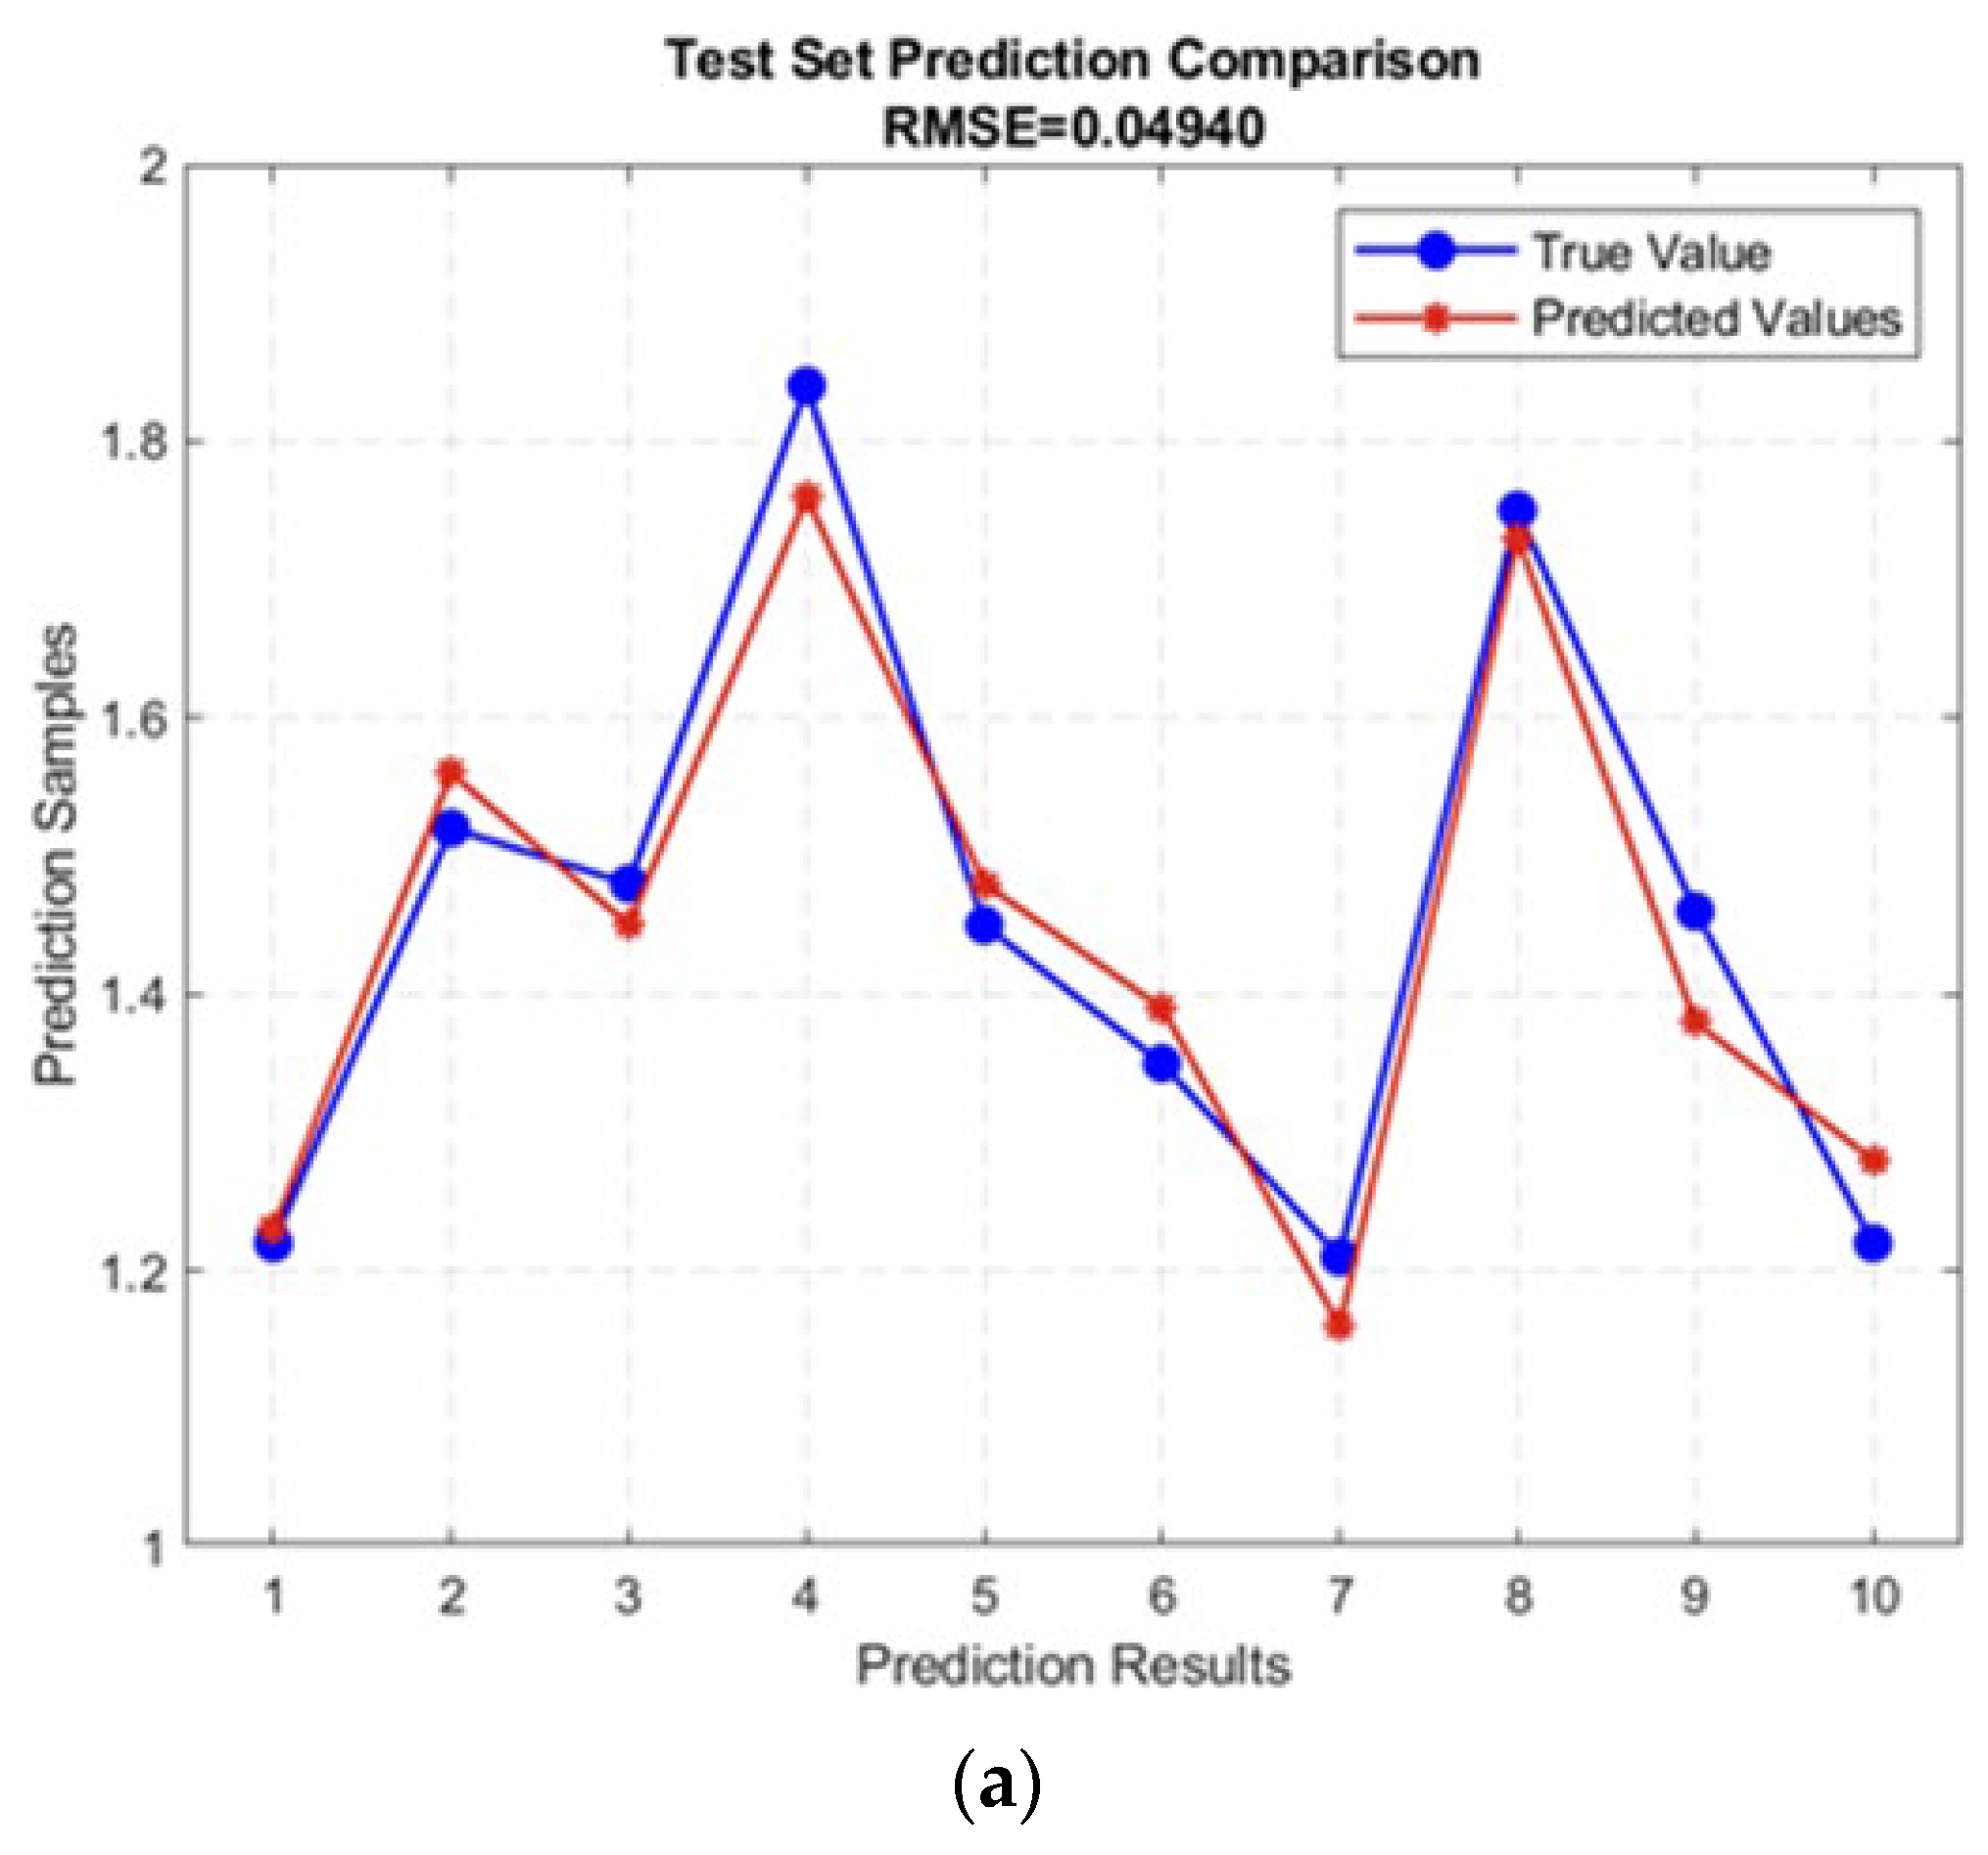
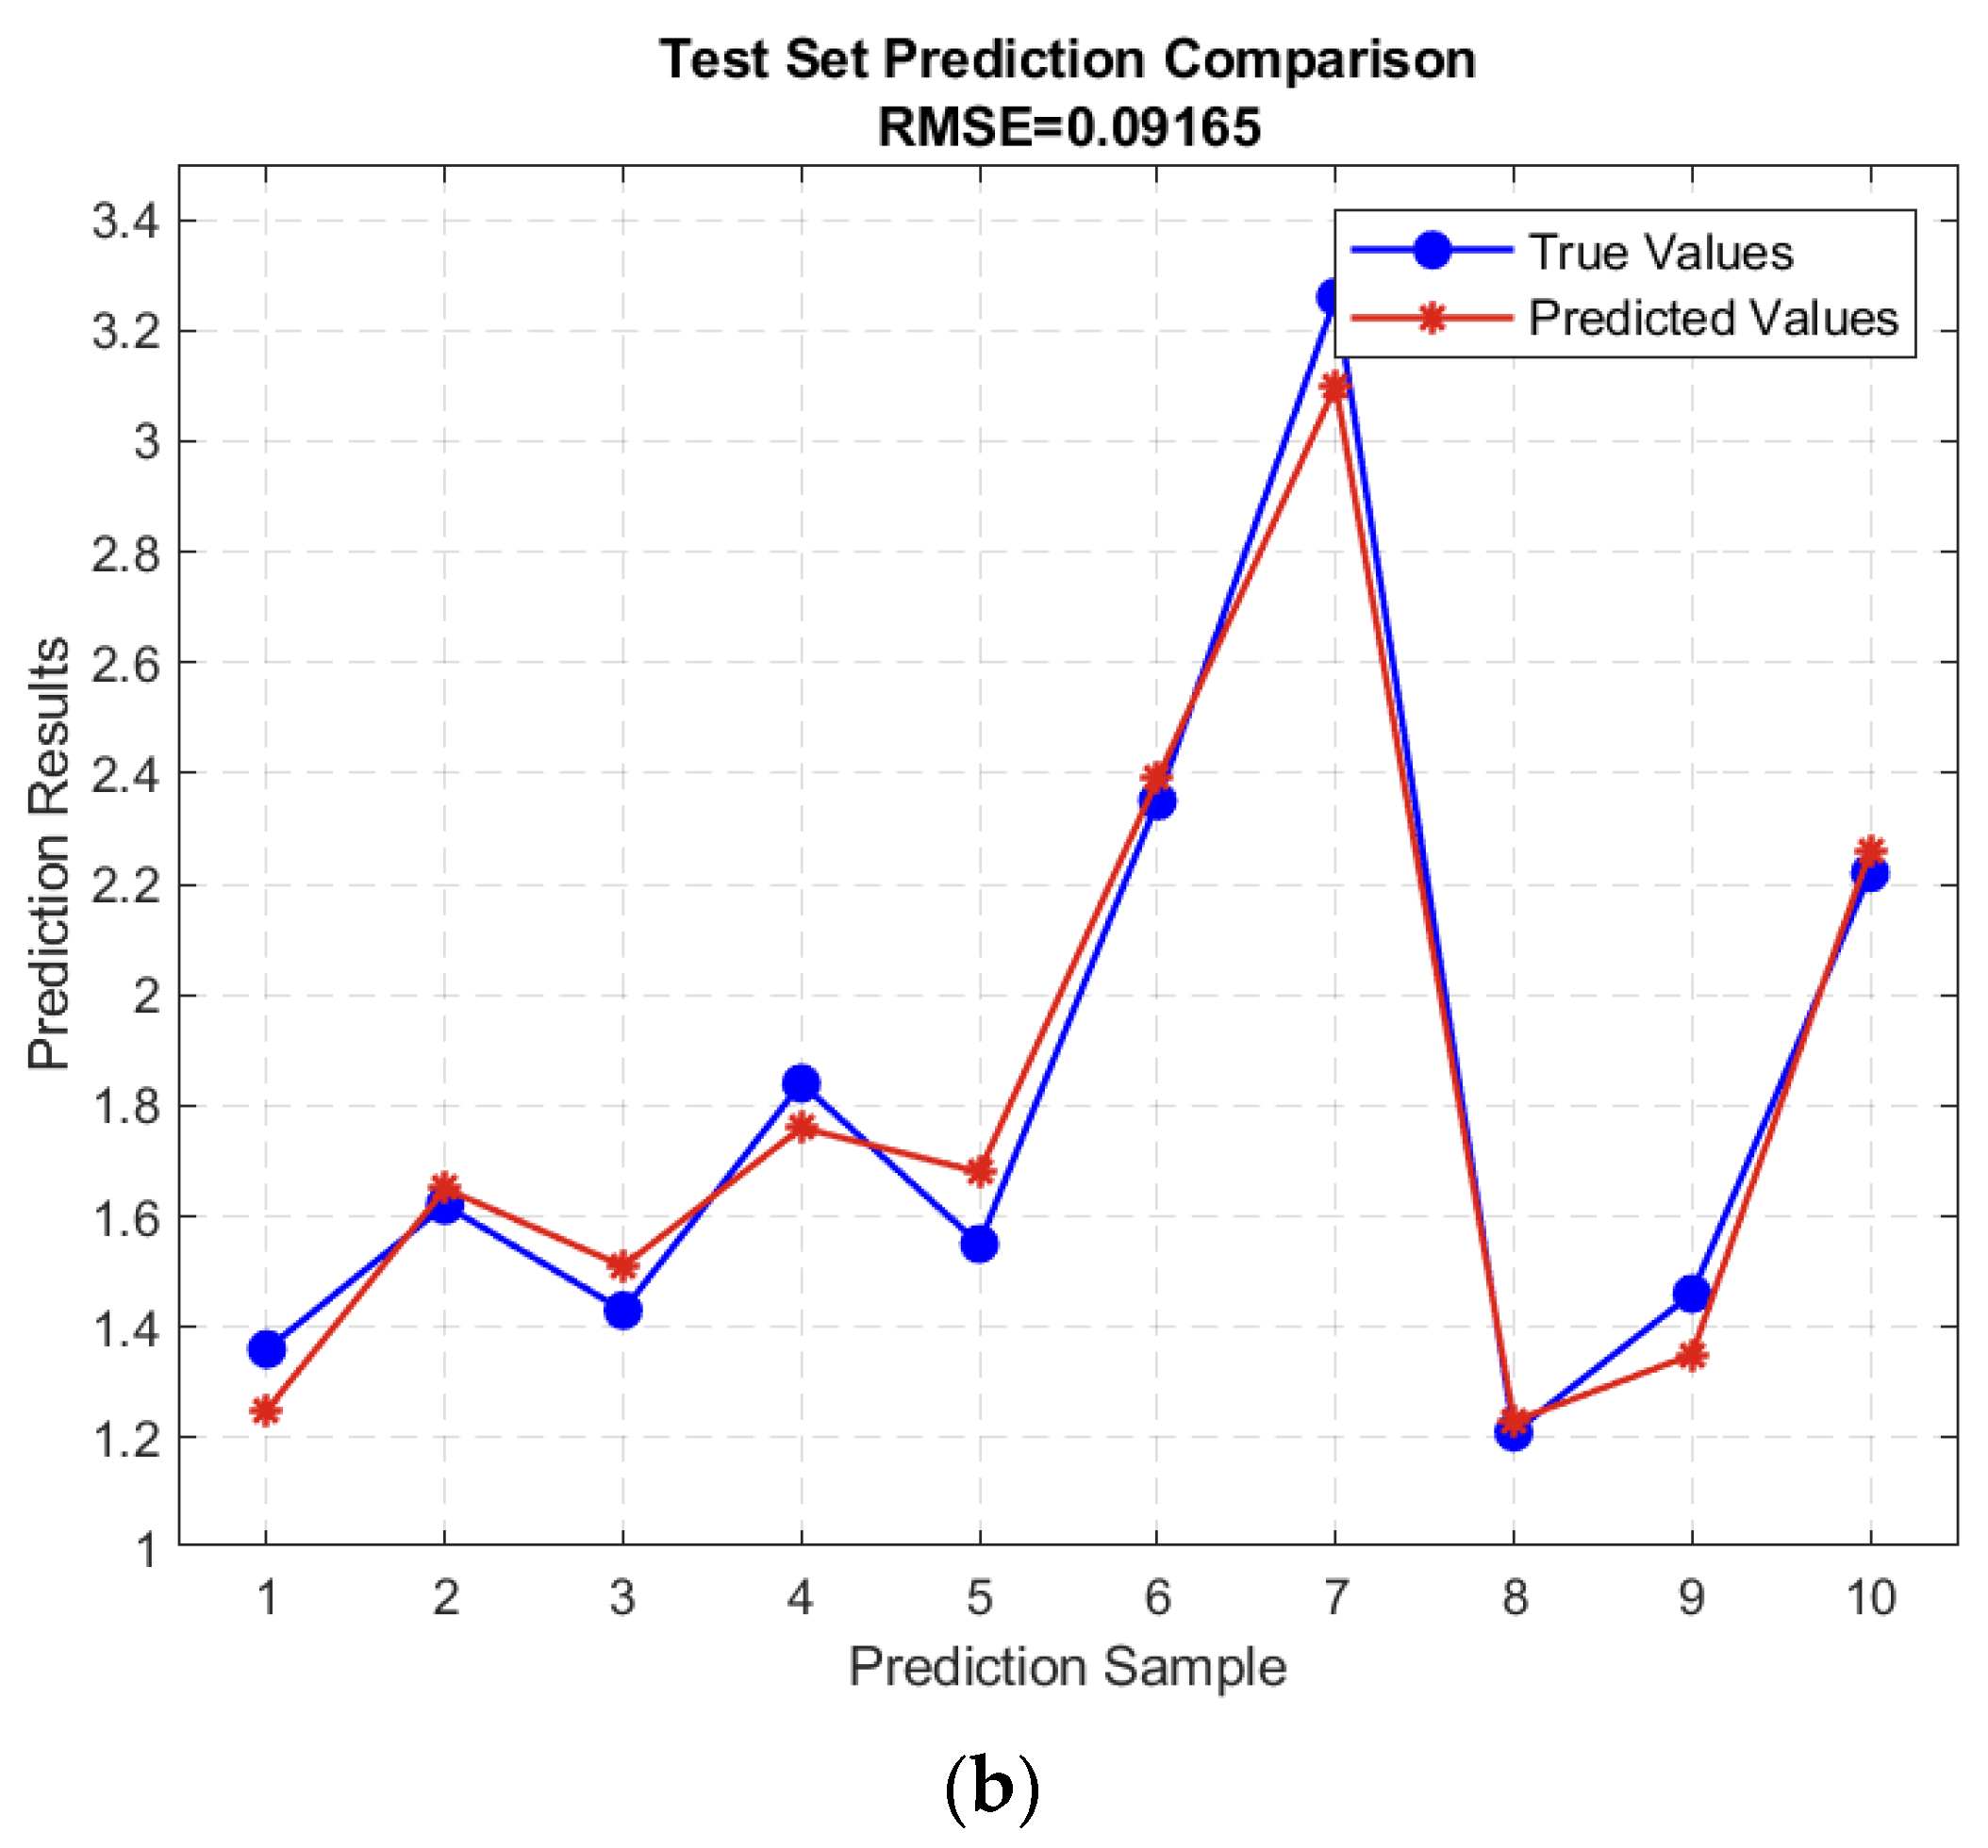
5.1. Construction of GA-BP Neural Network Model
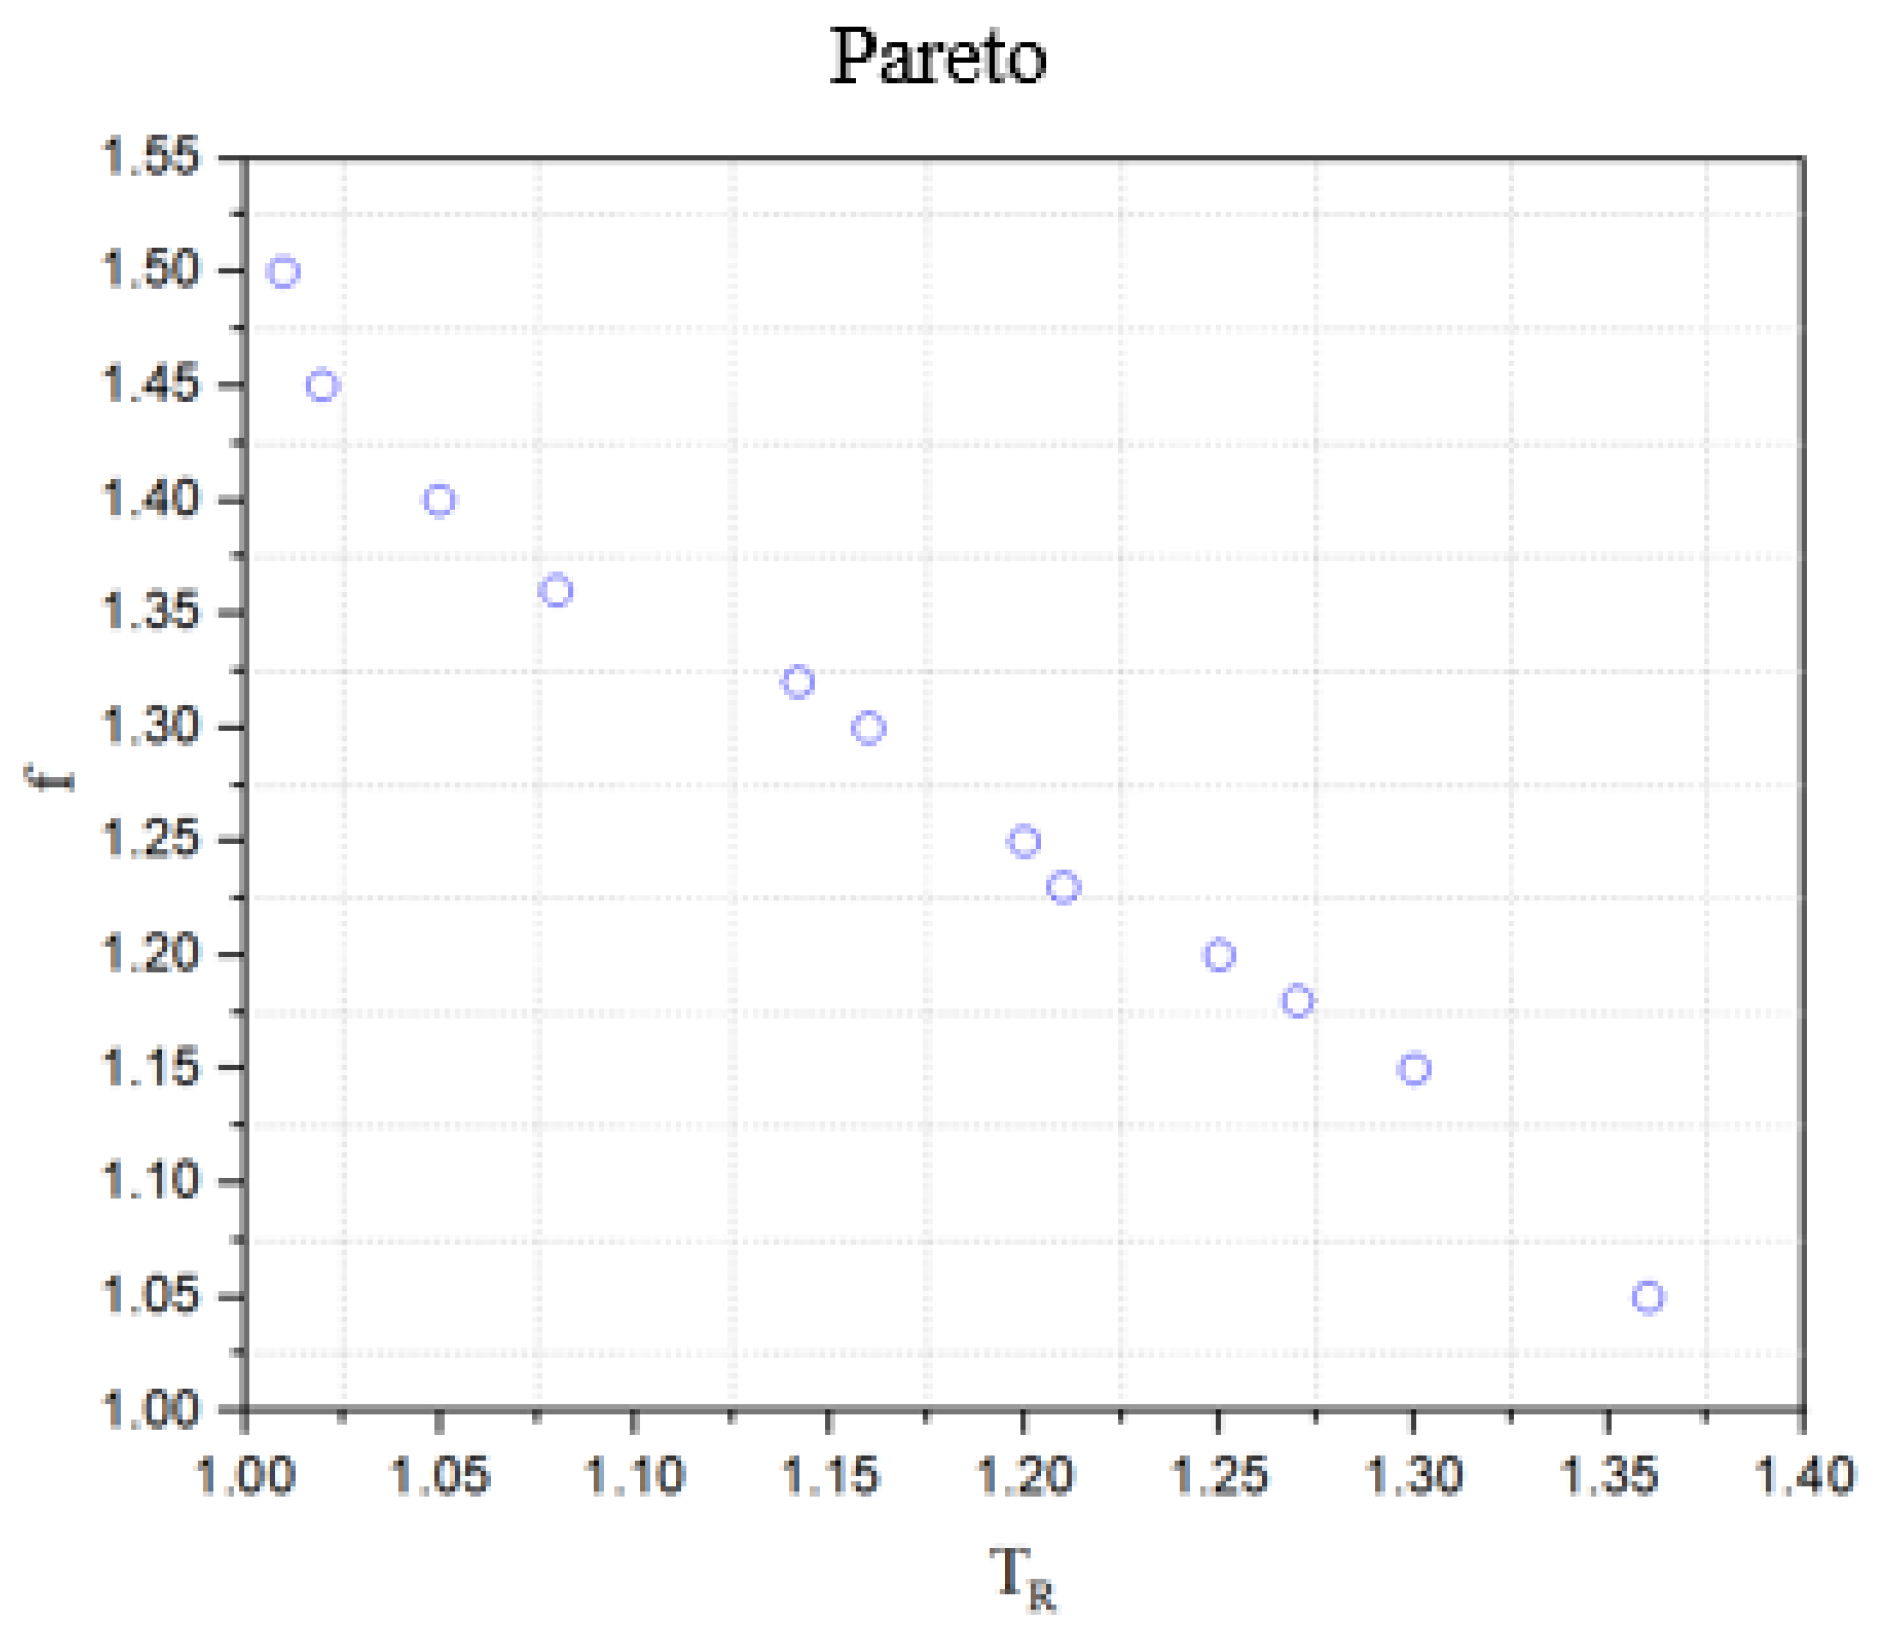
5.2. Multi-Objective Optimization Using the NSGA-II Algorithm
6. Conclusions
- (1)
- A mathematical model and vibrational differential equations for the scissor-type seat suspension were established, and expressions for the equivalent damping coefficient and frictional damping coefficient under actual working conditions were derived.
- (2)
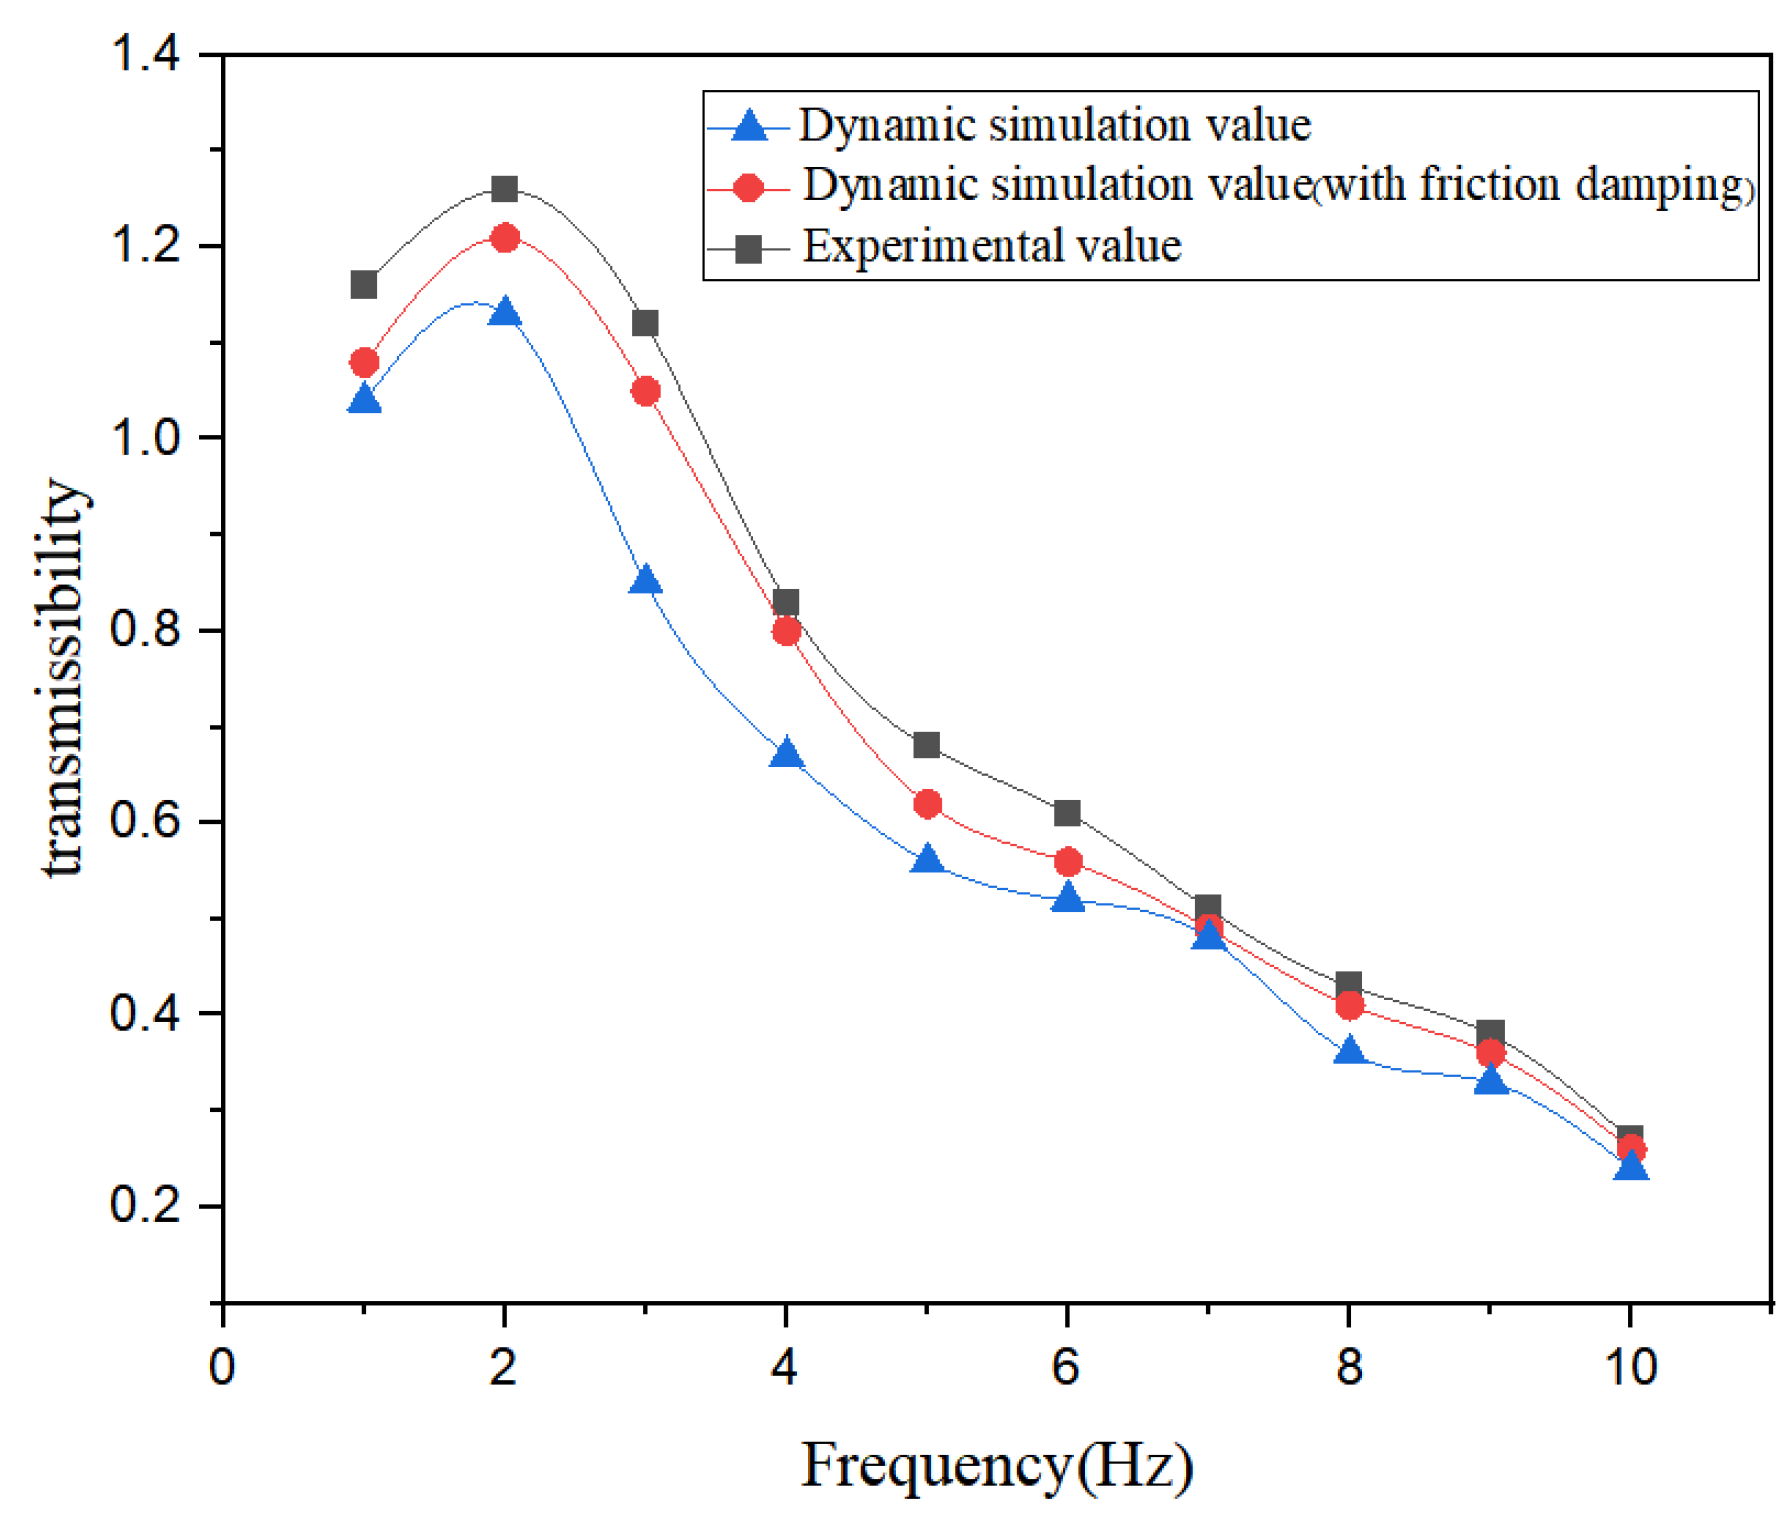
- Through dynamic simulations and experimental studies of a commercial vehicle air-spring seat system, this work investigates the influence of seat parameters on transmissibility characteristics and validates the accuracy of the developed dynamic model. The results demonstrate that the proposed model effectively captures the system’s vibration response, providing a reliable foundation for further optimization of seat suspension performance.
- (3)
- Seat parameters were optimized using the NSGA-II algorithm combined with the GA-BP neural network, resulting in significant improvements in dynamic comfort metrics. Compared to the pre-optimized configuration, the maximum transmissibility was reduced by 7.1% and the resonance frequency decreased by 8.2%.
Author Contributions
Funding
Institutional Review Board Statement
Informed Consent Statement
Data Availability Statement
Acknowledgments
Conflicts of Interest
References
- Lee, S.J. Development and analysis of an air spring model. Int. J. Automot. Technol. 2010, 106, 471–479. [Google Scholar] [CrossRef]
- Holtz, M.W.; Van Niekerk, J.L. Modelling and design of a novel air-spring for a suspension seat. J. Sound Vibration 2010, 329, 4354–4366. [Google Scholar] [CrossRef]
- Mo, Z.; Shu, G.; Lai, B.; Yang, T.Y.; Ventura, C.E. Experiment and analysis of air spring vertical seismic isolation device. Structures 2024, 66, 106869. [Google Scholar] [CrossRef]
- Ivan Cvok, I.; Hrgetić, M.; Hoić, M.; Deur, J.; Ivanovic, V. Design of a linear motor-based shaker rig for testing driver’s perceived ride comfort. Mechatronics 2021, 75, 102521. [Google Scholar] [CrossRef]
- Pradhan, P.; Singh, D. Review on air suspension system. Mater. Today Proc. 2023, 81, 486–488. [Google Scholar] [CrossRef]
- Wos, P.; Dziopa, Z. Study of the Vibration Isolation Properties of a Pneumatic Suspension System for the Seat of a Working Machine with Adjustable Stiffness. Appl. Sci. 2024, 14, 6318. [Google Scholar] [CrossRef]
- Maciejewski, I.; Meyer, L.; Krzyzynski, T. Modelling and multi-criteria optimisation of passive seat suspension vibro-isolating properties. J. Sound Vibration 2019, 324, 520–538. [Google Scholar] [CrossRef]
- Wei, J.; Liu, N. A Review of Research on Dynamic Comfort of Automotive Seat Systems. Intern. Combust. Engine Parts 2020, 227–228. [Google Scholar] [CrossRef]
- Jereczek, B.; Maciejewski, I.; Królikowski, T. Modeling and simulation of the horizontal seat suspension system under random vibration. Procedia Comput. Sci. 2022, 207, 858–866. [Google Scholar] [CrossRef]
- Nagarkar, M.P.; Patil, G.J.V.; Patil, R.N.Z. Optimization of nonlinear quarter car suspension–seat–driver model. J. Adv. Res. 2016, 7, 991–1007. [Google Scholar] [CrossRef]
- Eskandary, P.K.; Khajepour, A.; Wong, A.; Ansari, M. Analysis and optimization of air suspension system with independent height and stiffness tuning. Int. J. Automot. Technol. 2016, 17, 807–816. [Google Scholar] [CrossRef]
- Soliman, A.M.A.; Kaldas, M.S. Semi-active suspension systems from research to mass-market-A review. J. Low Freq. Noise Vib. Act. Control 2021, 40, 1005–1023. [Google Scholar] [CrossRef]
- Li, M.; Li, B.; Chen, G.; Li, H.; Ding, B.; Shi, C.; Yu, F. Research on the design and evaluation method of vehicle seat comfort for driving experience. Int. J. Ind. Ergon. 2024, 100, 103567. [Google Scholar] [CrossRef]
- ISO/IEC 17025; General Requirements for the Competence of Testing and Calibration Laboratories. International Organization for Standardization (ISO): Geneva, Switzerland, 2017.
- Gundoǎdu, O. Optimal seat and suspension design for a quarter car with driver model using genetic algorithms. Int. J. Ind. Ergon. 2007, 37, 327–332. [Google Scholar] [CrossRef]
- Abuabiah, M.; Dabbas, Y.; Herzallah, L.; Alsurakji, I.H.; Plapper, P. Air Spring Pressure Control in Vibration Isolation System for Vehicle’s Seats. In Proceedings of the 2022 10th International Conference on Control, Mechatronics and Automation (ICCMA), Luxembourg, 9 November 2022; pp. 100–107. [Google Scholar]
- Hung, T.M. Optimal selection for an air suspension system on buses through a unique high level parameter in genetic algorithms. Heliyon 2022, 8, e09059. [Google Scholar] [CrossRef] [PubMed]
- Abbas, W.; Abouelatta, O.; El-Azab, M.; El-Saidy, M. Optimal seat suspension design using genetic algorithms. J. Mech. Eng. Autom. 2011, 1, 44–52. [Google Scholar]
- Xu, M.; Ma, C.; Han, X. Influence of different optimization an algorithm on prediction accuracy of photovoltaic output power based on BP neural network. In Proceedings of the 2022 41st Chinese Control Conference (CCC), Hefei, China, 25 July 2022; pp. 7275–7278. [Google Scholar]
- Zhang, S.; Wei, W.; Chen, X.; Xu, L.; Cao, Y. Vibration performance analysis and multi-objective optimization design of a tractor scissor seat suspension system. Agriculture 2022, 13, 48. [Google Scholar] [CrossRef]
- Shi, G.; Peng, W.; Liu, W.; He, S.; Zhao, S.; Ai, Z.; Yu, D.; Chen, Y.; Fang, Y.; Chang, Y. Optimization of Rim Welding Process Parameters Based on NSGA-II Algorithm and BP Neural Network. J. Guangxi Univ. Sci. Technol. 2025, 1–15. Available online: http://kns.cnki.net/kcms/detail/45.1395.t.20250223.1910.004.html (accessed on 19 May 2025).


| Frequency (Hz) | Experimental Value | Original Model | Error | With Friction Damping | Error |
|---|---|---|---|---|---|
| 1 | 1.16 | 1.04 | 12.9% | 1.08 | 6.8% |
| 2 | 1.26 | 1.13 | 11.6% | 1.21 | 4.8% |
| 3 | 1.12 | 0.85 | 24.1% | 1.05 | 6.2% |
| 4 | 0.83 | 0.67 | 19.2% | 0.80 | 3.6% |
| 5 | 0.68 | 0.56 | 17.6% | 0.62 | 8.8% |
| 6 | 0.61 | 0.52 | 14.7% | 0.56 | 8.1% |
| 7 | 0.51 | 0.48 | 5.9% | 0.49 | 3.9% |
| 8 | 0.43 | 0.36 | 16.3% | 0.41 | 4.6% |
| 9 | 0.38 | 0.33 | 13.1% | 0.36 | 5.2% |
| 10 | 0.27 | 0.24 | 11.1% | 0.26 | 3.7% |
| Max Transmissibility | Resonant Frequency | ||||||
|---|---|---|---|---|---|---|---|
| Damping Level | Seat Height | Simulation Value | Experimental Value | Error | Simulation Value | Experimental Value | Error |
| Min | Min | 1.187 | 1.156 | 1.11% | 1.616 | 1.831 | 11.74% |
| intermediate | 1.221 | 1.162 | 5.07% | 1.822 | 2.051 | 11.20% | |
| Max | 1.366 | 1.426 | 4.21% | 2.155 | 2.344 | 9.10% | |
| Medium | Min | 1.312 | 1.182 | 10.99% | 1.642 | 1.831 | 10.32% |
| intermediate | 1.383 | 1.227 | 12.71% | 1.822 | 2.051 | 11.16% | |
| Max | 1.332 | 1.208 | 11.30% | 2.234 | 2.271 | 1.62% | |
| Max | Min | 1.263 | 1.296 | 2.60% | 3.627 | 3.589 | 1.05% |
| intermediate | 1.273 | 1.254 | 11.40% | 3.295 | 3.589 | 8.57% | |
| Max | 1.484 | 1.324 | 12.08% | 3.592 | 3.662 | 1.91% | |
| GA Parameters | Value |
|---|---|
| Hidden layer neurons | 5 |
| BP training epochs | 1000 |
| Learning rate | 0.01 |
| GA population size | 50 |
| GA generations | 100 |
| Crossover probability | 0.8 |
| Mutation probability | 0.1 |
| Number | Max Transmissibility | Resonant Frequency | ||||
|---|---|---|---|---|---|---|
| R2 | MAE | RMSE | R2 | MAE | RMSE | |
| 1 | 0.933 | 0.213 | 0.246 | 0.955 | 0.162 | 0.287 |
| 2 | 0.909 | 0.268 | 0.220 | 0.986 | 0.196 | 0.344 |
| 3 | 0.932 | 0.248 | 0.193 | 0.924 | 0.238 | 0.270 |
| 4 | 0.962 | 0.157 | 0.215 | 0.935 | 0.305 | 0.286 |
| 5 | 0.976 | 0.119 | 0.205 | 0.916 | 0.219 | 0.272 |
| 6 | 0.935 | 0.180 | 0.286 | 0.882 | 0.224 | 0.271 |
| 7 | 0.897 | 0.334 | 0.229 | 0.916 | 0.196 | 0.321 |
| 8 | 0.953 | 0.241 | 0.194 | 0.876 | 0.215 | 0.276 |
| 9 | 0.787 | 0.442 | 0.218 | 0.945 | 0.235 | 0.285 |
| 10 | 0.871 | 0.313 | 0.184 | 0.898 | 0.254 | 0.272 |
| Average value | 0.916 | 0.252 | 0.193 | 0.923 | 0.224 | 0.288 |
| Seat Parameter | Value |
|---|---|
| K1 | 45.74 N/mm |
| C1 | 4.83 N·s/mm |
| K2 | 36.73 N/mm |
| C2 | 1.16 N·s/mm |
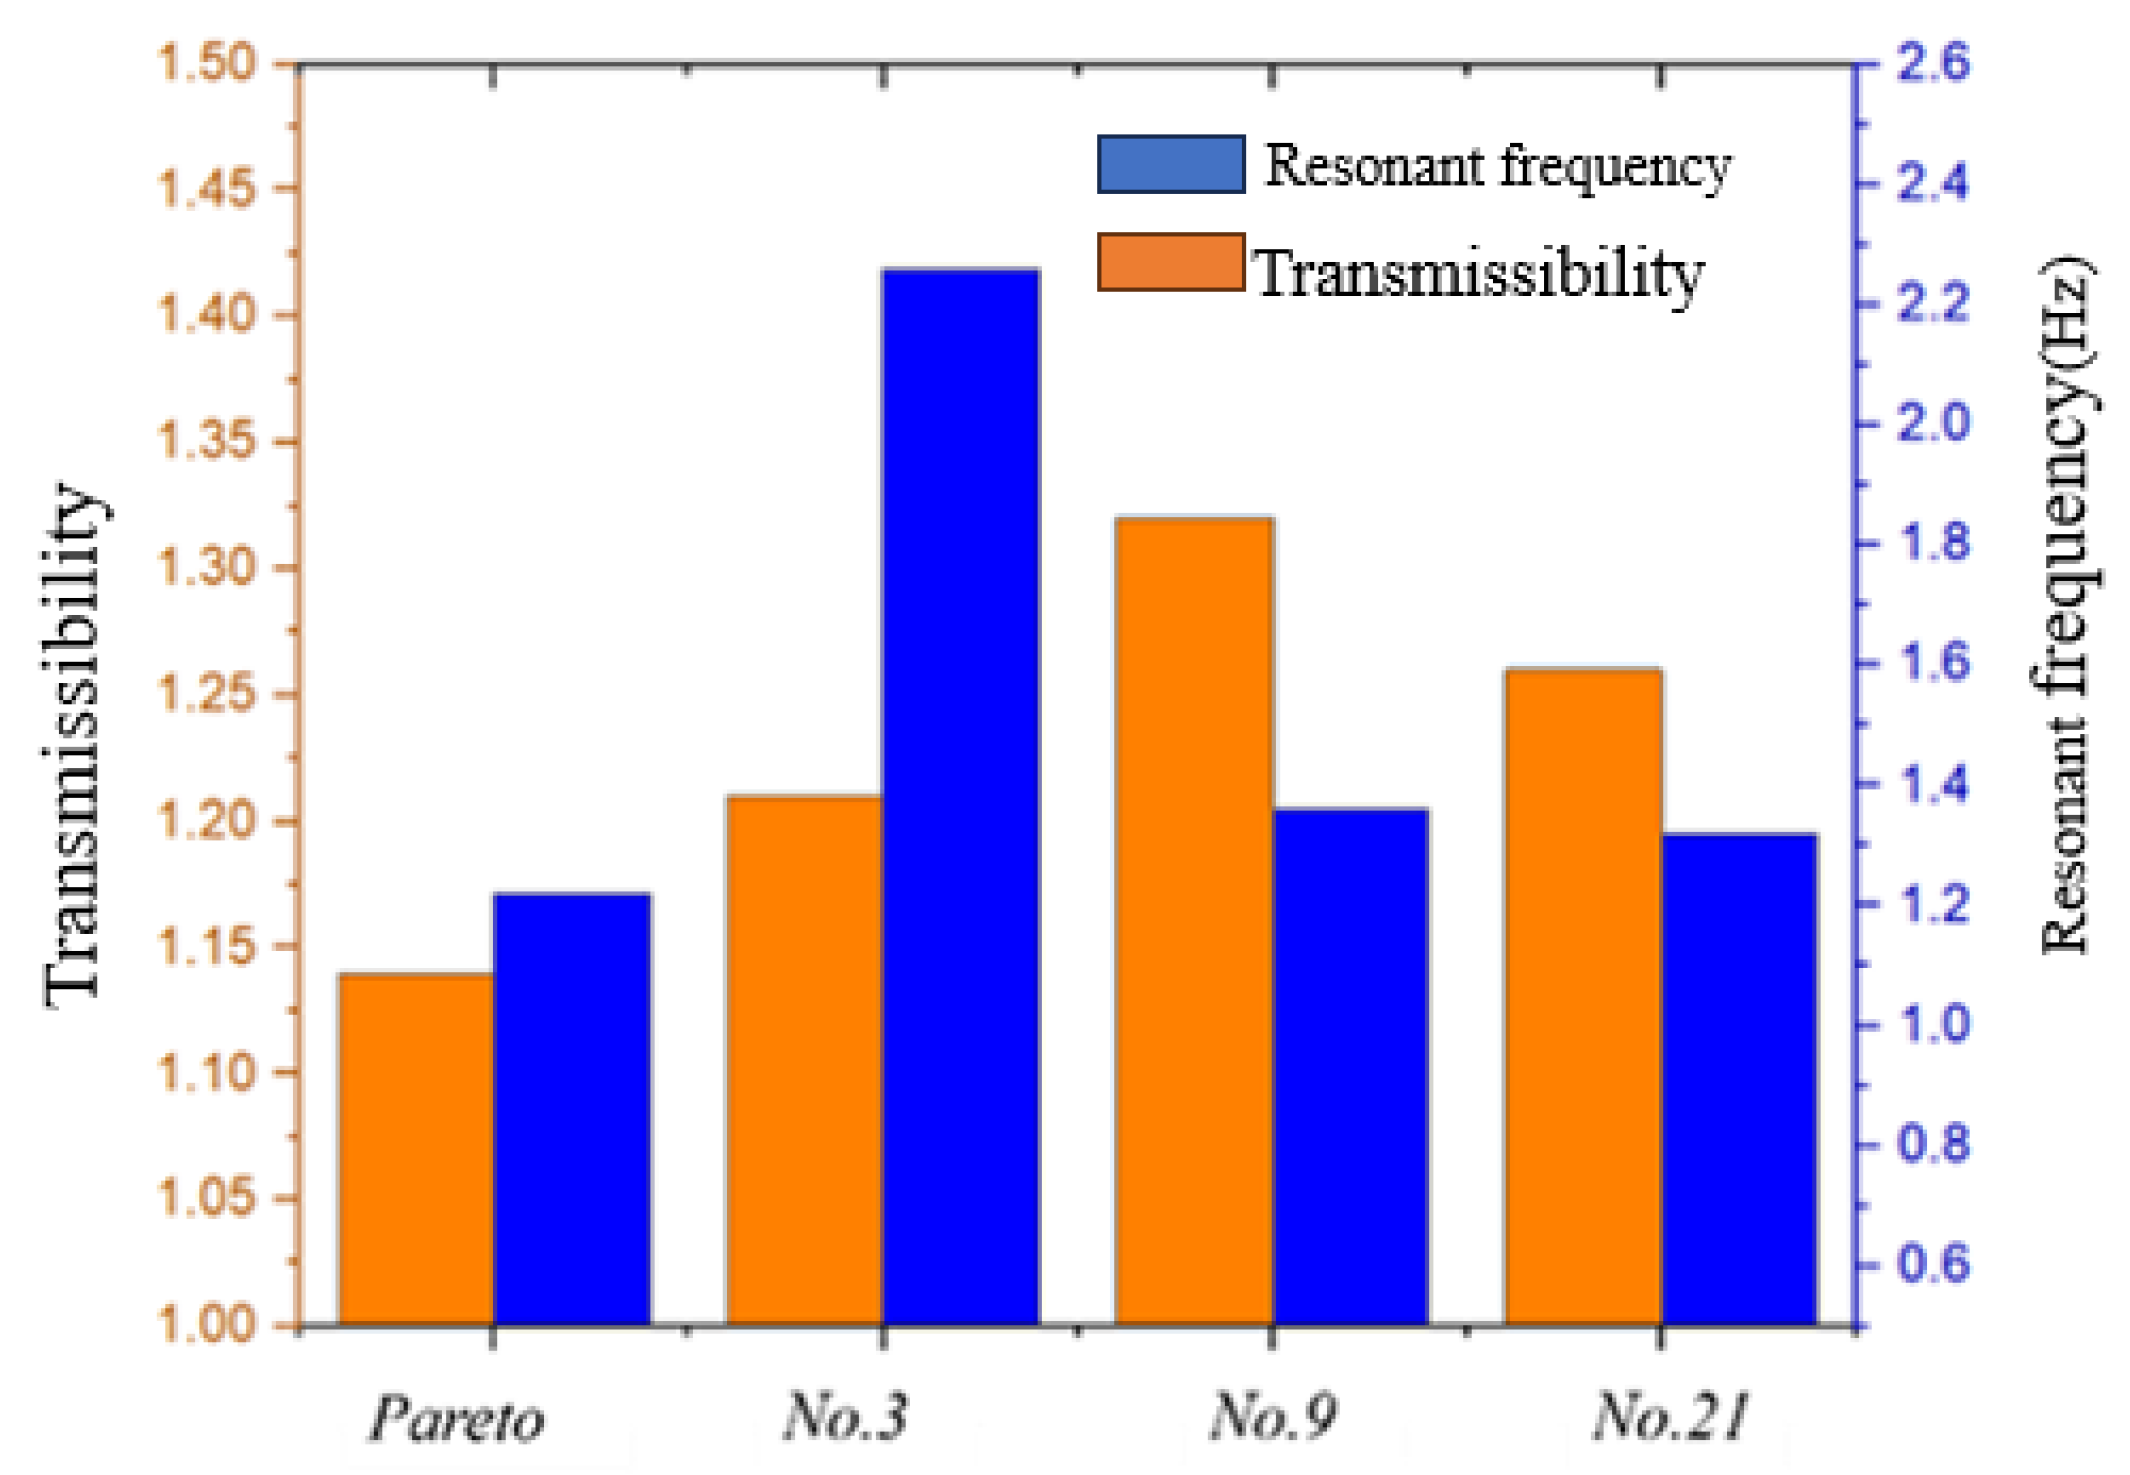
| Pareto | No. 3 | No. 9 | No. 21 | Max Reduction Rate | |
|---|---|---|---|---|---|
| Max transmissibility | 1.14 | 1.20 | 1.32 | 1.25 | 13.6% |
| Resonant frequency | 1.32 | 1.43 | 1.21 | 1.20 | 7.6% |
Disclaimer/Publisher’s Note: The statements, opinions and data contained in all publications are solely those of the individual author(s) and contributor(s) and not of MDPI and/or the editor(s). MDPI and/or the editor(s) disclaim responsibility for any injury to people or property resulting from any ideas, methods, instructions or products referred to in the content. |
© 2025 by the authors. Licensee MDPI, Basel, Switzerland. This article is an open access article distributed under the terms and conditions of the Creative Commons Attribution (CC BY) license (https://creativecommons.org/licenses/by/4.0/).
Share and Cite
Hu, L.; Zhou, C.; Wan, Y.; Wang, H. Research on the Vibration Characteristics of Air Spring Suspension Seats Considering Friction Damping. Appl. Sci. 2025, 15, 5817. https://doi.org/10.3390/app15115817
Hu L, Zhou C, Wan Y, Wang H. Research on the Vibration Characteristics of Air Spring Suspension Seats Considering Friction Damping. Applied Sciences. 2025; 15(11):5817. https://doi.org/10.3390/app15115817
Chicago/Turabian StyleHu, Li, Changyin Zhou, Yeqing Wan, and Huawei Wang. 2025. "Research on the Vibration Characteristics of Air Spring Suspension Seats Considering Friction Damping" Applied Sciences 15, no. 11: 5817. https://doi.org/10.3390/app15115817
APA StyleHu, L., Zhou, C., Wan, Y., & Wang, H. (2025). Research on the Vibration Characteristics of Air Spring Suspension Seats Considering Friction Damping. Applied Sciences, 15(11), 5817. https://doi.org/10.3390/app15115817