3.1. Analysis of Previous Accidents and Incidents
This section provides the quantitative analysis of the accident/incident dataset of past seaplane occurrences on Canadian waters. It includes an assessment of the narratives (
Section 3.1.1), trend analysis (
Section 3.1.2), contingency analysis and three-way associations (
Section 3.1.3), and a summary of the results (
Section 3.1.4).
3.1.1. Narrative Analysis
The occurrence narratives were used to identify their root causes from the following categories: airborne, ground operations, take-off and landing, aircraft-related, non-aircraft-related, weather conditions, and miscellaneous. Within these categories, factors such as visibility, wind, loss of control, mechanical errors, human errors in making decisions or in operating the plane, the reasons for pilots making certain decisions (such as abrupt maneuvers), missing emergencies, etc., were considered. This particularly timely task revealed that loss of control and abnormal runway contact led to the majority (59.23%) of seaplane occurrences on the water (
Table 4).
3.1.2. Trend Analysis
The dataset of seaplane occurrences was analyzed around the following variables:
Year;
Landing gear;
Phase of flight;
Aircraft damage level;
Injuries and fatalities.
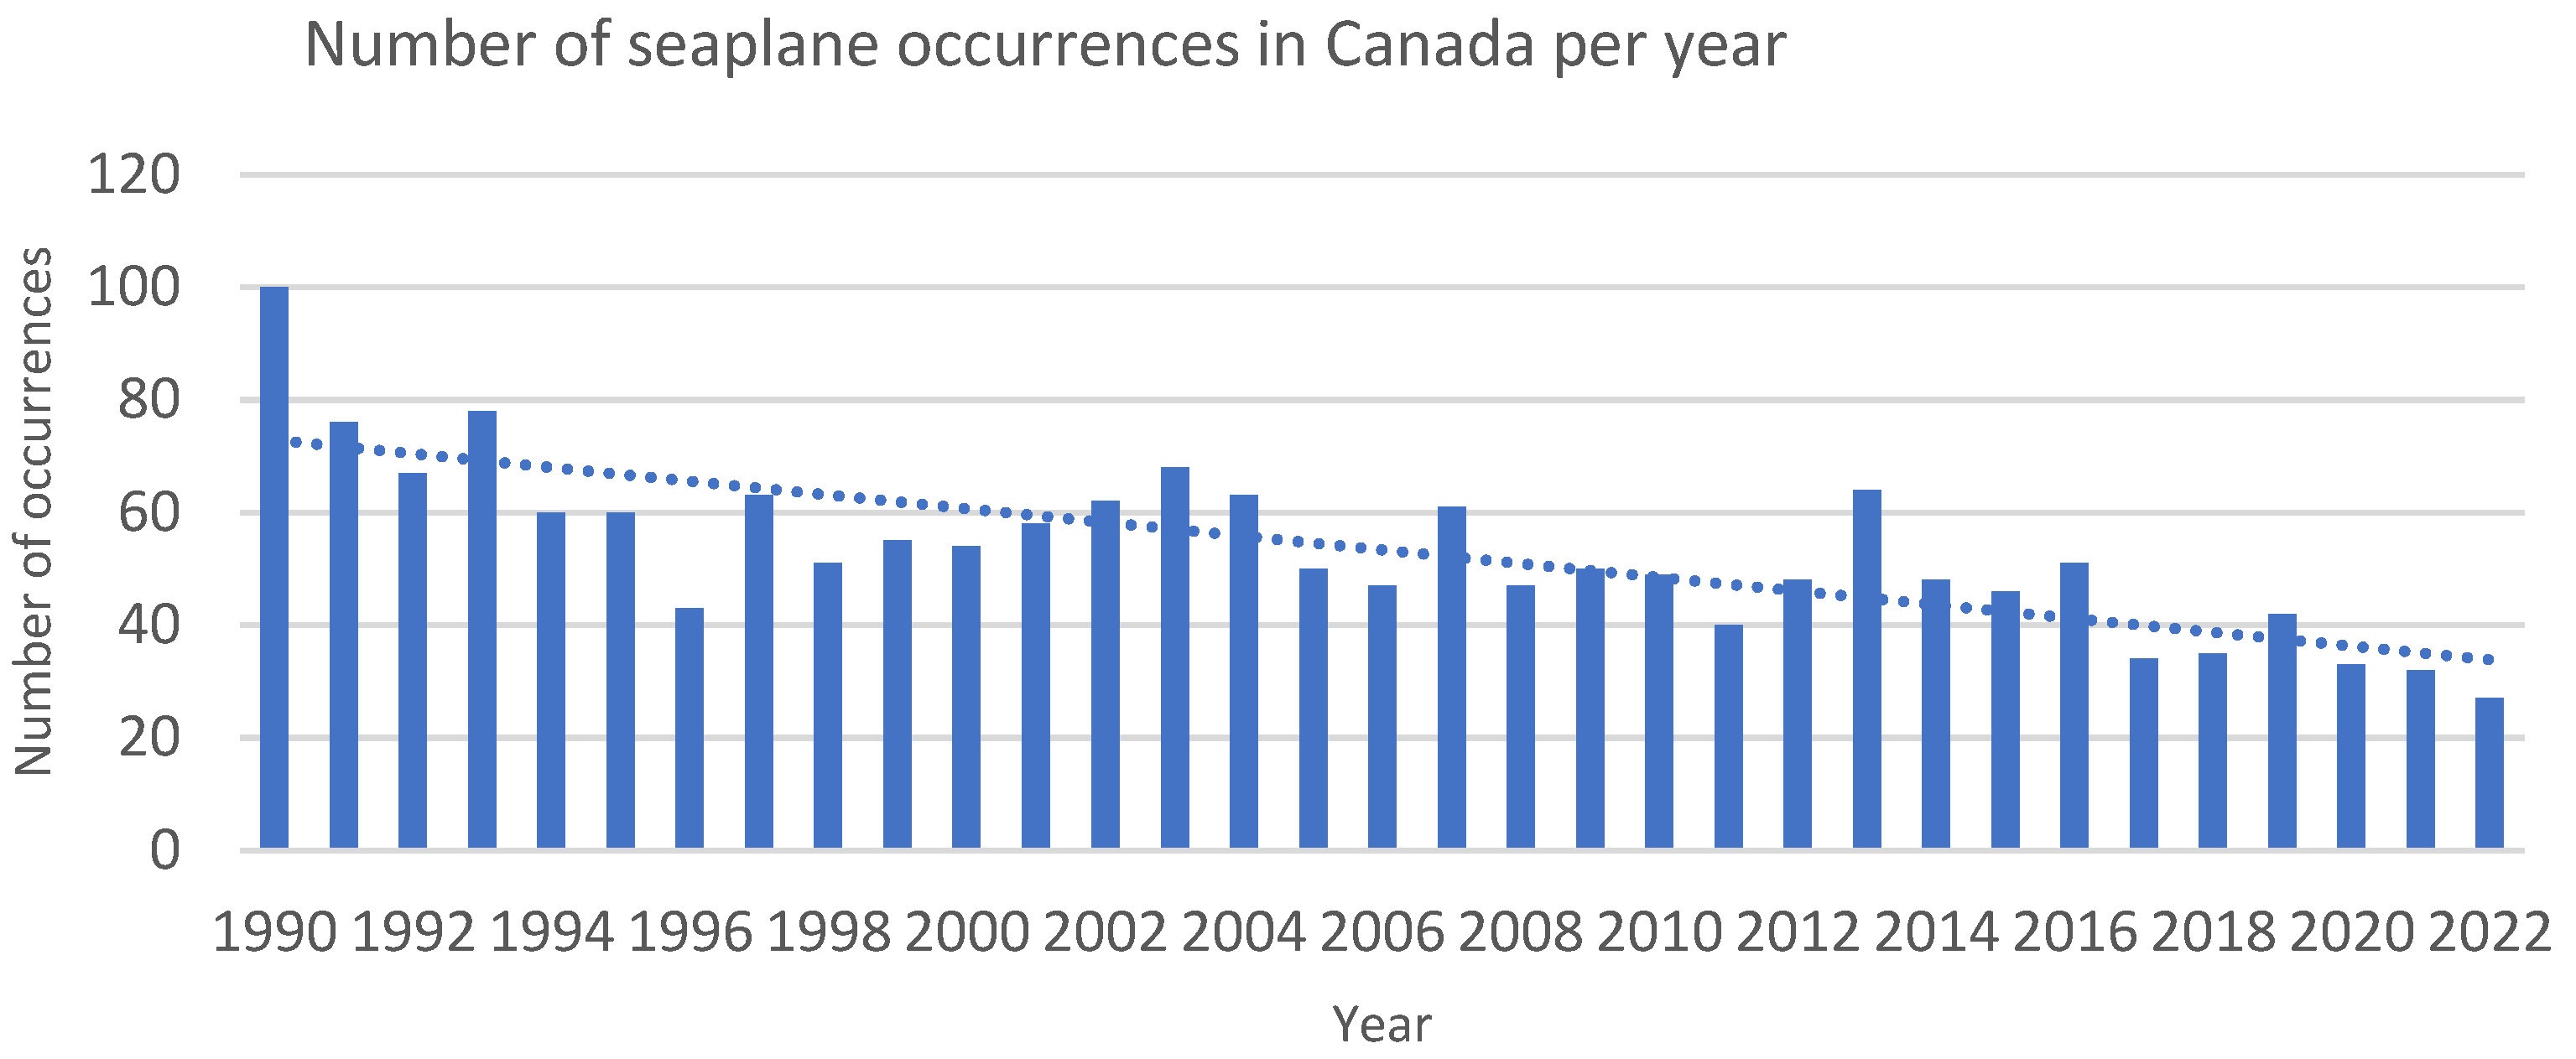
In Canada, the number of seaplane occurrences has gradually decreased over the years (
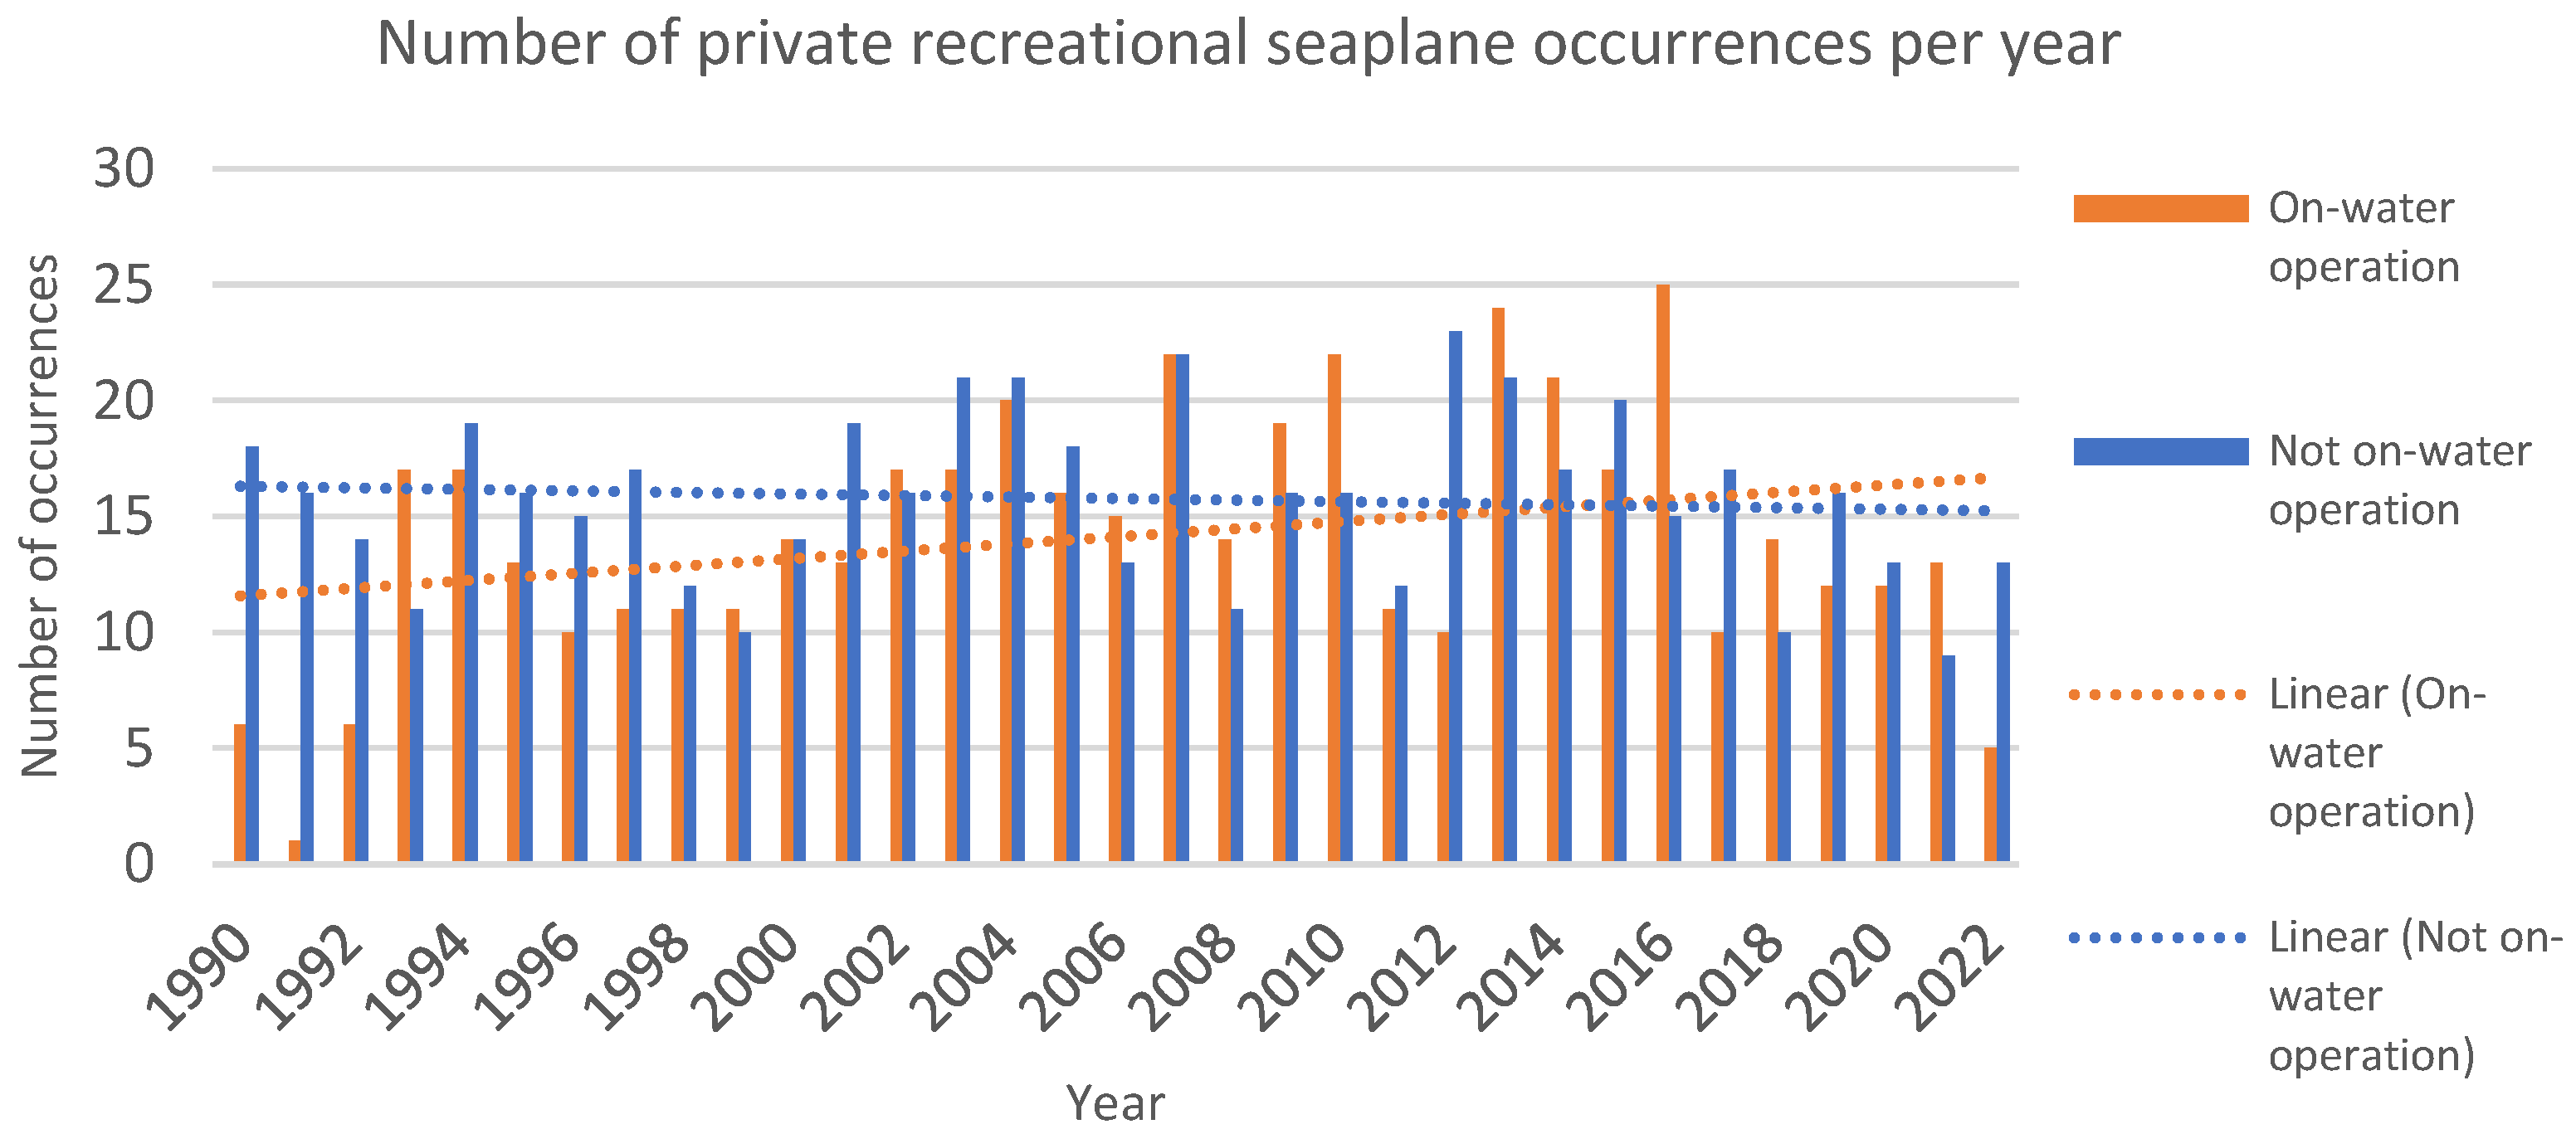
Figure 3). However, considering private recreational seaplane operations on the water in particular, the number of occurrences is showing an increase over the years (
Figure 4). This indicates that, while general seaplane safety may be improving, especially in the commercial world, there are unique challenges and risks associated with recreational, on-water seaplane operations that need to be addressed. This subset of data is used for the subsequent analysis in this article. It should also be noted that COVID-19 restrictions impacted the number of flights in 2020–2021.
The accurate calculation of occurrence rates for seaplanes presented a significant challenge due to the deficiency of data on seaplane movements, or on the yearly number of hours flown by seaplane pilots. This issue is particularly relevant in the context of recreational seaplanes in Canada, where specific data are not available. One of the primary issues highlighted by Ison [
17] is the lack of detailed data on the seaplane fleet and the cadre of seaplane pilots in the US, which makes it difficult to calculate accurate accident/incident rates because comprehensive records of flight hours, pilot experience, and operational contexts are often incomplete or unavailable. This is also the case for Canada.
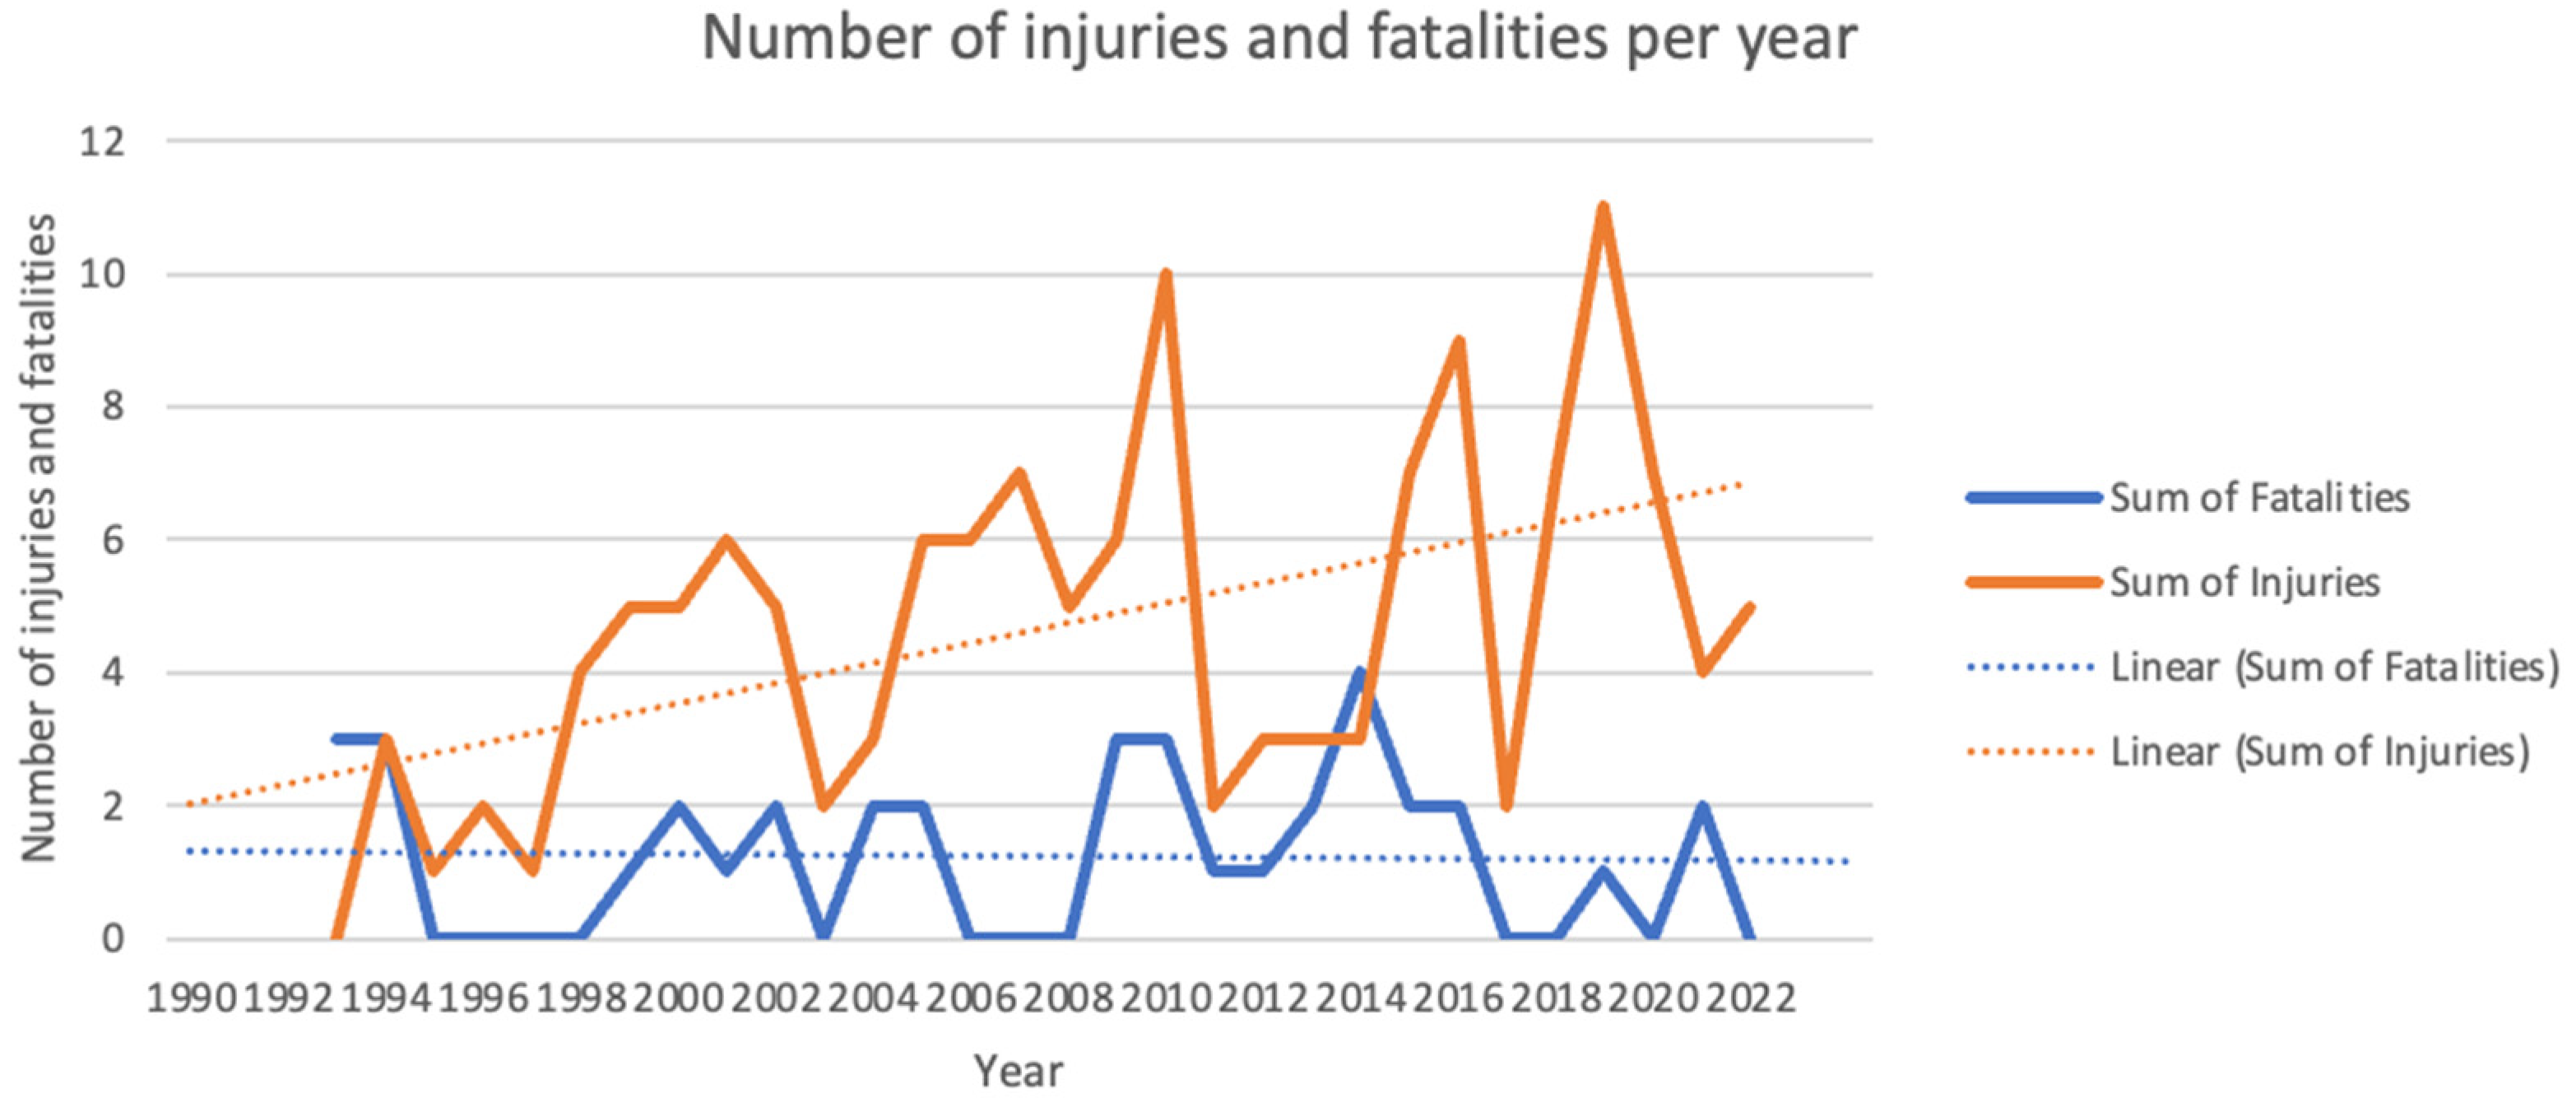
Figure 5 shows how the number of injuries and fatalities fluctuated over the period, with the trendline ascending for the number of injuries and constant for the number of fatalities. The probable impact of COVID-19 restrictions on the number of flights in 2020–2021 should be noted. Also, it was not possible to determine the number of injuries and fatalities between 1990 and 1992 for a large number of narratives, so these three years have been removed.
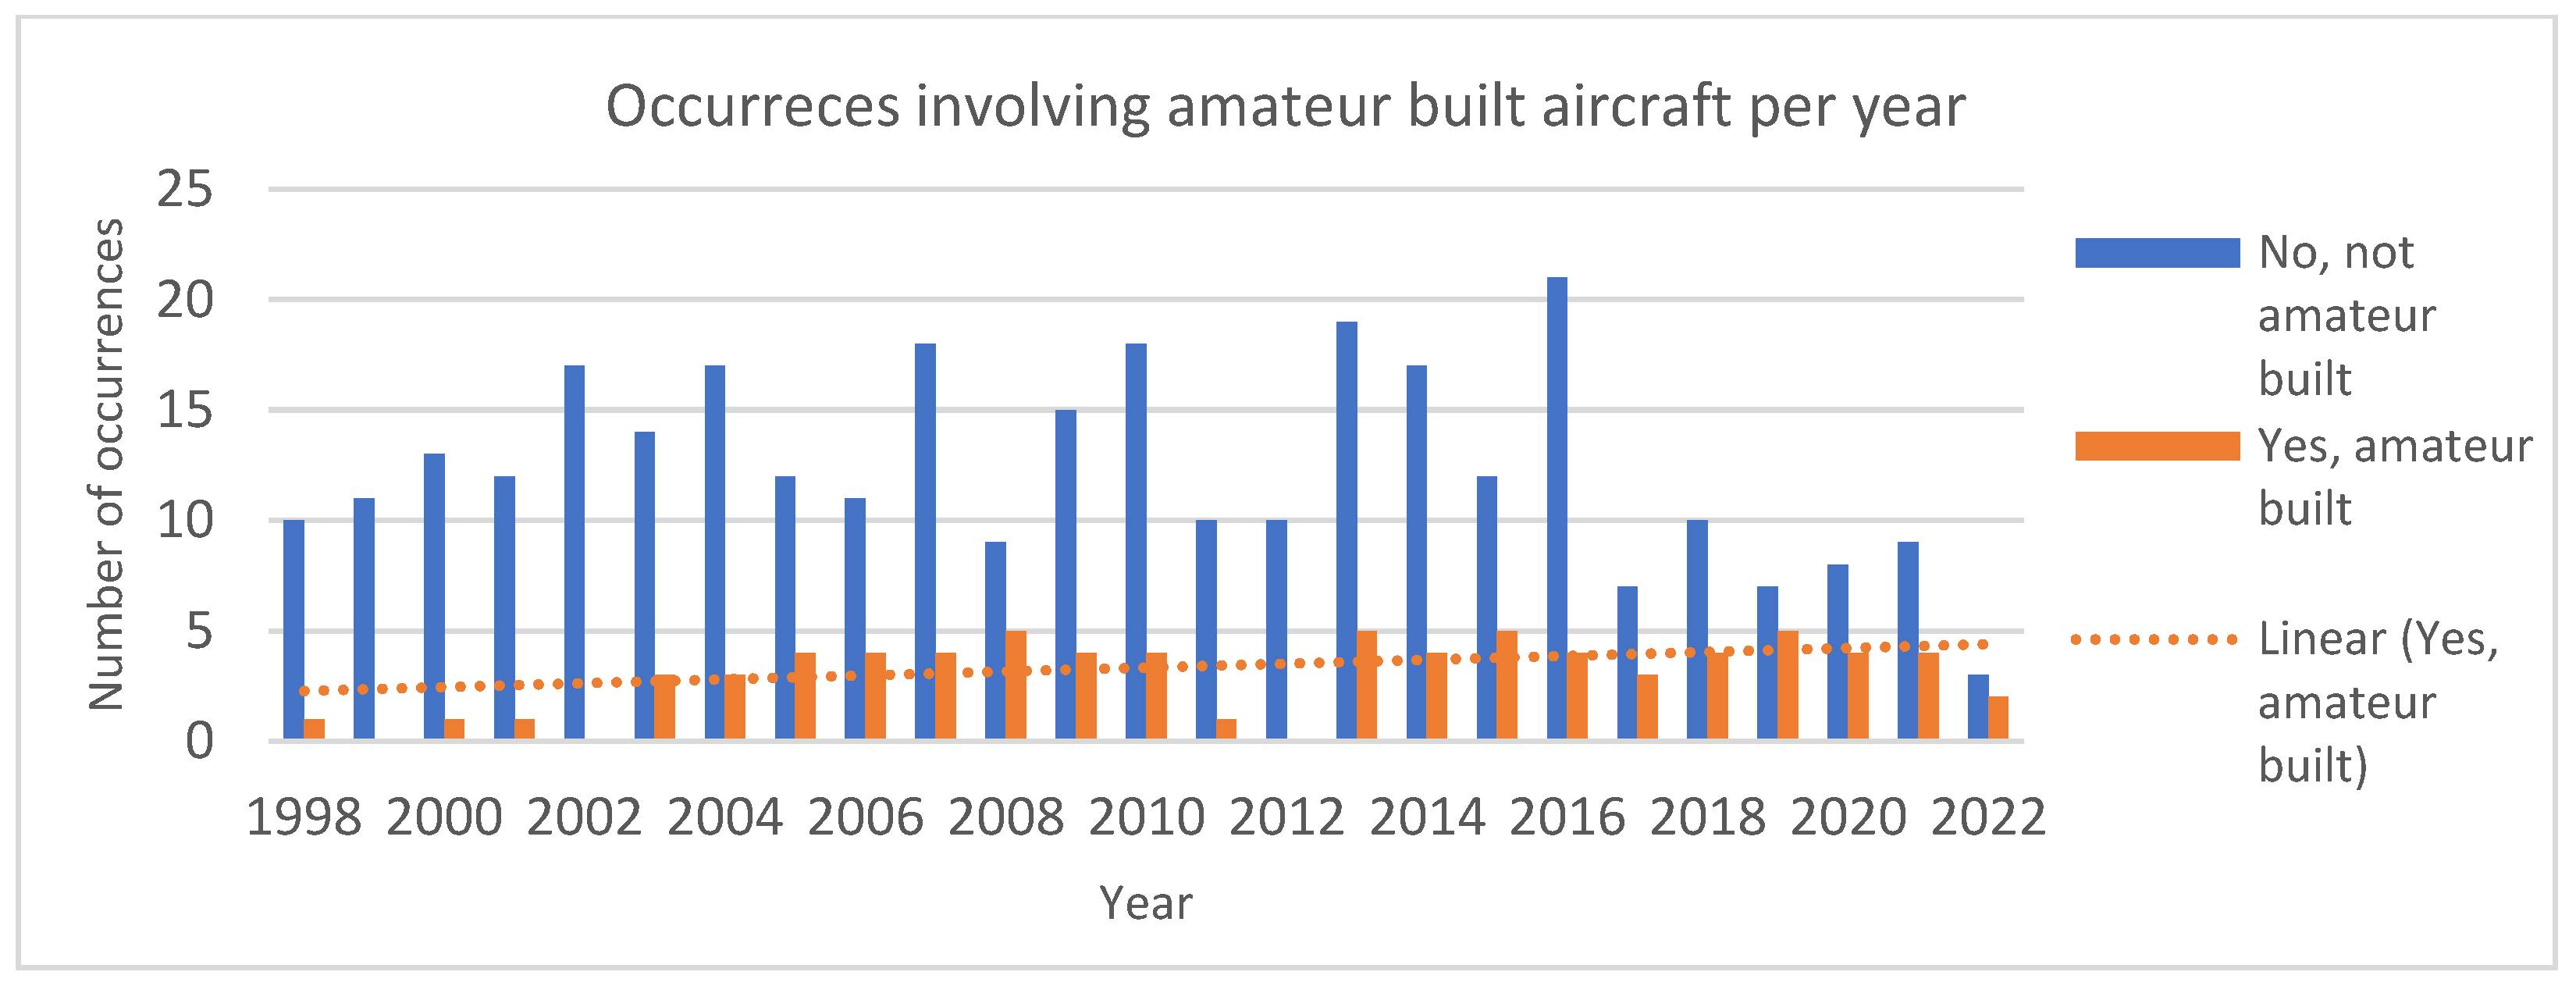
The number of occurrences annually for recreational seaplane operations on water involving amateur-built aircraft shows an increasing trend over the period, as shown in
Figure 6, with the first amateur-built occurrence in 1998. From 2003, the numbers stabilize around a consistent average, which can be attributed to improved safety and a more experienced and knowledgeable community, along with regulatory enhancements. However, in recent years, a considerable percentage of occurrences have involved amateur-built aircraft. This highlights the importance of maintaining improvements so that, in the future, amateur-built aircraft become safer, to ensure a decreasing trend in their occurrences.
Exploring the relationship between different occurrence causes and the level of damage to the aircraft reveals whether there are significant differences in the degree of damage suffered by seaplanes under different causes, thereby providing information for safety management and flight operations.
Figure 7 illustrates the severity of aircraft damage resulting from the occurrences, with 94.62% leading to substantial aircraft damage, while 3.44% resulted in the aircraft being destroyed. These figures show that, irrespective of the cause of occurrence, serious damage or even destruction of the seaplane is the likely result. The most notable trend is the fluctuation in the number of substantially damaged aircraft, which, in the past six years, while showing a gradual decline, nonetheless shows an increasing trendline over the period. Occurrences with less than major structural problems with the aircraft are not required to be reported unless there has been a death, injury, missing aircraft, or collision [
18], which is reflected in the low numbers of occurrences where the aircraft had minor or no damage.
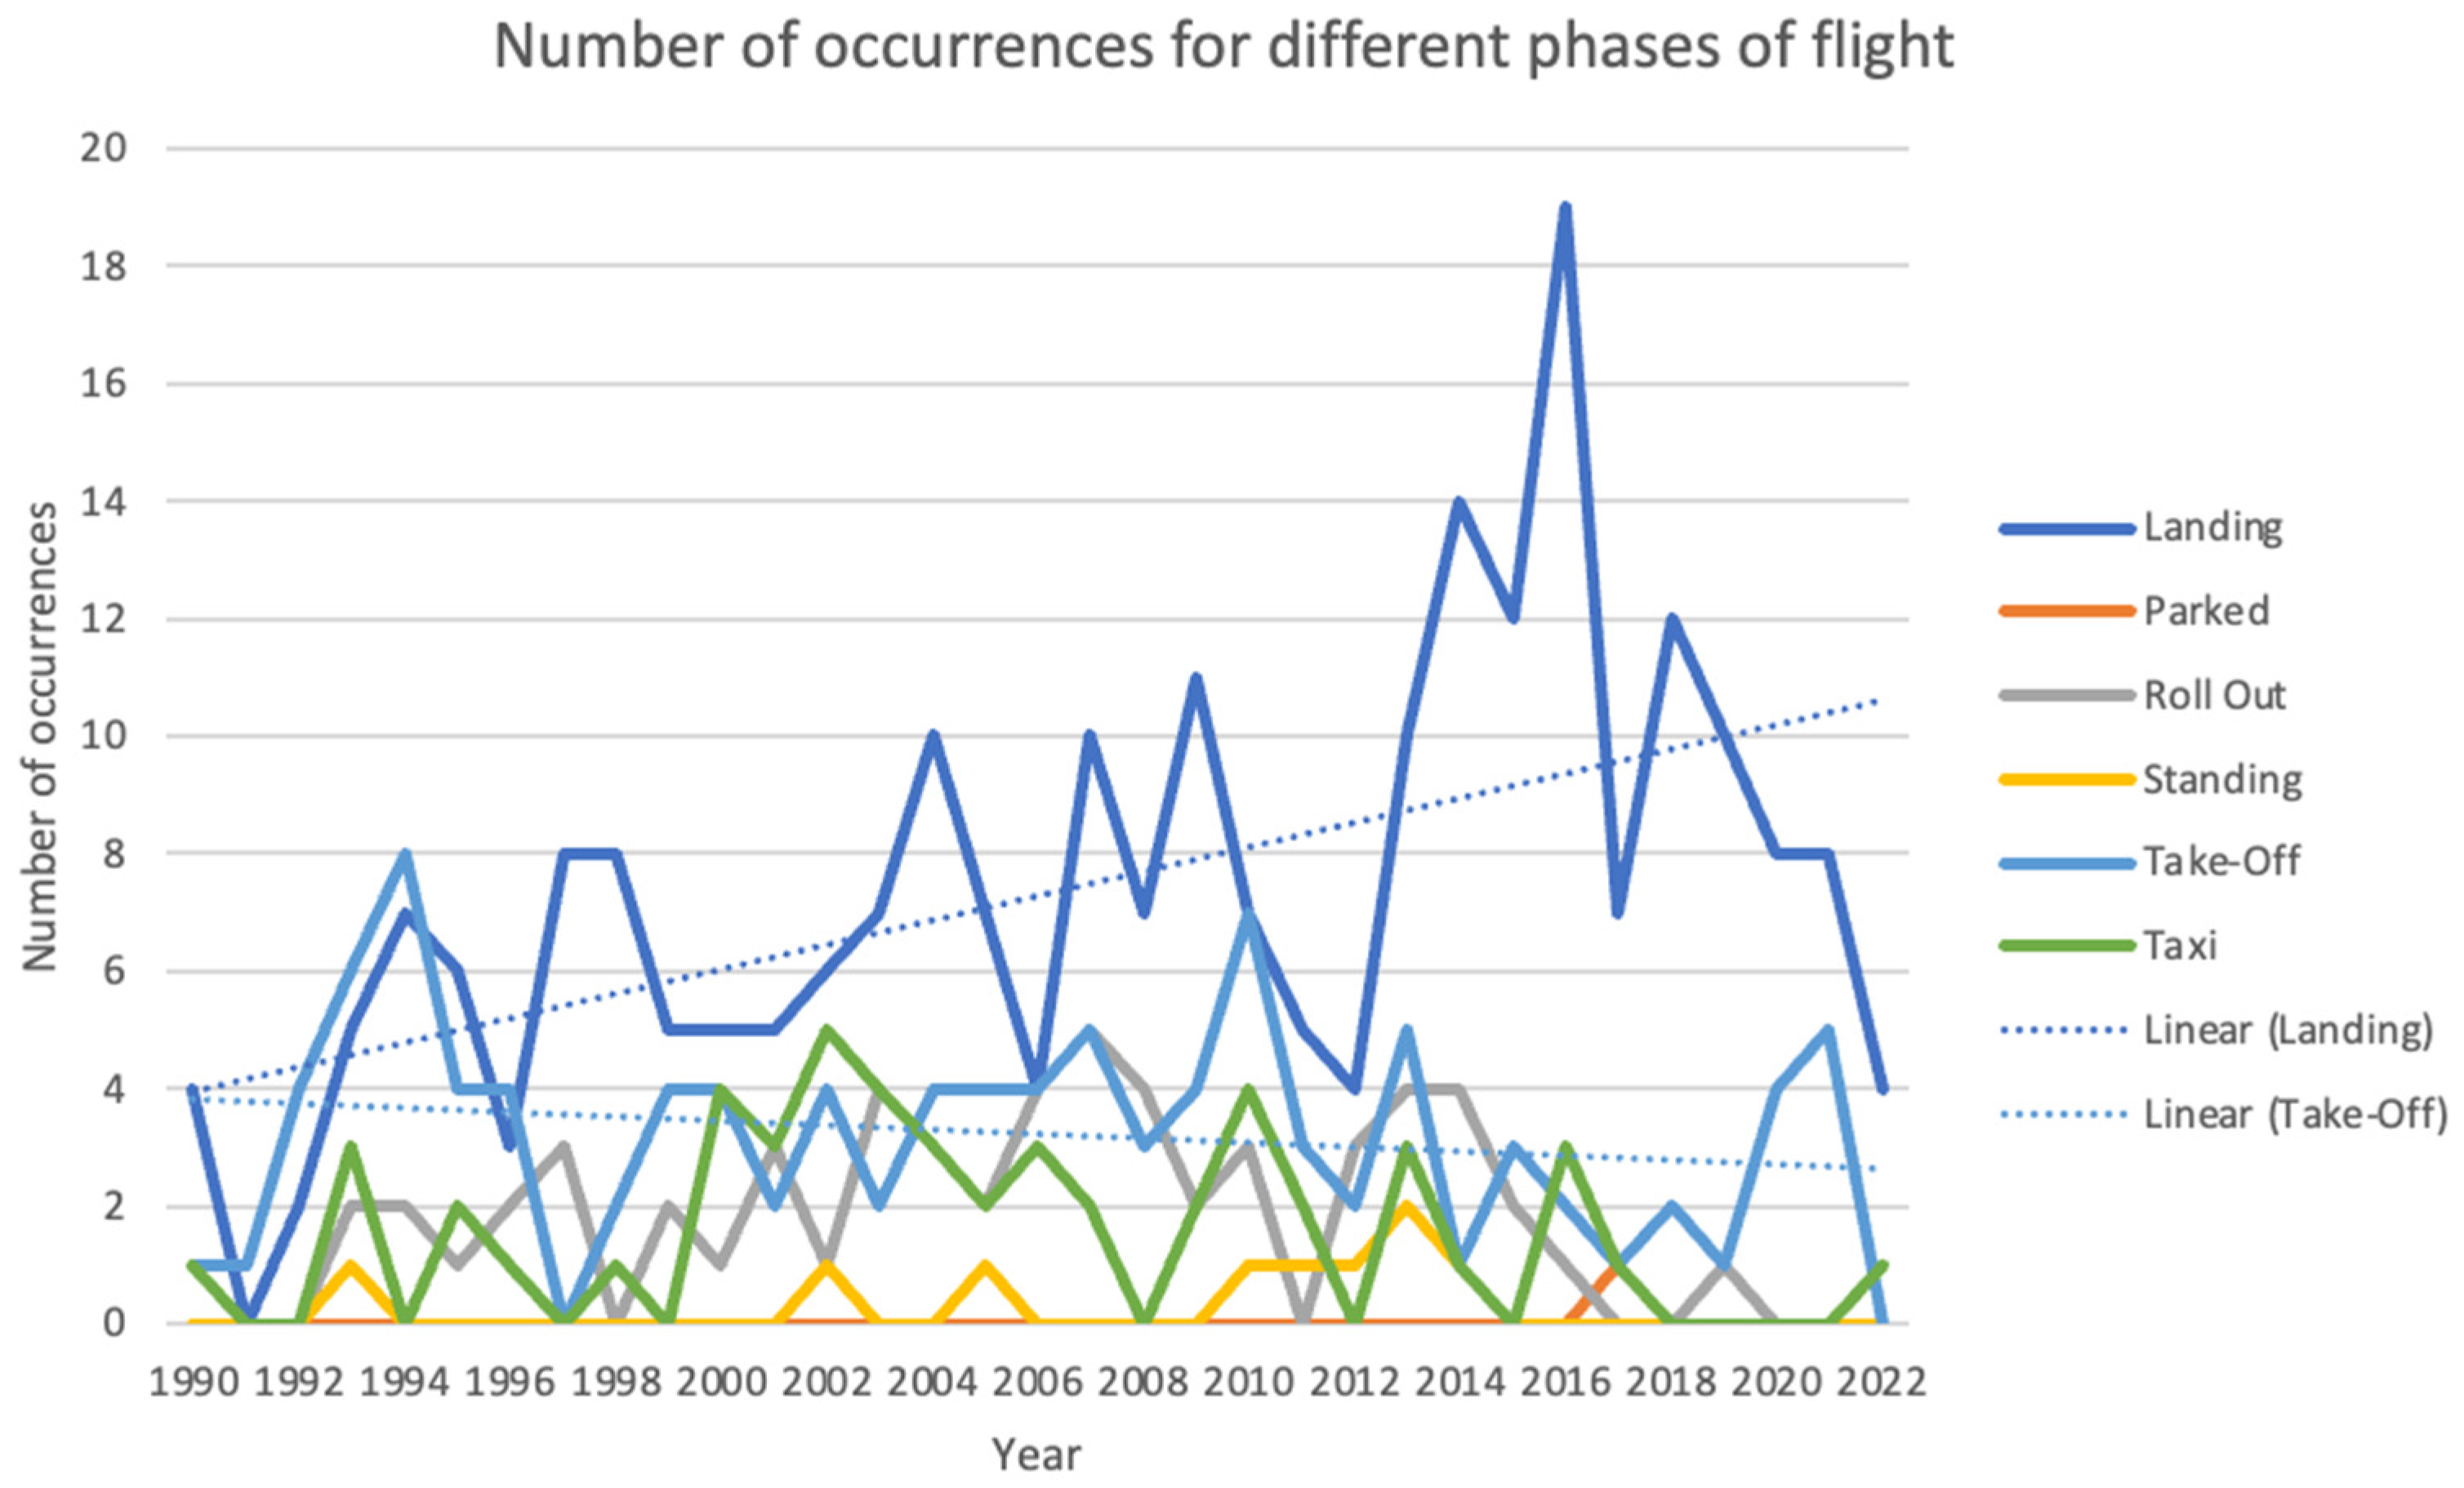
Figure 8 indicates that the landing phase is the most hazardous for recreational seaplane operations in Canada, accounting for 51.5% of occurrences. It shows an increasing trend, with an average increase in the past decade, following a peak period between 2013 and 2019. The trendline for take-off (accounting for 22.75% of the occurrences) is slightly decreasing, with an increase in 2020–2021.
Figure 9 shows the number of occurrences during take-off for the studied period. It shows several peaks, indicating intermittent periods of increased risk. Despite a low profile for take-off in 2014–2019, the years 2020 and 2021 show the highest number of occurrences in the past decade, despite restrictions on the general population due to the COVID-19 pandemic in those years. The data for landing show an increasing trend in occurrences from around 2013 onwards, peaking notably in 2016. This indicates a possible shift in the underlying factors contributing to landing incidents, such as changes in operational procedures, increased seaplane activity, or variations in reporting practices.
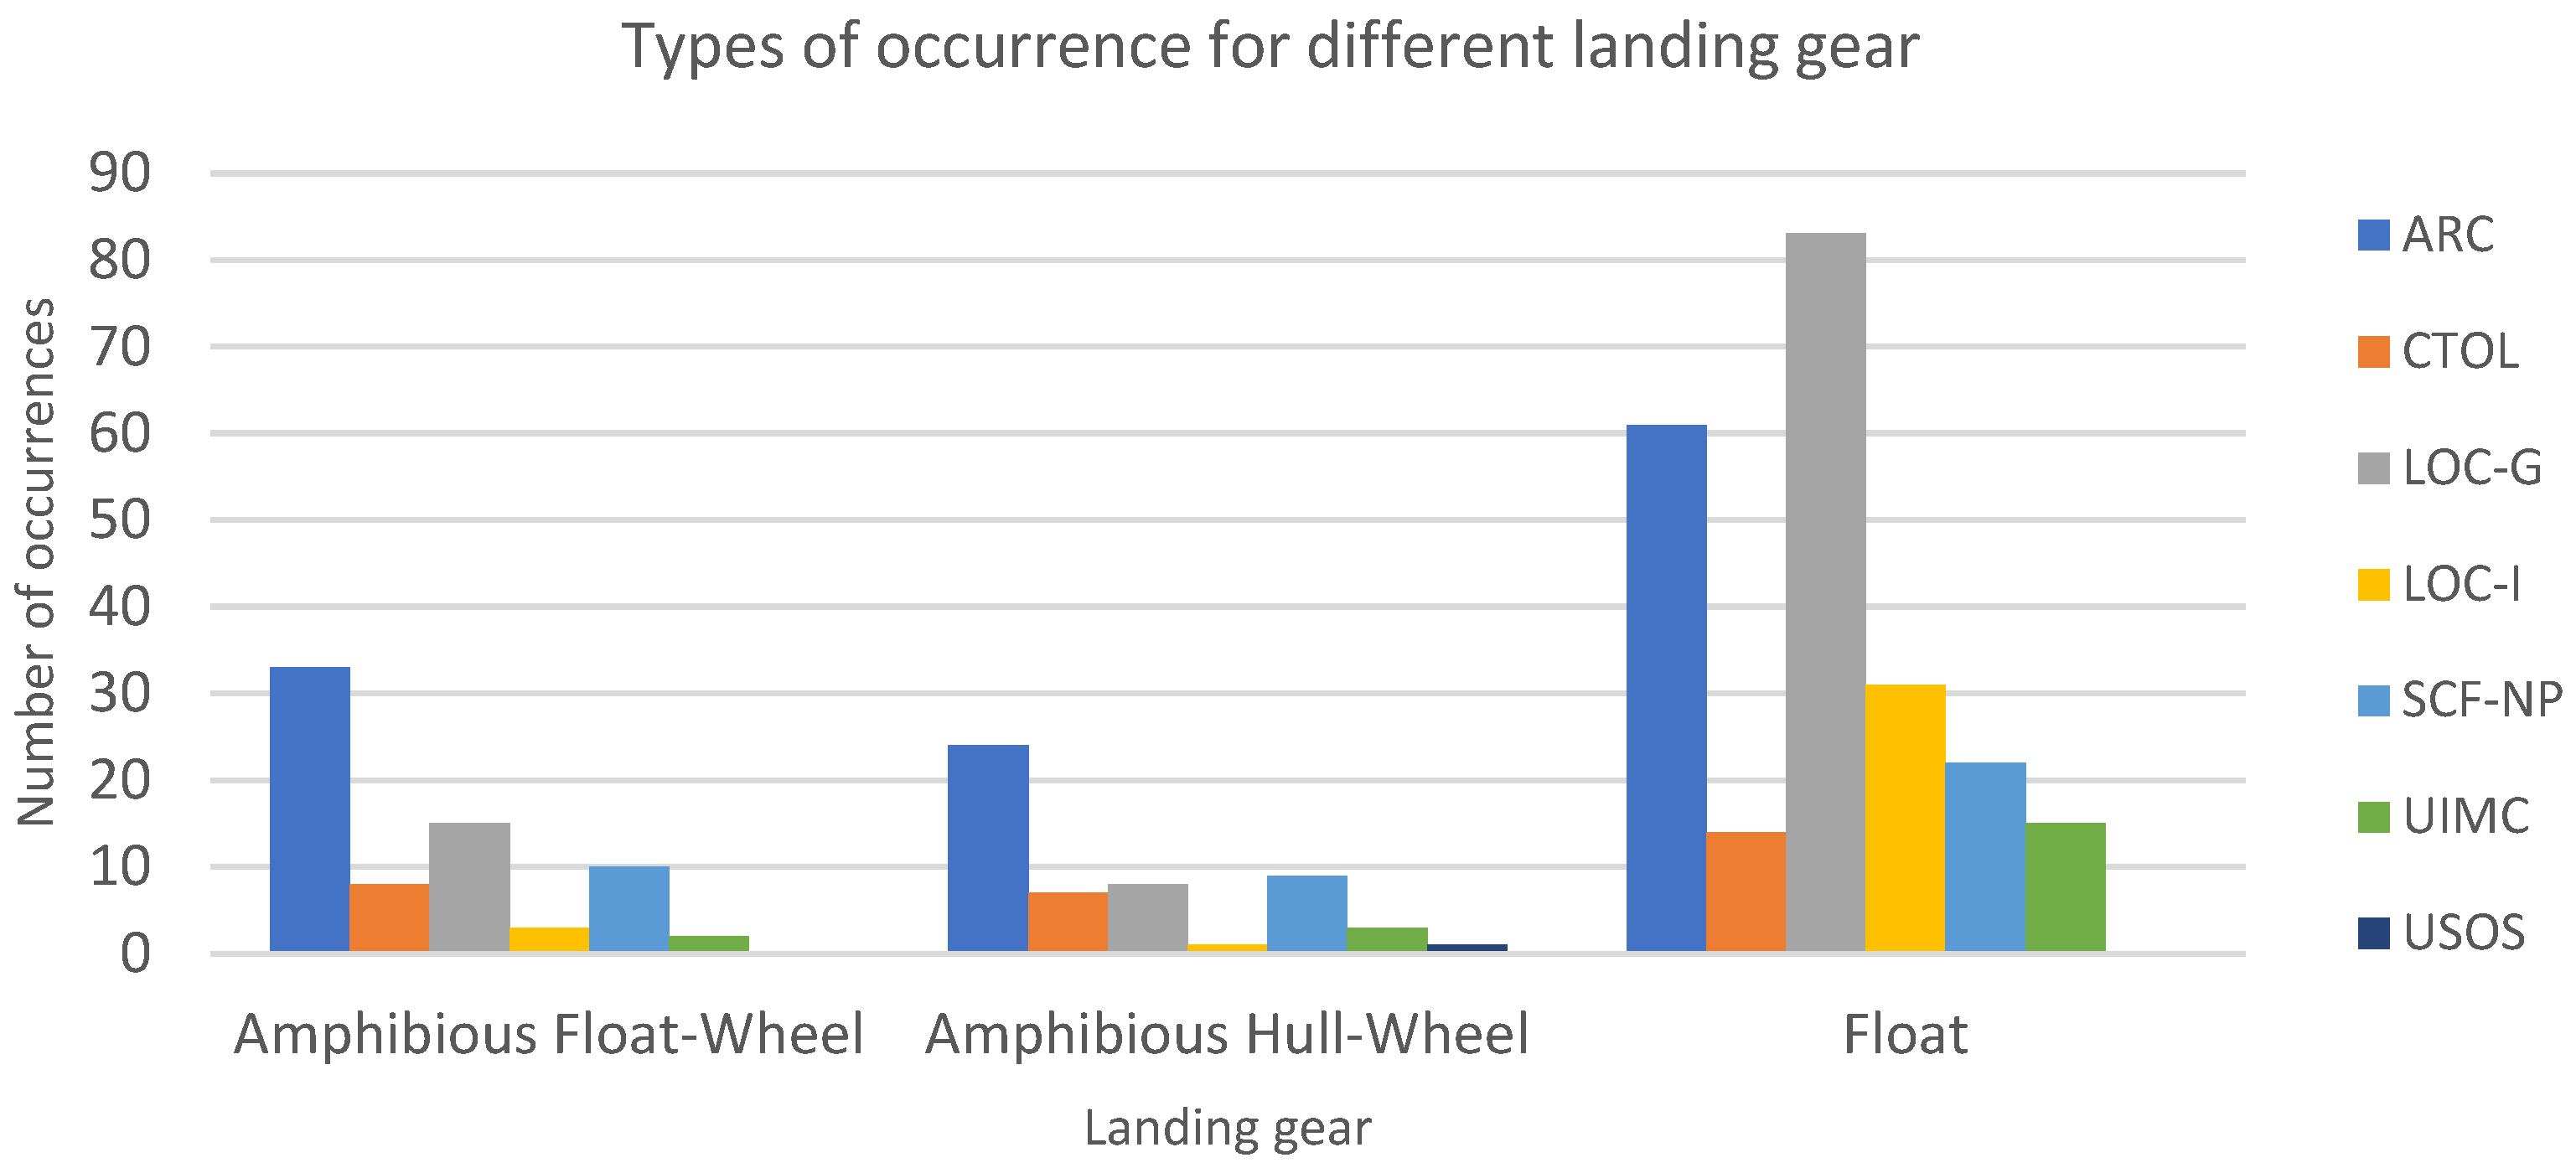
The distribution of the type of landing gear of the seaplanes involved in occurrences is 62.23% float and 32.83% amphibious (float-wheel and hull-wheel). The number of float seaplanes in Canada is expected to be higher than that of amphibious aircraft, although exact numbers could not be obtained, hence the difference in the number of occurrences for these categories.
Figure 10 illustrates the number of occurrences for different occurrence categories, per different landing gear. It shows that float-equipped seaplanes have the highest number of occurrences across all categories, particularly in “LOC-G” (loss of control on ground), with 28.62% of float occurrences. Amphibious float-wheel and hull-wheel configurations also show significant numbers of occurrences, albeit to a lesser extent. The most frequent type of occurrence for amphibious aircraft is “ARC” (abnormal runway contact), with 37.25% of amphibious occurrences.
Between 1993 and 2022, private recreational seaplane occurrences in Canada led to 179 fatalities and 401 injuries, out of which the on-water occurrences led to 37 fatalities and 140 injuries. Most of the injuries occurred after abnormal runway contact (31.43%), followed by loss of control on ground (15.71%) and engine failures (10%). When considering the number of fatalities, the majority occurred during unknown circumstances (35.14%), followed by abnormal runway contact and loss of control in flight (13.51% each).
The landing phase shows the highest number of injuries (62.14%) and fatalities (64.86%), followed by the take-off phase (23.57% of injuries and 16.22% of fatalities).
Figure 11 outlines the changes in the numbers of injuries and fatalities over the studied period, showing an increasing trendline in the number of injuries and a constant one for fatalities. Despite low numbers in 2021–2022, this figure indicates peak values every decade, each higher than the time period before, which is concerning for the safety of seaplanes on the water.
3.1.3. Contingency Analysis and Three-Way Associations
Results were obtained at a 95% confidence level, for permutations of two or three of the parameters in
Table 5. These were then recoded and converted into binary variables, as shown in
Table 5, to help understand the meanings of the associations. In some cases, such as for the “Time” parameter, which had many possible outcomes, these were grouped to reflect the part of the day (morning and evening, daytime and night-time) and therefore have only three possible outcomes. In other cases, such as for the “Phase of Flight” parameter, some possible outcomes were grouped into an “Other” binary variable, so that the focus could be on the phases of flight deemed to be of interest during the trend analysis. This was generally done for the least frequent outcomes, to avoid binary parameters with a low expected count, as those would not provide accurate results.
The results of this analysis are presented in
Figure 12, which represents a heatmap of the relevant associations with a 95% confidence level. The blue shades indicate moderate relationships, while the red shades indicate strong relationships.
Some findings that are similar to the findings already presented in the previous sections were excluded. Moreover, the associations where one of the parameters was daytime, May–October, or non-amateur-built were excluded, as it was previously determined that the majority of accidents and incidents happen then. Moreover, the “Other” categories were also removed, as they include combinations of less frequent variables.
Taking these factors into account, the main findings for strong relationships with a 95% confidence level are shown in
Figure 12. As an example, there is a strong association of amphibious aircraft being destroyed after occurrences during take-off or landing, or having substantial damage. However, occurrences of amphibian seaplanes during taxi are likely to not cause serious damage to the aircraft.
3.1.4. Summary of Quantitative Analysis
This section presents the analysis of private recreational seaplane occurrences on the water in Canada, based upon the methods outlined in
Table 3. The dataset and its limitations have been defined, and data quality checks were employed. For example, such limitations include the correlation between the number of occurrences and pilot experience, the inability to calculate accident or incident rates, or factors such as pilot experience, decision-making, and critical thinking in adverse scenarios that are not captured by the dataset. Potential solutions could include adding additional factors to be reported in case of an occurrence, or merging pilot logs with occurrence data. In addition, voluntary reporting apps could be promoted to minimize the underreporting of less serious incidents.
Despite these insights from the safety data analysis, it is still insufficient if we wish to understand why such occurrences happen in order to enhance the safety of this sector. The following section (
Section 3.2) expands on this analysis and uses the results as the basis for collecting additional qualitative data from GA pilots.
3.2. Analysis of the Survey Responses
To supplement the quantitative analysis of the previous section, a mixed-methods approach based on qualitative data from interviews, focus groups, and a questionnaire is analyzed in this section.
This study recruited 80 recreational seaplane pilots with varying degrees of experience (in terms of both years and hours flown). The participants ranged from under 20 to over 70 years of age, with the majority being above 50. A possible explanation for this could be that the population of seaplane pilots is decreasing, while at the same time they are currently likely to be working and, thus, unable to attend the interviews or focus groups. Moreover, their experience in flying seaplanes is not directly proportional to their age and has a better distribution: 32% of the participants had over 30 years of experience flying seaplanes, indicating a highly experienced group. Other categories of seaplane flying experience included the following: 20% of participants with 6–10 years, 18% with under 2 years, 12% with 21–30 years, and smaller groups with 2–5 years (9%) and 11–20 years of experience (9%). This reflects a broad range of experience levels among the participants. However, sampling bias should be noted, since there was a notable concentration of experienced pilots.
The data collection methods included online questionnaires, interviews, and focus groups, conducted both in person (22 participants) and online (29 participants). This study also engaged representatives from Canadian seaplane associations and Transport Canada to ensure diverse stakeholder representation. Ethical considerations excluded minors and vulnerable populations to prioritize participant safety and consent.
These qualitative data were analyzed using thematic analysis [
19,
20]. This method was employed to identify safety concerns by refining and analyzing codes and themes (patterns) within the data, with the themes redefined to be consistent for all three methods of data collection used. By identifying and analyzing these themes, the concerns and experiences of seaplane pilots can be better understood, and specific recurring issues can be addressed [
21].
Before the start of the scenarios, the participants in the questionnaire were asked about personal safety concerns. The notable responses include concern over too many aircraft crashing and people killed, amphibious safety (including landing gear configuration on landing), and concerns about pilot attitudes in general. The key safety concerns identified through thematic analysis are summarized in
Table 6.
Pilots emphasized the importance of real-world experience, citing it as a critical complement to theoretical knowledge in preparing them for unexpected situations. However, concerns were raised about overreliance on advanced systems like the G1000 avionics system, which was perceived to erode fundamental flying skills. Participants highlighted the need for training programs to strike a balance between teaching traditional piloting techniques and incorporating modern technologies, as excessive dependence on technology could lead to problems if it fails. The interplay of these themes points to a decline in basic flying skills, with a call to adapt training methods to address this challenge effectively.
Regarding the hazards imposed by boats and jet skis, seaplane pilots expressed significant concerns about their unpredictable movements, with jet skis and boats towing tubes often changing direction erratically, creating dangerous situations during take-off and landing. Pilots recounted near-collisions and emphasized that many boat operators are unaware of the risks that they pose to seaplanes, particularly during critical flight phases. To mitigate these hazards, pilots often delay landings or choose less congested areas, although these strategies are not always feasible. The presence of boats and jet skis adds considerable stress and anxiety to seaplane operations, leading to calls for regulatory adjustments to prioritize aircraft during take-off and landing. Additionally, pilots highlighted the importance of understanding maritime regulations to navigate busy waterways safely.
For seaplane operations on the water, the lack of consistent radio use among pilots poses significant risks. Pilots often fail to announce their intentions and positions, leading to missed communications and increasing the likelihood of misunderstandings and accidents. This issue is exacerbated by a culture of “silent operations”, particularly among older pilots who are unaccustomed to relying on radios. The absence of proper radio communication heightens the risk of collisions, especially in areas with mixed traffic, as it becomes difficult to coordinate with other seaplanes and watercraft. Furthermore, the lack of radio use reduces situational awareness, with pilots recounting incidents where unannounced aircraft suddenly appeared during critical flight phases, endangering operations.
Environmental awareness also plays a critical role in ensuring the safety of seaplanes on the water. Unpredictable weather conditions pose significant challenges, requiring pilots to have strong forecasting skills and the ability to adapt to sudden changes. Wildlife hazards, including birds and marine animals, are another notable concern during take-off and landing, as wildlife strikes can be dangerous and demand constant vigilance. Additionally, glassy water conditions present unique difficulties, such as misjudging distances and visual references, which can lead to errors during landing. These environmental factors emphasize the need for heightened awareness, thorough training, and careful planning to mitigate risks in seaplane operations.
Finally, for mechanical reliability and safety, pilots highlighted that engine failures, especially during take-off, represent a significant hazard, emphasizing the importance of dependable engines. Maintenance lapses exacerbate safety risks, underscoring the need for diligent upkeep. Reliable equipment is essential, as failures can lead to severe consequences. To ensure safety and instill pilot confidence, the participants emphasized that operators must prioritize regular maintenance and invest in high-quality, dependable equipment.


