Systematic Review

Machine Learning Models for Predicting Mortality in Hemodialysis Patients: A Systematic Review

by
Alexandru Catalin Motofelea
1,2,
Adelina Mihaescu
2,3,*,
Nicu Olariu
2,3,
Luciana Marc
2,3,
Lazar Chisavu
2,3,
Gheorghe Nicusor Pop
4,
Andreea Crintea
5,
Ana Maria Cristina Jura
6,
Viviana Mihaela Ivan
2,7,
Adrian Apostol
7 and
Adalbert Schiller
2,3
1
Doctoral School, “Victor Babeș” University of Medicine and Pharmacy Timișoara, Eftimie Murgu Square No. 2, 300041 Timisoara, Romania
2
Center for Molecular Research in Nephrology and Vascular Disease, Faculty of Medicine, “Victor Babeș” University of Medicine and Pharmacy Timișoara, Eftimie Murgu Square No. 2, 300041 Timisoara, Romania
3
Department of Internal Medicine II—Division of Nephrology, “Victor Babeș” University of Medicine and Pharmacy Timișoara, Eftimie Murgu Square No. 2, 300041 Timisoara, Romania
4
Center for Modeling Biological Systems and Data Analysis (CMSBAD), “Victor Babeș” University of Medicine and Pharmacy Timișoara, Eftimie Murgu Square No. 2, 300041 Timisoara, Romania
5
Department of Molecular Sciences, University of Medicine and Pharmacy “Iuliu Hațieganu”, 400349 Cluj-Napoca, Romania
6
Department of Obstetrics and Gynecology, “Victor Babeş” University of Medicine and Pharmacy Timișoara, Eftimie Murgu Square No. 2, 300041 Timisoara, Romania
7
Department VII, Internal Medicine II, Discipline of Cardiology, “Victor Babeș” University of Medicine and Pharmacy Timișoara, Eftimie Murgu Square No. 2, 300041 Timisoara, Romania
*
Author to whom correspondence should be addressed.
Appl. Sci. 2025, 15(10), 5776; https://doi.org/10.3390/app15105776
Submission received: 19 February 2025 / Revised: 16 May 2025 / Accepted: 20 May 2025 / Published: 21 May 2025
(This article belongs to the Special Issue Applied Machine Learning III)

Abstract

:
Background: Hemodialysis (HD) patients have significantly higher mortality rates compared to the general population, primarily due to complex comorbidities. This systematic review and meta-analysis aimed to evaluate and compare the performance of various machine learning (ML) models in predicting mortality among HD patients. Methods: The analysis followed PRISMA guidelines, including studies that assessed the predictive capabilities of ML models for mortality in HD patients. Review Manager software version 5.4.1. was used for meta-analysis, and the performance of ML models was compared, including logistic regression, XGBoost, and Random Forest models. Results: The meta-analysis indicated that the logistic regression model predicted a true positive mortality rate of 8.23%, close to the actual rate of 10.53%. In contrast, the XGBoost and Random Forest models predicted rates of 9.93% and 8.94%, respectively, compared to the actual mortality rate of 13.73%. The highest area under the curve (AUC) was reported for the Random Forest model at a 3-year follow-up (AUC = 0.89). No significant difference was found between the performance of logistic regression and Random Forest models (p = 0.82). Conclusions: ML models, particularly Random Forest and logistic regression, demonstrated effective predictive capabilities for mortality in HD patients. These models can help identify high-risk patients early, facilitating personalized treatment strategies and potentially improving long-term outcomes. However, the observed heterogeneity among studies indicates a need for further research to refine model performance and standardize predictive features.

1. Introduction

Hemodialysis (HD) remains a critical and life-sustaining treatment for patients with End-Stage Renal Disease (ESRD), a severe condition characterized by the irreversible loss of kidney function. Patients with ESRD represent approximately 89% of individuals requiring dialysis therapy, underscoring the high prevalence of this population within the dialysis setting [1,2]. Despite advances in treatment, hemodialysis patients experience significantly higher mortality rates than the general population, with cardiovascular diseases being a major contributing factor [3,4].
The elevated risk of mortality in HD patients results from a complex interplay of factors. Advanced age, high estimated glomerular filtration rate (eGFR) at dialysis initiation, the use of vascular catheters, low serum albumin, and reduced hemoglobin levels have all been identified as critical predictors of poor outcomes [5,6,7,8,9]. Early risk stratification using these clinical indicators is essential for improving patient management and enhancing survival rates [10].
Traditional risk prediction models, such as Cox proportional hazards regression and logistic regression, have been widely used to identify mortality risk factors in HD patients [8,11,12,13,14,15,16,17,18,19]. While they possess the flexibility to incorporate non-linear relationships and interaction effects through explicit inclusion of transformed variables (e.g., polynomial terms, splines) or interaction terms, identifying and specifying all relevant complex relationships in advance can be challenging. In practice, simpler model structures are often initially employed, which may not fully capture and predict unknown patterns inherent in complex biological data. This may potentially limit predictive performance compared to methods designed to automatically detect such patterns, especially when applied to large, heterogeneous patient populations [20].
The rise of big data and advanced computational techniques has paved the way for machine learning (ML) approaches, which have shown promise in addressing the limitations of traditional statistical models. Unlike conventional methods, ML algorithms such as Random Forest and XGBoost can handle complex, non-linear relationships between variables and can adapt to evolving clinical datasets [21]. These models excel in identifying novel predictive features and have demonstrated superior accuracy in mortality risk prediction compared to traditional models [22,23,24,25]. Additionally, ML models offer the capability to estimate individualized treatment effects, providing a more personalized approach to patient care.
Since traditional risk prediction models often struggle with the complex, non-linear interactions present in hemodialysis patient data, ML may offer additional advantages in addressing these complexities. Therefore, the primary objectives of this systematic review and meta-analysis are to systematically identify and summarize studies that have developed and evaluated ML models for predicting all-cause mortality in hemodialysis patients. In addition, we aim to compare the reported predictive performance of various ML models, focusing on metrics such as Area Under the Receiver Operating Characteristic curve (AUC), sensitivity, and specificity, with particular attention to commonly employed algorithms like Random Forest and Logistic Regression. These findings will help to evaluate the current state of ML application in this area and assess the potential clinical utility of these models for enhancing risk stratification and informing personalized patient management strategies in the hemodialysis setting.

2. Materials and Methods

2.1. Study Design and Protocol Registration

This meta-analysis was performed in accordance with the Preferred Reporting Items for Systematic Reviews and Meta-Analyses (PRISMA) guidelines and the Cochrane Handbook for Systematic Reviews of Interventions [26,27]. The study protocol has been registered in the PROSPERO database under the registration number CRD42024517408.

2.2. Literature Review

Four databases were searched: PubMed, Web of Science, Scopus, and Cochrane, without restrictions. The Mesh database was used to construct the search strategy. The search consisted of a combination of the following keywords: (“Mortality” [Mesh] OR “Mortality” OR “Mortalities” OR “Death Rate” OR “Case Fatality Rate” OR “Case Fatality Rates” OR “Case Fatality Rate”) AND (“Kidney Failure, Chronic” [Mesh] OR “Chronic Renal Failure” OR “End Stage Kidney Disease” OR “End Stage Renal Disease” OR “End-Stage Renal Failure” OR “Chronic Kidney Failure” OR “Renal Dialysis” [Mesh] OR “Renal Dialyses” OR Hemodialysis OR Hemodialysis) AND (prediction OR predictors OR prognostic) AND (Machine learning OR model OR validation).

2.3. Eligibility Requirements and Study Selection

The inclusion criteria encompassed studies addressing the ability of ML models to predict mortality among HD patients. Articles of any study design, written in English, and with full text available were included. No limitations concerning the publication date were applied. We omitted studies with inadequate data for extraction. Reviews, book chapters, theses, editorials, letters, conference papers, non-English studies, and animal or in vitro research were excluded.
Two independent reviewers evaluated the articles obtained from the four electronic databases for eligibility by reviewing the title, abstract, and full text in an Excel spreadsheet. A third impartial reviewer resolved any disagreements.

2.4. Assessment of Study Quality

The Cochrane risk-of-bias instrument, the QUADAS-2 tool, assesses the risk of bias in each study across four domains: participant selection, index test, reference standard, flow and timing, as well as an overall assessment of bias risk [28]. This tool is specifically designed for systematic reviews of diagnostic or prognostic accuracy studies and evaluates potential bias across four key domains: (1) Participant Selection: Assessing whether the patient sample was representative of the target population and whether selection could introduce bias. (2) Index Test: Evaluating the conduct and interpretation of the ML model development and validation (the “index test” in this context), including whether thresholds were pre-specified. (3) Reference Standard: Assessing the method used to establish the true outcome (mortality) and whether it was likely to classify the outcome correctly. (4) Flow and Timing: Evaluating patient flow, dropouts, and the appropriateness of the time interval between the index test and reference standard ascertainment.

2.5. Data Extraction

Data extraction was conducted independently by two reviewers and recorded in a pre-defined Excel spreadsheet. Extracted data included study characteristics such as design, country, period, and sample size; patient demographics and clinical parameters; and the outcomes of machine learning model performance. The variables included in the datasets were demographic (age, gender, body mass index), clinical (vascular access type, comorbidities, duration of hemodialysis), and laboratory parameters (e.g., levels of hemoglobin, albumin, calcium, phosphorus, potassium, sodium, and creatinine). Mortality status during the follow-up period was the primary outcome variable. Any disagreements were resolved through discussion among the reviewers.

2.6. Statistical Analysis

We performed the statistical analysis using the Review Manager (Revman) software version 5.4.1. To pool the results of the meta-analysis, we used mean difference (MD) with a 95% confidence interval (CI). Significance was detected at a p value less than 0.05. A random-effects model was chosen due to the anticipated clinical and methodological diversity across studies, including variations in patient populations, ML models used, features included, and study designs. Statistical heterogeneity was assessed using the Chi-square test at p < 0.1. Subgroup analysis based on the machine learning model tested, along with leave-one-out sensitivity analysis, was planned to explore potential sources of heterogeneity.

2.7. Outcomes Measures

Mortality prediction was the primary outcome of this meta-analysis. It was reported in the studies as an Area Under the Curve (AUC) and 95% CI. The sensitivity and specificity of the models were qualitatively compared. In addition, the number of true positive, true negative, false positive, and false negative cases were also qualitatively compared among the included studies.

3. Results

3.1. Study Selection

The study selection process is illustrated in Figure 1. The initial search across relevant databases yielded 6276 studies. After removing duplicates, 6114 studies were screened based on title and abstract. Subsequently, 6089 studies were excluded due to irrelevance to the research question. A full-text assessment was conducted for the remaining 84 reports. A further 64 reports were excluded for various reasons: unavailability of full text (n = 6), duplicate publication (n = 7), mismatched intervention (n = 11), irrelevant outcome (n = 14), or inappropriate population (n = 15). Ultimately, 11 studies met the inclusion criteria and were included in the systematic review and meta-analysis. All included studies were retrospective cohorts (Table 1).
The included studies were conducted over a broad period, from 2012 to 2023, with data collection spanning from 1995 to 2019. A variety of ML models were investigated across these studies, including Logistic Regression, Adaptive Boosting, Decision Tree, Gradient Boosting, K-Nearest Neighbor, Random Forest, XGBoost, and Support Vector Machine.

3.2. Baseline Characteristics of the Included Patients

The age range of the included patients varied between 50.29 ± 15.73 and 68.7 ± 11.2 (Table 2). The majority of patients were male. Body mass index (BMI) ranged from 21.73 ± 21.83 to 30 ± 68. Albumin levels ranged from 3.2 ± 0.6 to 4 ± 0.45 g/dL. Sodium levels ranged from 138.5 ± 2.6 to 139.28 ± 3.7 mEq/L, while potassium levels ranged from 4.7 ± 0.69 to 4.91 ± 0.89 mEq/L. Calcium levels fluctuated between 8.86 ± 0.64 and 9.04 ± 3.88 mg/dL, while phosphorus levels ranged from 4.27 ± 1.59 to 5.2 ± 1.48 mg/dL. Creatinine levels varied widely across studies, ranging from 6.46 ± 3.52 to 12.9 ± 6.1 mg/dL. Similarly, hemoglobin levels ranged from 9.66 ± 1.64 to 11.7 ± 1.1 g/dL.

3.3. Quality Assessment Results

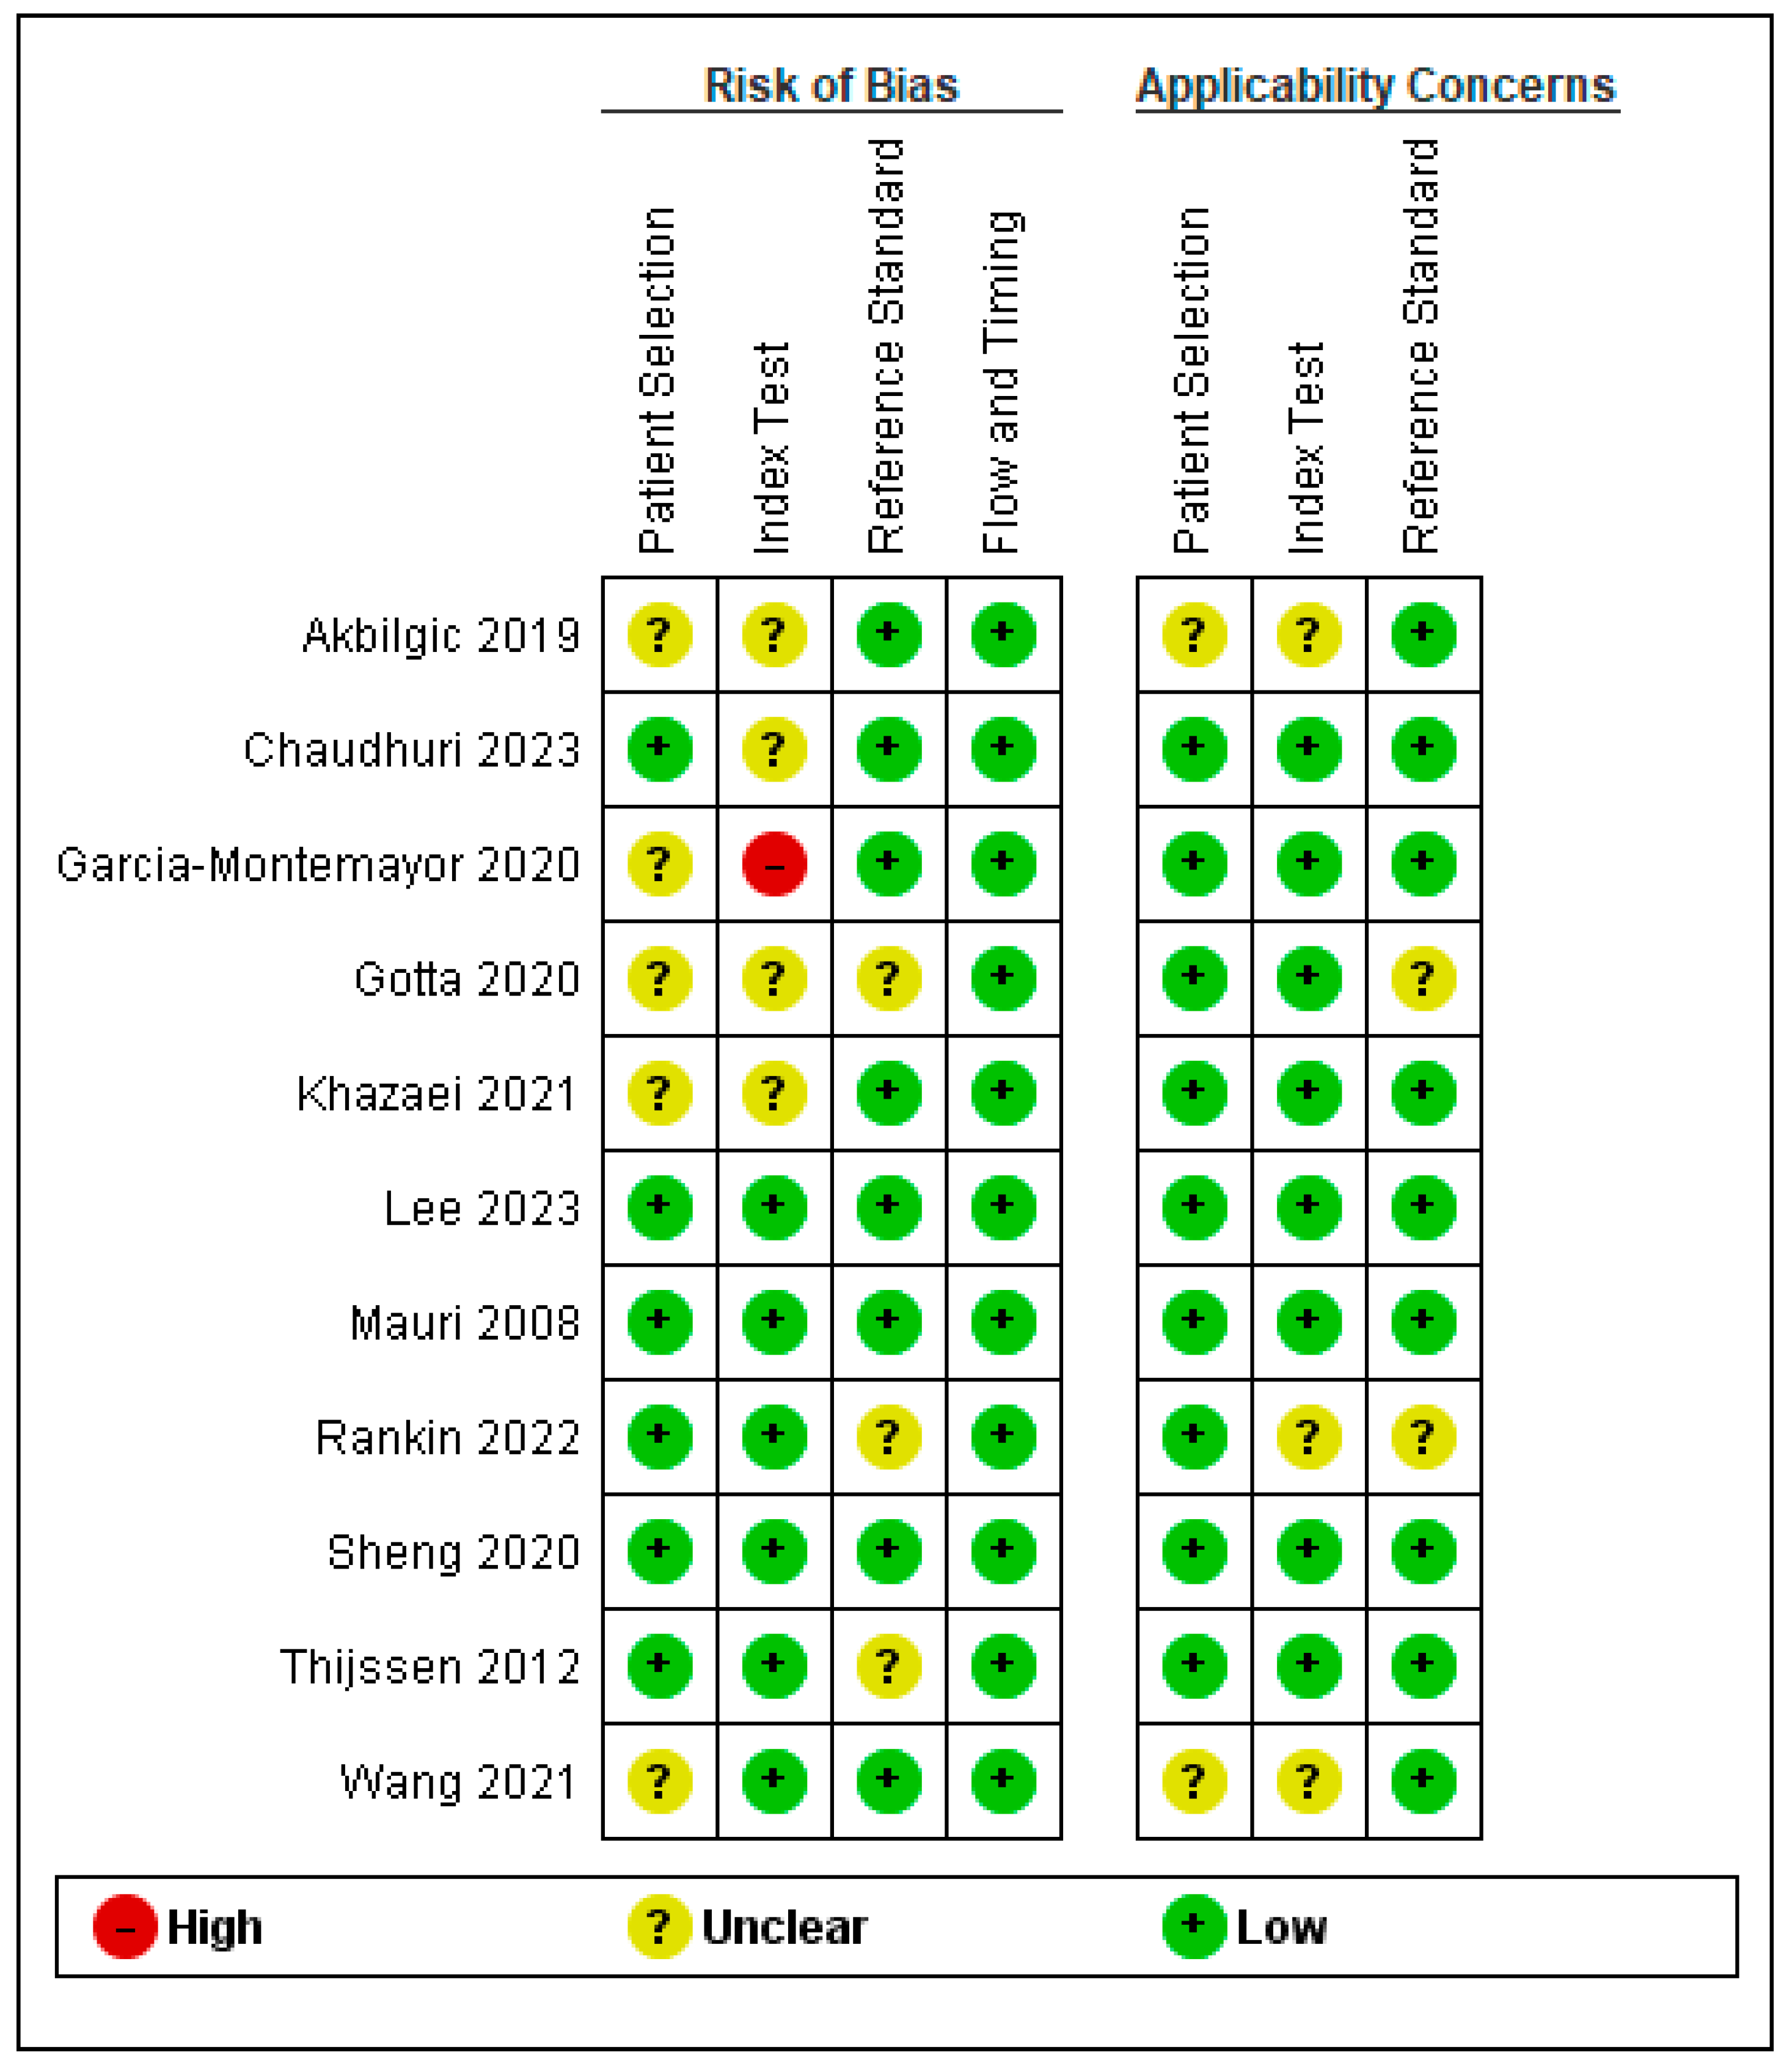
The risk of bias graph and summary are illustrated in Figure 2 and Figure 3. Regarding participant selection, all studies exhibit a low risk of bias, except for five studies, which showed an unclear risk of bias: Garcia-Montemayor 2020, Gotta 2020, Khazaei 2021, Chaudhuri 2023, and Wang 2021 [10,29,36,37,38].
Regarding the index test, all studies exhibited a low risk of bias, except for Akbilgic 2019, Chaudhuri 2023, Gotta 2020, and Khazaei 2021 [29,31,37,38], which showed unclear risk of bias; Garcia-Montemayor 2020 showed high risk of bias [10].
Concerning reference standard, all studies exhibited a low risk of bias except for Gotta 2020, Rankin 2022, and Thijssen 2012 which show unclear risk of bias [34,35,38]. Regarding flow and timing, all studies exhibit a low risk of bias.
Three studies—Sheng 2020, Mauri 2008, and Lee 2023 [30,32,33]—scored a low risk of bias across all assessed domains (Figure 2).

3.4. Outcomes Measure Results

Performance Characteristics of ML Models

Table 3 presents a summary of the performance characteristics of ML models for predicting mortality among HD patients in the included studies. Performance characteristics were reported in five studies [30,32,34,35,37] at various follow-up times. For instance, at one-year follow-up Sheng et al., 2020 [30], Lee et al., 2023 [32], and Thijssen et al., 2012 [34] reported the performance of logistic regression, where they found a predicted true positive mortality rate of 8.23% as compared to an actual mortality rate of 10.53%. In addition, Sheng et al., 2020 [30] and Lee et al., 2023 [32] reported the performance of XGBoost and Random Forest, where they found a predicted true positive mortality rate of 9.93% and 8.94%, respectively, as compared to an actual rate of 13.73%. This might reflect a better accuracy for the logistic regression models; however, further examination is required, particularly by comparing the models after training with the same datasets.
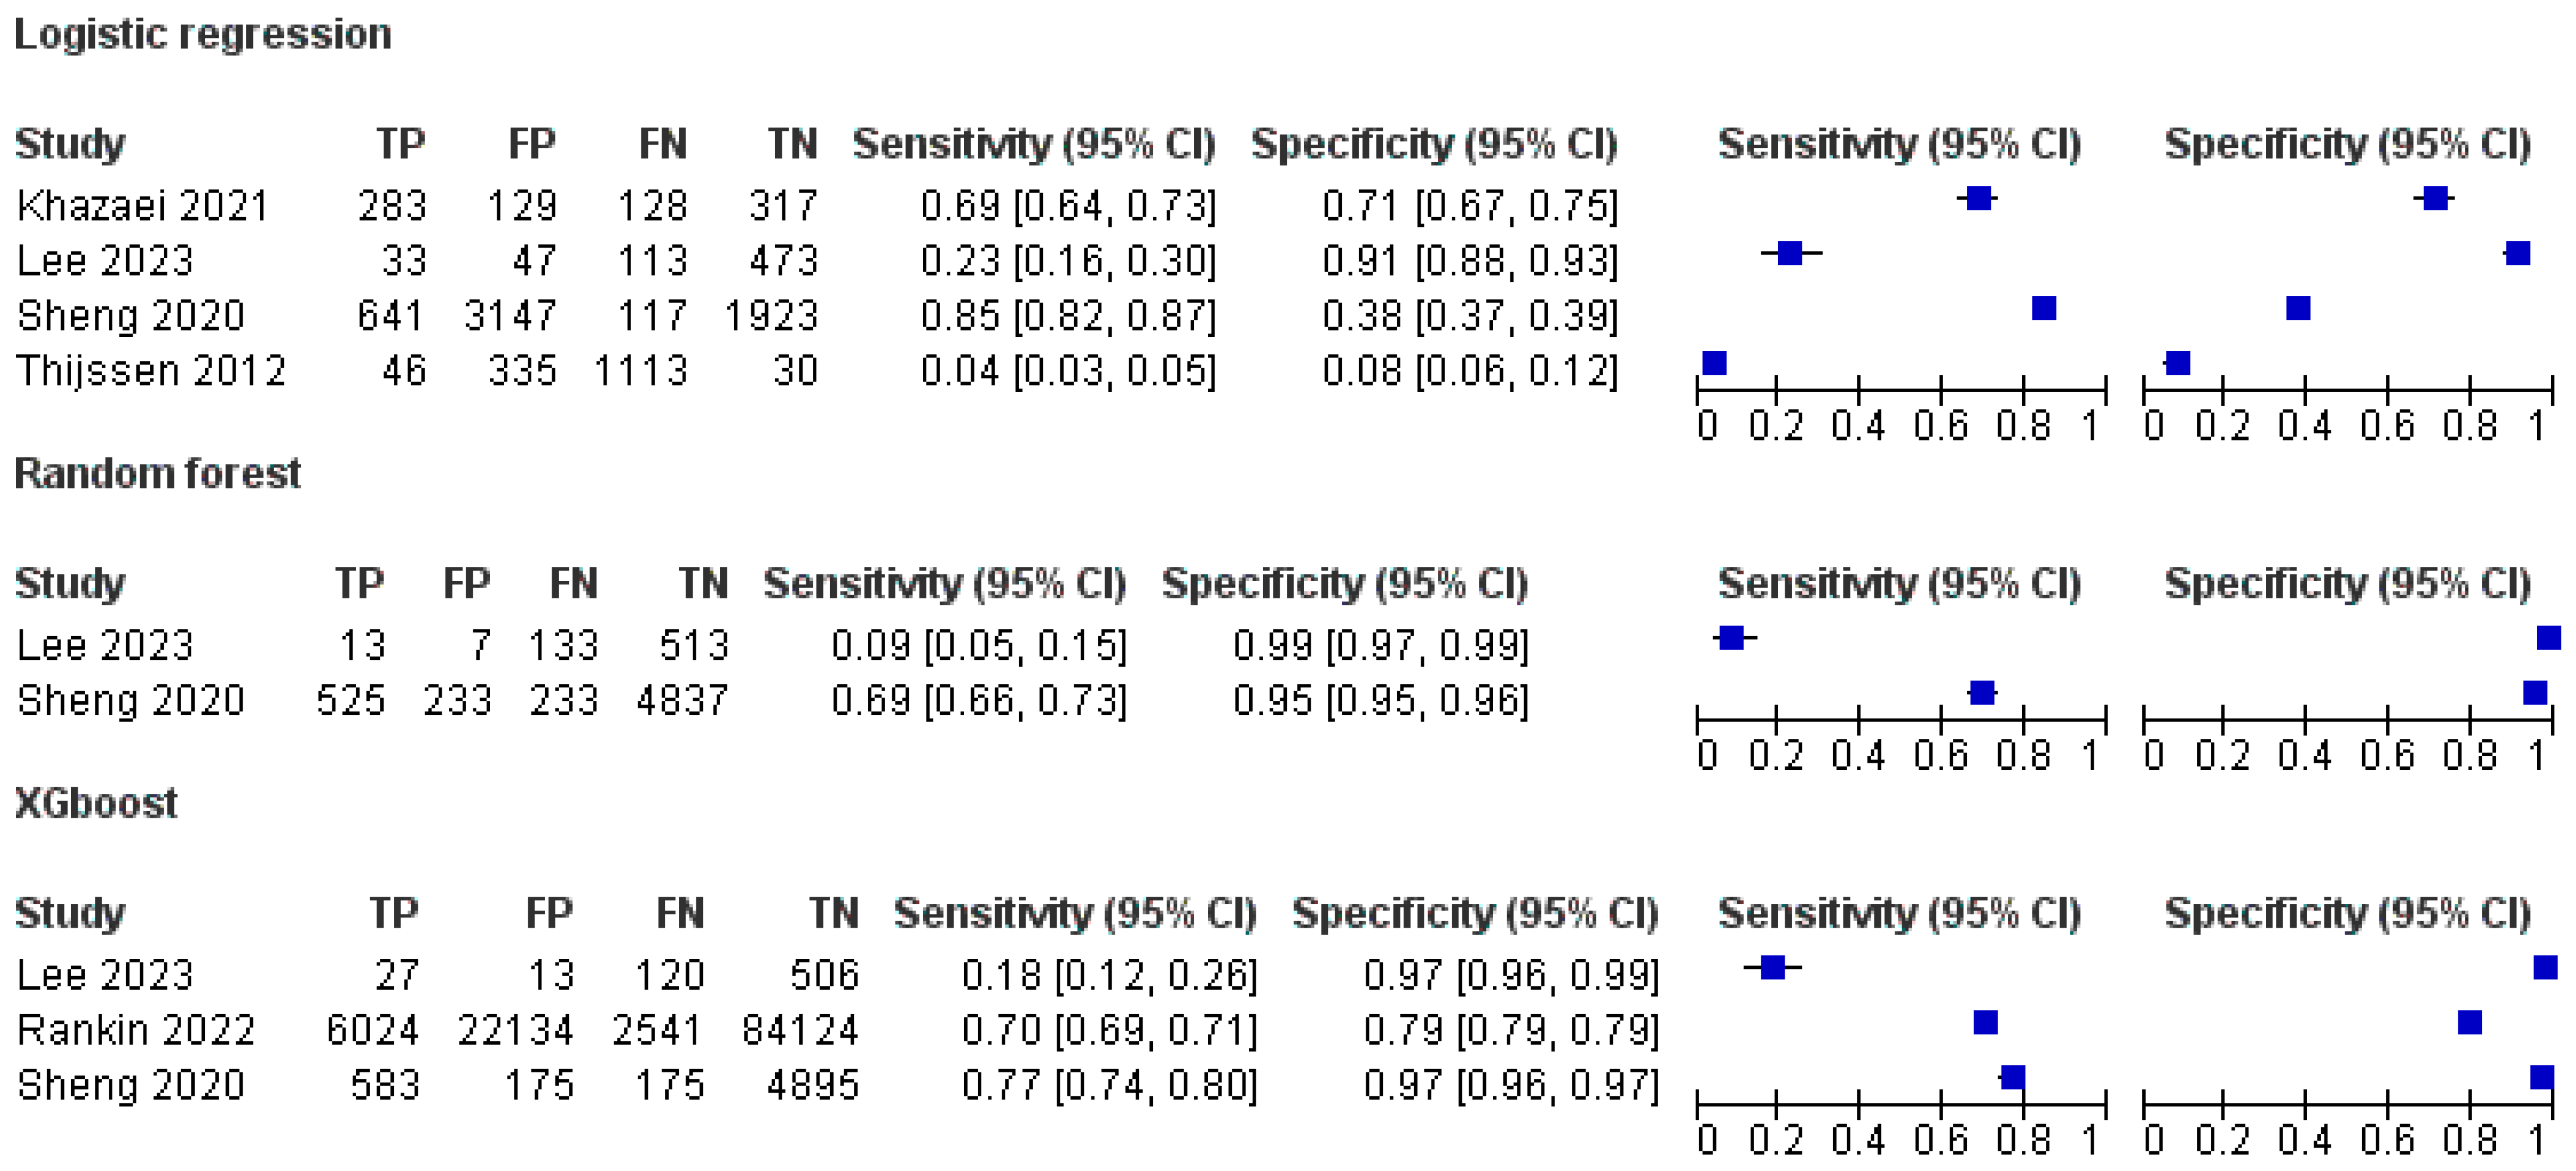
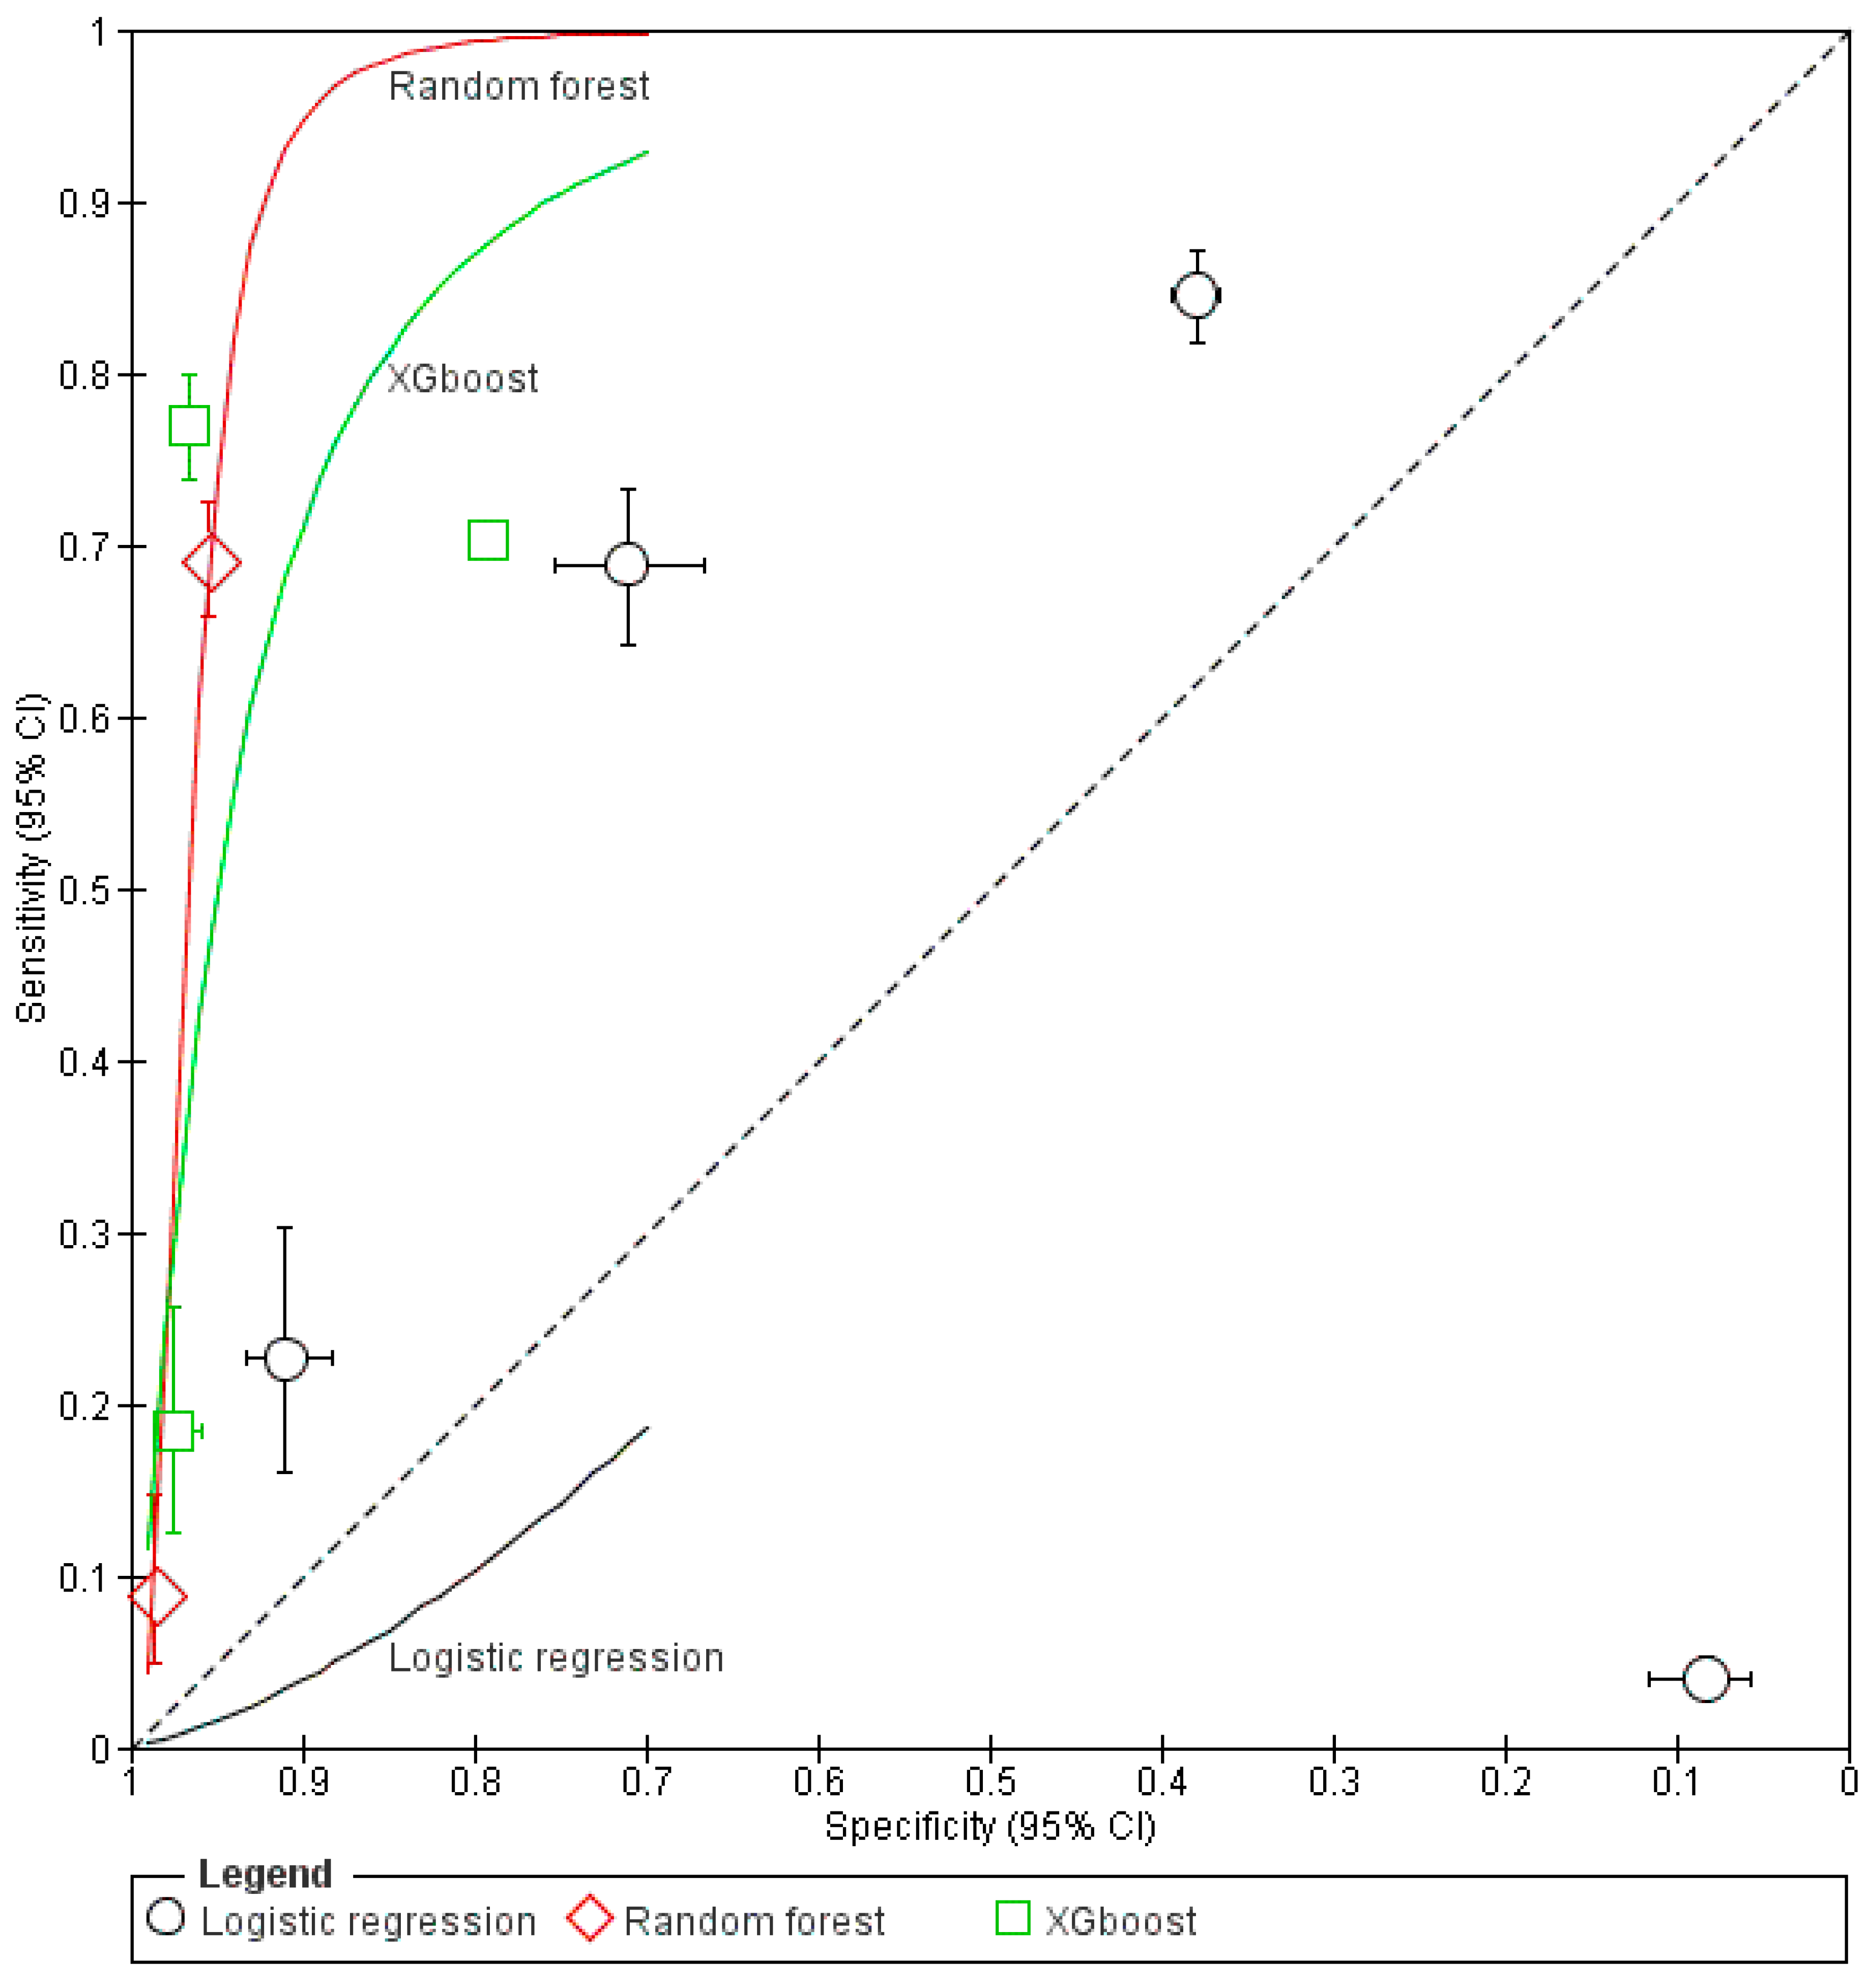
Since Logistic Regression, XGBoost, and Forest Plot were the most frequently assessed models within the included studies, we generated a Forest Plot for the sensitivity and specificity of the models, as shown in Figure 4. In addition, an SROC plot was generated for the three models, along with their 95% CI, as shown in Figure 5.

3.5. Sensitivity and Specificity of ML Models

The sensitivity and specificity of different ML models were reported in four studies [30,32,34,35] and are summarized in Table 4. The highest sensitivity was reported for the linear discriminant analysis model at one-year follow-up. It achieved a sensitivity of 82.81%. However, it demonstrated a very low specificity (37.76%). The lowest sensitivity was reported for the Random Forest model (0%) at one-year follow-up despite its high specificity (100%). The sensitivity of the Random Forest model was improved at two-year follow-up, reaching 9.6% with a specificity of 99.2%.

3.6. Predictive Performance of the Models Based on Area Under the Curve (AUC)

The AUC represents the predictive performance of ML models, which are summarized in Table 5. The highest AUC was reported for the Random Forest model at three-years follow-up (0.89). The lowest AUC was reported for the Decision Tree model at one-year follow-up (0.59).

3.7. Meta-Analysis

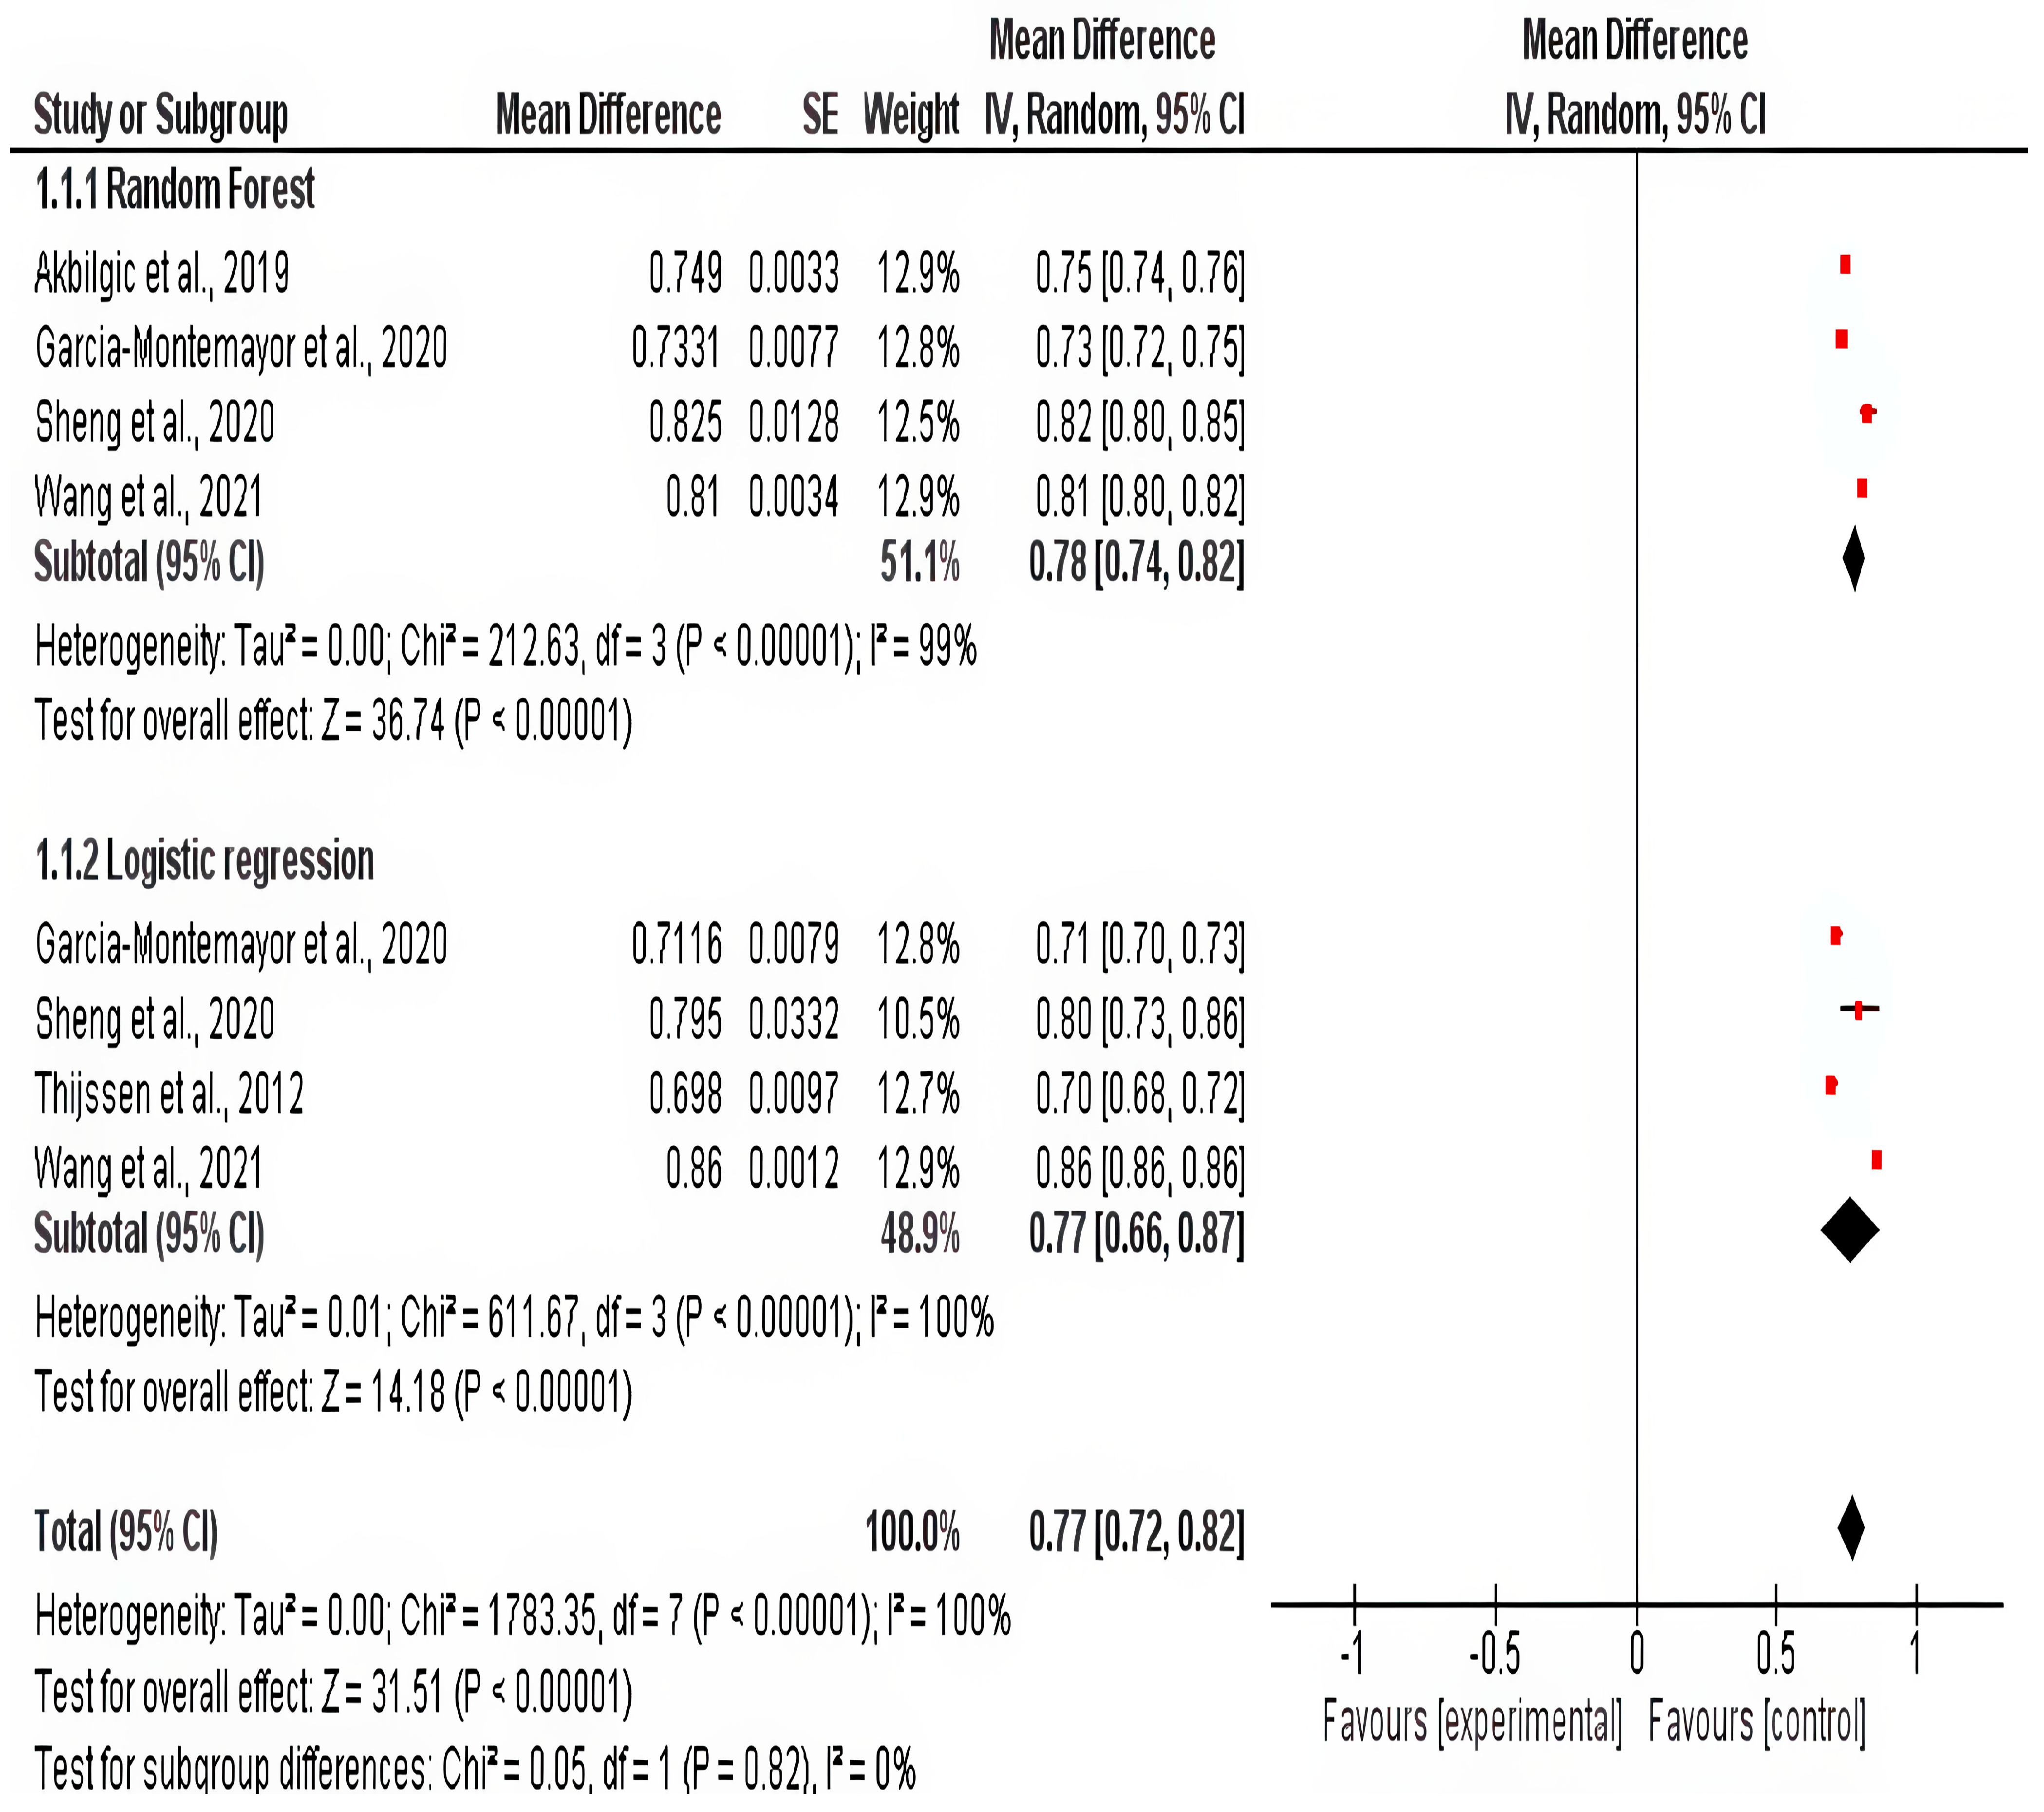
The meta-analysis was conducted to evaluate the predictive performance of ML models, represented by the Area Under the Curve (AUC), for Random Forest and Logistic Regression models at a one-year follow-up. Four studies assessed the Random Forest model, demonstrating significant results, with a pooled mean difference (MD) of 0.78 (95% CI: 0.74–0.82, p < 0.00001) (Figure 6). Similarly, the Logistic Regression model was evaluated in four studies, yielding a pooled MD of 0.77 (95% CI: 0.66–0.87, p < 0.00001).
No significant difference was found between the subgroups of the two models (p = 0.82). However, considerable heterogeneity was observed among the pooled studies (p < 0.0001), which was not resolved through the leave-one-out sensitivity analysis or subgroup analysis.
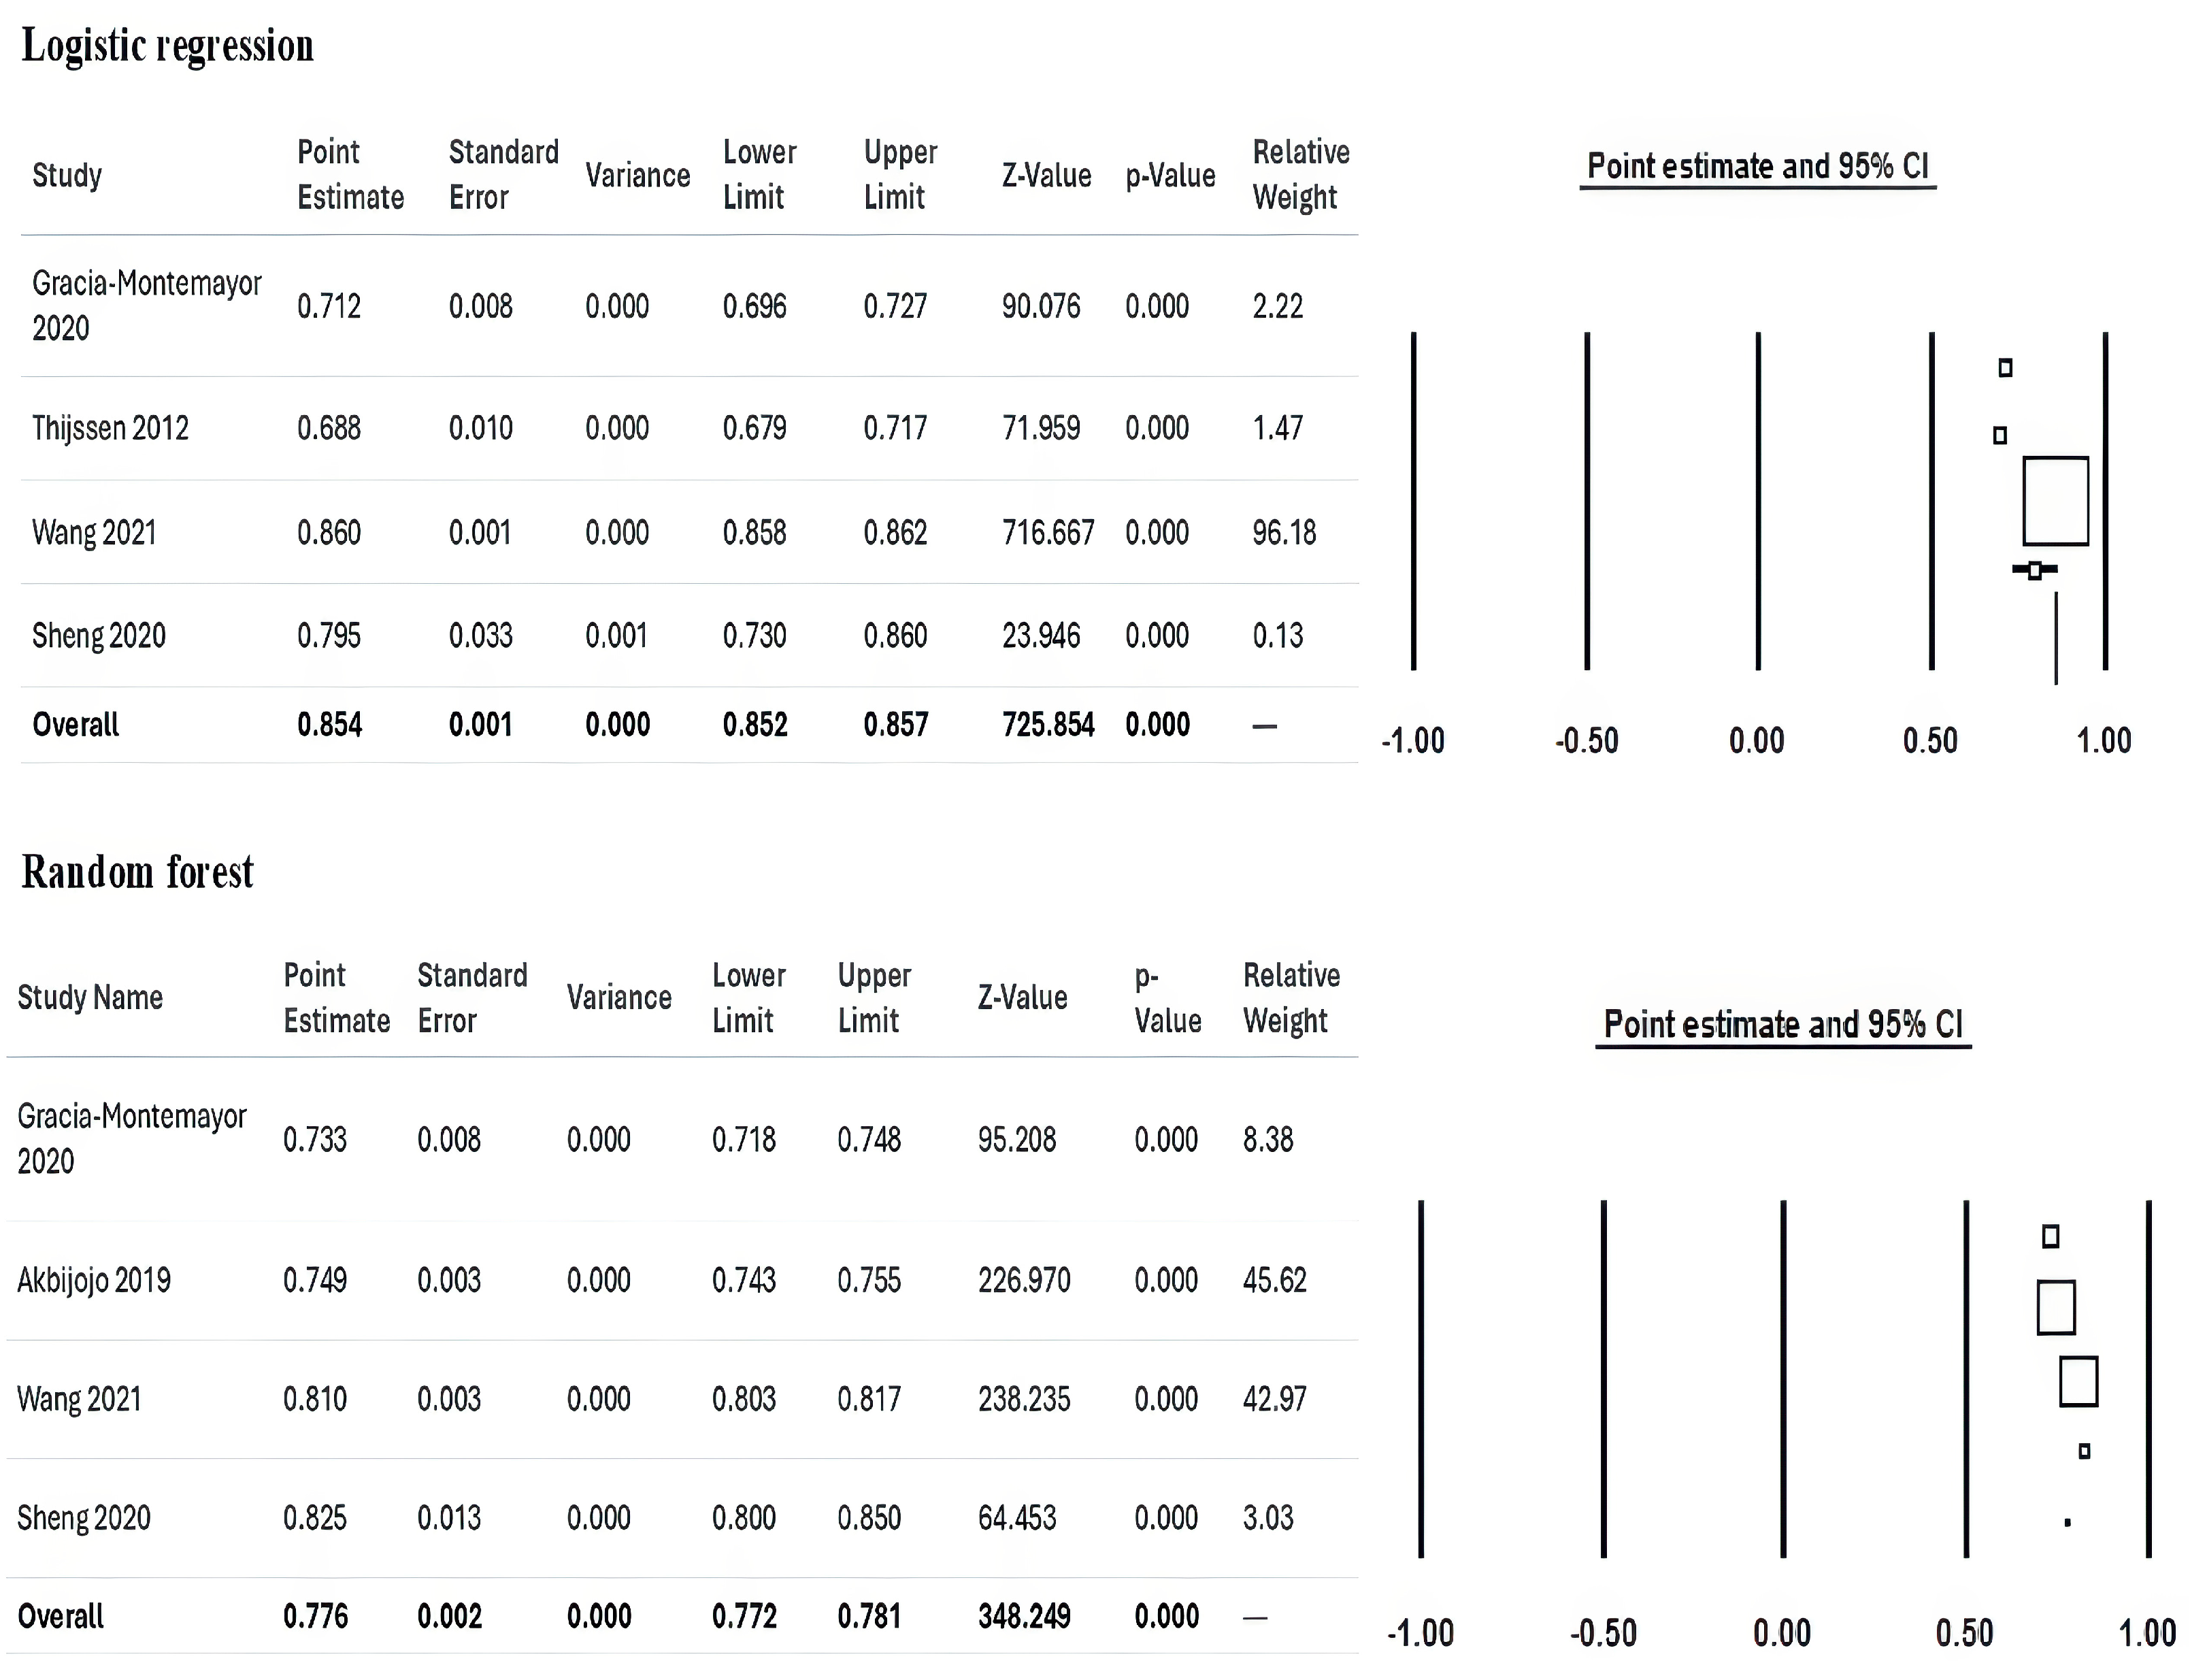
Detailed estimates for each study assessing Random Forest and Logistic Regression, along with their 95% CI, are presented in Figure 7.

Clinical Significance of the Present Study

This study provides valuable insights into the application of machine learning (ML) models for predicting mortality in hemodialysis (HD) patients, a population with high morbidity and mortality rates. By systematically reviewing and analyzing the predictive performance of various ML models, this study highlights their potential to supplement traditional risk prediction tools, particularly in identifying high-risk patients. Accurate early mortality prediction in HD patients is crucial for several reasons, including optimizing resource allocation, tailoring individualized treatment strategies, and potentially improving patient outcomes.
The findings of this study underscore the capability of models such as Random Forest and Logistic Regression to achieve clinically relevant predictive accuracy. For instance, the Random Forest model demonstrated superior performance in long-term follow-up scenarios, achieving an area under the curve (AUC) as high as 0.89. This level of accuracy suggests that ML models can serve as reliable tools in stratifying risk, enabling clinicians to intervene earlier in high-risk cases. Logistic Regression, a more traditional approach, remains a robust and interpretable model for clinicians, reinforcing its utility in settings where simplicity and ease of implementation are prioritized.
Moreover, this review highlights the potential of ML models to incorporate diverse variables, including non-linear relationships, that may not be fully accounted for in traditional models. By doing so, these models can identify previously underappreciated risk factors, offering novel insights into the pathophysiology of mortality in HD patients. For example, factors such as albumin, hemoglobin, and body mass index, which were recurrently identified as key predictors, can inform clinical decision-making and enhance patient monitoring protocols.
This study also emphasizes the importance of advancing personalized medicine in nephrology. ML models can provide individualized risk assessments, tailoring interventions to the specific needs of each patient. This aligns with the broader shift toward precision medicine, where treatments are customized based on unique patient characteristics rather than generalized protocols.

4. Discussion

Artificial intelligence (AI) has expanded across many industries, including healthcare. Advanced algorithms have emerged to address intricate medical scenarios where traditional approaches have encountered limitations [39]. Notably, ML, a subfield of AI, has been integrated into medical registries to enhance the prediction of clinical events, demonstrating superior accuracy compared to human judgment [40]. This underscores the growing potential of AI-driven solutions to revolutionize healthcare by augmenting decision-making and improving patient outcomes.
In this study, we reviewed the predictive performance and characteristics of the ML models investigated in the literature for predicting mortality risk in HD patients at various follow-up points.
Logistic regression showed a predicted true positive mortality rate of 8.23% compared to an actual mortality rate of 10.53%, whereas XGBoost and Random Forest showed predicted true positive mortality rates of 9.93% and 8.94%, respectively, compared to an actual rate of 13.73%. Logistic Regression appears to demonstrate potential for accurately predicting mortality. Nevertheless, it is essential to compare this model with other models trained on the same dataset to ascertain its superiority.
Regarding model sensitivity and specificity, the highest sensitivity was reported for the linear discriminant analysis model at one-year follow-up despite having a very low specificity, while the lowest sensitivity was reported for the Random Forest model at one-year follow-up, despite its high specificity. The sensitivity of the Random Forest model was improved at two-year follow-up.
The highest AUC was reported for the Random Forest model at three-year follow-up (0.89) and the lowest AUC was reported for the Decision Tree model at one-year follow-up (0.59), despite the fact that meta-analysis at one-year follow-up showed no significant sub-group difference between Random Forest and Logistic Regression models.
Khazaei et al., 2021 demonstrated that Logistic Regression achieved the best predictive performance over Decision Tree, Neural Network, and Support Vector Machine [37]. Conversely, other reports contradicted these findings [10,29,32]. For instance, Garcia-Montemayor et al., 2020 reported that mortality prediction models developed using Random Forest demonstrated promising levels of accuracy, with reported area under the curve (AUC) values ranging from 0.68 to 0.73. Furthermore, these models exhibited superior performance as compared to traditional Logistic Regression models at two-year follow-up [10]. Moreover, Lee et al., 2023 and Chaudhuri et al., 2023 reported that Decision Tree, Random Forest, Gradient Boosting, and XGBoost models showed better predictive capabilities in comparison to Logistic Regression [29,32].
The predictive performance of different models depends on various clinical, laboratory, and demographic factors. In particular, Logistic Regression predictions depend primarily on age, type of vascular access, and albumin levels [36,41,42], whereas Random Forest models detected variables as levels of albumin, urea, and hemoglobin, as well as age and BMI as the major predictors of mortality [10]. Therefore, the predictive ability of the models differs according to the variables supplied. In addition, a small sample size may reduce the predictive ability of the model; thus, studies that trained their models with a large dataset may reflect greater accuracy.
The primary strength of this study is that it is the first to review the ML predictors of mortality in HD patients by comparing the AUC, sensitivity, and specificity of the models. In addition, our findings underscore the potential of ML models as valuable tools in the clinical management of hemodialysis patients, a population facing exceedingly high mortality risk. Models like Random Forest, which demonstrated high AUC values (up to 0.89) in certain long-term follow-up scenarios, and Logistic Regression, which remains a robust and interpretable option, show promise for enhancing risk stratification beyond traditional methods. Clinically, the higher AUC of ML models suggests that these models can offer good discriminatory power, potentially aiding clinicians in identifying patients at heightened risk who might benefit from more intensive monitoring, tailored counseling regarding prognosis, or earlier consideration of advanced care planning or specialized interventions.
The ability of ML models to integrate diverse variables and capture non-linear relationships, as highlighted by the recurrent importance of predictors like albumin, hemoglobin, age, and BMI across different studies, can provide clinicians with a more holistic patient assessment. Identifying these key predictors reinforces their clinical relevance and can guide monitoring protocols.

5. Limitations

A major limitation of this study is the significant heterogeneity among the included studies, arising from several sources. First, the studies utilized different machine learning (ML) models, each trained on varying sets of clinical, demographic, and laboratory variables. This variability in feature selection and model design complicates direct comparisons and limits the generalizability of findings. Additionally, the datasets span a wide timeframe, from 1995 to recent years, during which significant advancements in laboratory techniques, data collection practices, and clinical management protocols have occurred. These temporal variations introduce inconsistencies that may affect the predictive performance of the models.
Another limitation is the scarcity of studies evaluating the same ML model at specific follow-up intervals. This scarcity hindered the ability to perform comprehensive subgroup analyses or meta-analyses for all the included models, which could have provided a more robust assessment of their comparative effectiveness. Furthermore, variations in study design, sample sizes, and regional differences in patient populations further contribute to the heterogeneity, making it challenging to draw definitive conclusions.
To address these challenges, we recommend future research prioritize standardizing datasets through collaborative multicenter studies. This involves establishing common data elements and uniform variable definitions, specifying consistent data collection timepoints relative to dialysis initiation, harmonizing laboratory techniques (e.g., using central laboratories or standardized assay protocols and units), employing prospective data collection with standardized electronic tools, and ensuring uniform outcome ascertainment. Such efforts, particularly leveraging prospective designs with modern, standardized laboratory techniques, could mitigate the temporal and methodological biases observed in this review and provide a stronger foundation for evaluating and refining the predictive capabilities of ML models in hemodialysis populations.
Furthermore, our review primarily identified studies using “classic” machine learning algorithms. The absence of studies employing deep learning methods meeting our inclusion criteria suggests this may be an emerging area within hemodialysis mortality prediction that warrants future investigation as more relevant studies become available.

6. Conclusions

This systematic review and meta-analysis indicate that machine learning models, particularly Random Forest and Logistic Regression, hold considerable potential for predicting mortality risk in hemodialysis patients. While some studies reported high discriminatory power, notably Random Forest achieving AUCs up to 0.89 in long-term follow-up, our meta-analysis focused on one-year mortality found no statistically significant difference in pooled AUC between Random Forest and Logistic Regression.
Clinically, these findings suggest that ML tools can supplement existing methods for risk stratification, potentially enabling earlier identification of high-risk individuals who may benefit from tailored interventions and enhanced monitoring. However, the significant heterogeneity observed across studies—stemming from diverse populations, time periods, included features, ML methodologies, and reporting standards—currently limits definitive conclusions about the superiority of any single model and hinders the generalizability of findings.
To advance the field and facilitate reliable clinical implementation, future research should prioritize conducting large-scale, multi-center prospective studies using standardized data collection protocols, including common data elements, harmonized laboratory techniques, and consistent follow-up schedules, to minimize temporal and methodological biases. In addition, performing rigorous head-to-head comparisons of different ML models trained and validated on these shared, standardized datasets.

Author Contributions

Conceptualization, A.C.M. and A.M.; methodology, A.C.M. and N.O.; software, A.C.; validation, A.C.M., N.O. and L.M.; formal analysis, N.O.; investigation, L.M. and L.C.; resources, G.N.P.; data curation, V.M.I.; writing—original draft preparation, A.C.M.; writing—review and editing, A.M., A.M.C.J. and A.A.; visualization, A.C.; supervision, A.S.; project administration, A.M.; funding acquisition, G.N.P. All authors have read and agreed to the published version of the manuscript.

Funding

We would like to acknowledge “Victor Babeș” University of Medicine and Pharmacy Timișoara for their support in covering the costs of publication for this research paper.

Institutional Review Board Statement

Not applicable.

Informed Consent Statement

Not applicable.

Data Availability Statement

The data are available from the corresponding author upon reasonable request.

Conflicts of Interest

The authors declare no conflicts of interest.

References

  1. Himmelfarb, J.; Vanholder, R.; Mehrotra, R.; Tonelli, M. The current and future landscape of dialysis. Nat. Rev. Nephrol. 2020, 16, 573–585. [Google Scholar] [CrossRef]
  2. Yang, Q.Z.C. Timing of dialysis initiation and end-stage kidney disease incidence. JAMA Intern. Med. 2021, 181, 724–725. [Google Scholar] [CrossRef] [PubMed]
  3. Venuta, F.; Rendina, E.A. Combined pulmonary artery and bronchial sleeve resection. Oper. Tech. Thorac. Cardiovasc. Surg. 2008, 13, 260–273. [Google Scholar] [CrossRef]
  4. Lai, A.C.; Bienstock, S.W.; Sharma, R.; Skorecki, K.; Beerkens, F.; Samtani, R.; Coyle, A.; Kim, T.; Baber, U.; Camaj, A.; et al. A Personalized Approach to Chronic Kidney Disease and Cardiovascular Disease: JACC Review Topic of the Week. J. Am. Coll. Cardiol. 2021, 77, 1470–1479. [Google Scholar] [CrossRef]
  5. Karaboyas, A.; Morgenstern, H.; Waechter, S.; Fleischer, N.L.; Vanholder, R.; Jacobson, S.H.; Sood, M.M.; Schaubel, D.E.; Inaba, M.; Pisoni, R.L.; et al. Low hemoglobin at hemodialysis initiation: An international study of anemia management and mortality in the early dialysis period. Clin. Kidney J. 2019, 13, 425–433. [Google Scholar] [CrossRef] [PubMed]
  6. Karaboyas, A.; Morgenstern, H.; Li, Y.; Bieber, B.A.; Hakim, R.; Hasegawa, T.; Jadoul, M.; Schaeffner, E.; Vanholder, R.; Pisoni, R.L.; et al. Estimating the Fraction of First-Year Hemodialysis Deaths Attributable to Potentially Modifiable Risk Factors: Results from the DOPPS. Clin. Epidemiol. 2020, 12, 51. [Google Scholar] [CrossRef]
  7. Saleh, T.; Sumida, K.; Molnar, M.Z.; Potukuchi, P.K.; Thomas, F.; Lu, J.L.; Gyamlani, G.G.; Streja, E.; Kalantar-Zadeh, K.; Kovesdy, C.P. Effect of Age on the Association of Vascular Access Type with Mortality in a Cohort of Incident End-Stage Renal Disease Patients. Nephron 2017, 137, 57–63. [Google Scholar] [CrossRef]
  8. Wick, J.P.; Turin, T.C.; Faris, P.D.; MacRae, J.M.; Weaver, R.G.; Tonelli, M.; Manns, B.J.; Hemmelgarn, B.R. A Clinical Risk Prediction Tool for 6-Month Mortality After Dialysis Initiation Among Older Adults. Am. J. Kidney Dis. 2017, 69, 568–575. [Google Scholar] [CrossRef] [PubMed]
  9. Jassal, S.V.; Karaboyas, A.; Comment, L.A.; Bieber, B.A.; Morgenstern, H.; Sen, A.; Gillespie, B.W.; De Sequera, P.; Marshall, M.R.; Fukuhara, S.; et al. Functional Dependence and Mortality in the International Dialysis Outcomes and Practice Patterns Study (DOPPS). Am. J. Kidney Dis. 2016, 67, 283–292. [Google Scholar] [CrossRef]
  10. Garcia-Montemayor, V.; Martin-Malo, A.; Barbieri, C.; Bellocchio, F.; Soriano, S.; de Mier, V.P.R.; Molina, I.R.; Aljama, P.; Rodriguez, M. Predicting mortality in hemodialysis patients using machine learning analysis. Clin. Kidney J. 2021, 14, 1388. [Google Scholar] [CrossRef]
  11. Kasza, J.; Wolfe, R.; McDonald, S.P.; Marshall, M.R.; Polkinghorne, K.R. Dialysis modality, vascular access and mortality in end-stage kidney disease: A bi-national registry-based cohort study. Nephrology 2016, 21, 878–886. [Google Scholar] [CrossRef] [PubMed]
  12. Chen, Y.M.; Wang, Y.C.; Hwang, S.J.; Lin, S.H.; Wu, K.D. Patterns of Dialysis Initiation Affect Outcomes of Incident Hemodialysis Patients. Nephron 2015, 132, 33–42. [Google Scholar] [CrossRef] [PubMed]
  13. Bradbury, B.D.; Fissell, R.B.; Albert, J.M.; Anthony, M.S.; Critchlow, C.W.; Pisoni, R.L.; Port, F.K.; Gillespie, B.W. Predictors of Early Mortality among Incident US Hemodialysis Patients in the Dialysis Outcomes and Practice Patterns Study (DOPPS). Clin. J. Am. Soc. Nephrol. 2007, 2, 89–99. [Google Scholar] [CrossRef]
  14. Canaud, B.; Tong, L.; Tentori, F.; Akiba, T.; Karaboyas, A.; Gillespie, B.; Akizawa, T.; Pisoni, R.L.; Bommer, J.; Port, F.K. Clinical practices and outcomes in elderly hemodialysis patients: Results from the Dialysis Outcomes and Practice Patterns Study (DOPPS). Clin. J. Am. Soc. Nephrol. 2011, 6, 1651–1662. [Google Scholar] [CrossRef] [PubMed]
  15. Foley, R.N.; Parfrey, P.S.; Hefferton, D.; Singh, I.; Simms, A.; Barrett, B.J. Advance Prediction of Early Death in Patients Starting Maintenance Dialysis. Am. J. Kidney Dis. 1994, 23, 836–845. [Google Scholar] [CrossRef]
  16. Wagner, M.; Ansell, D.; Kent, D.M.; Griffith, J.L.; Naimark, D.; Wanner, C.; Tangri, N. Predicting mortality in incident dialysis patients: An analysis of the United Kingdom Renal Registry. Am. J. Kidney Dis. 2011, 57, 894–902. [Google Scholar] [CrossRef]
  17. Chen, J.Y.; Tsai, S.H.; Chuang, P.H.; Chang, C.H.; Chuang, C.L.; Chen, H.L.; Chen, P.L. A comorbidity index for mortality prediction in Chinese patients with ESRD receiving hemodialysis. Clin. J. Am. Soc. Nephrol. 2014, 9, 513–519. [Google Scholar] [CrossRef]
  18. Couchoud, C.G.; Beuscart, J.B.R.; Aldigier, J.C.; Brunet, P.J.; Moranne, O.P. Development of a risk stratification algorithm to improve patient-centered care and decision making for incident elderly patients with end-stage renal disease. Kidney Int. 2015, 88, 1178–1186. [Google Scholar] [CrossRef]
  19. Couchoud, C.; Labeeuw, M.; Moranne, O.; Allot, V.; Esnault, V.; Frimat, L.; Stengel, B.; French Renal Epidemiology and Information Network (REIN) registry. A clinical score to predict 6-month prognosis in elderly patients starting dialysis for end-stage renal disease. Nephrol. Dial. Transplant. 2009, 24, 1553–1561. [Google Scholar] [CrossRef]
  20. Hsu, J.Y.; Roy, J.A.; Xie, D.; Yang, W.; Shou, H.; Anderson, A.H.; Landis, J.R.; Jepson, C.; Wolf, M.; Isakova, T.; et al. Statistical Methods for Cohort Studies of CKD: Survival Analysis in the Setting of Competing Risks. Clin. J. Am. Soc. Nephrol. 2017, 12, 1181–1189. [Google Scholar] [CrossRef]
  21. Lancet, T. Artificial intelligence in health care: Within touching distance. Lancet 2017, 390, 2739. [Google Scholar] [CrossRef]
  22. Genuer, R.; Poggi, J.M.; Tuleau-Malot, C. Variable selection using random forests. Pattern Recognit. Lett. 2010, 31, 2225–2236. [Google Scholar] [CrossRef]
  23. Matsuki, K.; Kuperman, V.; Van Dyke, J.A. The Random Forests statistical technique: An examination of its value for the study of reading. Sci. Stud. Read. 2016, 20, 20–33. [Google Scholar] [CrossRef]
  24. Dankowski, T.; Ziegler, A. Calibrating random forests for probability estimation. Stat. Med. 2016, 35, 3949–3960. [Google Scholar] [CrossRef] [PubMed]
  25. Su, X.; Peña, A.T.; Liu, L.; Levine, R.A. Random forests of interaction trees for estimating individualized treatment effects in randomized trials. Stat. Med. 2018, 37, 2547–2560. [Google Scholar] [CrossRef] [PubMed]
  26. Moher, D.; Liberati, A.; Tetzlaff, J.; Altman, D.G.; Group, P. Preferred reporting items for systematic reviews and meta-analyses: The PRISMA statement. PLoS Med. 2009, 6, e1000097. [Google Scholar] [CrossRef]
  27. Brooker, J.; Synnot, A.; McDonald, S.; Elliott, J.; Turner, T.; Hodder, R.; Weeks, L.; Ried, J.; MacLehose, H.; Akl, E.; et al. Guidance for the Production and Publication of Cochrane Living Systematic Reviews: Cochrane Reviews in Living Mode; Cochrane Community: London, UK, December 2019: 60. Available online: https://community.cochrane.org/sites/default/files/uploads/inline-files/Transform/201912_LSR_Revised_Guidance.pdf (accessed on 9 May 2025).
  28. Whiting, P.F.; Rutjes, A.W.S.; Westwood, M.E.; Mallett, S.; Deeks, J.J.; Reitsma, J.B.; Leeflang, M.M.; Sterne, J.A.; Bossuyt, P.M.; QUADAS-2 Group. Quadas-2: A revised tool for the quality assessment of diagnostic accuracy studies. Ann. Intern. Med. 2011, 155, 529–536. [Google Scholar] [CrossRef] [PubMed]
  29. Chaudhuri, S.; Larkin, J.; Guedes, M.; Jiao, Y.; Kotanko, P.; Wang, Y.; Usvyat, L.; Kooman, J.P. Predicting mortality risk in dialysis: Assessment of risk factors using traditional and advanced modeling techniques within the Monitoring Dialysis Outcomes initiative. Hemodial. Int. 2023, 27, 62–73. [Google Scholar] [CrossRef]
  30. Sheng, K.; Zhang, P.; Yao, X.; Li, J.; He, Y.; Chen, J. Prognostic machine learning models for first-year mortality in incident hemodialysis patients: Development and validation study. JMIR Med. Inform. 2020, 8, e20578. [Google Scholar] [CrossRef]
  31. Akbilgic, O.; Obi, Y.; Potukuchi, P.K.; Karabayir, I.; Nguyen, D.V.; Soohoo, M.; Streja, E.; Molnar, M.Z.; Rhee, C.M.; Kalantar-Zadeh, K.; et al. Machine learning to identify dialysis patients at high death risk. Kidney Int. Rep. 2019, 4, 1219–1229. [Google Scholar] [CrossRef]
  32. Lee, W.T.; Fang, Y.W.; Chang, W.S.; Hsiao, K.Y.; Shia, B.C.; Chen, M.; Tsai, M.H. Data-driven, two-stage machine learning algorithm-based prediction scheme for assessing 1-year and 3-year mortality risk in chronic hemodialysis patients. Sci. Rep. 2023, 13, 21453. [Google Scholar] [CrossRef]
  33. Mauri, J.M.; Cleries, M.; Vela, E.; Registry, C.R. Design and validation of a model to predict early mortality in haemodialysis patients. Nephrol. Dial. Transplant. 2008, 23, 1690–1696. [Google Scholar] [CrossRef] [PubMed]
  34. Thijssen, S.; Usvyat, L.; Kotanko, P. Prediction of mortality in the first two years of hemodialysis: Results from a validation study. Blood Purif. 2012, 33, 165–170. [Google Scholar] [CrossRef]
  35. Rankin, S.; Han, L.; Scherzer, R.; Tenney, S.; Keating, M.; Genberg, K.; Rahn, M.; Wilkins, K.; Shlipak, M.; Estrella, M. A machine learning model for predicting mortality within 90 days of dialysis initiation. Kidney360 2022, 3, 1556–1565. [Google Scholar] [CrossRef] [PubMed]
  36. Wang, Y.; Zhu, Y.; Lou, G.; Zhang, P.; Chen, J.; Li, J. A maintenance hemodialysis mortality prediction model based on anomaly detection using longitudinal hemodialysis data. J. Biomed. Inform. 2021, 123, 103930. [Google Scholar] [CrossRef]
  37. Khazaei, S.; Najafi-GhOBADI, S.; Ramezani-Doroh, V. Construction data mining methods in the prediction of death in hemodialysis patients using support vector machine, neural network, logistic regression and decision tree. J. Prev. Med. Hyg. 2021, 62, E222. [Google Scholar]
  38. Gotta, V.; Tancev, G.; Marsenic, O.; Vogt, J.E.; Pfister, M. Identifying key predictors of mortality in young patients on chronic haemodialysis—A machine learning approach. Nephrol. Dial. Transplant. 2021, 36, 519–528. [Google Scholar] [CrossRef]
  39. Hueso, M.; Vellido, A.; Montero, N.; Barbieri, C.; Ramos, R.; Angoso, M.; Cruzado, J.M.; Jonsson, A. Artificial intelligence for the artificial kidney: Pointers to the future of a personalized hemodialysis therapy. Kidney Dis. 2018, 4, 1–9. [Google Scholar] [CrossRef] [PubMed]
  40. Krumholz, H.M. Big data and new knowledge in medicine: The thinking, training, and tools needed for a learning health system. Health Aff. 2014, 33, 1163–1170. [Google Scholar] [CrossRef]
  41. Pisoni, R.L.; Gillespie, B.W.; Dickinson, D.M.; Chen, K.; Kutner, M.H.; Wolfe, R.A. The Dialysis Outcomes and Practice Patterns Study (DOPPS): Design, data elements, and methodology. Am. J. Kidney Dis. 2004, 44, 7–15. [Google Scholar] [CrossRef]
  42. Chan, K.E.; Maddux, F.W.; Tolkoff-Rubin, N.; Karumanchi, S.A.; Thadhani, R.; Hakim, R.M. Early outcomes among those initiating chronic dialysis in the United States. Clin. J. Am. Soc. Nephrol. 2011, 6, 2642–2649. [Google Scholar] [CrossRef] [PubMed]
Figure 1. Flowchart of the study selection process. ** Records excluded** (n = 6089) due to irrelevance at title and abstract screening.
Applsci 15 05776 g001
Figure 2. Risk of bias summary of the included studies [10,29,30,31,32,33,34,35,36,37,38].
Applsci 15 05776 g002
Figure 3. Risk of bias graph of the included studies.
Applsci 15 05776 g003
Figure 4. Summary Receiver Operating Characteristic (SROC) curve for logistic regression [30,32,34,37], XGBoost [30,32] and Random Forest [30,32,34] in predicting mortality at 1-year follow-up. Each data point corresponds to an individual study’s sensitivity and specificity. The curve represents the trade-off between sensitivity and specificity across various decision thresholds. A curve closer to the top-left corner indicates better overall diagnostic performance.
Applsci 15 05776 g004
Figure 5. Summary Receiver Operating Characteristic (SROC) curves for logistic regression (black), Random Forest (red), and XGBoost (green) in predicting mortality among hemodialysis patients. Each symbol (circle, square, or diamond) represents the sensitivity and specificity reported by an individual study, with horizontal and vertical bars indicating 95% confidence intervals. The diagonal line from the lower-left to the upper-right corner marks chance-level performance (AUC = 0.5). Curves that track closer to the top-left corner reflect higher overall discriminative power (i.e., better sensitivity and specificity). In this analysis, Random Forest shows the highest AUC, followed by XGBoost, while Logistic Regression demonstrates slightly lower—but still clinically meaningful—performance.
Applsci 15 05776 g005
Figure 6. Forest plot of mortality prediction at 1-year follow-up. Random forrest [10,30,31,36] and Logistic regression [10,30,34,36].
Applsci 15 05776 g006
Figure 7. Detailed estimates and 95% confidence intervals for each study investigating the Random Forest [10,30,31,36] and Logistic Regression [10,30,31,36] models at 1 year of follow-up.
Applsci 15 05776 g007
Table 1. Summary of the included studies.
StudyDesignCountryPeriodSample SizeML ModelsSummary
Garcia-Montemayor (2020) [10]Retrospective CohortSpain1995–20151571Random Forest, Logistic RegressionRandom Forest showed superior performance over logistic regression for mortality prediction in hemodialysis (HD) patients.
Chaudhuri (2023) [29]Retrospective CohortMulticenterNot Specified95,142XGBoost, Logistic RegressionDeveloped ML and traditional models for 3-year mortality risk classification in prevalent HD patients, demonstrating good accuracy.
Sheng (2020) [30]Retrospective CohortChina2007–20195828Various ML Models (e.g., Adaptive Boosting, XGBoost)Developed and validated ML models to stratify first-year mortality risk in HD patients, aiding early risk identification.
Akbilgic (2019) [31]Retrospective CohortUS2007–201427,615Random ForestAccurately predicted short-term mortality in incident ESRD patients, supporting clinical decision-making.
Lee (2023) [32]Retrospective CohortTaiwan2006–2012800Logistic Regression, Decision Tree, XGBoostProvided insights for nephrologists on short-term mortality risks, enhancing patient-centered decision-making.
Mauri (2008) [33]Retrospective CohortSpain1997–2003946Logistic RegressionDeveloped a prognostic model for 1-year mortality, highlighting modifiable risk factors for targeted interventions.
Thijssen (2012) [34]Retrospective CohortUS2000–20092326Logistic RegressionSuggested potential for prediction models to evolve into alert systems for timely intervention in high-risk patients.
Rankin (2022) [35]Retrospective CohortUS2008–2017345,305XGBoostDeveloped an XGBoost model with excellent calibration for early mortality prediction post-dialysis initiation.
Wang (2021) [36]Retrospective CohortChina2007–20161200Multiple ML Models (e.g., SVM, LSTM)Employed anomaly detection with LSTM autoencoder, effectively identifying high-risk patients using longitudinal HD data.
Khazaei (2021) [37]Retrospective CohortIran2007–2017758Decision Tree, SVM, Logistic RegressionLogistic Regression outperformed other models; key predictors included gender, age, iron levels, CRP status, and URR.
Gotta (2020) [38]Retrospective CohortUS2004–2016363Random ForestIdentified key predictors (e.g., LDH, RDW) in pediatric HD patients, emphasizing the need for tailored management strategies.
Table 2. Baseline characteristics of the patients within the included studies.
Study IDAgeMalesBMIAlbumin (g/dL)Sodium (mEq/L)Potassium (mEq/L)Calcium (mg/dL)Phosphorus (mg/dL)Creatinine (mg/dL)Hemoglobin (g/dL)
Garcia-Montemayor 2020 [10]62.33 ± 15.89 *953 (61%)27.1± 5.413.54± 0.55NR4.91 ± 0.899.04 ± 3.885.04 ± 1.667.3 ± 4.410.08 ± 2.79
Chaudhuri 2023 [29]61.73 ± 15.08 *54.611 (57.4%)25.13 ± 5.533.78± 0.42NR4.87 ± 0.628.86 ± 0.644.27 ± 1.597.40 ± 2.48NR
Sheng 2020 [30]62.53 ± 62.45 *3524 (60.47%)21.73 ± 21.833.6 ± 0.68NRNRNRNR12.9 ± 6.1NR
Akbilgic 2019 [31]68.7 ± 11.2 *27,101 (98.1%)29.9 ± 6.73.4 ± 0.7138.9 ± 3.8NRNRNRNRNR
Lee 2023 [32]63.30 ± 13.26 *405 (50.63%)NRNR139.28 ± 3.704.70 ± 0.69NR5.20 ± 1.489.41 ± 2.310.31 ± 1.49
Mauri 2008 [33]64.6 ± 14.4 *3567 (62.2%)NRNRNRNRNRNRNRNR
Thijssen 2012 [34]61.7 ± 15.5 *1314 (56.5%)NR3.7 ± 0.4138.5 ± 2.6NRNR5.2 ± 1.27.3 ± 2.711.7 ± 1.1
Rankin 2022 [35]63± 15 *198,347 (57.4%)30 ± 683.2 ± 0.7NRNRNRNR6.46 ± 3.529.66 ±1.64
Wang 2021 [36]52.69 ±16.94 *665 (63.03%)NRNRNRNRNRNRNRNR
Khazaei 2021[37]50.29 ± 15.73 *464 (54.2%)23.09 ± 4.213.74 ± 0.73138.78 ± 6.84.9 ± 0.948.9 ± 0.905.11 ± 1.55NR10.48 ± 2.06
Gotta 2020 [38]12.7(9–28.7) **1473 (55%)NR4 ± 0.45NRNRNRNR9.9 ± 4.3811.43 ± 1.79
NR: not reported, Values are provided as * means ± SD, median (25th–75th percentile) **, and number (%).
Table 3. Prediction of positive and negative cases.
StudyFollow-UpML ModelTrue PositiveFalse PositiveTrue NegativeFalse NegativeTotalPatients Died
Sheng 2020 [30]1 yearAdaptive Boosting52535047202335828764
Decision Tree46611749542915828764
Gradient Boosting52511649542335828764
K-Nearest Neighbor4085850123505828764
Light Gradient Boosting58317548951755828764
Logistic Regression641314719231175828764
Random Forest52523348372335828764
XGBoost58317548951755828764
Lee 2023 [32]1 yearLogistic Regression0236914676042
Decision Tree8156993876042
Random Forest007144676042
Gradient Boosting007144676042
XGBoost0236924576042
3 yearsLogistic Regression3347473113666147
Random Forest137513133666147
Gradient Boosting2713506120666147
XGBoost2713506120666147
Thijssen 2012 [34]7–12 monthsLogistic Regression935351651472326133
13–18 monthsLogistic Regression754483713061866121
19–24 monthsLogistic Regression46335301113152480
Rankin 2022 [35]3 monthsXGBoost602422,13484,1242541114,82386,083
Khazaei 2021 [37]2.29 yearsDecision Tree267145300145857408
Neural Network241128317171857408
Support Vector Machine274137309137857408
Logistic Regression283129317128857408
Table 4. Sensitivity and specificity of ML models.
StudyFollow UpML ModelSensitivitySpecificity
Sheng 2020 [30]1 yearAdaptive Boosting72.3393.45
Decision Tree63.5297.45
Gradient Boosting67.9297.97
k-Nearest Neighbor52.298.89
Linear Discriminant Analysis82.8137.76
Light Gradient Boosting75.6896.86
Logistic Regression81.7637.58
Random Forest70.0294.86
XGBoost78.6296.92
Lee 2023 [32]1 yearLogistic Regression4.496.7
Decision Tree15.698.3
Random Forest0100
Gradient Boosting2.299.9
XGBoost4.496.7
3 yearsLogistic Regression24.391.6
Decision Tree28.686.5
Random Forest9.699.2
Gradient Boosting17.197
XGBoost17.597
Thijssen 2012 [34]7–12 monthsLogistic Regression6575
13–18 monthsLogistic Regression6974
19–24 monthsLogistic Regression5877
Rankin 2022 [35]3 monthsXGBoost70.379.1
Support Vector Machine6670
Logistic Regression6972
Table 5. Summary of the predictive performance of ML levels based on the AUC and 95% CI.
StudyFollow UpML ModelAUC95% CI
LLUL
Garcia-Montemayor 2020 [10]6 monthsRandom Forest0.70.680.72
1 year0.730.720.75
2 years0.730.710.74
6 monthsLogistic Regression0.690.670.71
1 year0.710.70.73
2 years0.690.670.7
Chaudhuri 2023 [29]3 yearsXGBoost0.8NRNR
3 yearsLogistic Regression0.75NRNR
Sheng 2020 [30]1 yearAdaptive Boosting0.830.80.84
Gradient Boosting0.840.820.85
K-Nearest Neighbor0.820.810.86
Light Gradient Boosting0.850.80.85
Logistic Regression0.730.730.86
Random Forest0.820.80.85
XGBoost0.850.810.86
Akbilgic 2019 [31]1 monthRandom Forest0.7190.6990.738
3 months0.7450.7350.755
6 months0.7500.7430.758
1 year0.7490.7420.755
Lee 2023 [32]1 yearLogistic Regression0.734NRNR
Decision Tree0.59NRNR
Random Forest0.806NRNR
Gradient Boosting0.793NRNR
XGBoost0.734NRNR
3 yearsLogistic Regression0.756NRNR
Decision Tree0.66NRNR
Random Forest0.763NRNR
Gradient Boosting0.773NRNR
XGBoost0.788NRNR
Mauri 2008 [33]1 yearLogistic Regression0.78NRNR
Thijssen 2012 [34]7–12 monthsLogistic Regression0.6980.6790.717
13–18 monthsLogistic Regression0.7170.6960.737
19–24 monthsLogistic Regression0.670.6460.694
Wang 2021 [36]3 monthsLogistic Regression0.80.7970.802
6 months0.770.7680.772
1 year0.860.85770.8623
3 monthsSupport Vector Machine0.770.76670.7733
6 months0.750.74840.7516
1 year0.80.79820.8018
3 monthsRandom Forest0.840.83650.8435
6 months0.810.80840.8116
1 year0.810.80340.8166
Gotta 2020 [38]3 yearsRandom Forest0.89NRNR
5 years0.82NRNR
8 years0.77NRNR
NR: not reported.
Disclaimer/Publisher’s Note: The statements, opinions and data contained in all publications are solely those of the individual author(s) and contributor(s) and not of MDPI and/or the editor(s). MDPI and/or the editor(s) disclaim responsibility for any injury to people or property resulting from any ideas, methods, instructions or products referred to in the content.