Article

A Meta-Learning-Based Recognition Method for Multidimensional Feature Extraction and Fusion of Underwater Targets

1
Xi’an Precision Machinery Research Institute, Xi’an 710077, China
2
School of Marine Science and Technology, Northwestern Polytechnical University, Xi’an 710072, China
*
Author to whom correspondence should be addressed.
Appl. Sci. 2025, 15(10), 5744; https://doi.org/10.3390/app15105744
Submission received: 22 April 2025 / Revised: 15 May 2025 / Accepted: 17 May 2025 / Published: 21 May 2025
(This article belongs to the Special Issue Computer Vision and Deep Learning for Activity Recognition)

Abstract

:
To tackle the challenges of relative attitude adaptability and limited sample availability in underwater moving target recognition for active sonar, this study focuses on key aspects such as feature extraction, network model design, and information fusion. A pseudo-three-dimensional spatial feature extraction method is proposed by integrating generalized MUSIC with range–dimension information. The pseudo-WVD time–frequency feature is enhanced through the incorporation of prior knowledge. Additionally, the Doppler frequency shift distribution feature for underwater moving targets is derived and extracted. A multidimensional feature information fusion network model based on meta-learning is developed. Meta-knowledge is extracted separately from spatial, time–frequency, and Doppler feature spectra, to improve the generalization capability of single-feature task networks during small-sample training. Multidimensional feature information fusion is achieved via a feature fusion classifier. Finally, a sample library is constructed using simulation-enhanced data and experimental data for network training and testing. The results demonstrate that, in the few-sample scenario, the proposed method leverages the complementary nature of multidimensional features, effectively addressing the challenge of limited adaptability to relative horizontal orientation angles in target recognition, and achieving a recognition accuracy of up to 97.1%.

1. Introduction

Interference mitigation and the enhancement of environmental adaptability are the primary research focuses in the active sonar target recognition field. Interference factors mainly include various forms of responsive and co-frequency interferences. Environmental factors primarily involve variations in the target’s relative attitude, fluctuations in the underwater acoustic channel, and interface reverberation, among others. Specifically, the relative attitude of the target can be formally defined as the angular difference between the observation direction and the orientation of the target’s tail. This parameter plays a critical role in analyzing the scattering characteristics of targets within sonar systems and can be further categorized into the relative horizontal azimuth angle (RHOA) and relative pitch angle (RPA). This study primarily investigates the adaptability of the RHOA in active sonar systems. Traditional target recognition methods based on parameter estimation [1,2,3] exhibit limitations such as a relatively short effective range, insufficient environmental adaptability, and restricted capability to resolve interferences. In recent years, the integration of feature extraction with deep learning techniques for underwater target recognition has emerged as a significant research focus.
The recognition method, which focuses on extracting the geometric structural features of targets, has garnered significant attention in the field. As reported by the authors of [4,5], algorithms of high-resolution DOA estimation have been utilized to estimate the geometric structures of underwater targets, with experimental validation carried out in an anechoic water tank. Chirplet atom decomposition was adopted to improve the extraction of geometric features from underwater targets [6]. In [7,8], forward-looking imaging sonar was employed to acquire images and achieve target recognition. These studies primarily concentrated on static underwater targets. In contrast, a novel approach was proposed for extracting the highlight images of moving underwater targets, with the effectiveness of the algorithm being validated through experimental data [9].
The extraction of time–frequency features is one of the key research areas in underwater target recognition, as it reflects the scattering distribution characteristics of the target and requires a relatively low signal-to-noise ratio. As reported by the authors of [10,11], the WVD time–frequency features of underwater target echoes were extracted, and the algorithm was validated using scaled pool model data. As conducted by the authors of [12,13], the STFT time–frequency spectrum and wavelet scale spectrum were extracted, and a CNN network was employed to classify spherical targets of varying volumes. Furthermore, the authors of [14] extracted the STFT and WVD time–frequency spectra of underwater targets, and multi-domain feature fusion was implemented via a network to distinguish between targets and clutter.
When radar and sonar detect moving targets, the echoes exhibit Doppler effects. Additionally, the nutation, precession, and partial rotation of the target produce micro-Doppler phenomena [15]. In radar applications, micro-Doppler features have been extensively utilized for identifying airborne and land-based targets [16,17]. In contrast, in sonar systems, Doppler phenomenon is typically employed for target velocity estimation, detection, and tracking [18,19]. As reported by the authors of [20], the Doppler characteristics of underwater rotating objects were investigated using a 1 MHz carrier signal. Water tank experiments confirmed the presence of micro-Doppler phenomena in underwater targets. However, due to the weak echo intensity of the propeller and the challenges posed by propagation attenuation and environmental noise, extracting micro-Doppler signatures remains difficult.
The key challenges that remain to be addressed in the aforementioned research on active sonar target recognition are summarized in Table 1.
This study focuses on resolving the challenges of relative attitude adaptability and sample scarcity in underwater moving target recognition for active sonar. Systematic research is carried out on feature extraction, information fusion, and network models. The methods for extracting spatial, time–frequency, and Doppler features of underwater targets are improved, and a meta-learning-based recognition method for multidimensional feature information fusion is introduced. Specifically, our contributions are as follows:
1.
Based on the generalized MUSIC algorithm, a pseudo-three-dimensional spatial feature was constructed by integrating range–dimension information, thereby enhancing the adaptability of the algorithm to the relative attitudes of the targets. The pseudo-WVD time–frequency spectrum was filtered and smoothed using the time–frequency function of the transmitted signal, which improved the resolution for distinguishing between targets and interferences. A method for extracting the Doppler frequency shift distribution feature of underwater moving targets was proposed, demonstrating excellent identification capabilities for moving targets. This feature is complementary to the posture adaptability provided by the time–frequency spectrum.
2.
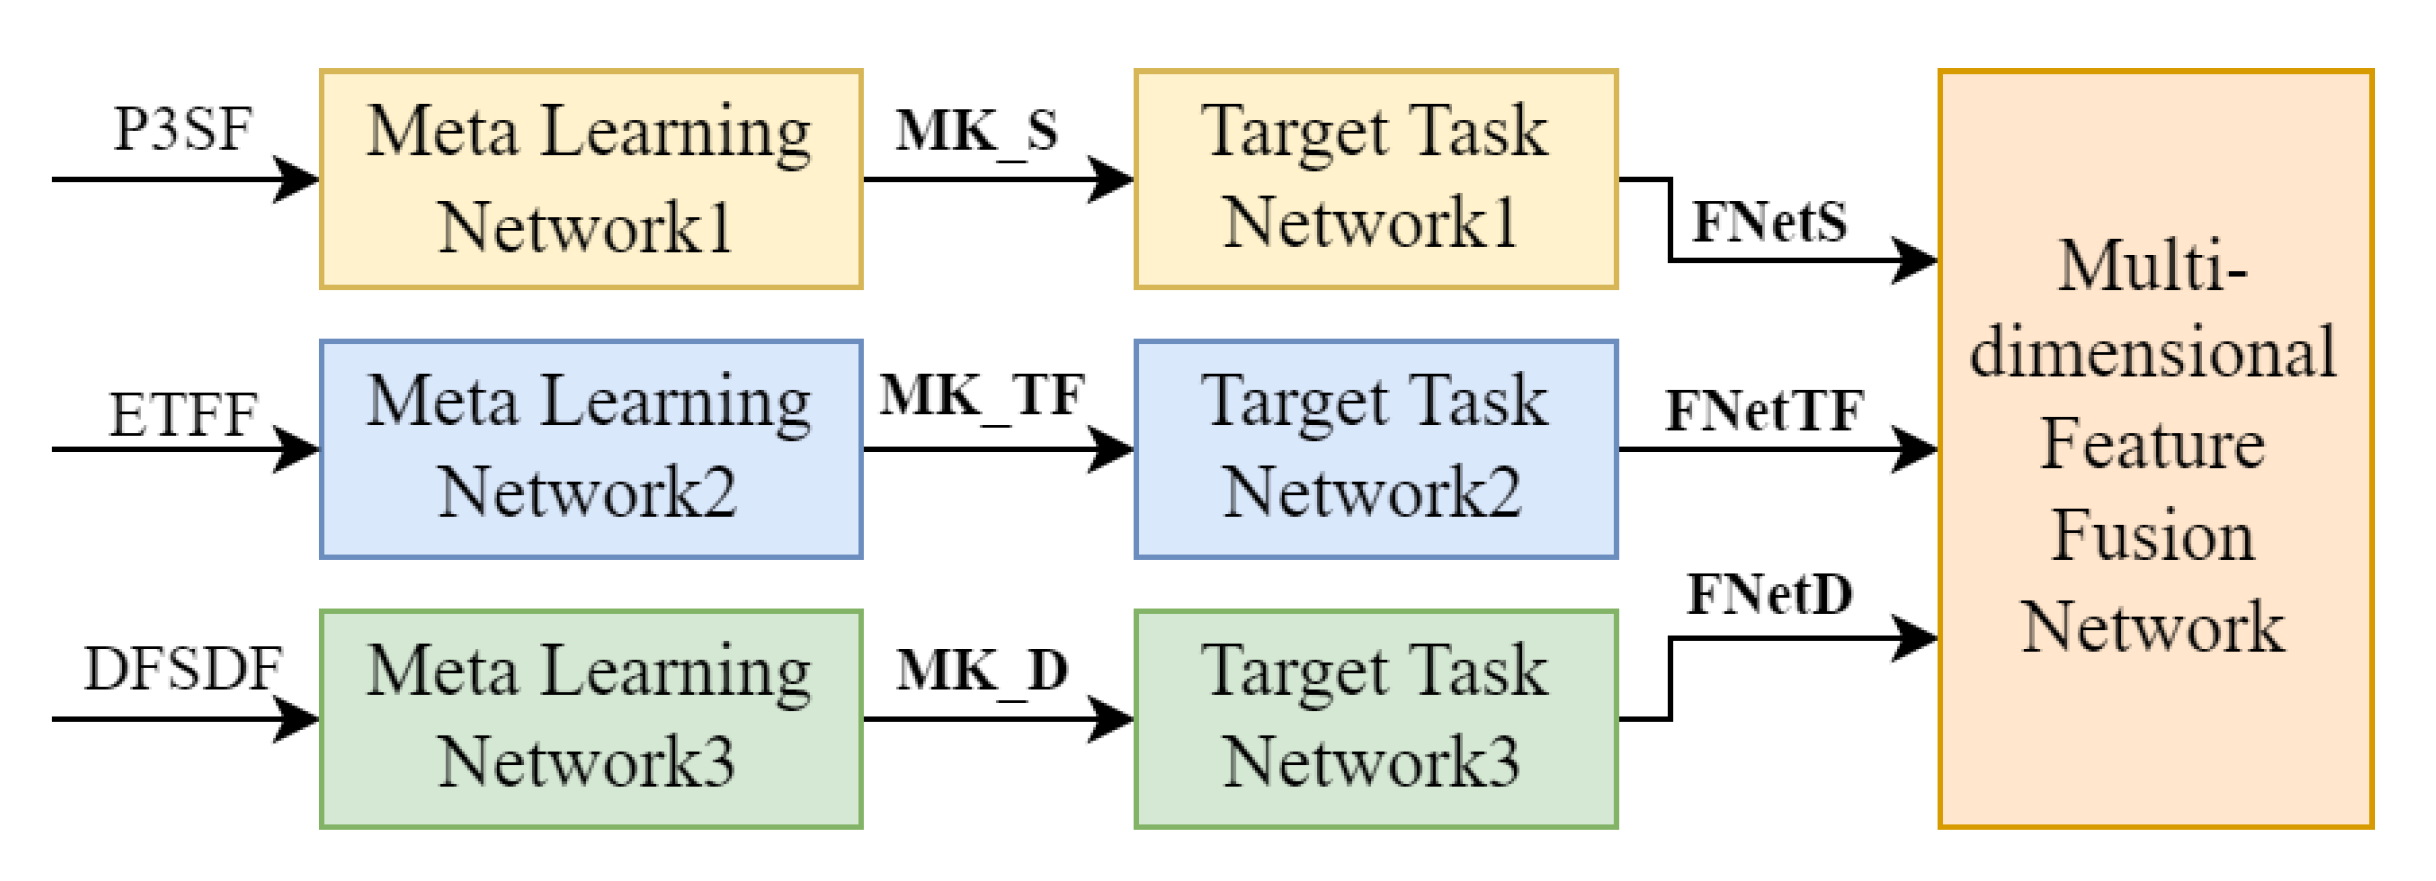
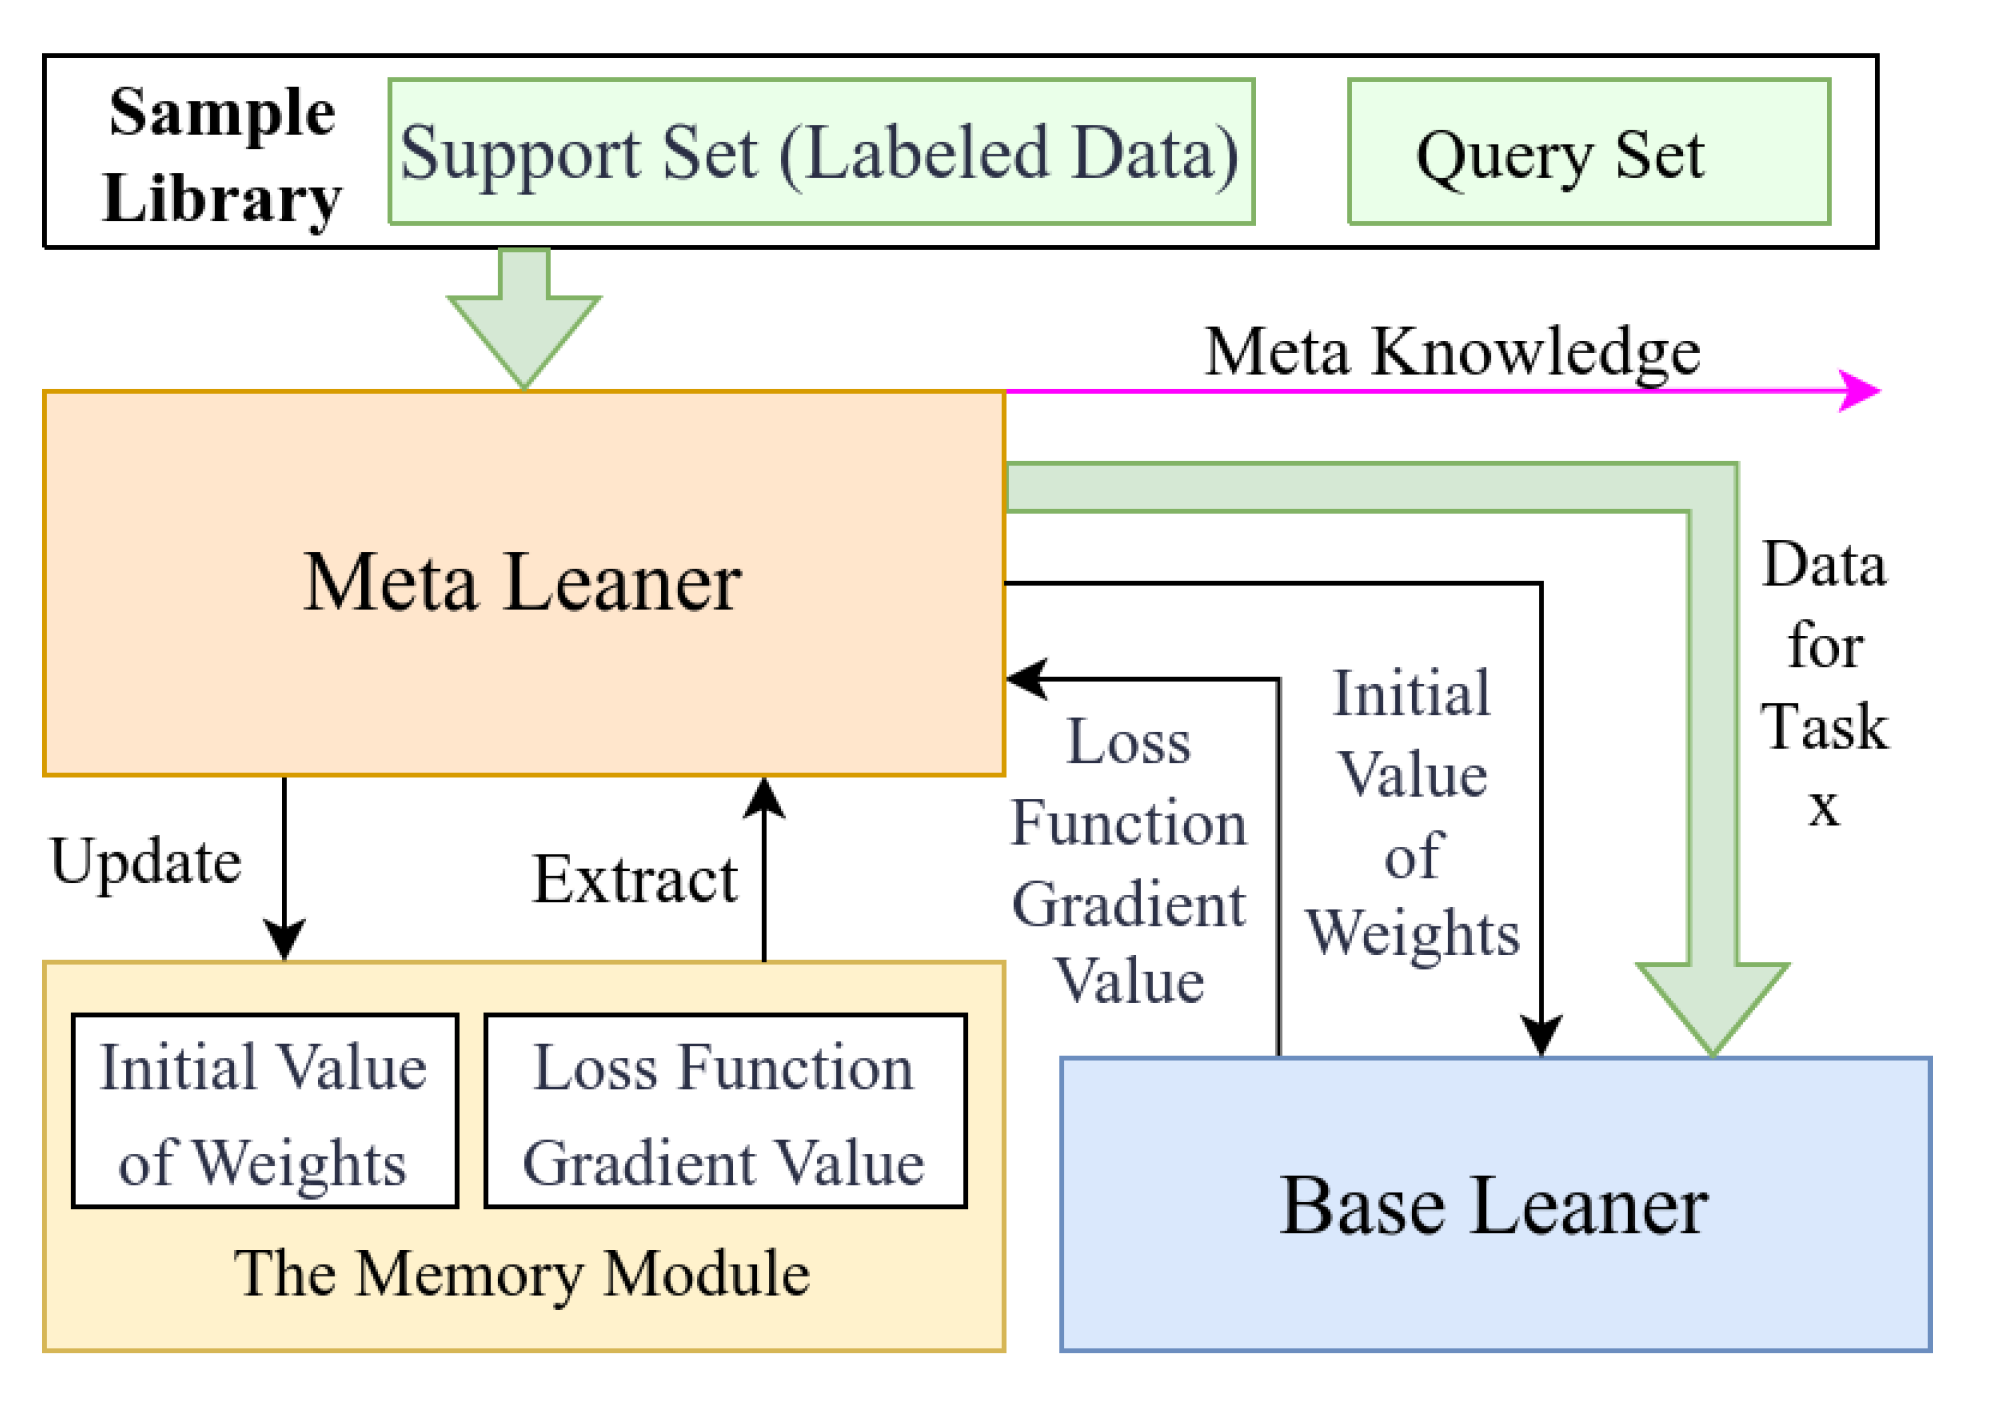
Inspired by meta-learning network structures such as MAML [21,22], a multidimensional feature information fusion network model based on meta-learning was developed. This model consists of three base learners, a meta-learner, a target task network, and a multidimensional feature fusion classifier. In accordance with the characteristics of spatial, time–frequency, and Doppler feature spectra, three concise base learners were specifically designed to mitigate overfitting and non-convergence issues in small-sample scenarios.
3.
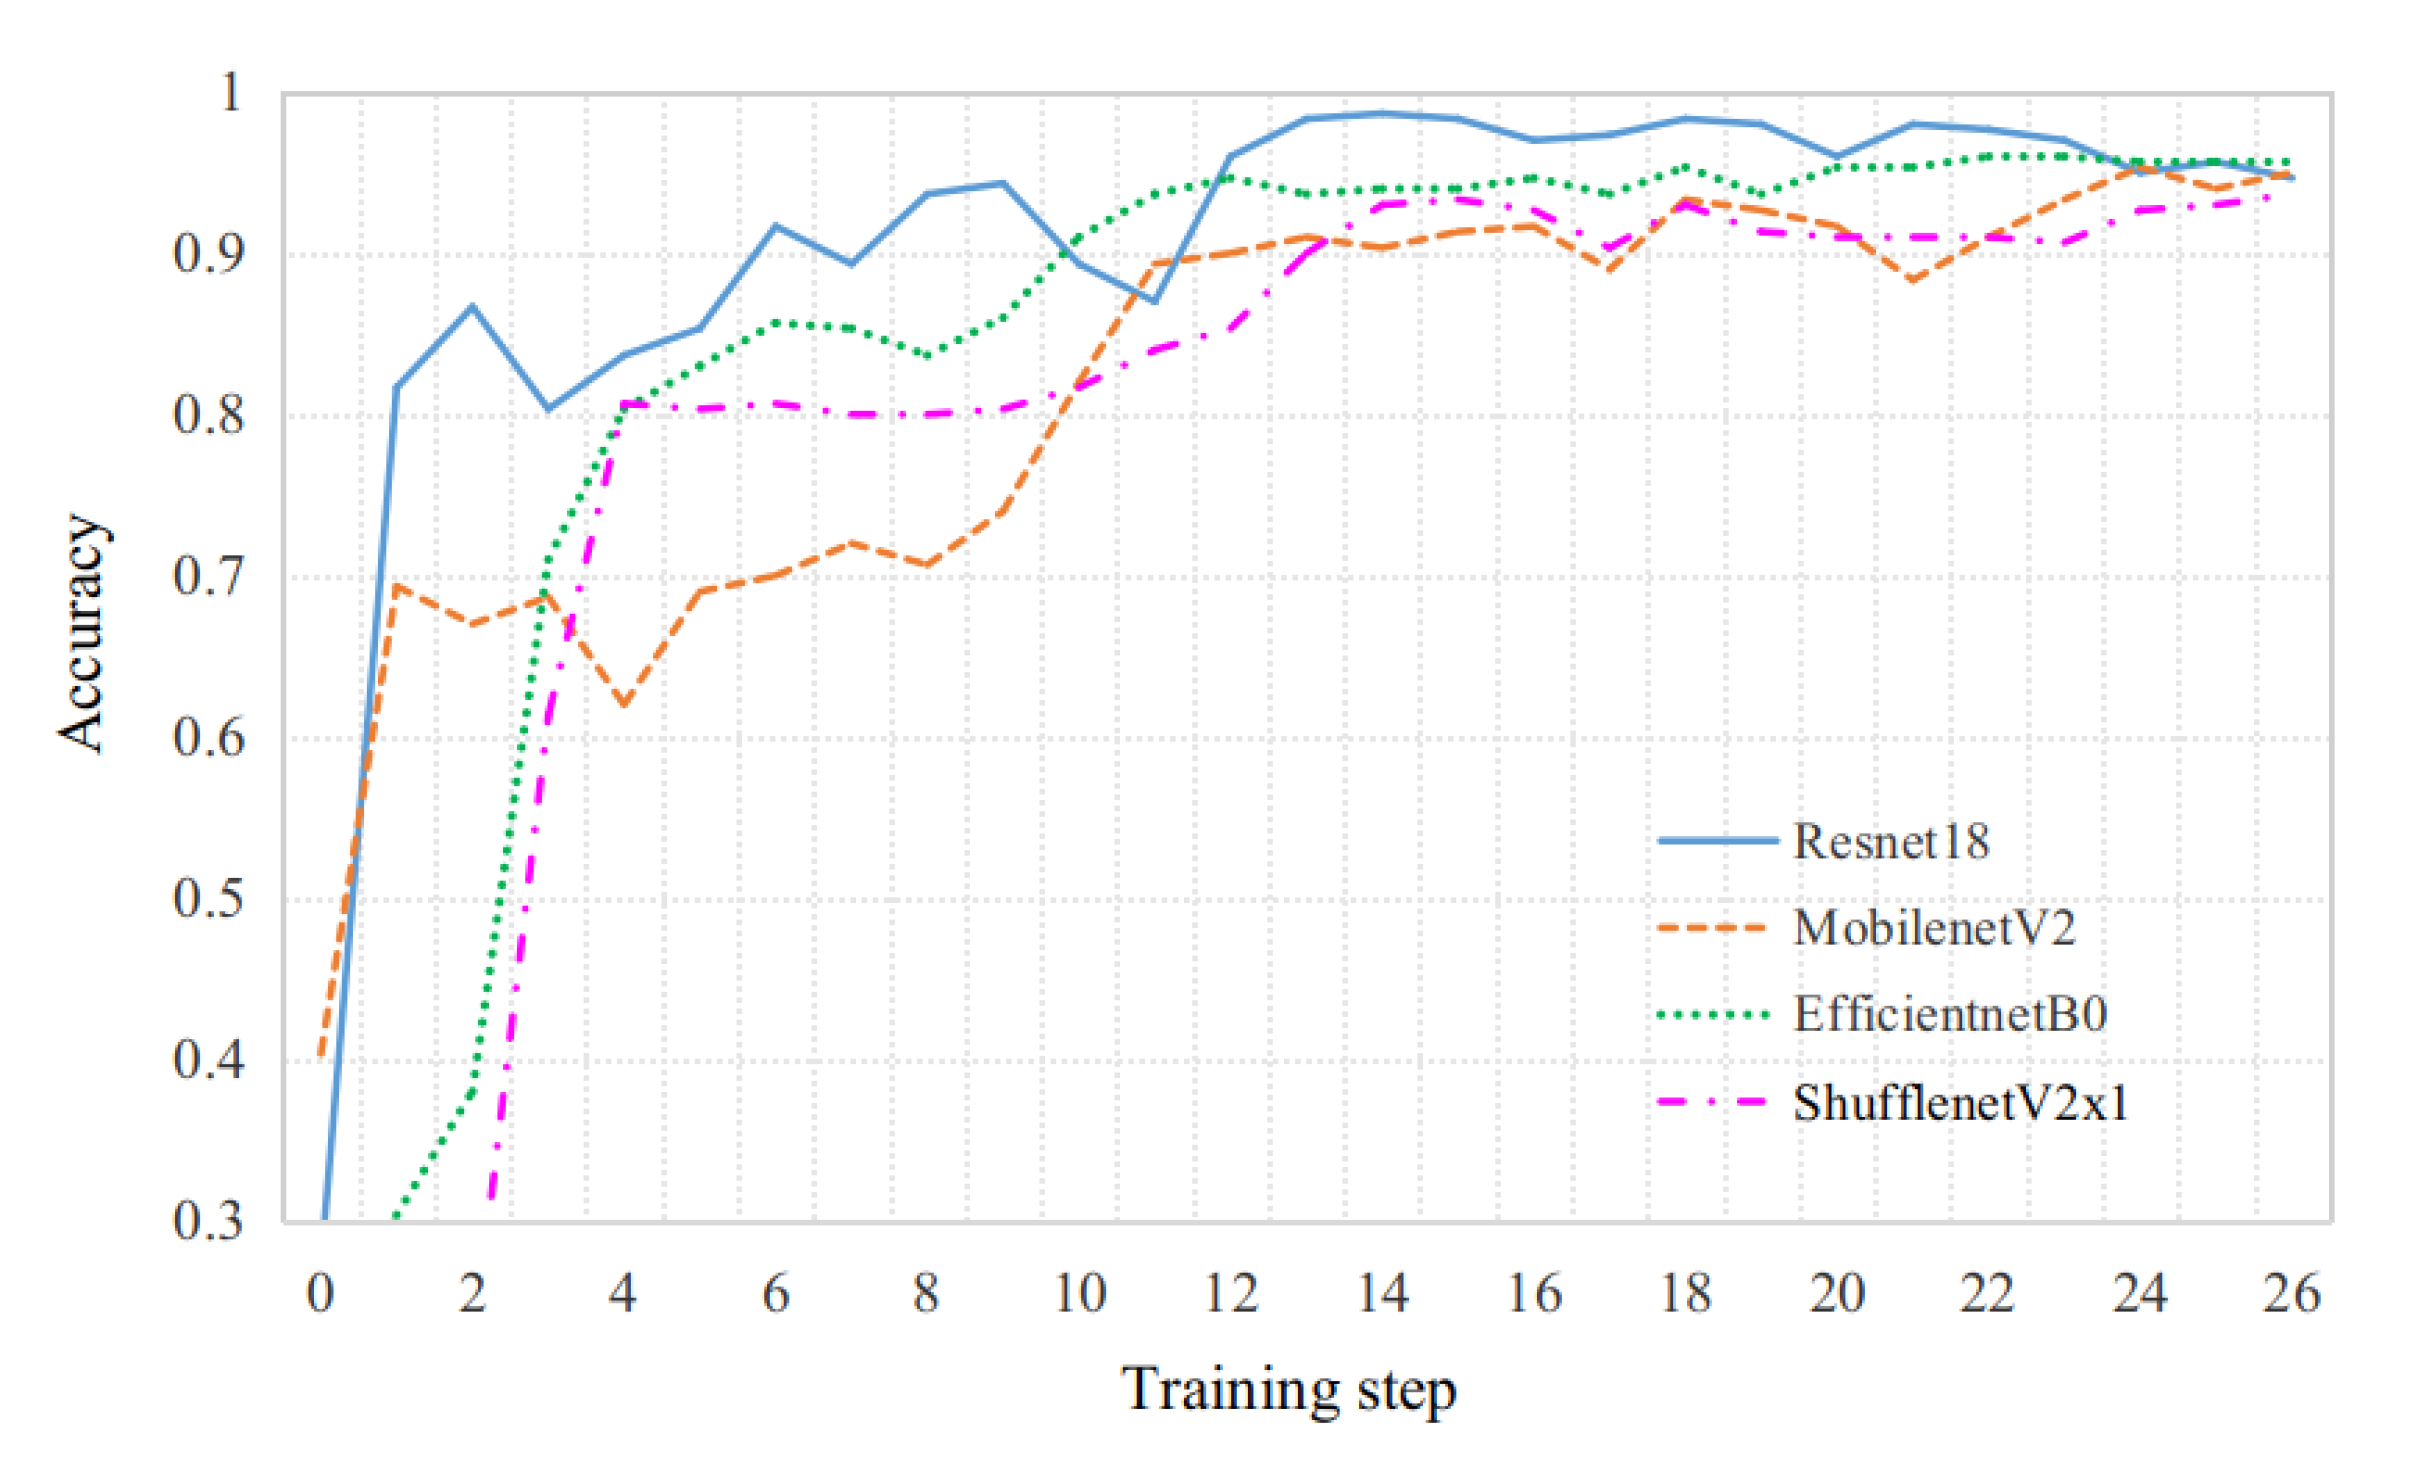
The designs of the meta-learning task space and the network training methodology were refined. A meta-learning sample library based on simulation data was constructed. A target task learning sample library was established by integrating experimental data with simulation-enhanced data. The training and testing results demonstrate that the meta-learning feature-level information fusion network model developed significantly outperforms the data-level information fusion approaches implemented in four lightweight networks, such as EfficientNetB0.
The structure of this study is organized as follows: Section 2 details the methods for extracting the multidimensional features of underwater targets in the spatial, time–frequency, and Doppler domains and elaborates on the construction of a feature fusion network based on meta-learning. Section 3 performs the training, validation, and testing of the proposed network using simulation and experimental data. Section 4 provides a detailed analysis of the performance comparison between the proposed network and four lightweight networks, followed by an in-depth analysis of the test results. Finally, the research operations presented in this article are comprehensively summarized.

2. Methods

2.1. Extraction of Multidimensional Features for Underwater Targets

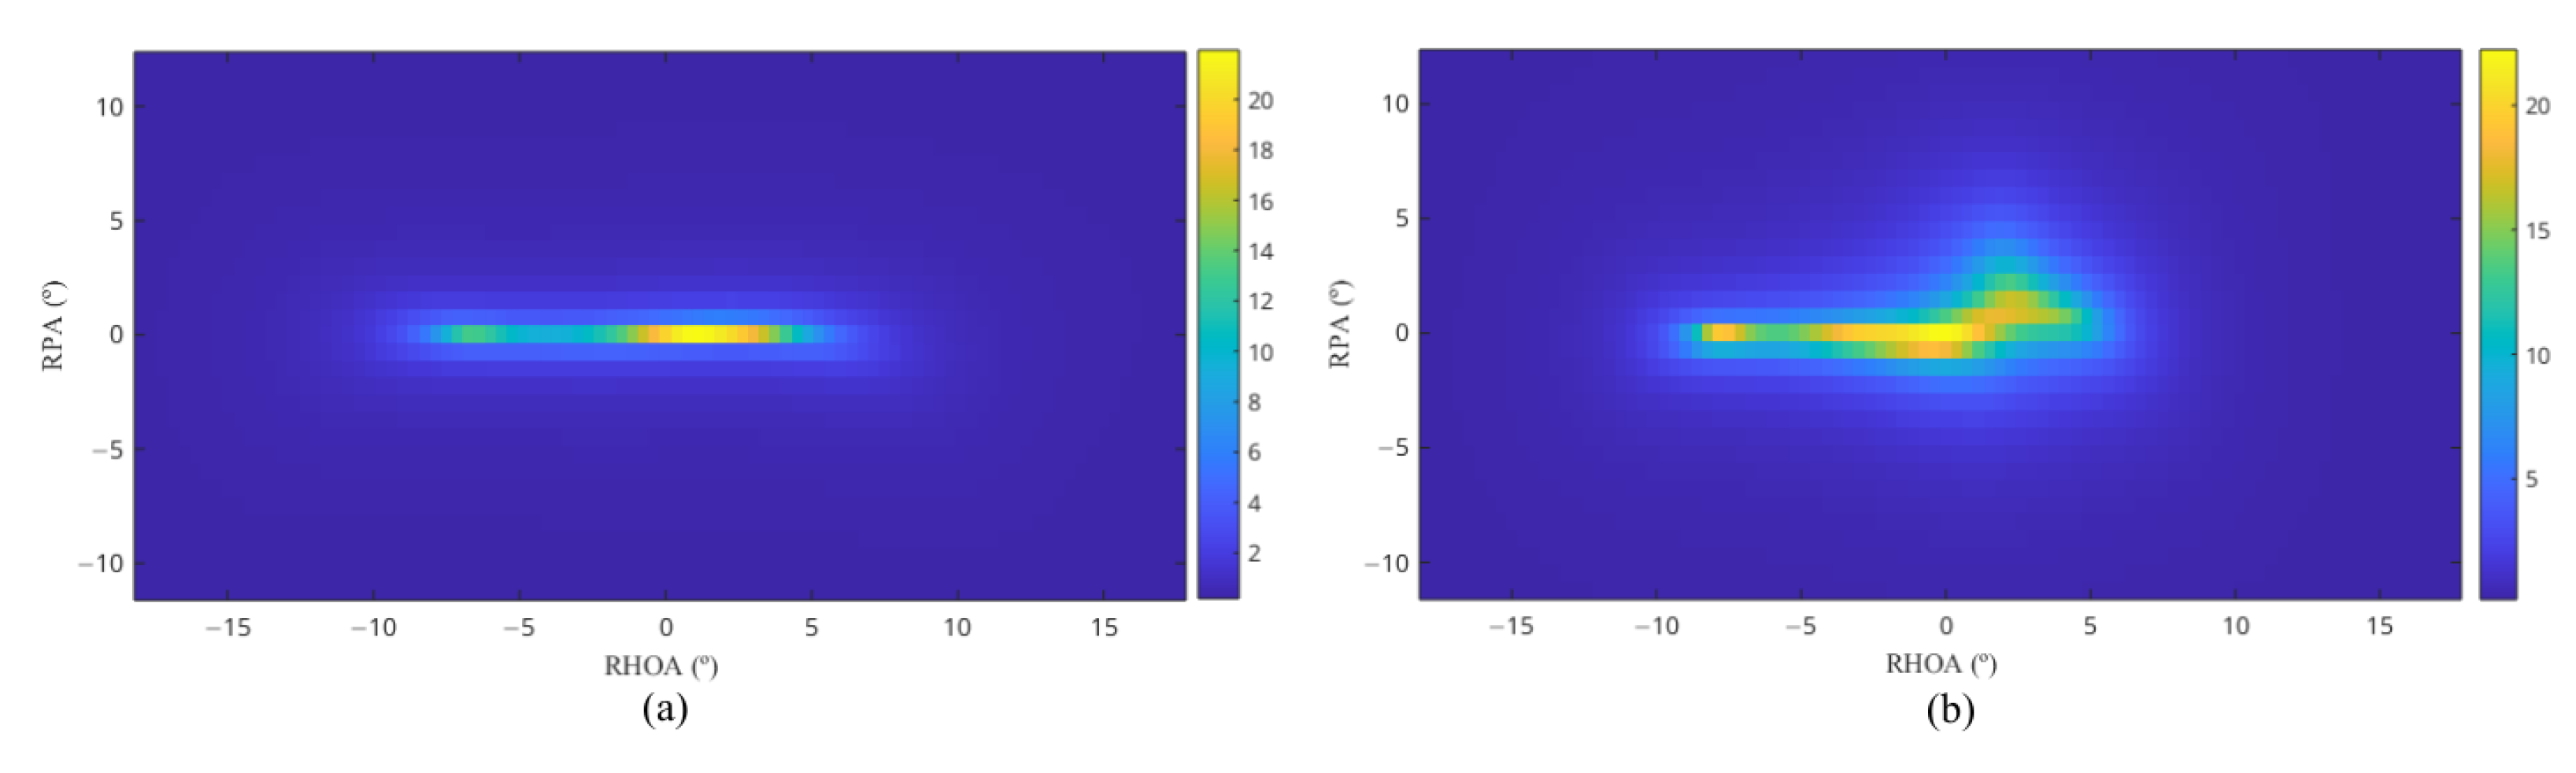
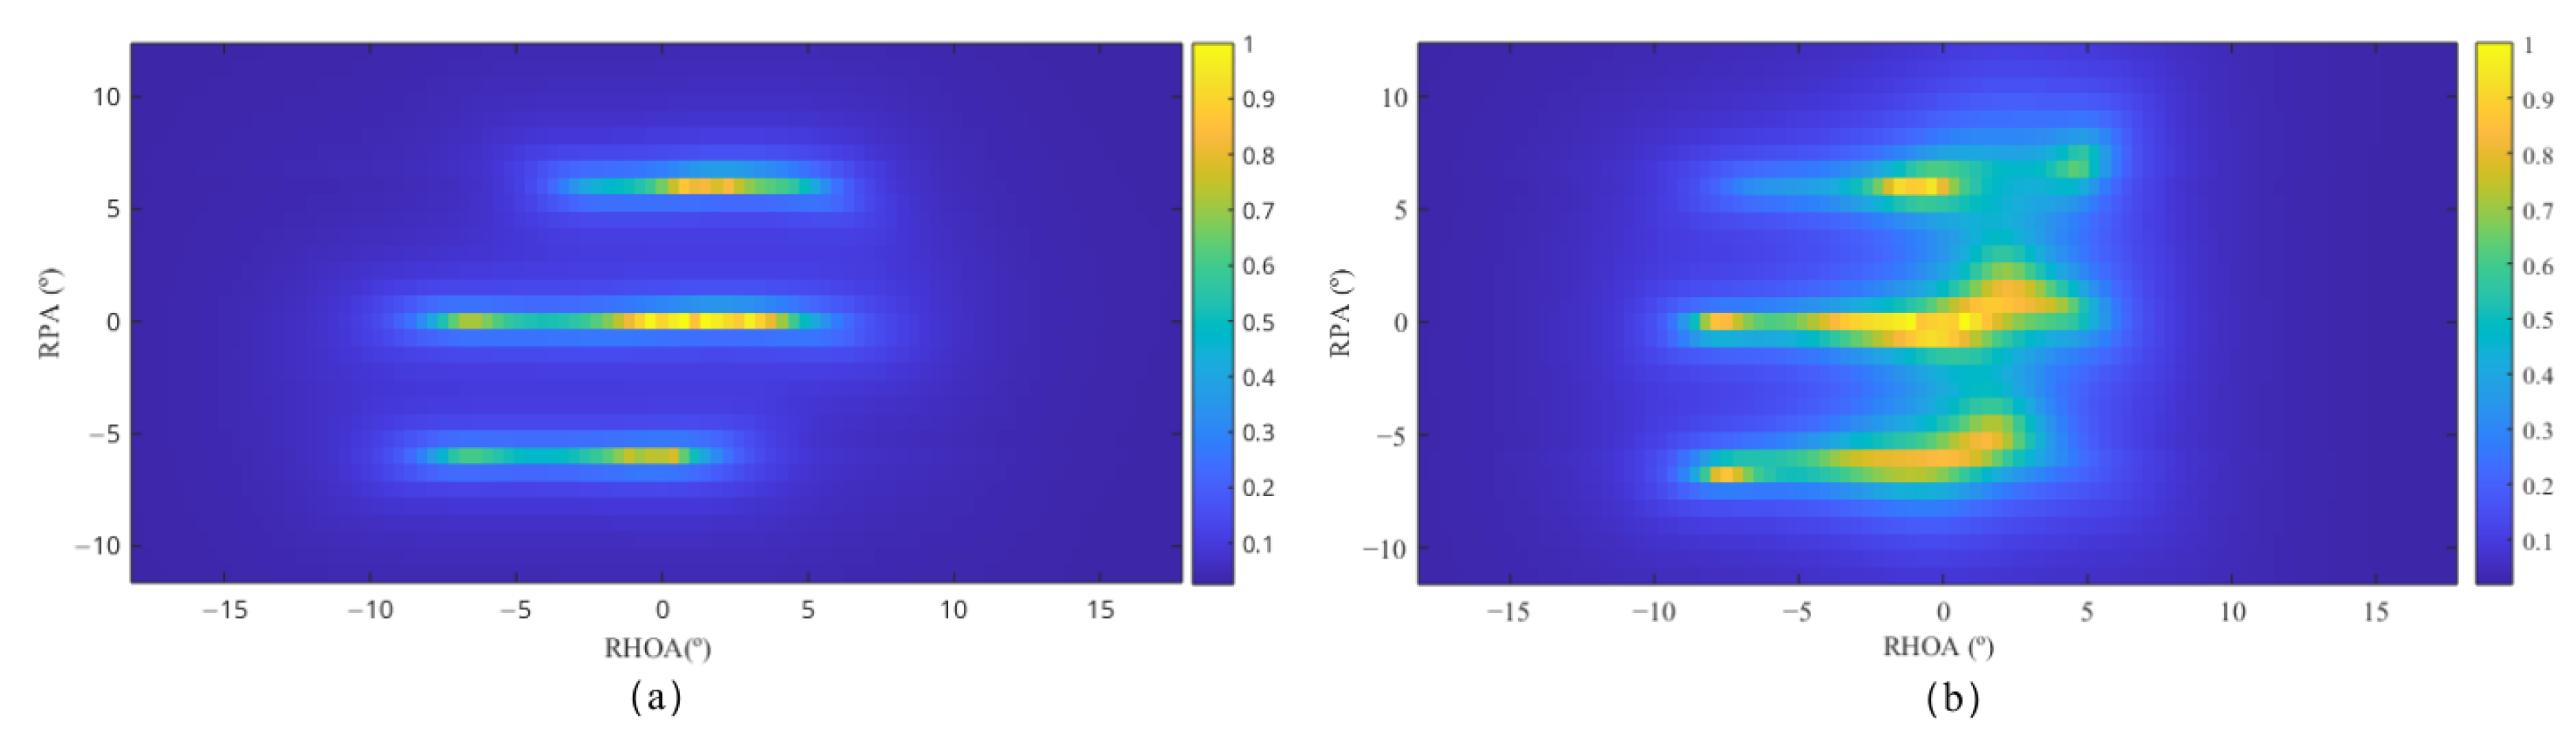
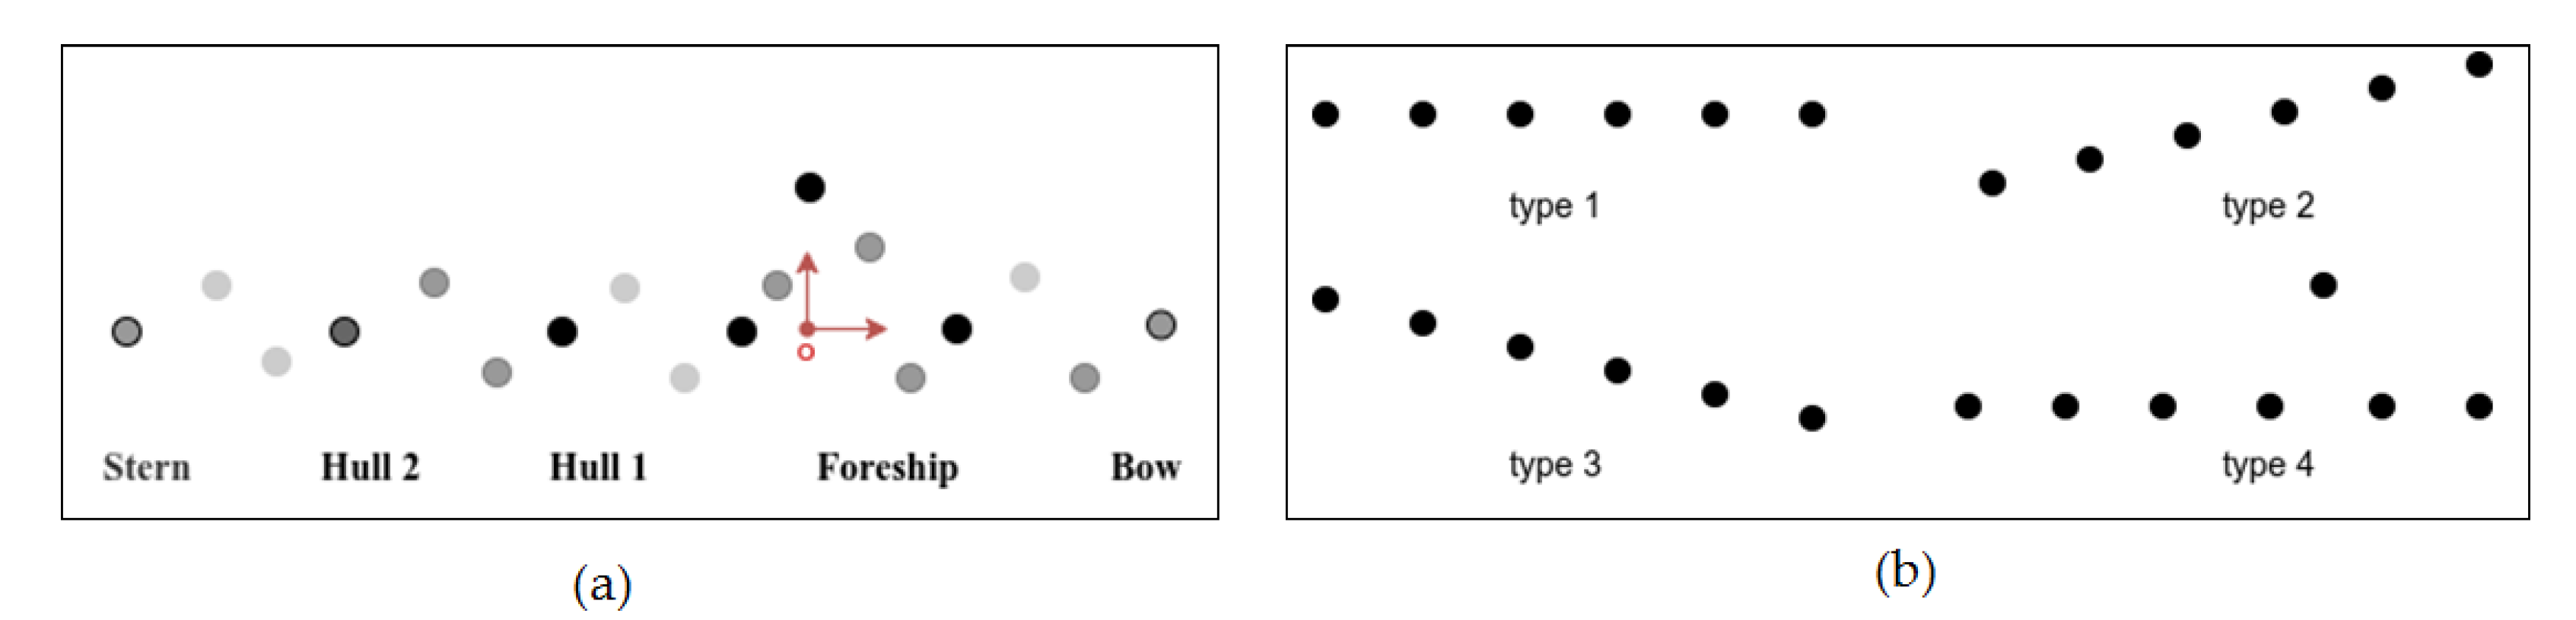
2.1.1. Pseudo-Three-Dimensional Spatial Features

Acquiring sonar images of high-speed moving targets is difficult; however, low-resolution highlight images of these targets can be obtained using high-resolution DOA estimation techniques [9]. These images clearly reflect the key spatial features of the target, including its contour, scattering strength distribution, and relative attitude, thereby facilitating the classification of the target from interference.
After the active sonar emits a narrowband pulse signal, the target can be modeled as a coherent sound source consisting of scattering bright spots. Subsequently, the observation data vector for the active sonar two-dimensional array is
x ( t ) = q = 1 Q x q ( t ) b ( θ q , ψ q , ρ q ) + n ( t )
Here, x q ( t ) denotes the complex amplitude of the qth narrowband distributed source at time t. The term n ( t ) represents an additive random noise vector that is independent of the signal. Additionally, b ( θ q , ψ q , ρ q ) signifies the generalized steering vector of the qth distributed source, where θ q , ψ q , and ρ q correspond to the relative horizontal orientation angle, relative pitch angle, and spatial angular distribution parameters of the qth narrowband distributed source, respectively.
The covariance matrix of the observation data is expressed as R = E { x t x t H } . Its singular value decomposition (SVD) can be written as follows:
R = U S S U S H + U N N U N H
where signal subspace U S consists of the singular vectors corresponding to the Q largest singular values, and noise subspace U N is composed of the singular vectors corresponding to the M Q smallest singular values. S and N are diagonal matrices containing the singular values associated with the signal and noise subspaces, respectively.
Assuming that the mathematical forms of the spatial angular density functions for all distributed sources are identical and known and that a closed-form solution for the generalized steering vector b ( θ q , ψ q , ρ q ) can be derived, the generalized MUSIC spectrum for distributed signal sources can then be obtained by exploiting the orthogonality between the noise subspace and steering vector, as shown in Equation (3):
f ( θ q , ψ q , ρ q ) = 1 b H ( θ q , ψ q , ρ q ) U ^ N U ^ N H b ( θ q , ψ q , ρ q )
where U ^ N represents the estimated noise subspace.
Active sonar systems encounter various types of interference and target signals. Accurately determining the angular density function and parameters of the distribution source, particularly obtaining a precise b ( θ q , ψ q , ρ q ) , presents a significant challenge. To avoid the substantial computational burden associated with searching for these parameters, it is assumed that the angular density function of the source space satisfies a unimodal symmetry constraint. Consequently, the estimation of the center wave arrival direction of the distribution source corresponds to solving the minimization problem presented in Equation (4) [23]:
P ( θ q , ψ q ) = arg min ( θ , ψ ) λ min ( Re [ Φ H ( θ , ψ ) U ^ N U ^ N H Φ ( θ , ψ ) ] )
where λ min ( · ) denotes the minimum eigenvalue of the matrix, and Φ ( θ , ψ ) is a diagonal matrix constructed using the steering vector a ( θ , ψ ) of the sonar array. The aforementioned assumptions may inevitably result in parameter estimation errors for multi-source targets. However, volumetric targets exhibit complex spatial distributions with continuity, whereas the spatial distribution of interference is typically simpler and more discrete. Consequently, this spatial spectrum estimation method can still effectively capture the differences in target scattering distributions, rendering it feasible for distinguishing between multi-source interferences and volumetric targets. Based on Equation (4), this study employs the smoothing–rank sequence method for estimating the number of sources and utilizes the minimum eigenvalue search method for spatial spectrum estimation [23]. The spatial spectrum diagrams of the linear multi-source interference (MSI) and volume target, derived from Equation (4), are illustrated in Figure 1a,b, respectively.
The spatial spectrum derived from Equation (4) solely reflects the energy distribution in the horizontal and vertical directions. By incorporating the range–dimension information via a slicing approach, the three-dimensional spatial domain energy spectrum is compressed into a two-dimensional spectrum, thus yielding the target’s pseudo-three-dimensional spatial feature (P3SF), as presented in Equation (5):
P 3 S F ( θ , ψ ) = i = N N P ( θ , ψ , d N )
As shown in Equation (5), when N = 0 , it corresponds to the slice with the maximum energy distance. When N < 0 , it refers to slices located at closer distances, and when N > 0 , it denotes slices situated at further distances. Additionally, d N represents the relative pitch angle offset applied during the compression into a two-dimensional spectrum, which is used to prevent the overlapping of the target data.
In this study, three range–dimension slices of Equation (5) are extracted. The P3SFs for linear multi-source interference and volume targets are illustrated in Figure 2a,b, respectively.

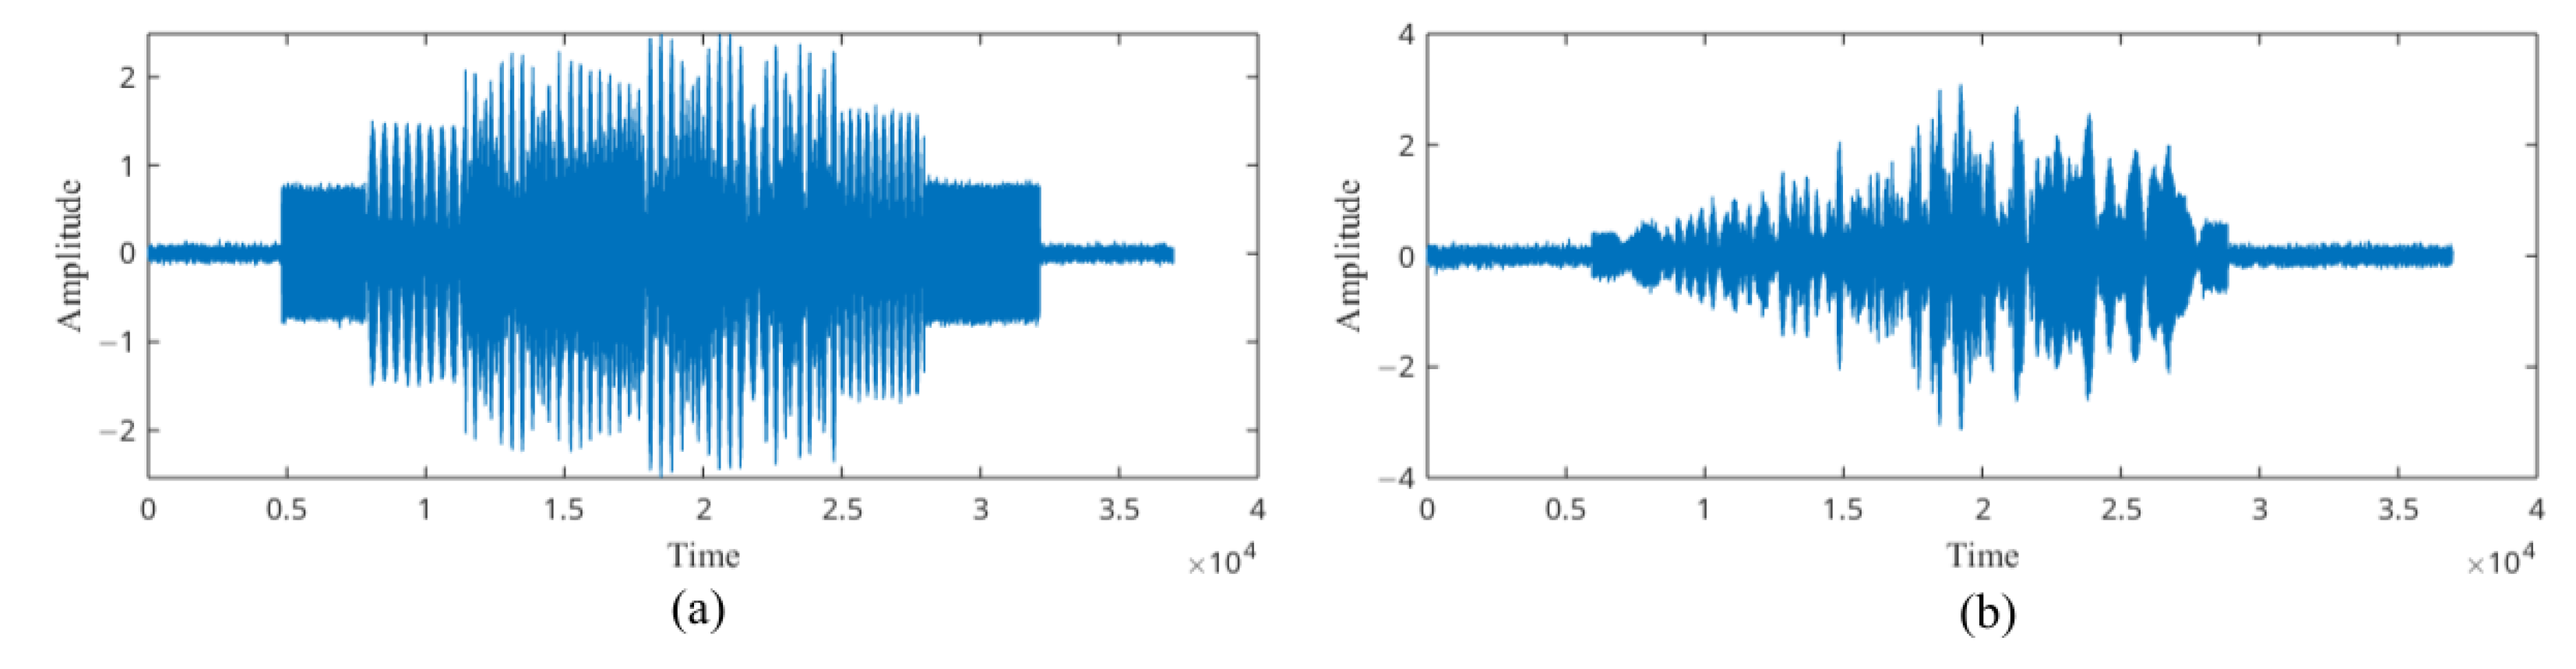
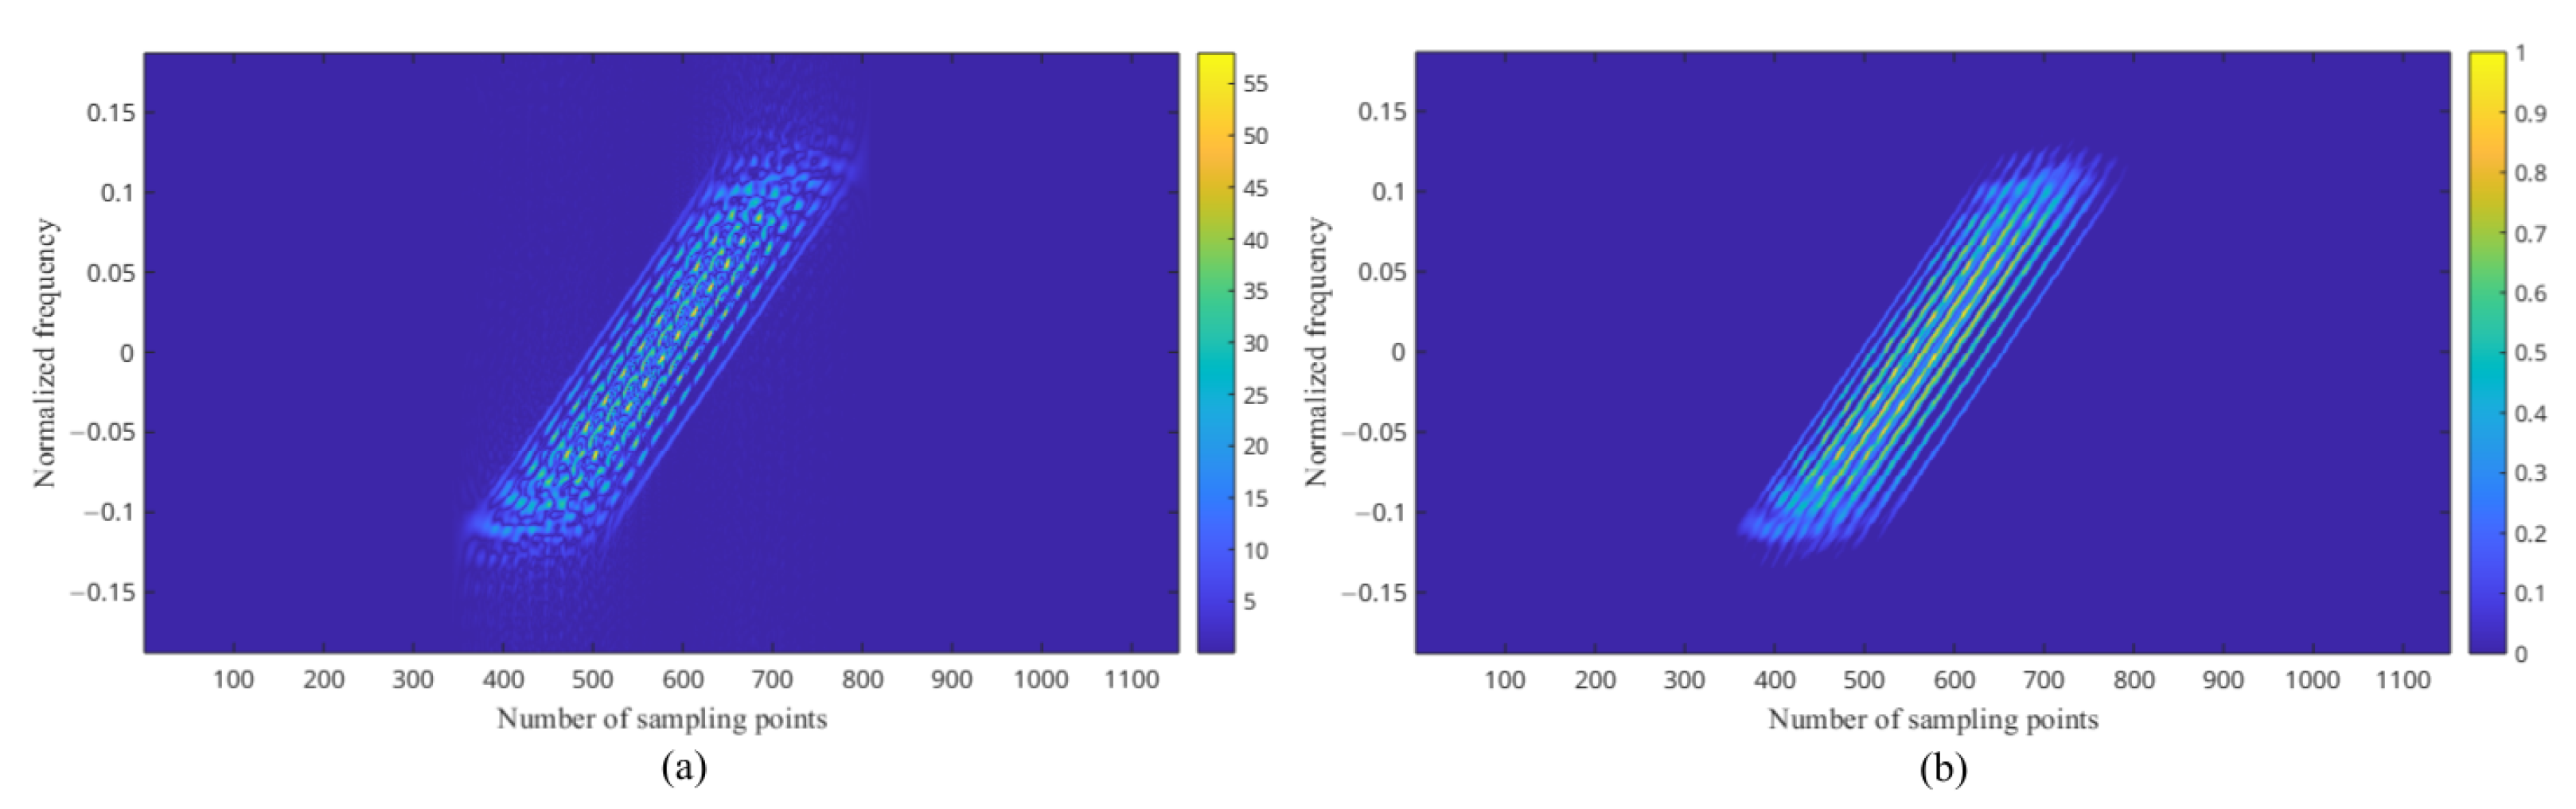
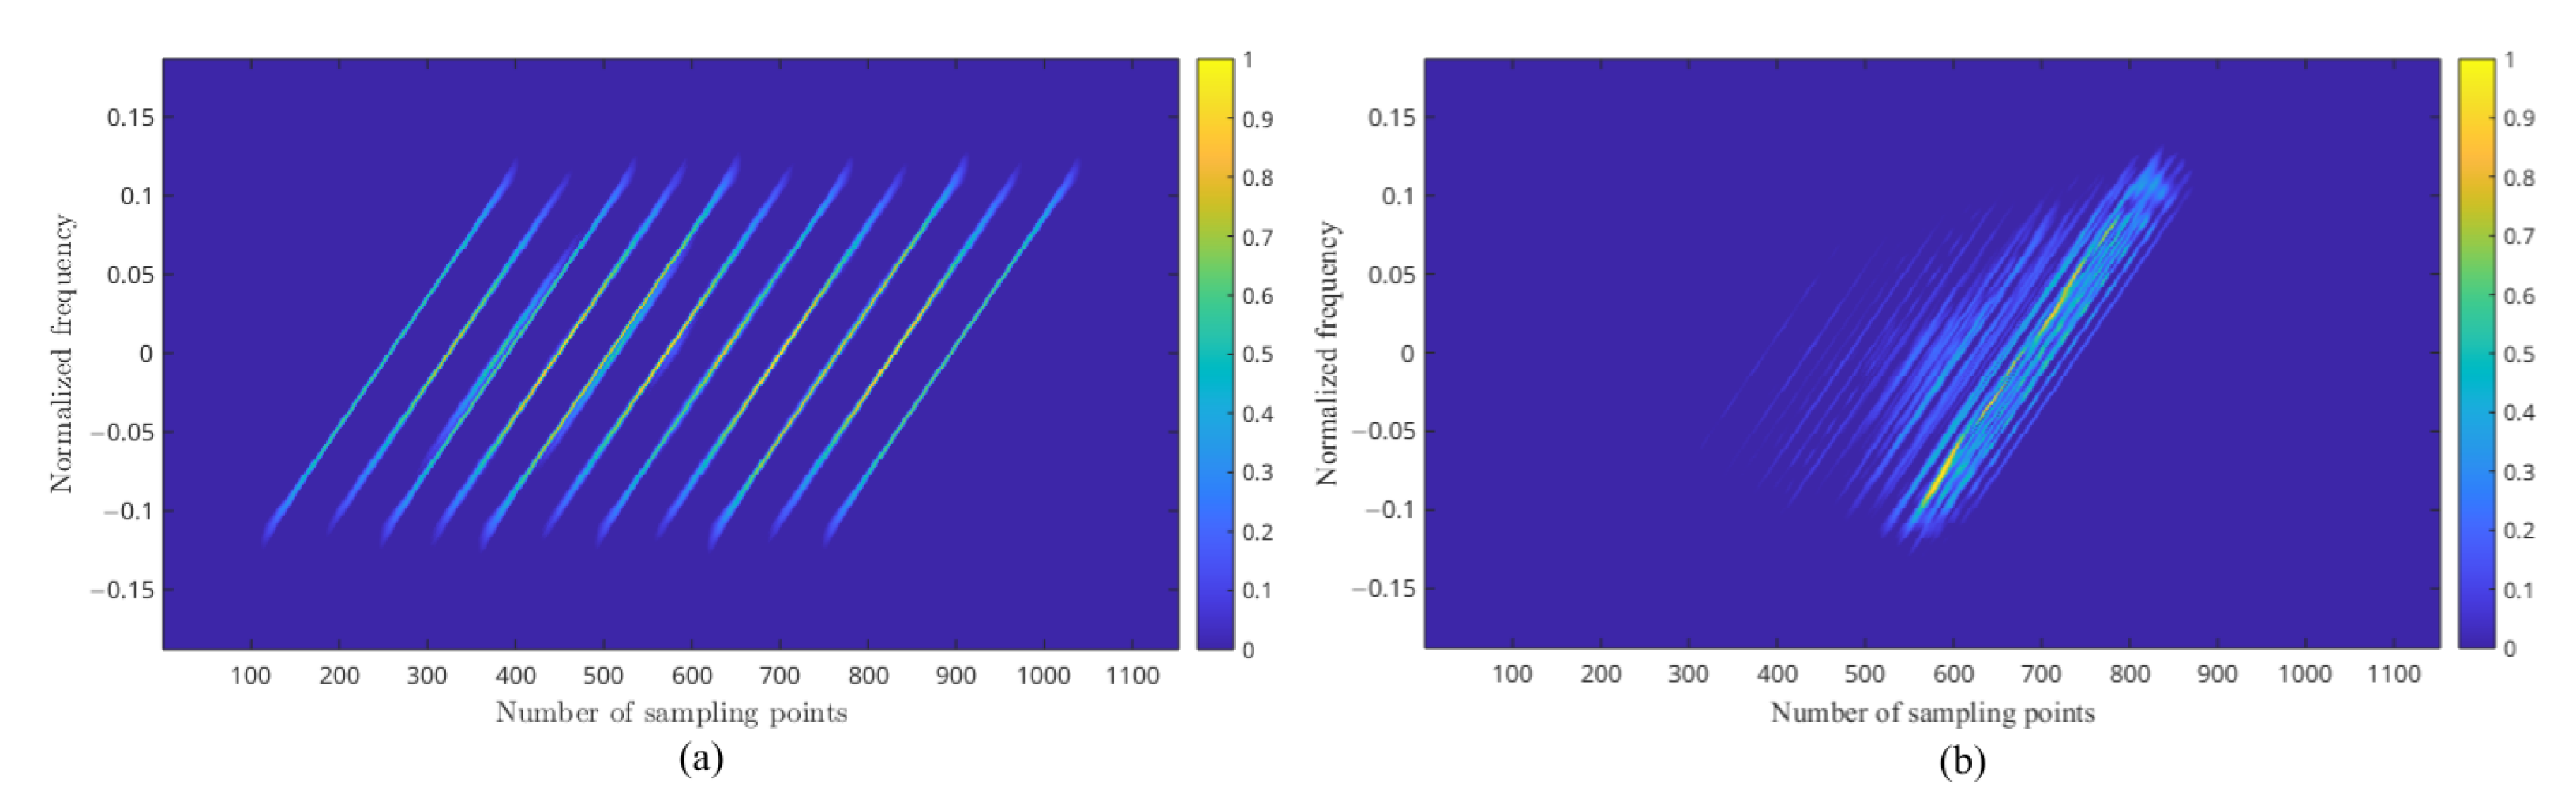
2.1.2. The Enhanced PWVD Time–Frequency Features

The Wigner–Ville distribution (WVD) exhibits excellent time–frequency concentration characteristics. However, for multi-source signals, the cross-term interference is relatively significant. The pseudo Wigner–Ville distribution (PWVD) [24] is defined in Equation (6):
P W V D x ( t , Ω ) = x ( t + τ 2 ) x * ( t τ 2 ) h ( τ ) e j Ω τ d τ = W V D x ( t , Ω ) H ( Ω )
where τ denotes the time delay, t denotes time, and Ω denotes the angular frequency.
Optimizing the window function of PWVD can effectively suppress multi-source cross-terms while preserving sufficient time–frequency resolution. For the classification of underwater volume targets and interference, the cross-terms of PWVD not only reflect the scattering characteristics of the target but also provide useful information about source distributions. Taking the LFM signal as an example, the time domain waveforms of multi-source interference and volume target echoes are depicted in Figure 3a,b, respectively.
When the relative horizontal orientation angle becomes excessively large, the sound path difference between multi-source interferences and the scattering bright spots (or equivalent scattering bright spots of the volume target) gradually diminishes, potentially resulting in the reduced distinguishability of the PWVD spectrum. Consequently, as illustrated in Figure 4a, the PWVD spectral lines become increasingly discrete, thereby disrupting the spectral line characteristics. Nevertheless, given that the time–frequency function of the transmitted signal from the active sonar is predetermined, it is possible to leverage prior information to filter and smooth the time–frequency spectrum, as demonstrated in Equation (7). This process yields the enhanced time–frequency feature (ETFF):
E T F F ( t , f ) = P W V D ( t , f ) δ ( r ( t , f ) ) h ( t )
where δ ( r ( t , f ) ) represents the unit impulse function, h ( t ) denotes the window function, and r ( t , f ) corresponds to the time–frequency characterization function of the frequency-modulated signal. In this study, LFM signals are utilized; however, the proposed algorithm remains applicable to other types of frequency-modulated signals as well. The time–frequency spectrum derived from Equation (6) is presented in Figure 4b after undergoing filtering and smoothing processes.
The ETFFs of multi-source interference and volume targets are presented in Figure 5a and Figure 5b, respectively.

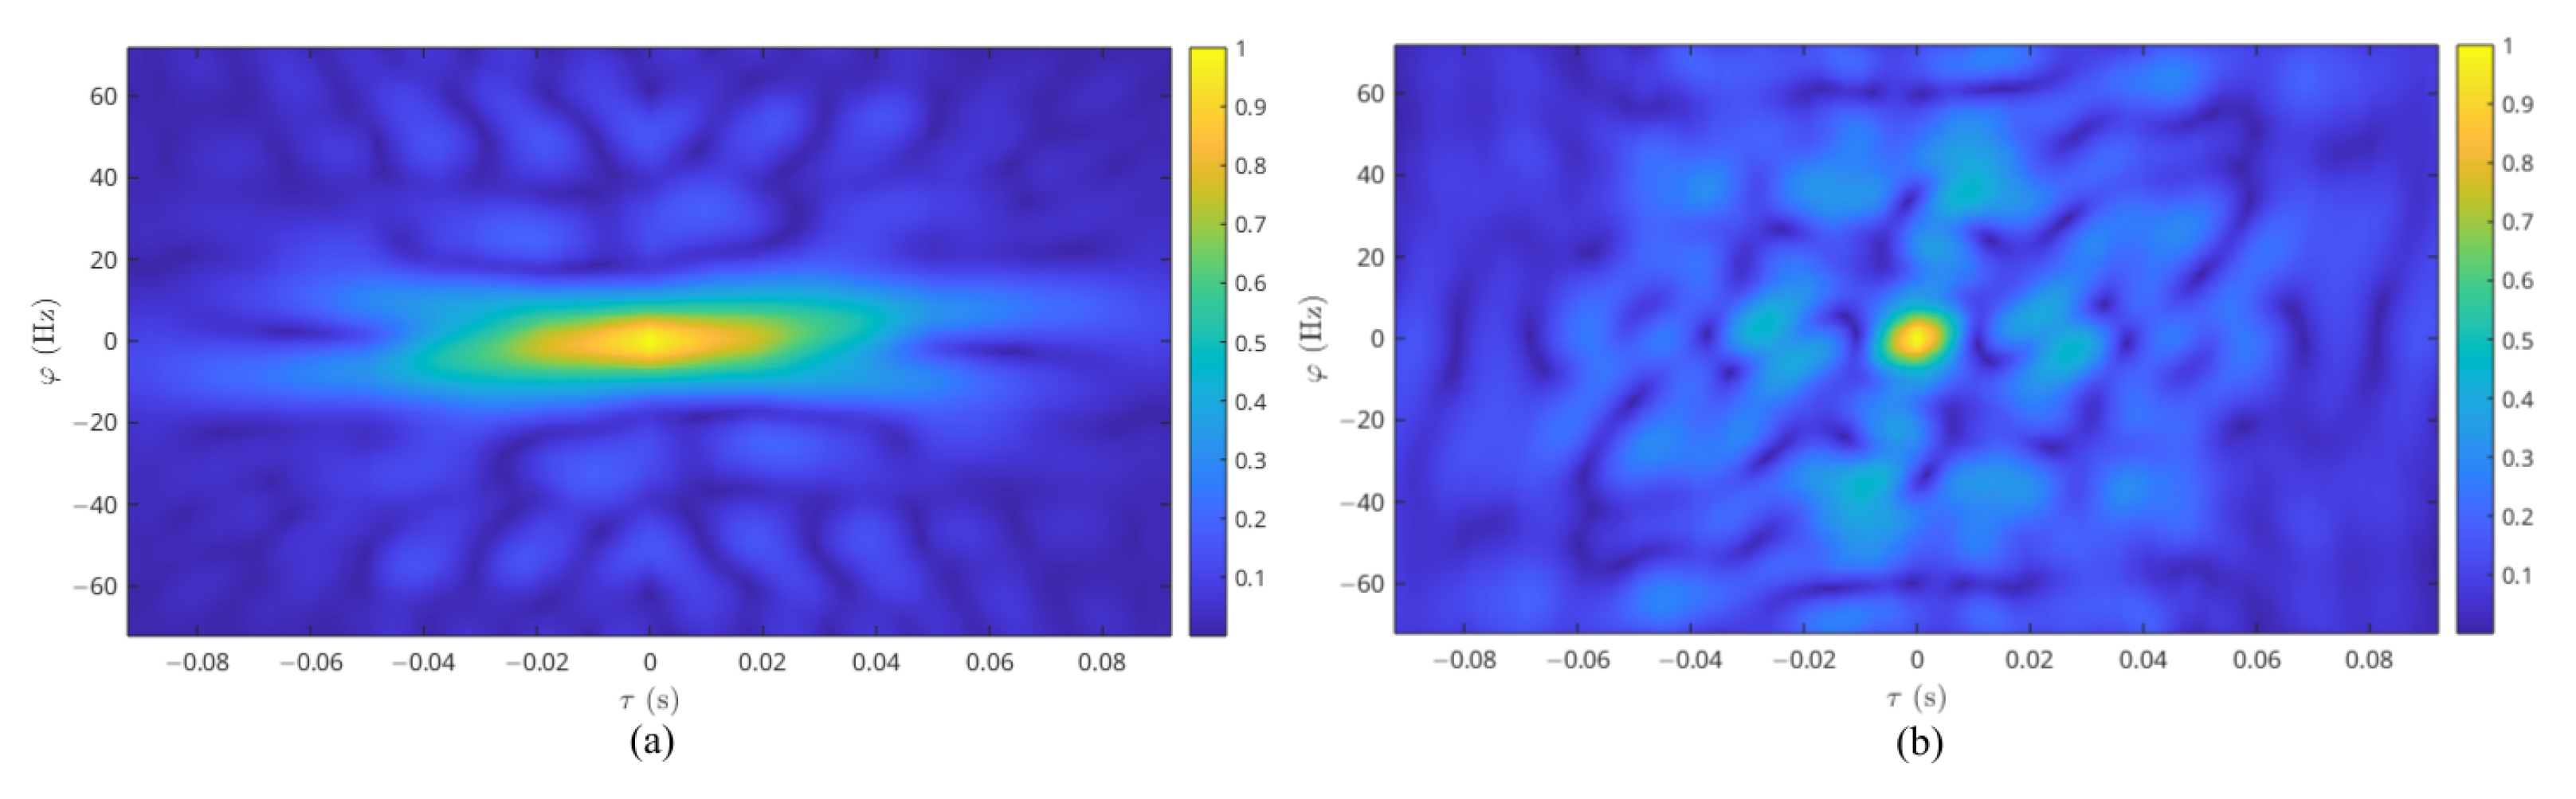
2.1.3. Distribution of Doppler Frequency Shift

When a single-frequency acoustic wave interacts with a moving underwater volume target (typically streamlined), variations in factors such as the target’s dimensions, structural geometry, radiation angle, and time-varying velocity result in differing frequency shifts produced by each volume element. This results in the formation of a Doppler frequency shift distribution. The Doppler components contained in the echo of the volume target at time t can be represented as follows:
D T ( t , f d ) = V T H D ( f , r T ) d V T
where f d represents the Doppler frequency shift, and the target Doppler response function H D ( f , r T ) is a function of the signal frequency f and the position vector r T of the volume element. Additionally, D T ( t , f d ) denotes a non-stationary random process. The Doppler components in the echoes of a transmitted pulse with duration T b can be expressed as follows:
D T ( f d ) = T b V T H D ( f , r T , t ) d V d t = D ¯ ( f d ) + D ˜ ( f d )
In Equation (9), D ¯ ( f d ) represents the mean of the Doppler frequency shift, and D ˜ ( f d ) is the random component of the Doppler frequency shift. The Doppler components contained in the echoes of N source interferences can be expressed as follows:
D I ( f d ) = k = 1 N H D ( f , r T ) = k = 1 N f d k
Therefore, the Doppler components of the echoes from volume targets and multi-source interference exhibit distinct compositional differences. To extract the Doppler feature, two-dimensional correlation analyses involving time delay and frequency shifts are applied to the echo signal, as presented in Equation (11):
F d ( τ , f d ) = r x ( t , τ ) e j 2 π f d τ d t = s ^ t + τ 2 s ^ * t τ 2 e j 2 π f d τ d t
where s ^ ( t ) represents the estimated effective echo signal. By calculating the energy distribution of F d ( τ , f d ) over ( τ , f d ) , the Doppler frequency shift distribution feature (DFSDF) is derived, as presented in Equation (12):
D F S D F ( τ , f d ) = | F d ( τ , f d ) | 2 = F d ( τ , f d ) F d * ( τ , f d )
The form of D F S D F ( τ , f d ) resembles the ambiguity function Ψ x ( τ , φ ) used in the analysis of active sonar transmission waveforms [25], where φ denotes the frequency shift. The ambiguity function is employed to evaluate the time–frequency resolution capability of a given waveform. For pseudo-random signals, the ambiguity function exhibits a pin-shaped profile, which contrasts significantly with those of single-frequency and linear frequency modulation signals. As the Doppler components in the echo become more complex, the ambiguity function tends to approach a pinboard or pin-like shape. It can be observed that the Doppler frequency shift distribution feature of the echoes represents an alternative application of the ambiguity function. The DFSDFs for multi-source interference and volume targets are illustrated in Figure 6a and Figure 6b, respectively.

2.2. Development of the Meta-Learning-Based Feature Fusion Network

2.2.1. Network Framework

Meta-learning operates at the task level, discovering universal patterns across different tasks and improving our ability to address novel problems; it is applicable to few-shot learning and zero-shot learning scenarios. The spatial, time–frequency, and Doppler feature spectra of underwater targets exhibit significant variations. Through simulation analysis, it is evident that the three types of feature extraction impose distinct requirements on the structure and scale of the network model. Given the scarcity of data samples across diverse working conditions, designing compact networks that are specifically adapted to the characteristics of individual feature spectra can substantially reduce the demand for training samples while effectively minimizing the risk of overfitting. The MAML model is implemented through a base learner and a meta-learner, featuring a simple yet flexible network architecture. By replacing different base learners, the network is able to accommodate the requirements of diverse features and effectively enhance its generalization capability. Therefore, this study integrates MAML model with transfer learning to construct a multidimensional feature information fusion network model. The model consists of a meta-learning network, a target task network, and a multidimensional feature fusion classifier. For each feature, both the meta-learning network and the target task network share the same feature extraction network. Each feature extraction network is trained independently to prevent interferences during backpropagation. The block diagram of the model is presented in Figure 7.
In Figure 7, meta-learning networks 1–3 are trained individually using the feature spectrum samples of the spatial, time–frequency, and Doppler domains to acquire meta-knowledge MK_S, MK_TF, and MK_D. These serve as the initial weights for the feature extraction networks of the corresponding target task networks. After the independent training of target task networks 1–3, the resulting feature extraction networks—FNetS, FNetTF and FNetD—are obtained. Together with the multidimensional feature fusion classifier, these networks constitute the multidimensional feature fusion network. During the training of this fusion network, only the parameters of the classifier are updated, while the parameters of the feature extraction networks remain fixed.

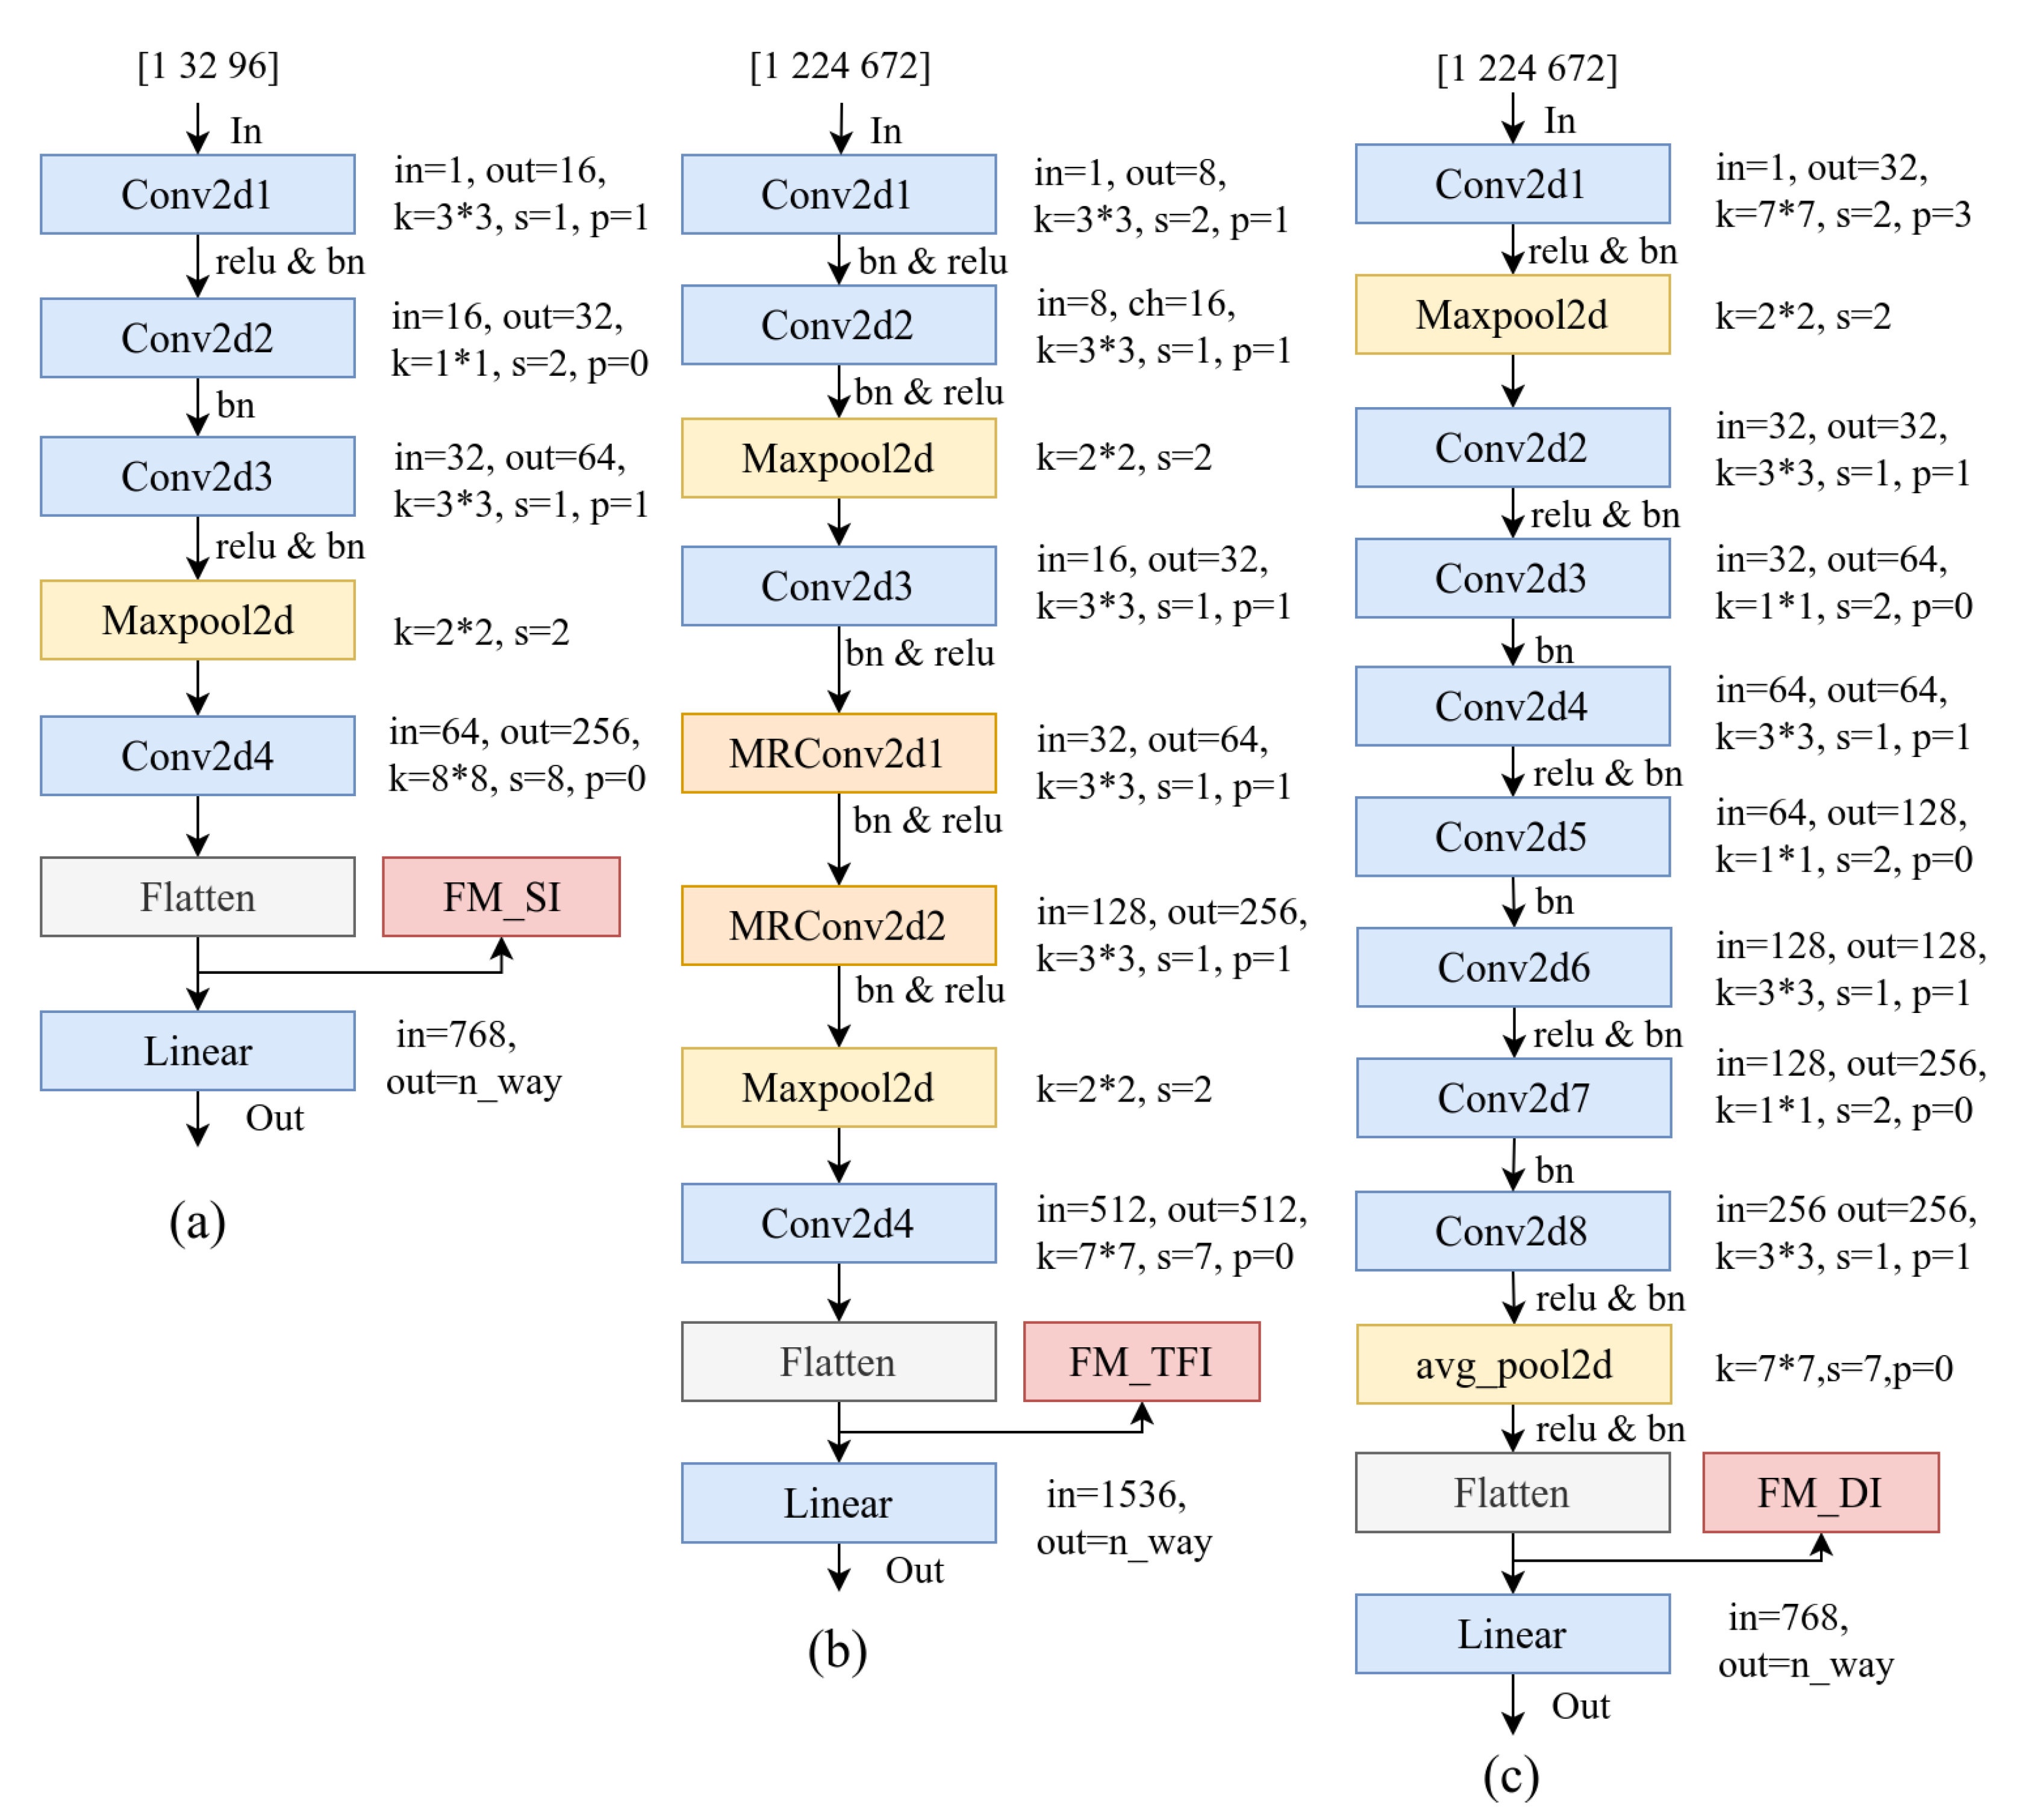
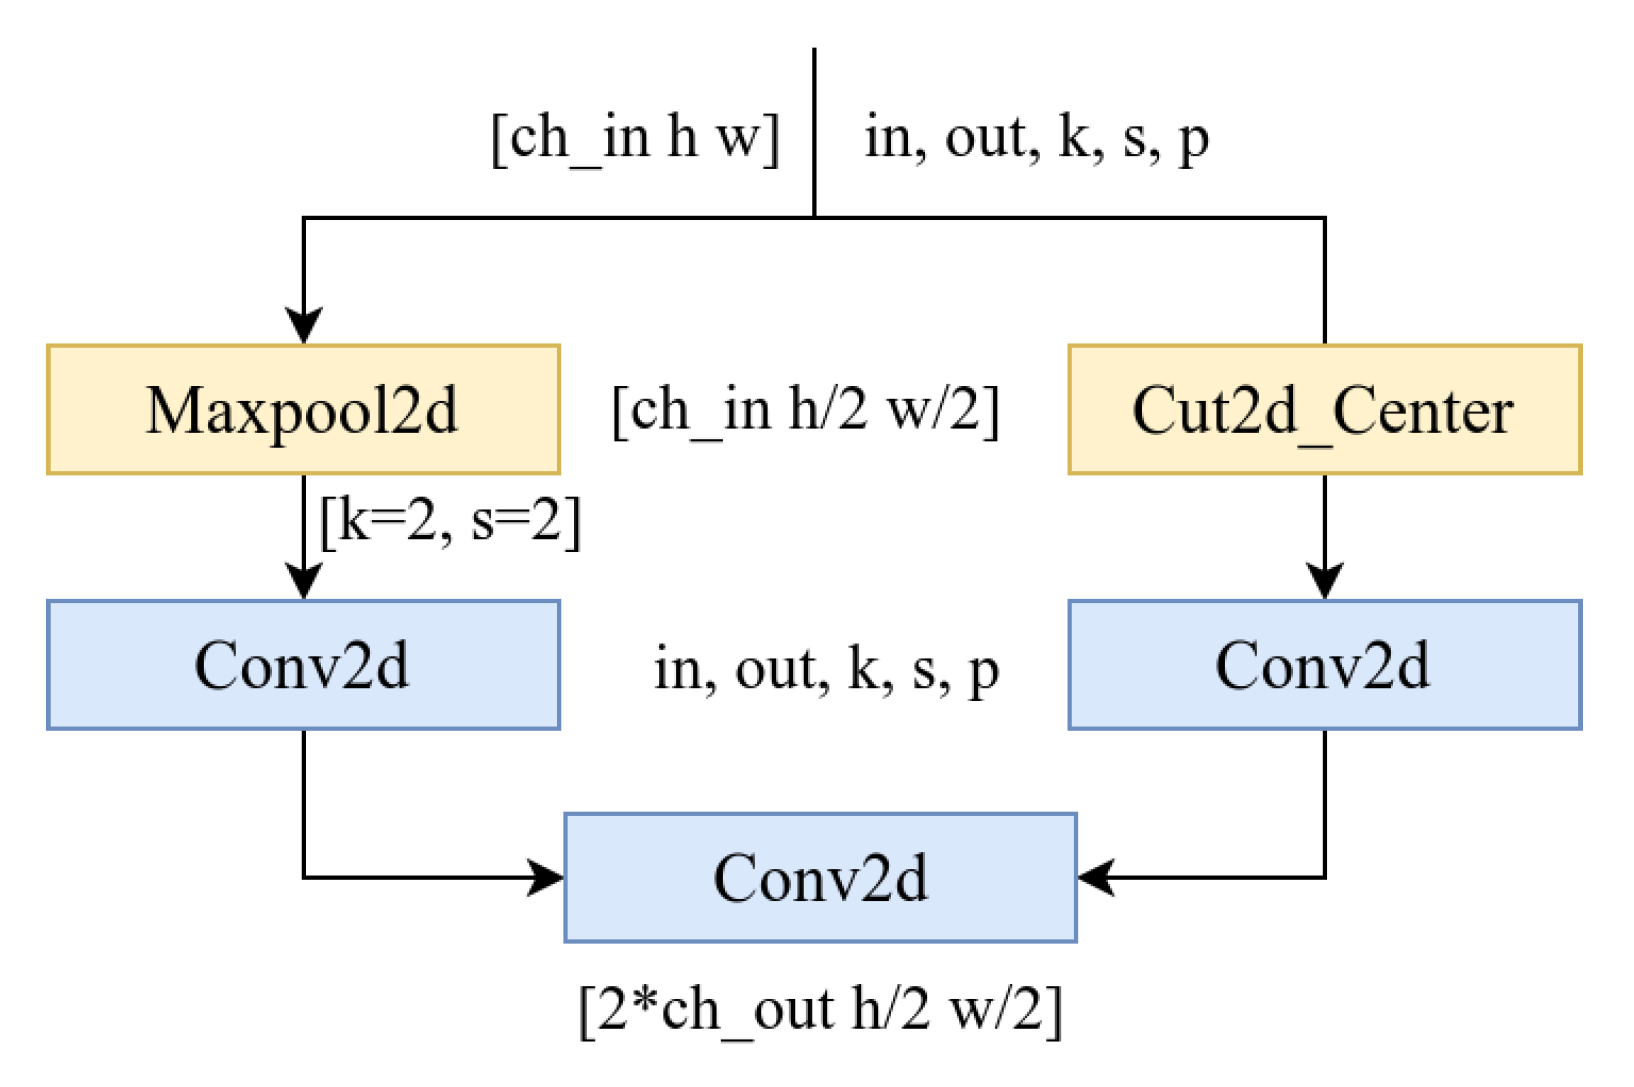
2.2.2. Design of Base Learners

The P3SF spectrum exhibits low resolutions and a relatively simple structural composition. To address this, HasNet-5 (Highlight Feature Network-5 for Active Sonar) was developed, as depicted in Figure 8a. In the ETFF spectrum, the density of spectral lines varies as a function of the relative horizontal orientation angle, thereby necessitating multi-resolution feature extraction. Consequently, MRConv (multi-resolution convolutional module) was introduced, as shown in Figure 9. Building upon the MRConv module, TFasNet-7 (Time–Frequency Feature Network-7 for Active Sonar) was designed to further enhance feature extraction capabilities, as illustrated in Figure 8b. The DFSDF spectrum captures the Doppler components of the target echoes, and it is characterized by energy peaks of varying shapes and sizes. To improve the network’s feature representation capability, its width was increased, resulting in the development of DasNet-9 (Doppler Feature Network-9 for Active Sonar), as presented in Figure 8c.
In Figure 8, in denotes the number of input channels, out denotes the number of output channels, k denotes the size of the convolution kernel, * denotes the times sign, s denotes the convolution stride, and p denotes the padding length. Additionally, In indicates the input data, while Out corresponds to the output data. The 2D convolutional layer components in HasNet-5, TFasNet-7, and DasNet-9 serve as the feature extraction networks (FNet), while the fully connected layers function as the classification networks (CNet). The loss function is defined using the cross_entropy function. FM_SI, FM_TFI, and FM_DI represent the feature output vectors of the feature extraction network, acting as data interfaces for fusing target task information.
In Figure 9, ch_in specifies the number of channels in the input data, h represents the height of the input data, and w denotes its width. Furthermore, ch_out refers to the number of output channels for each of the two processing streams. Finally, the Cut2d_Center module performs cropping centered on either the maximum energy or geometric center of the feature map.
The training data for the base learners are derived from datasets associated with n-way classification tasks, and their parameter updates follow Equation (13):
θ i = θ i 1 α θ L ( f θ i 1 )
where θ i denotes the parameters of the base learner after the i-th update, θ i 1 denotes the parameters after the ( i 1 ) -th update, α represents the step size for updating the base learner, and θ L ( f θ i 1 ) is the gradient of the loss function L ( f θ i 1 ) .

2.2.3. Design of the Meta-Leaner

The meta-learner comprises an optimizer, a memory module, a sample library management module, and a base learner management module. It provides initialization parameters for the base learners and continuously generalizes commonalities across new tasks [26]. The network framework is illustrated in Figure 10.
The input samples of the meta-learner are fed in batches, in which each batch consists of n-batch classification tasks. For each batch of tasks, the commonalities among the tasks are summarized and continuously updated. Each task corresponds to an n-way classification task with k-shot samples per class. The parameter update process of the meta-learner is presented in Equation (14):
θ m j + 1 = θ m j β n = 1 N θ b L n ( f θ b n )
where θ m j denotes the initial parameters provided by the meta-learner to the base learner for the j-th batch task; β represents the step size for updating the meta-learner; N is the abbreviation of n-batch; θ b L n ( f θ b n ) is the gradient of L n ( f θ b n ) ; L n ( f θ b n ) represents the loss function for the n-th task within a batch on the query set.

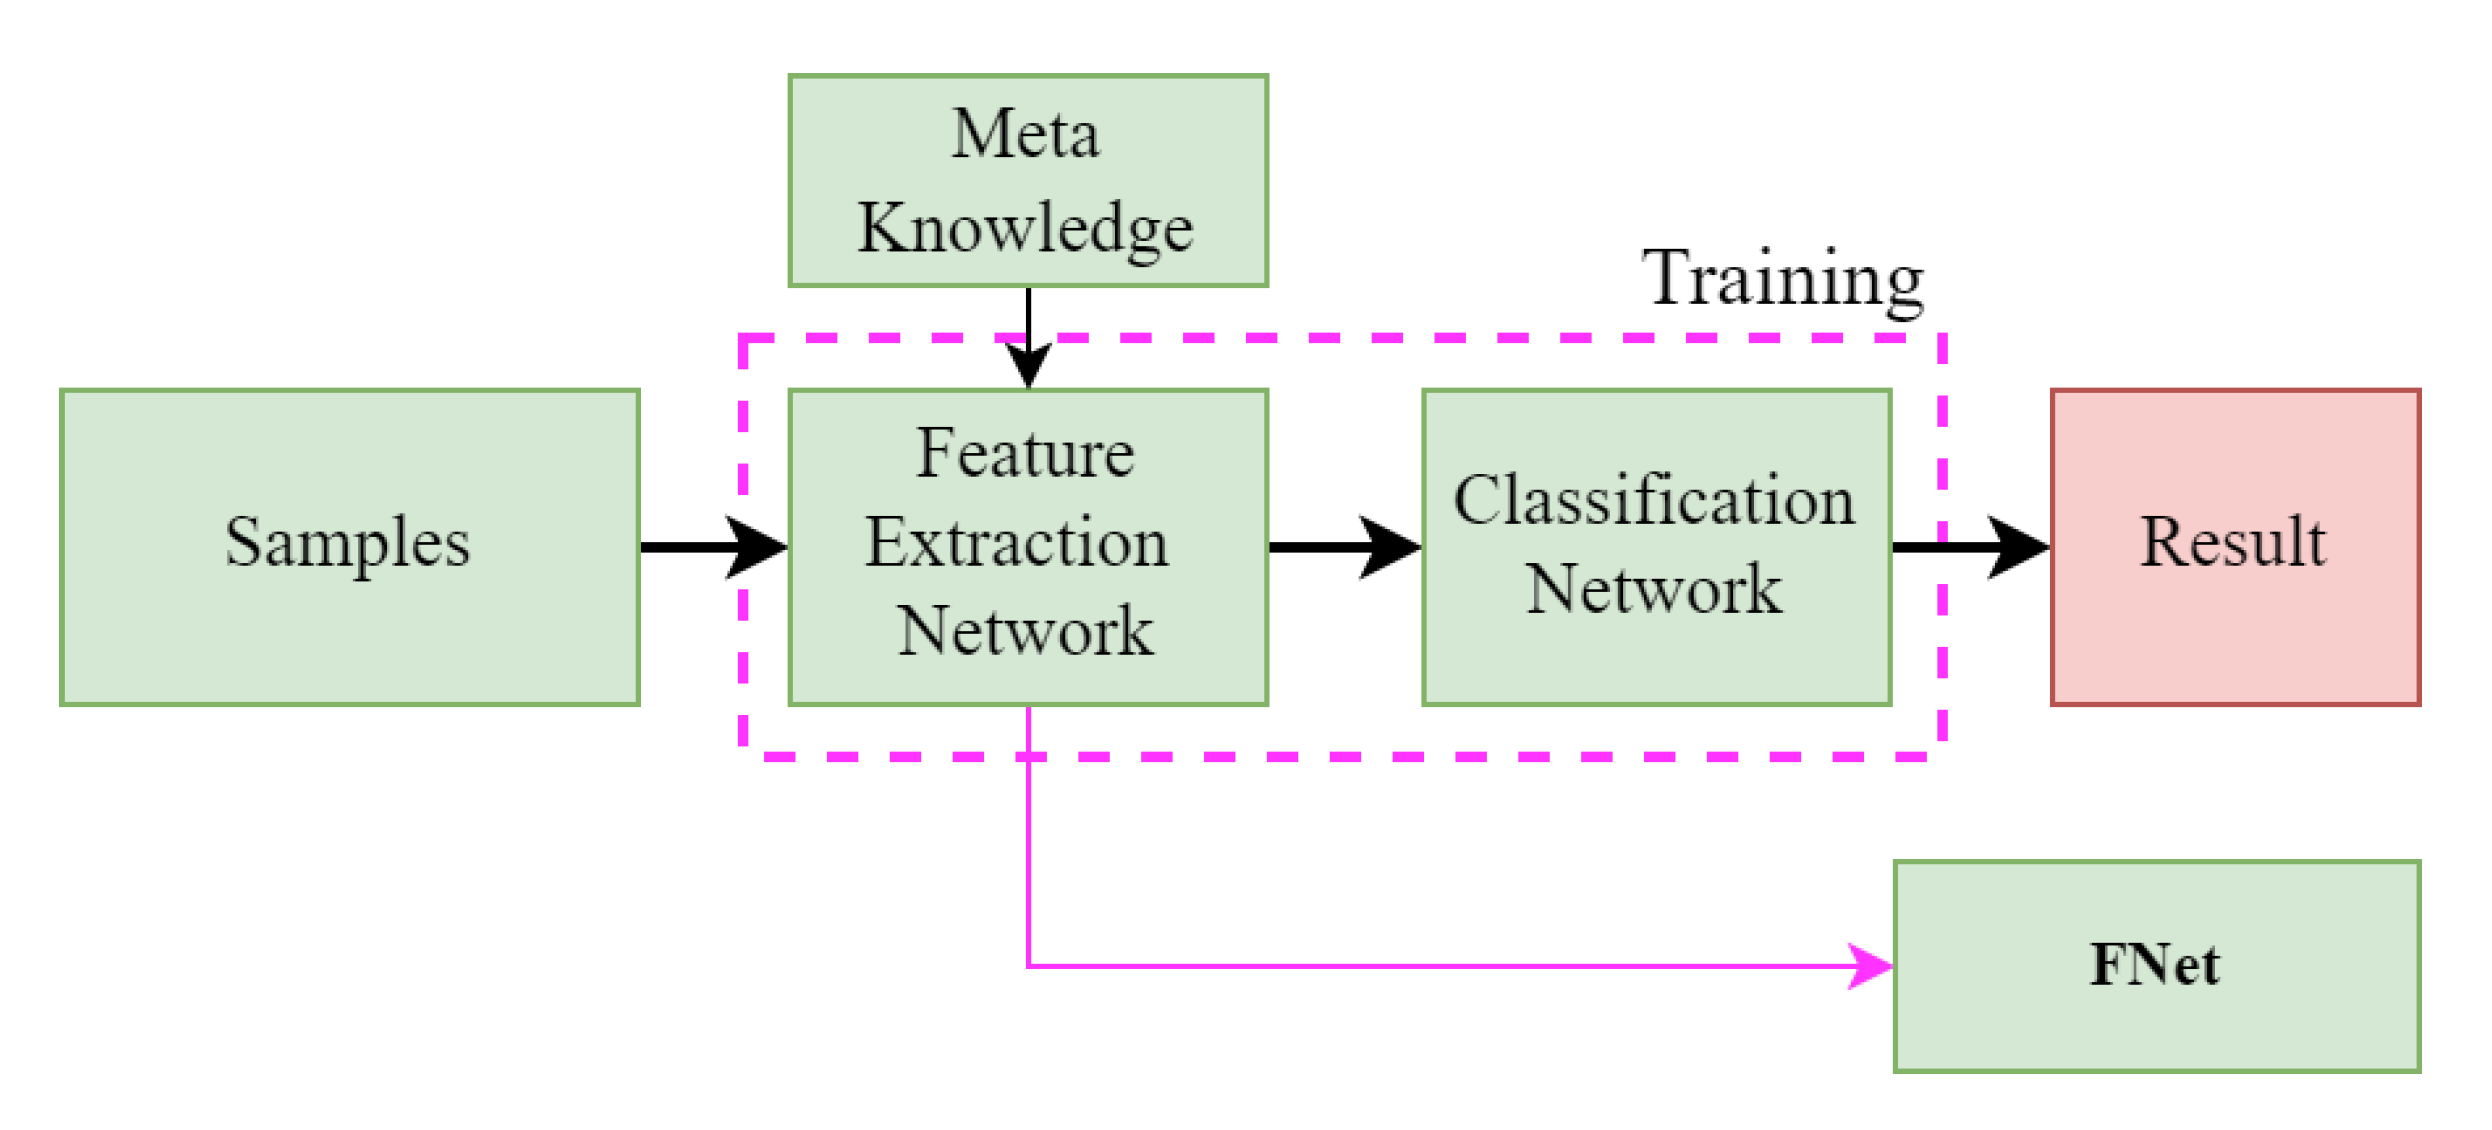
2.2.4. Structure of the Target Task Network

The feature extraction component of the target task network for each feature is identical to that of the base learner. Its construction leverages meta-knowledge MK_S, MK_TF, and MK_D, acquired during the meta-learning phase. The classifier is designed based on the requirements of the target task (either multi-classification or binary classification). During the meta-learning phase, the output dimensionality of the base learner’s classifier is uniformly set to 5. The output dimensionality of the target task network is 2, enabling it to perform truth-or-falsehood classification for the target. The target task network for each feature is trained independently. The network’s architecture and training methodology are illustrated in Figure 11. The input data for this network consist of the feature spectrum corresponding to one of the three specific features. After training, the feature extraction networks for spatial, time–frequency, and Doppler domains are obtained, corresponding to FNetS, FNetTF, and FNetD, respectively.

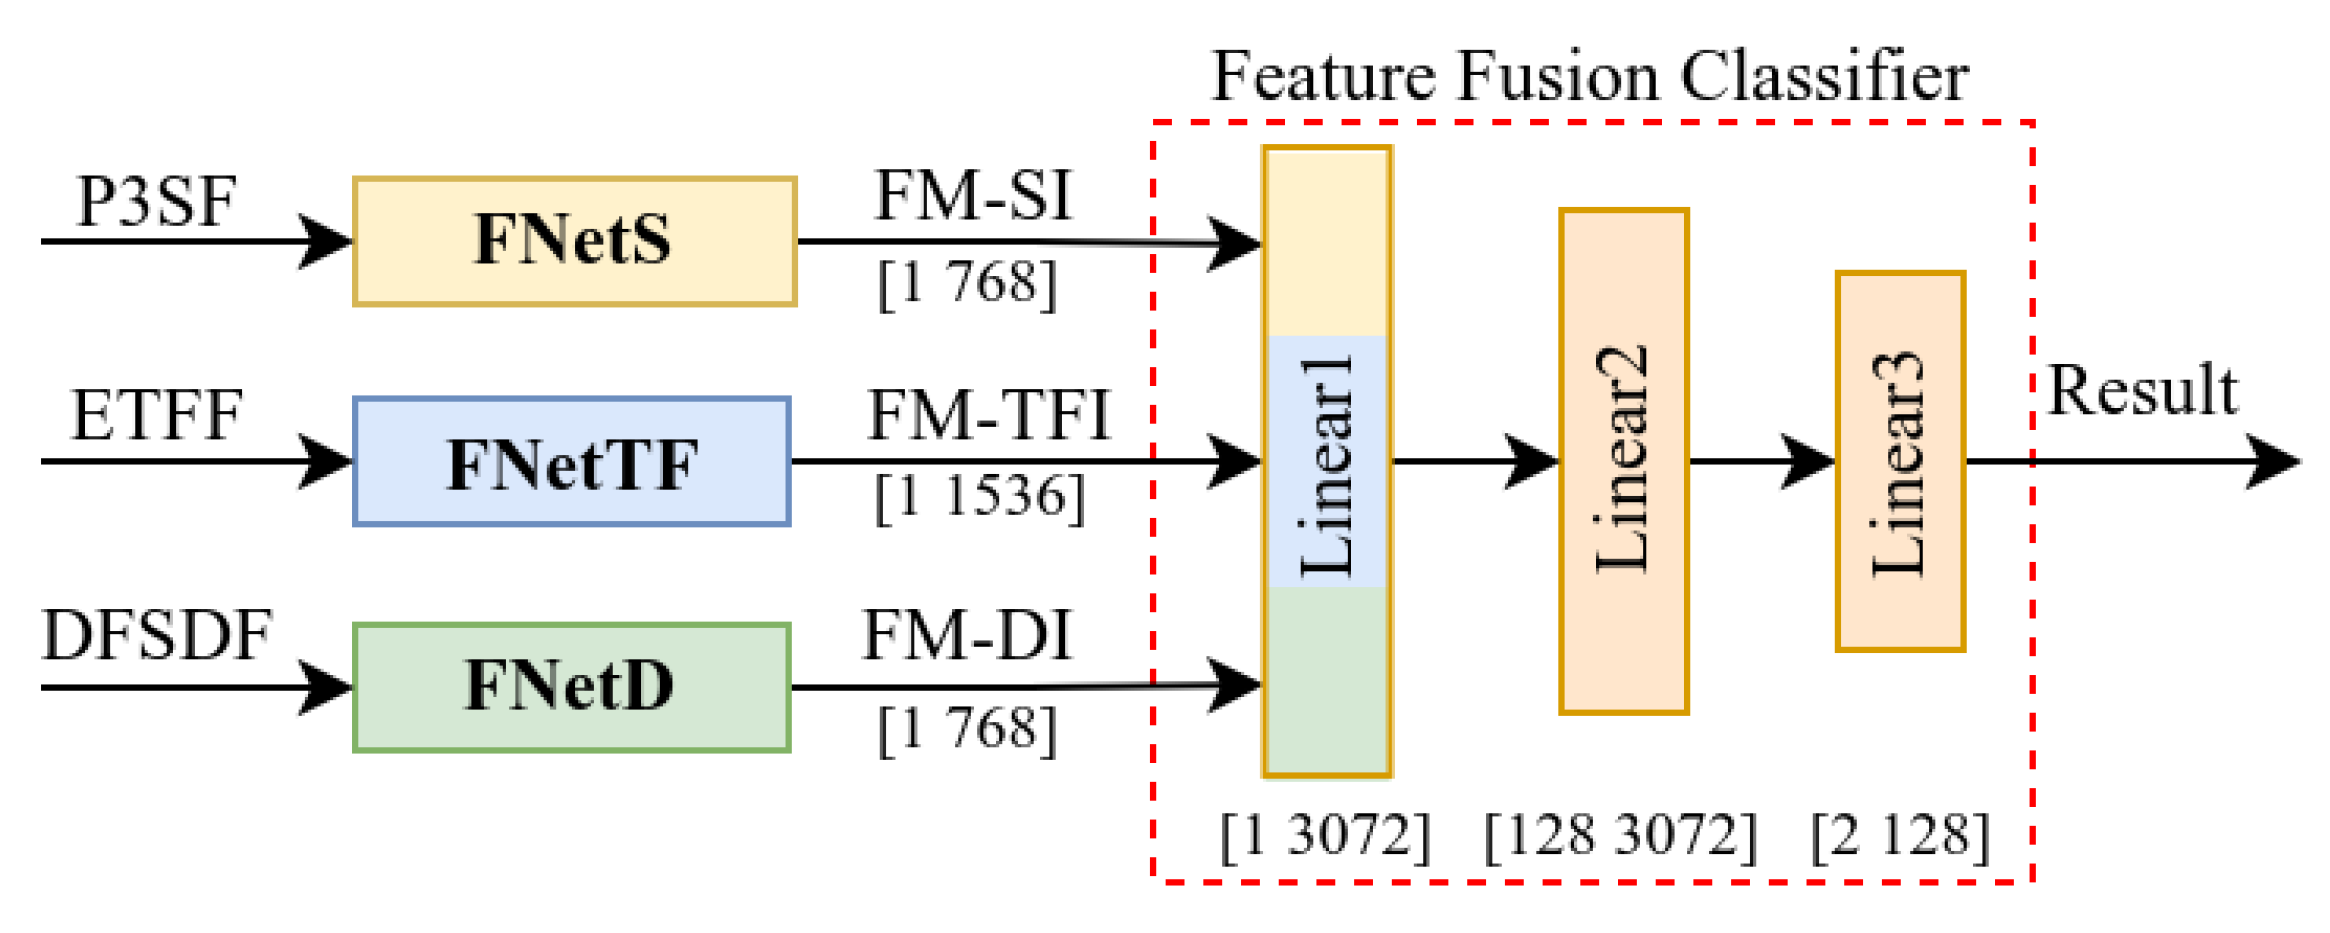
2.2.5. Multidimensional Feature Fusion Network

The goal of multidimensional feature fusion is to leverage complementary feature information to improve target recognition performance and environmental adaptability. Based on the feature extraction networks FNetS, FNetTF, and FNetD, a feature fusion classifier (FFC) was designed, resulting in the construction of the MFasNetV1 network (Multidimensional Feature Fusion Network for Active Sonar). The architecture of this network and the parameters of the fusion classifier are illustrated in Figure 12.

3. Results

3.1. Dataset

The array element domain simulation data were generated based on the fundamental highlight models of the underwater vehicle and four types of interference, as illustrated in Figure 13a,b [9].
The active sonar array consists of 25 elements configured as [1 3 5 7 5 3 1], arranged at half the wavelength corresponding to the center frequency of 24 kHz. The transmitted signals include single-frequency tones and linear frequency-modulated waveforms, with a pulse duration of 70 ms. The relative horizontal orientation angles of the active sonar relative to the target’s tail are set to 15 ° , 30 ° , 45 ° , 60 ° , 75 ° , and 90 ° , while the relative pitch angle is fixed at 1.5 ° . The distance between the sonar reference center and the geometric center of the target ranges from 350 to 450 m. Additionally, the sonar platform operates at a speed range of 25 to 35 knots, while the target proceeds at a speed range of 10 to 20 knots.
Underwater moving targets generally exhibit a streamlined shape, and their feature spectra vary with the relative attitude [27]. In the meta-learning phase, different targets and their respective relative horizontal orientation angles are treated as distinct categories. Additionally, variations in relative horizontal orientation angles for the same target are also classified as separate categories. For example, given E types of targets and F types of relative horizontal orientation angles, this results in a total of E × F unique categories. Assuming that one of the meta-learning classification task T i involves five-class classification (n-way = 5), any five categories are randomly selected from a total of E × F categories, denoted as C E × F 5 . During training for each task, a small number of samples (k-shot = 4) are utilized. Thus, the task space for meta-learning is constructed as T = T 1 , T 2 , . . . , T M .
The meta-learning sample library consists of the support and query sets. Based on the basic model presented in Figure 13, adjustments were carried out on the number of highlights, their intensity, and their distribution; this was designated as Parameter Configuration 1 (PC1). The settings of RHOA and RPA for generating samples in the support set are detailed in Table 2. The value of RHOA follows a Gaussian distribution with a mean specified in Table 2 and a variance of 1.5.
In total, 30 combinations were constructed based on the target types and relative horizontal orientation angles, with 20 samples generated for each combination, resulting in a total of 600 samples. The sample generation method is based on approaches presented in [28]. Each of the 30 combinations was treated as a distinct target type. By setting the number of tasks, M, to 25,000 and the batch size, N, to 10, the meta-learning support set was established. Following the methodology and parameters used for generating the support set, adjustments were made to the number of highlights, their intensity, and their distributions; this was designated as Parameter Configuration 2 (PC2). Subsequently, 20 new samples were regenerated for each combination, forming the meta-learning query set.
The target task sample library consists of a training set, a validation set, and a test set. Underwater vehicles are treated as true targets, whereas the four types of interferences (I–IV) are classified as false targets. Effective data were extracted from the experimental dataset, with homogeneous data excluded. This process yielded 60 samples for type I interference A (three elements), 60 samples for type I interference B (four elements), 50 samples for type II interference (four elements), 50 samples for type III interference (four elements), 50 samples for type IV interference (five elements), and 100 samples for underwater vehicles. Among these experimental data samples, the target speed range from 10 to 20 knots, with varying signal-to-noise ratios, and the samples were classified based on target type and RHOA. From these, 100 samples were proportionally selected to construct the training set, 65 samples were chosen for the validation set, and the remaining 205 samples formed the test set. During data selection, care was taken to ensure that the training set did not include data from the same experiments as those in the validation or test sets. Due to the unbalanced distribution of experimental data, simulation data were employed for data augmentation. Based on the parameters outlined in Table 2, adjustments were made to the number of bright spots, their intensity, and their distribution; this was designated as Parameter Configuration 3 (PC3). For each combination, 20 samples were regenerated, resulting in a total of 600 samples, from which 160 were selected for the training set. The number of bright spots, their intensity, and their distribution were further adjusted and marked as Parameter Configuration 4 (PC4). Again, 20 samples were regenerated for each combination, and 140 were selected for the validation set. The composition of the target task sample library is detailed in Table 3. Both the training and validation sets comprise experimental and simulation data, while the test set exclusively contains experimental data.

3.2. Evaluation Metrics

In accordance with the principle of minimizing the risk of missed detection, classification accuracy is employed as an evaluation metric during the training and validation phases of the network, as presented in Equation (15). A higher classification accuracy indicates a more effective network training outcome:
A c c u r a c y = T P + T N T P + T N + F P + F N
where T P denotes the true-positive cases, T N denotes the true-negative cases, F P denotes the false-positive case, and F N denotes the false-negative case.
The recall rate is utilized as an evaluation metric during the testing phase of the network, as shown in Equation (16).
R e c a l l = T P T P + F N
A higher recall rate signifies a greater proportion of correctly classified samples for a specific type of data. Additionally, the confusion matrix is employed to assess the classification performance of the trained network model across all types of test samples.

3.3. Results and Analysis

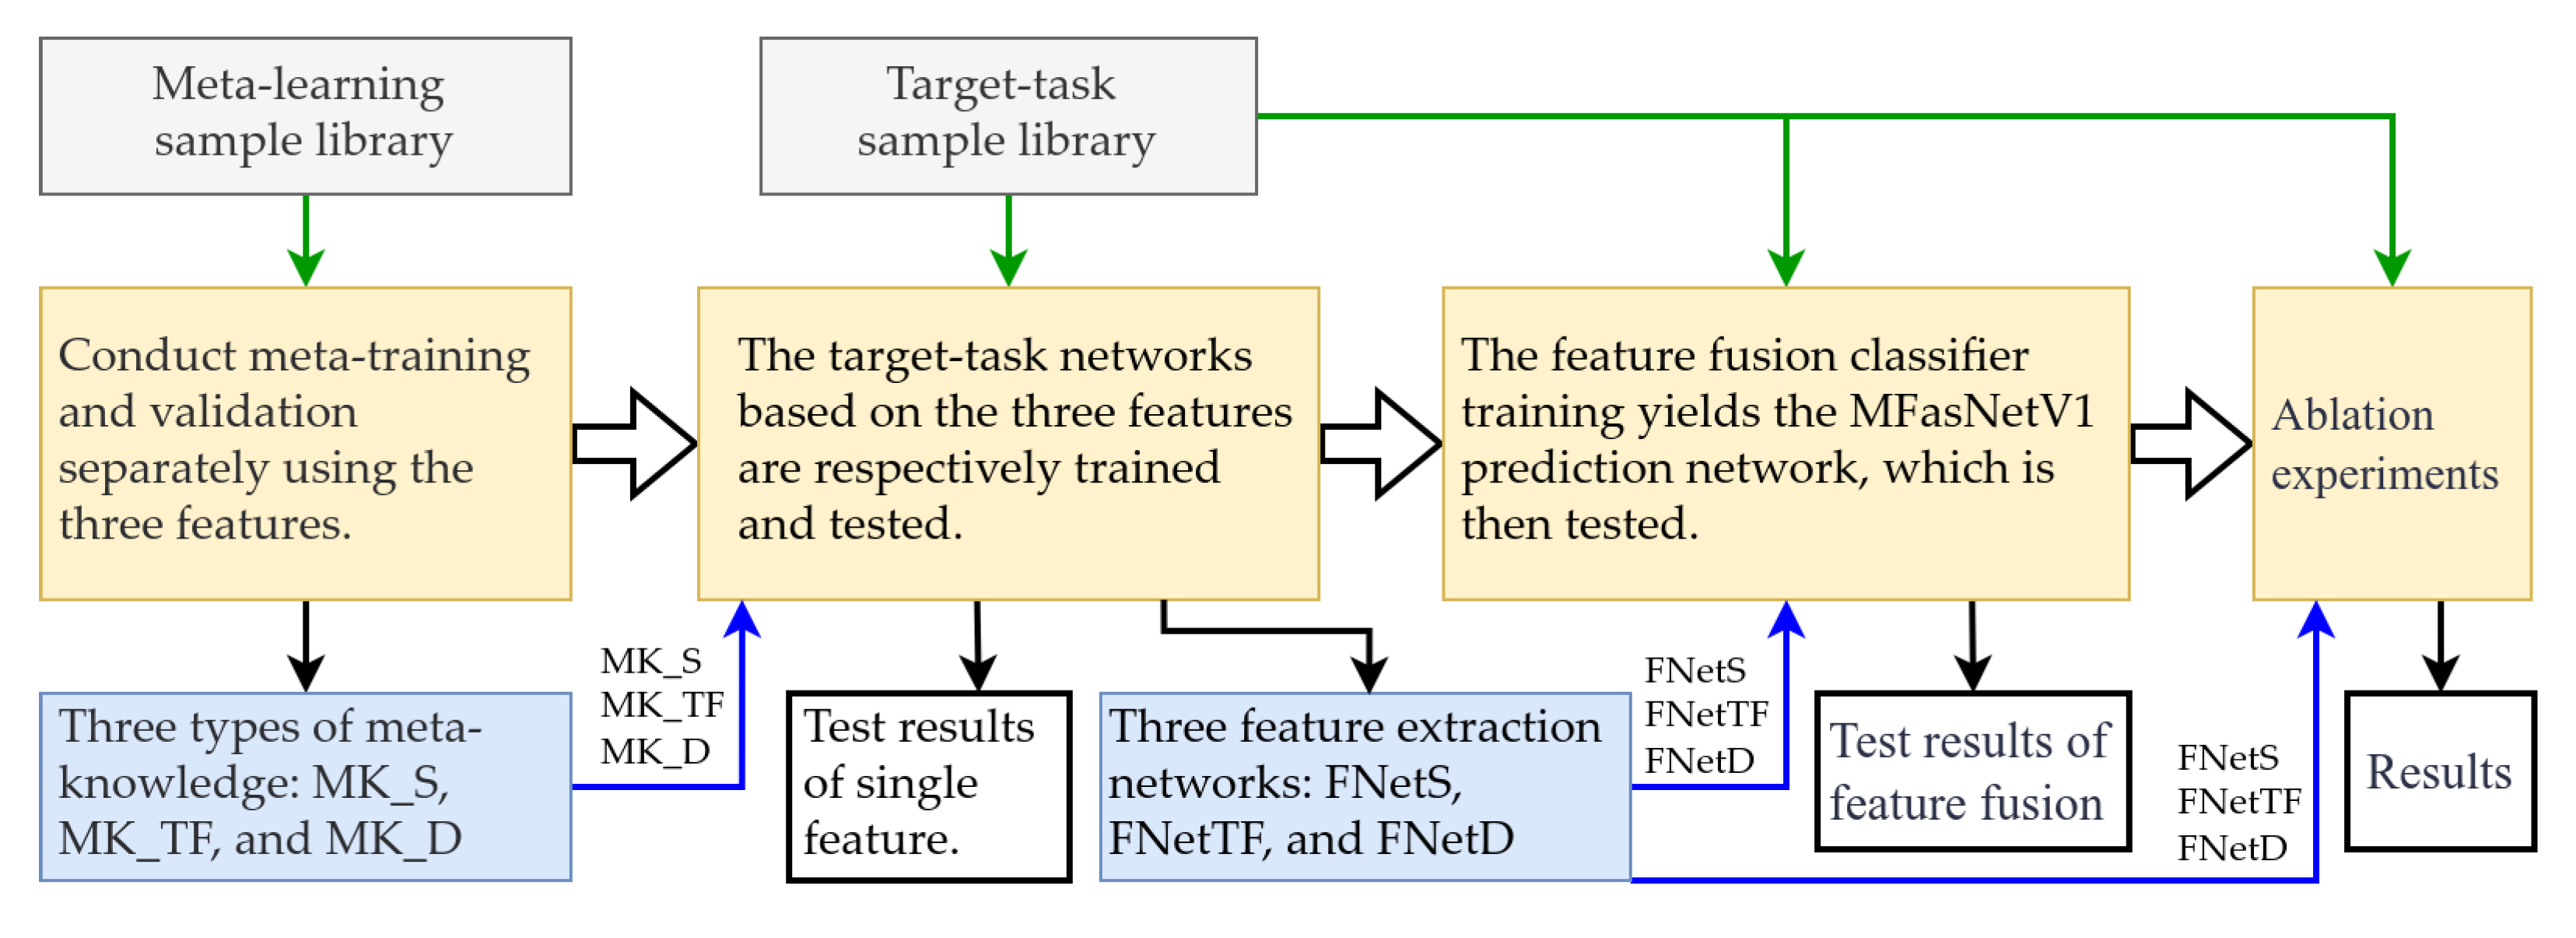
3.3.1. Overview of the Verification Process

Firstly, based on the model presented in Figure 10, the base learners corresponding to the three features were individually utilized for meta-training and validation to acquire meta-knowledge. Secondly, leveraging the obtained meta-knowledge and the network architecture depicted in Figure 11, three target task networks were constructed using the three base learners, followed by respective training, validation, and testing processes. After completing the training, three feature extraction networks were derived. Subsequently, based on MFasNetV1 illustrated in Figure 12, the parameters of the feature extraction networks were fixed, and the feature fusion classifier underwent training and testing. Finally, ablation experiments were carried out. A schematic diagram of the verification process is provided in Figure 14.

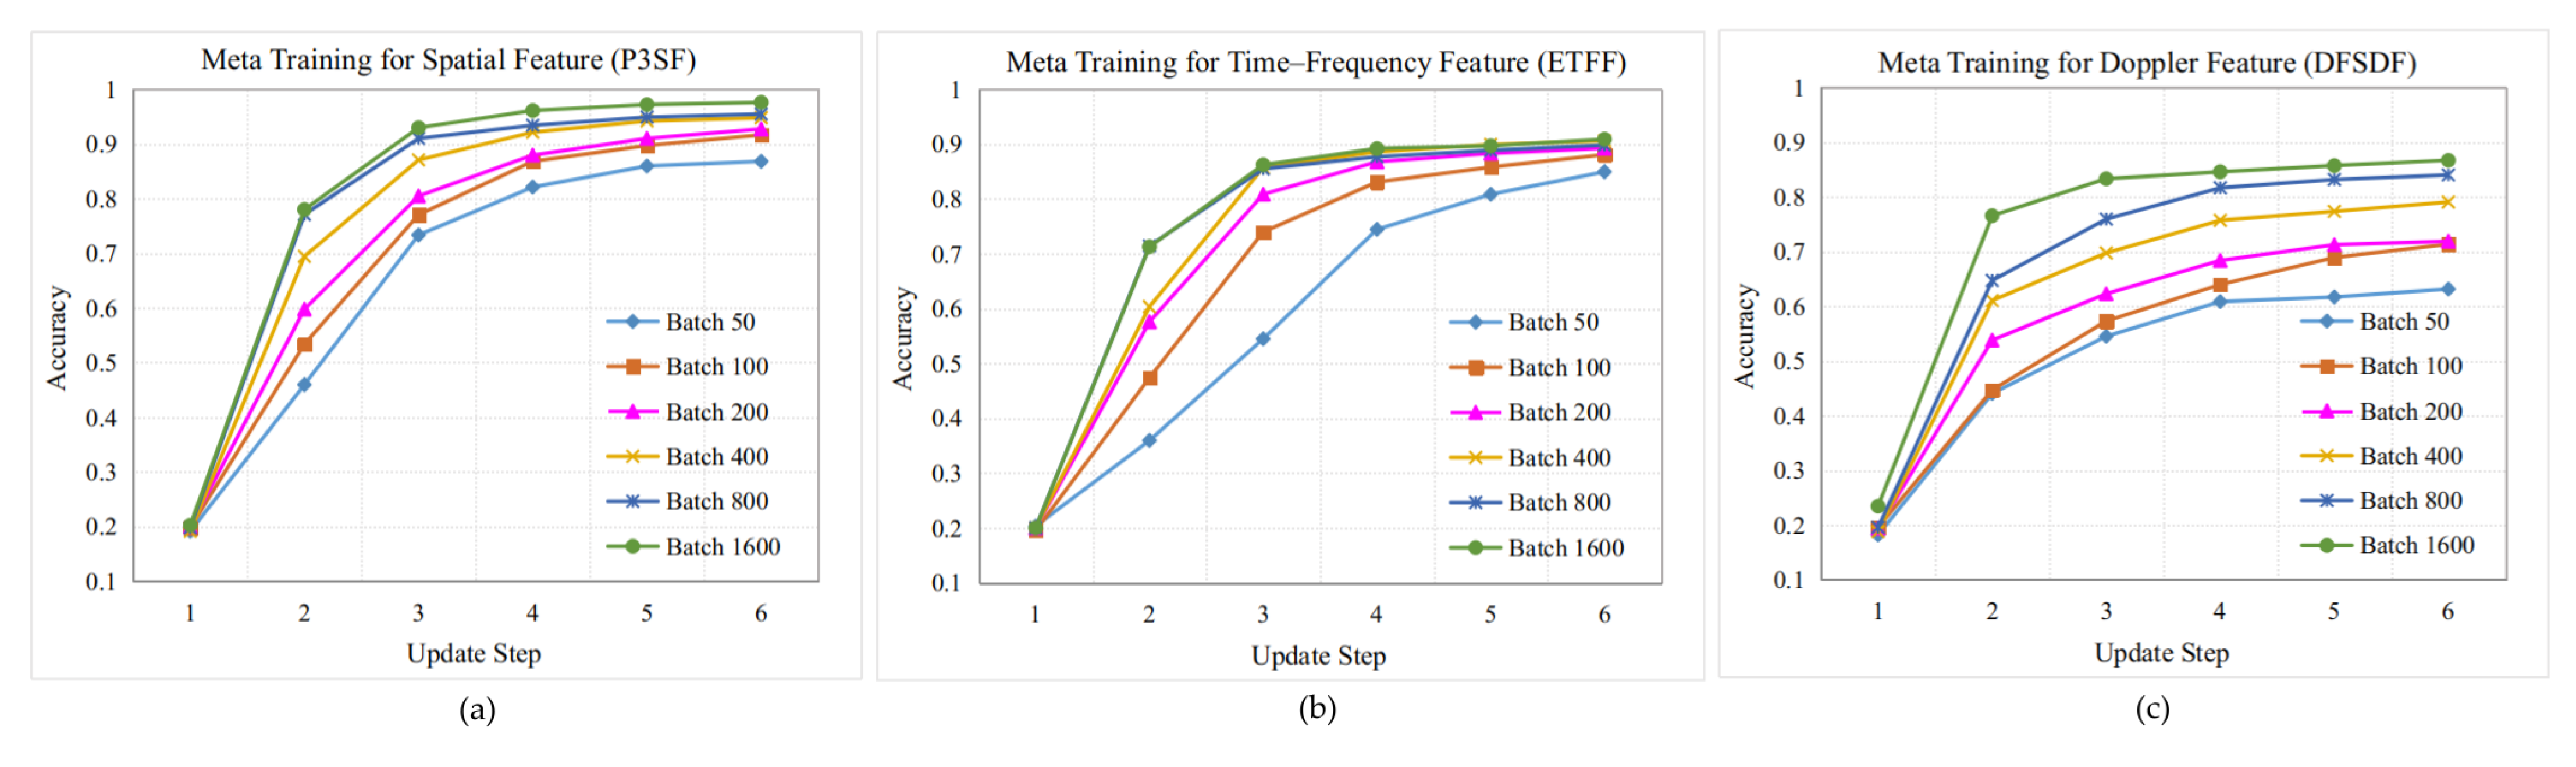
3.3.2. Meta-Learning Training

Within the meta-learning framework (as depicted in Figure 10), the meta-learning support and query sets introduced in Section 3.1 were utilized to train and evaluate the base learners corresponding to spatial, time–frequency, and Doppler features. The parameter update process of the base learner are as shown in Equation (13), and that of the meta-learner is as shown in Equation (14). The validation accuracy curves for the training processes of each feature are presented in Figure 15a–c.
In Figure 15, batch 1600 illustrates the validation curve of the base learner’s five parameter updates after completing 1600 meta-training batches. After meta-learning training, the query set test accuracy rates for spatial, time–frequency, and Doppler features are 96.8%, 90.9%, and 86.7%, respectively. The meta-learning task space captures the differences in target types and relative horizontal orientation angles, with the most pronounced distinctions observed in spatial features, followed by time–frequency features; the least pronounced distinctions were observed in Doppler features. Through meta-learning training, each feature extraction network acquired the ability to represent the features of various targets across different relative horizontal orientation angles, which constitutes the meta-knowledge.

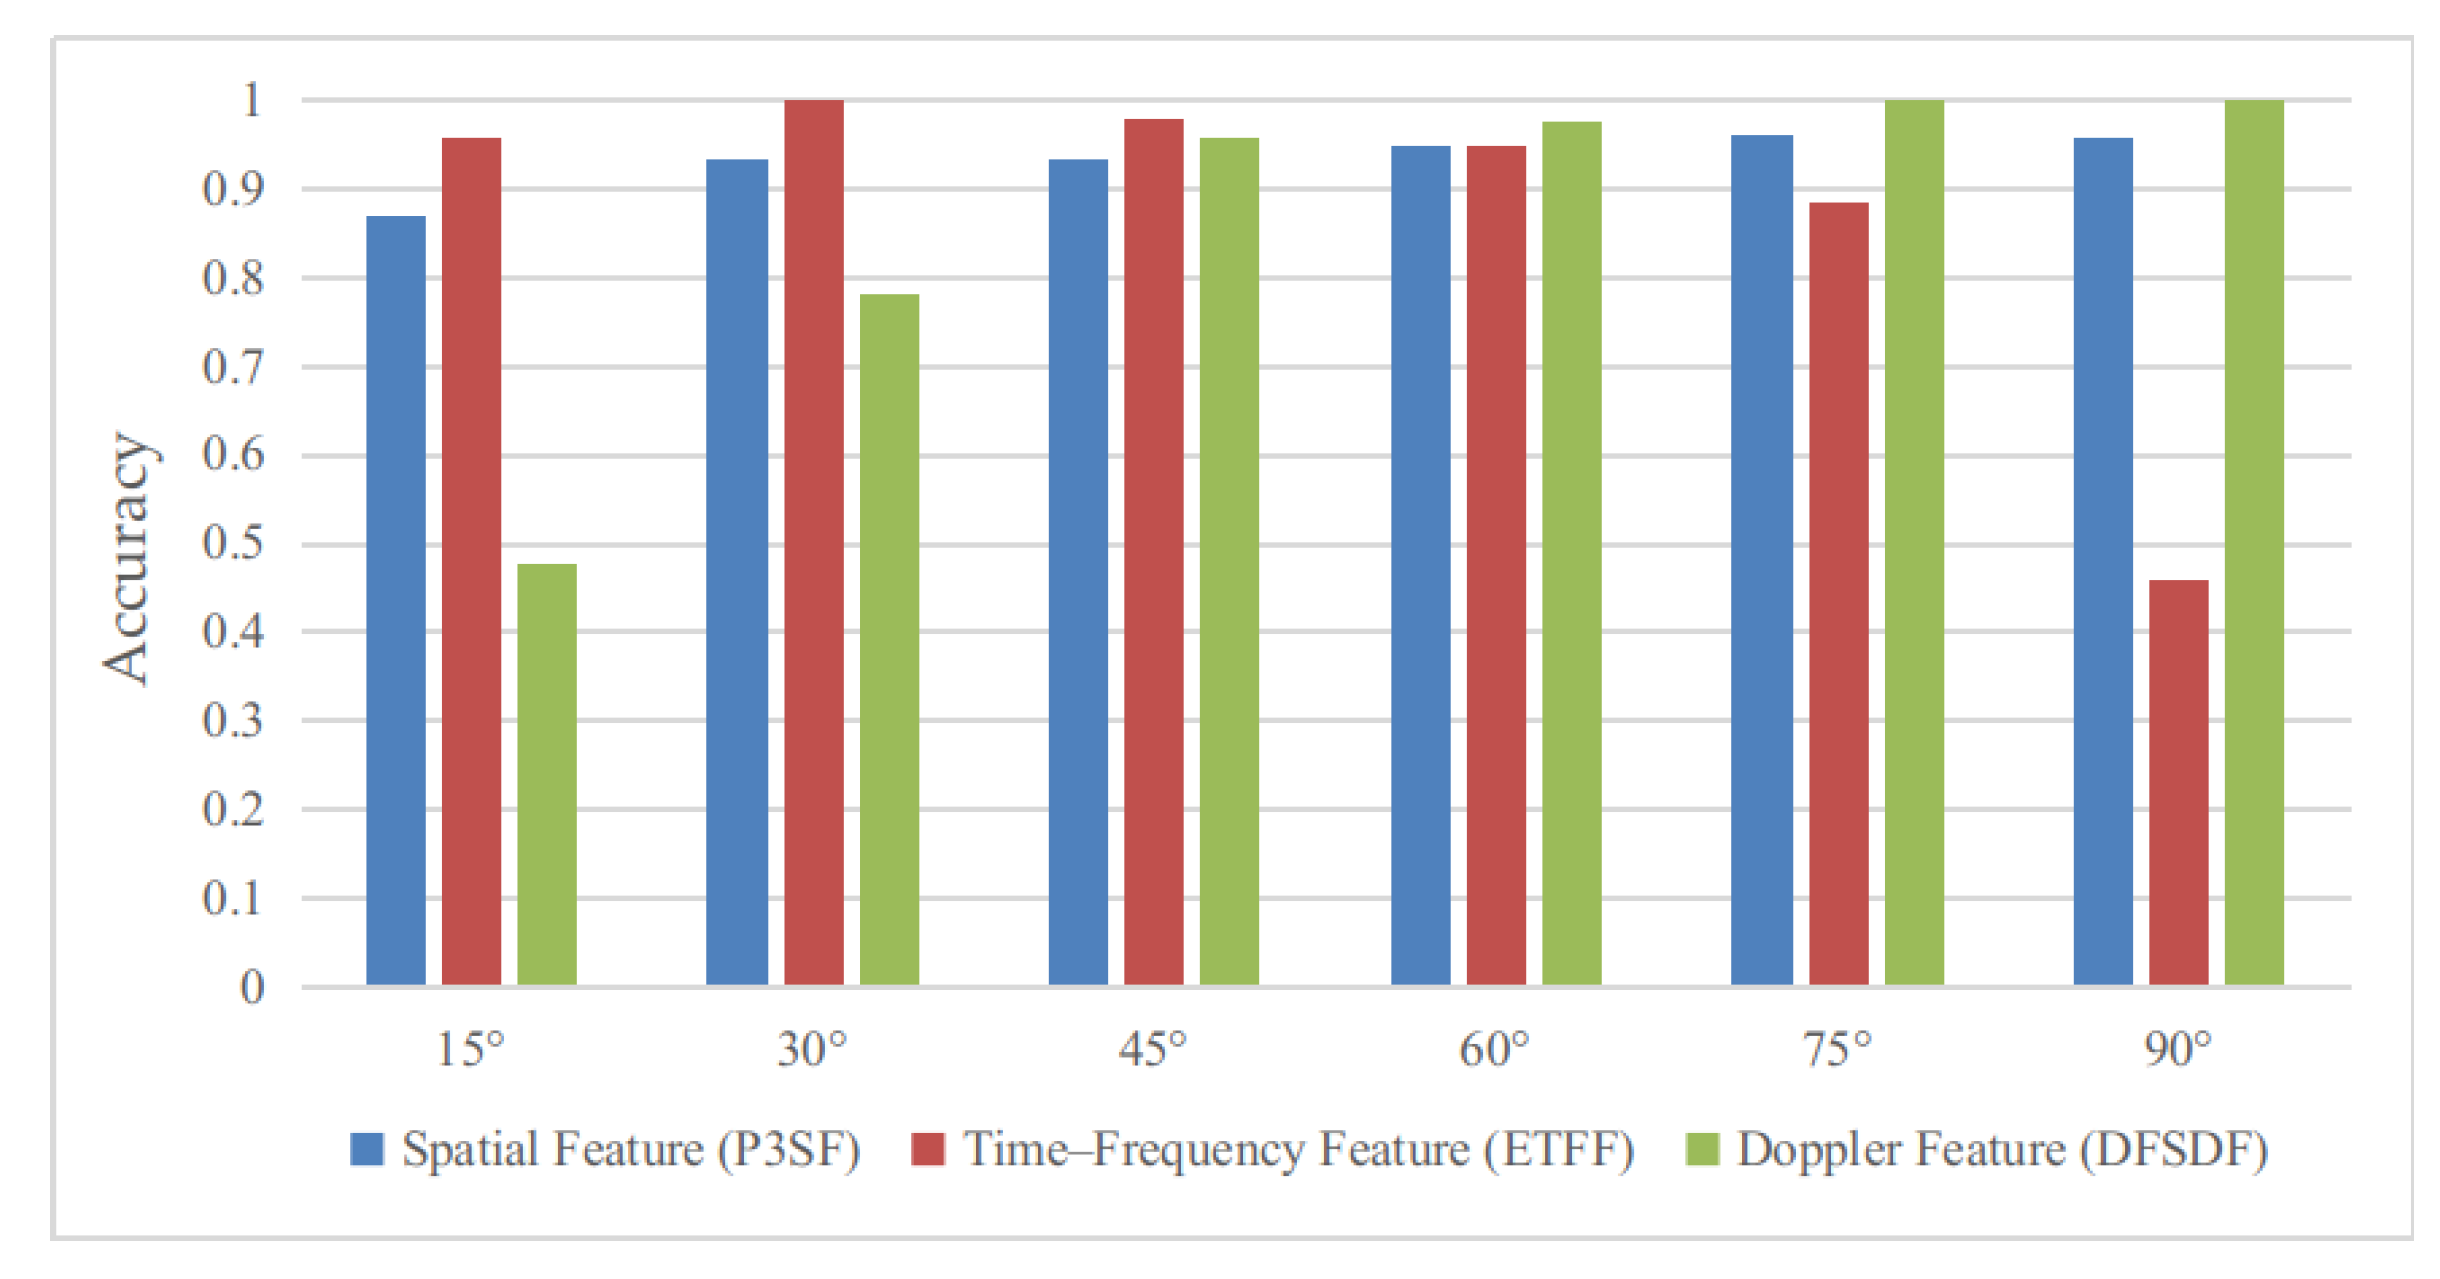
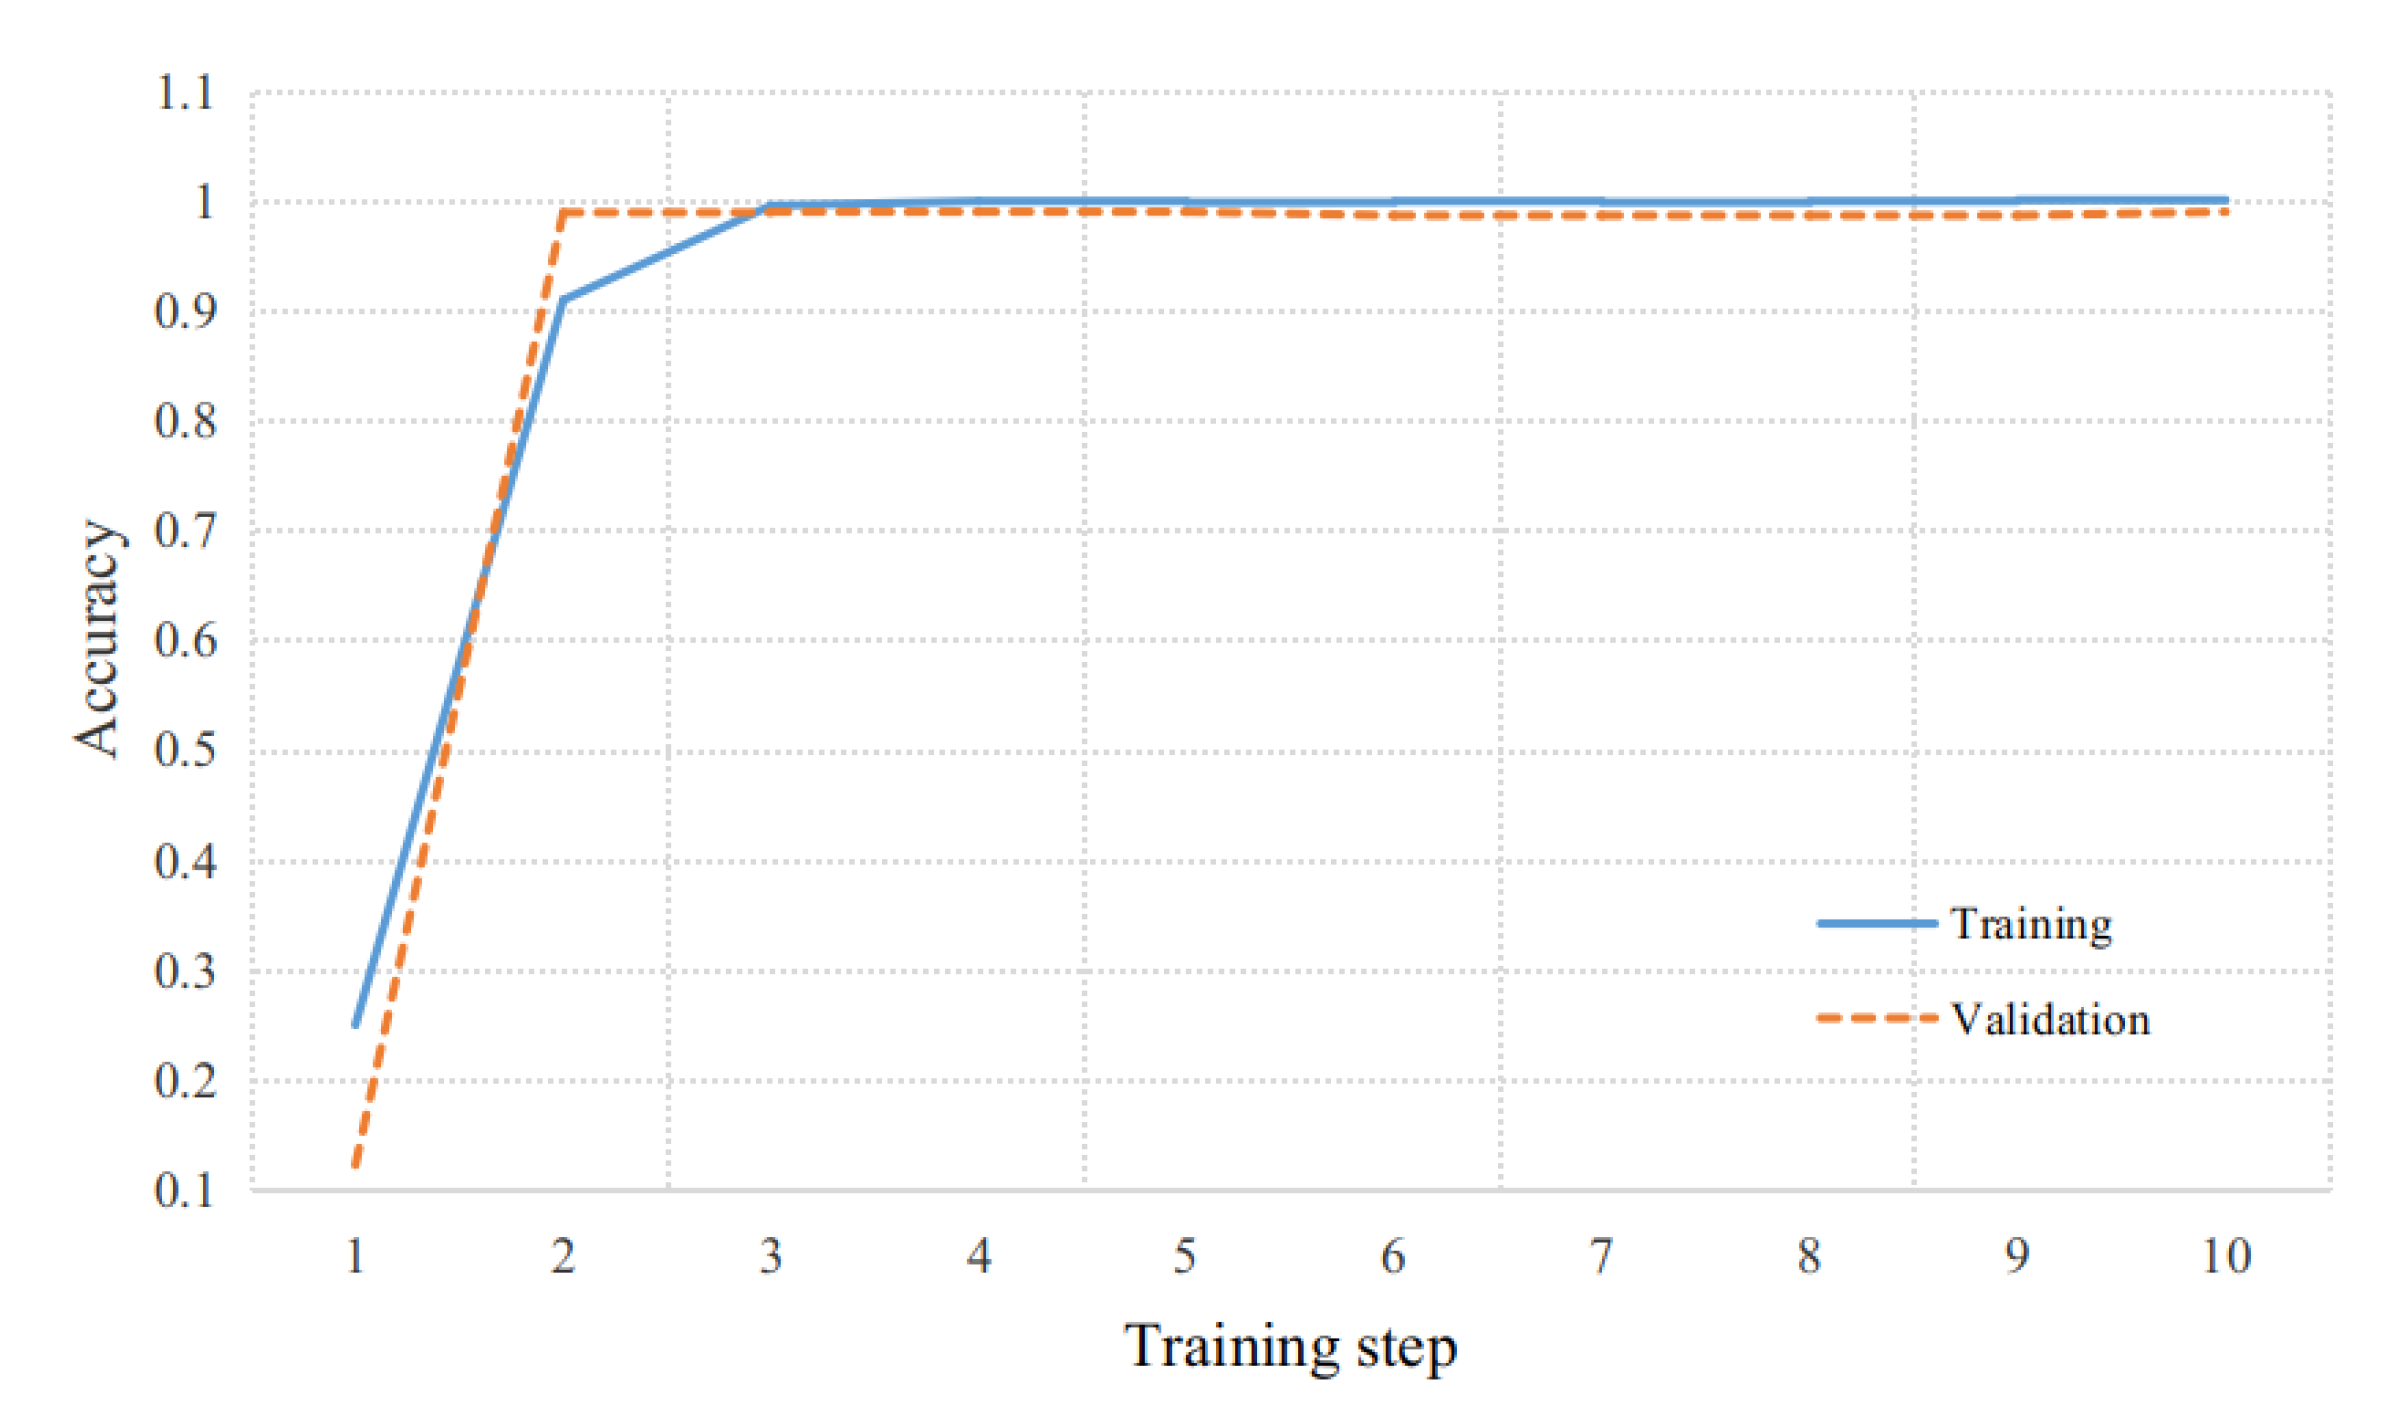
3.3.3. Training and Testing of the Target Task Network

Based on the feature-specific target task networks described in Section 2.2.4, the training and validation sets from the target task sample library were utilized to train the corresponding feature extraction networks for the three features. The validation curves derived from the training process of each feature-extracting network are illustrated in Figure 16.
In Figure 16, each step on the horizontal axis represents a training iteration with 20 samples, and the entire process encompasses two complete training epochs. As shown via the curves, when meta-knowledge is utilized, the validation accuracy rates of the target task networks for spatial, time–frequency, and Doppler features after three steps of training are 87.3%, 91.2%, and 84.8%, respectively. Upon the completion of training, the test set samples were employed for evaluation. The test accuracy rates of the target task networks for spatial, time–frequency, and Doppler features are 93.6%, 90.2%, and 87.8%, respectively. The relationship between the test accuracy rates for each feature and the target relative horizontal orientation angle is depicted in Figure 17.
As shown in Figure 17, the spatial feature P3SF achieves a classification accuracy of 87% at a relative horizontal orientation angle of approximately 15 ° . This successfully addresses the challenge of distinguishing between multiple-source interferences and volume targets at small relative horizontal orientation angles in conventional spatial spectrum estimation. The time–frequency feature ETFF demonstrates a marked decrease in classification accuracy for samples with a relative horizontal orientation angle exceeding 75 ° ; moreover, the Doppler feature DFSDF shows relatively low classification accuracies for samples with a relative horizontal orientation angle below 30 ° . The two features, ETFF and DFSDF, exhibit significant complementary advantages in relation to the relative horizontal orientation angle.

3.3.4. Training and Testing of MFasNetV1

Based on the multidimensional feature fusion network described in Section 2.2.5, the training and validation sets from the target task sample library were utilized for training. During the training process, the weight parameters of each feature extraction network were kept fixed, while the feature fusion classifier was trained independently. The validation curve obtained during the training process is presented in Figure 18. After three steps of training, the classifier achieved convergence, with a validation accuracy of approximately 99.0%. After the completion of training, a multidimensional feature fusion recognition network capable of prediction was developed, as illustrated in Figure 12.
Finally, the proposed multidimensional feature fusion recognition network MFasNetV1 was evaluated for inference performances using the target task test set, obtaining an accuracy rate of 97.1%. The corresponding confusion matrix is presented in Table 4.
As shown in Table 4, three interference samples were misclassified as volume targets, while three volume targets were misclassified as interference. Compared to single features, the fusion of spatial, time–frequency, and Doppler features significantly enhances target recognition capabilities. The P3SF, ETFF, and DFSDF features extracted in this study, along with the MFasNetV1 information fusion network, are validated as effective solutions. Furthermore, they significantly address the adaptability challenge associated with the target’s relative horizontal orientation angle in the few-shot scenario.

3.3.5. Ablation Experiments

In Section 3.3.3, the target task networks were trained and tested using a single feature. In Section 3.3.4, the three-feature fusion network based on MFasNetV1 was trained and tested. In this subsection, the network structure in Figure 12 was utilized for training and testing the fusion of two features, following the same procedure as in Section 3.3.4. All results are summarized in Table 5.
Specifically, the test accuracy improves from 93.6% to 96.6% when fusing the spatial feature P3SF with the time–frequency feature ETFF, from 93.6% to 95.6% when combining P3SF with the Doppler feature DFSDF, and from 90.2% to 96.1% when fusing ETFF with DFSDF. The accuracy increases to 97.1% when the three features were fused.

4. Discussion

Information fusion is typically categorized into three levels—data-level, feature-level, and decision-level fusion—depending on the stage at which it occurs [29]. The proposed MFasNetV1 network performs fusion of the feature maps output by each feature extraction network, thereby achieving feature-level information fusion. Furthermore, during the testing of the target task networks in Section 3.3.3, classification probability data for each feature were obtained. By applying an average weighting method to these probabilities, a decision-level test result can be derived, yielding a test accuracy of 94.1%; while using a feature adaptation factor function to implement variable weighting values could theoretically improve the accuracy, fitting such a function becomes increasingly challenging as the number of adaptation factors grows. Given that this is not the primary focus of our current research, we will refrain from delving into it further.
To facilitate more in-depth performance comparison tests, lightweight networks including ResNet18, MobileNetV2, ShuffleNetV2x1, and EfficientNetB0 were employed to construct data-level information fusion networks [30]. The dimensions of the three types of feature sample data were uniformly adjusted to 224 × 224 and formatted into three-channel data with a [3, 224, 224] structure as the input for these networks. Initially, samples from the meta-learning library were utilized to pre-train the four networks. During the pre-training phase, the classification task involved five classes (four types of interference and underwater vehicles). Subsequently, the target task training set and validation set were used for fine-tuning and validating the networks, with the validation accuracy curve presented in Figure 19.
In Figure 19, after three training steps, the validation accuracy of ResNet18, EfficientNetB0, and ShuffleNetV2x1 all exceeded 80%. EfficientNetB0 reached an accuracy of over 90% after nine steps, whereas MobileNetV2 and ShuffleNetV2x1 reached 90% accuracy after 14 steps. By comparing Figure 16 and Figure 19, it is evident that the proposed MFasNetV1 network based on meta-learning demonstrates a significant advantage in terms of rapid convergence. During the training process of the target task network, for performance comparisons, both MFasNetV1 and the four lightweight networks adopted a learning rate of 0.0001. However, MFasNetV1 is capable of utilizing a higher learning rate (e.g., 0.001) to achieve faster convergence. In contrast, the four lightweight networks tend to become trapped in local optima and fail to converge when a greater learning rate (e.g., 0.0005) is applied. This clearly indicates that the MFasNetV1 network proposed in this study is more suitable for few-shot learning scenarios.
Finally, the inference capability of the networks was evaluated using the target task test set. The parameters [31,32] and test accuracy of the proposed MFasNetV1 and the four lightweight networks are summarized in Table 6.
In Table 6, MFasNetV1 has the highest test accuracy, followed by ResNet18, MobileNetV2, EfficientNetB0, and ShuffleNetV2x1 in descending order of performance. Upon further analysis, it is evident that the feature extraction networks of MFasNetV1 are optimized based on the characteristics of the feature spectrum, thereby enhancing its data representation capability. Additionally, the generalization ability of each feature extraction network was significantly improved through meta-learning training. The test results of the four lightweight networks indicate that ResNet18 demonstrates superior representation ability, better satisfying the requirements for representing time–frequency features (ETFFs) and Doppler features (DFSDFs). In terms of the number of parameters and FLOPs, MFasNetV1 ranks second only to ResNet18. However, the scale of each individual feature extraction network in MFasNetV1 is comparable to that of MobileNetV2 or ShuffleNetV2x1. The MFasNetV1 network can be readily deployed across multiple embedded AI chips and exhibits faster inference speeds through collaborative operations.
The comparative experiments further confirm that the multidimensional feature fusion recognition method based on meta-learning, as proposed in this study, significantly enhances the adaptability to the targets’ relative attitudes and improves recognition capability for moving targets. This approach offers an effective solution for addressing limited sample availability in active sonar applications. Specifically, within the context of active sonar target recognition discussed herein, the MFasNetV1 model demonstrates superior performances compared to the data-level fusion methods employed in other network architectures, such as ResNet-18, MobileNetV2, EfficientNetB0, and ShuffleNetV2x1. In scenarios with extremely limited samples, in which rapid convergence necessitates a higher learning rate, the advantages of MFasNetV1 become particularly pronounced. These findings indicate that when addressing novel classification challenges, especially under conditions of severe sample scarcity, it is essential to leverage general network structures and design principles to develop specialized networks tailored to specific tasks.
Toward the conclusion of the discussion, the results achieved in this study are presented in accordance with the stages of information fusion, as detailed in Table 7.
Information fusion at different stages entails varying requirements for learning networks, training methods, and sample sizes, as well as differing issues to be resolved. Selecting the appropriate stage should also consider the project’s potential needs.
In addition, the comparative tests revealed that all network models exhibited a relatively high error rate when classifying samples affected by interface reverberation. The classification errors presented in Table 4 also corroborate this observation. Addressing the impact of reverberation on target recognition may constitute an important direction for future research.

5. Conclusions

This study primarily focused on addressing insufficient adaptability to the relative attitude of targets and the limited availability of samples in the context of underwater moving target recognition. Systematic research was conducted on feature extraction in spatial, time–frequency, and Doppler domains, and the development of a multidimensional feature fusion target recognition network based on meta-learning was investigated. Through integrating range–dimension information into generalized MUSIC spectral estimations, a novel approach for obtaining the pseudo-three-dimensional spatial feature spectra of underwater targets was proposed, thereby enhancing the relative attitude adaptability of target recognition. The pseudo-WVD time–frequency spectrum was refined through smoothing and filtering using prior knowledge of the transmitted signal, strengthening the target’s time–frequency features. The composition of Doppler components for moving targets was analyzed and a method for extracting Doppler frequency shift distribution features was introduced, which compensates for the limitations of time–frequency features in terms of applicability to the relative attitude of targets. A multidimensional feature fusion recognition network based on meta-learning, called MFasNetV1, was presented. Feature extraction networks were specifically designed according to the characteristics of spatial, time–frequency, and Doppler feature spectra. Experimental data augmented with simulation data were utilized to construct both the meta-learning sample library and the target task sample library. Meta-learning training and feature-level fusion learning for target tasks were conducted using the proposed networks, and ablation experiments were also conducted. Meta-knowledge of these three features was acquired via meta-learning, improving the generalization capability of the feature fusion network for target tasks while reducing the demand for training samples. Decision-level fusion results were derived from MFasNetV1 intermediate outputs. Data-level feature fusion classification networks were constructed based on ResNet-18, MobileNetV2, ShuffleNetV2x1, and EfficientNetB0, and their performances were compared to those of the proposed MFasNetV1 network. The network inference results confirm two key findings: first, the extracted multidimensional features exhibit complementary attitude adaptability; second, the proposed MFasNetV1 network effectively addresses the challenges of few-shot learning and demonstrates superior performance in multidimensional feature information fusion. Given the relatively limited experimental data employed, further experimental data collection is necessary for more comprehensive validation and refinement of the algorithm.

Author Contributions

Conceptualization, X.L. and Y.Y.; methodology, X.L.; software, L.L., X.L. and L.S.; validation, X.L., Y.Y., Y.H., X.Y. and J.L.; formal analysis, L.L. and Y.H.; investigation, X.L., X.Y. and Y.H.; resources, X.Y. and L.S.; data curation, L.S. and L.L.; writing—original draft preparation, X.L.; writing—review and editing, X.L., Y.Y., Y.H. and J.L.; visualization, X.L. All authors have read and agreed to the published version of the manuscript.

Funding

This research received no external funding.

Institutional Review Board Statement

Not applicable.

Informed Consent Statement

Not applicable.

Data Availability Statement

The data are contained within the article.

Acknowledgments

The authors appreciate the language assistance provided by Xiaojia Jiao during the revision of this manuscript.

Conflicts of Interest

The authors declare no conflicts of interest.

Abbreviations

The following abbreviations are used in this manuscript:
DFSDFDoppler frequency shift distribution feature
DOAdirection of arrival
ETFFenhanced time–frequency feature
FFCfeature fusion classifier
MSImulti-source interference
MUSICmultiple signal classification
P3SFpseudo-three-dimensional spatial feature
PCparameter configuration
RHOArelative horizontal orientation angle
RPArelative pitch angle
STFTshort-time Fourier transform
WVDWigner–Ville distribution
SVMsupport vector machine

References

  1. Yu, L.; Cheng, Y.; Li, S.; Liang, Y.; Wang, X. Tracking and Length Estimation of Underwater Acoustic Target. Electron. Lett. 2017, 53, 1224–1226. [Google Scholar] [CrossRef]
  2. Wang, Z.; Wu, J.; Wang, H.; Hao, Y.; Wang, H. A Torpedo Target Recognition Method Based on the Correlation between Echo Broadening and Apparent Angle. Appl. Sci. 2022, 12, 12345. [Google Scholar] [CrossRef]
  3. Xu, Y.; Yuan, B.C.; Zhang, H.G. An Improved Algorithm of Underwater Target Feature Abstracting Based on Target Azimuth Tendency. Appl. Mech. Mater. 2012, 155–156, 1164–1169. [Google Scholar] [CrossRef]
  4. Xia, Z.; Li, X.; Meng, X. High Resolution Time-Delay Estimation of Underwater Target Geometric Scattering. Appl. Acoust. 2016, 114, 111–117. [Google Scholar] [CrossRef]
  5. Rui, L.; Junying, A.; Gang, C. Target Geometric Configuration Estimation Based on Acoustic Scattering Spatiotemporal Characteristics. In Proceedings of the 2019 IEEE International Conference on Signal, Information and Data Processing (ICSIDP), Chongqing, China, 11–13 December 2019; pp. 1–4. [Google Scholar] [CrossRef]
  6. Li, X.; Xu, T.; Chen, B. Atomic Decomposition of Geometric Acoustic Scattering from Underwater Target. Appl. Acoust. 2018, 140, 205–213. [Google Scholar] [CrossRef]
  7. Palomeras, N.; Furfaro, T.; Williams, D.P.; Carreras, M.; Dugelay, S. Automatic target recognition for mine countermeasure missions using forward-looking sonar data. IEEE J. Ocean. Eng. 2022, 47, 141–161. [Google Scholar] [CrossRef]
  8. Zhang, B.; Zhou, T.; Shi, Z.; Xu, C.; Yang, K.; Yu, X. An underwater small target boundary segmentation method in forward-looking sonar images. Appl. Acoust. 2023, 207, 109341. [Google Scholar] [CrossRef]
  9. Liu, X.; Yang, Y.; Yang, X.; Liu, L.; Shi, L.; Li, Y.; Liu, J. Zero-Shot Learning-Based Recognition of Highlight Images of Echoes of Active Sonar. Electronics 2024, 13, 457. [Google Scholar] [CrossRef]
  10. Ou, H.H.; Au, W.W.L.; Syrmos, V.L. Underwater Ordnance Classification Using Time-Frequency Signatures of Backscattering Signals. In Proceedings of the OCEANS 2010 MTS/IEEE SEATTLE, Seattle, WA, USA, 20–23 September 2010; pp. 1–8. [Google Scholar] [CrossRef]
  11. Wu, Y.; Li, X.; Wang, Y. Extraction and Classification of Acoustic Scattering from Underwater Target Based on Wigner-Ville Distribution. Appl. Acoust. 2018, 138, 52–59. [Google Scholar] [CrossRef]
  12. Kubicek, B.; Sen Gupta, A.; Kirsteins, I. Feature Extraction and Classification of Simulated Monostatic Acoustic Echoes from Spherical Targets of Various Materials Using Convolutional Neural Networks. J. Mar. Sci. Eng. 2023, 11, 571. [Google Scholar] [CrossRef]
  13. Shang, J.; Liu, Z.L. Research on Feature Extraction and Classification Recognition of Underwater Small Target Active Sonar. In Proceedings of the 2023 IEEE International Conference on Signal Processing, Communications and Computing (ICSPCC), Zhengzhou, China, 14–17 November 2023; pp. 1–6. [Google Scholar] [CrossRef]
  14. Wang, Q.; Du, S.; Wang, F.; Chen, Y. Underwater Target Recognition Method Based on Multi-Domain Active Sonar Echo Images. In Proceedings of the 2021 IEEE International Conference on Signal Processing, Communications and Computing (ICSPCC), Xi’an, China, 17–19 August 2021; pp. 1–5. [Google Scholar] [CrossRef]
  15. Chen, V.C. Advances in Applications of Radar Micro-Doppler Signatures. In Proceedings of the 2014 IEEE Conference on Antenna Measurements & Applications (CAMA), Antibes Juan-les-Pins, France, 16–19 November 2014; pp. 1–4. [Google Scholar] [CrossRef]
  16. Wang, J.; Guo, J.; Shao, X.; Wang, K.; Fang, X. Road Targets Recognition Based on Deep Learning and Micro-Doppler Features. In Proceedings of the 2018 International Conference on Sensor Networks and Signal Processing (SNSP), Xi’an, China, 28–31 October 2018; pp. 271–276. [Google Scholar] [CrossRef]
  17. Jiang, W.; Liu, Y.; Wei, Q.; Wang, W.; Ren, Y.; Wang, C. A High-Resolution Radar Automatic Target Recognition Method for Small UAVs Based on Multi-Feature Fusion. In Proceedings of the 2022 IEEE 25th International Conference on Computer Supported Cooperative Work in Design (CSCWD), Hangzhou, China, 4–6 May 2022; pp. 775–779. [Google Scholar] [CrossRef]
  18. LeNoach, J.; Lexa, M.; Coraluppi, S. Feature-Aided Tracking Techniques for Active Sonar Applications. In Proceedings of the 2021 IEEE 24th International Conference on Information Fusion (FUSION), Sun City, South Africa, 1–4 November 2021; pp. 1–7. [Google Scholar] [CrossRef]
  19. Li, W.; Yi, W.; Teh, K.C.; Kong, L. Adaptive Multiframe Detection Algorithm With Range-Doppler-Azimuth Measurements. IEEE Trans. Geosci. Remote Sens. 2022, 60, 5119616. [Google Scholar] [CrossRef]
  20. Wu, Y.; Luo, M.; Li, S. Measurement and Extraction of Micro-Doppler Feature of Underwater Rotating Target Echo. In Proceedings of the OCEANS 2022—Chennai, Chennai, India, 21–24 February 2022; pp. 1–5. [Google Scholar] [CrossRef]
  21. Finn, C.; Abbeel, P.; Levine, S. Model-agnostic meta-learning for fast adaptation of deep networks. In Proceedings of the 34th International Conference on Machine Learning, Sydney, NSW, Australia, 6–11 August 2017; PMLR 70. pp. 1126–1135. [Google Scholar] [CrossRef]
  22. Zeng, Z.; Gu, D.; Sun, J.; Han, Z.; Wang, Y.; Hong, W. SAR Few-Shot Recognition Based on Inner-Loop Update Optimization of Meta-Learning. In Proceedings of the 2023 8th Asia-Pacific Conference on Synthetic Aperture Radar (APSAR), Bali, Indonesia, 23–27 October 2023; pp. 1–5. [Google Scholar] [CrossRef]
  23. Mulinde, R.; Attygalle, M.; Aziz, S.M. Pre-Processing-Based Performance Enhancement of DOA Estimation for Wideband LFM Signals. In Proceedings of the 2023 IEEE International Radar Conference (RADAR), Sydney, NSW, Australia, 6–10 November 2023; pp. 1–6. [Google Scholar] [CrossRef]
  24. Liu, Y.; Wu, P.; Black, A.W.; Anumanchipalli, G.K. A Fast and Accurate Pitch Estimation Algorithm Based on the Pseudo Wigner-Ville Distribution. In Proceedings of the ICASSP 2023—2023 IEEE International Conference on Acoustics, Speech and Signal Processing (ICASSP), Rhodes Island, Greece, 4–10 June 2023; pp. 1–5. [Google Scholar] [CrossRef]
  25. Hague, D.A.; Buck, J.R. The Generalized Sinusoidal Frequency-Modulated Waveform for Active Sonar. IEEE J. Ocean. Eng. 2017, 42, 109–123. [Google Scholar] [CrossRef]
  26. Brazdil, P.; Van Rijn, J.N.; Soares, C.; Vanschoren, J. Metalearning: Applications to Automated Machine Learning and Data Mining, 2nd ed.; Springer International Publishing: Cham, Switzerland, 2022; pp. 113–121. [Google Scholar] [CrossRef]
  27. Song, Z.; Lanrui, L.; Xinhua, Z.; Dawei, Z.; Mingyuan, L. Simulation of Backscatter Signal of Submarine Target Based on Spatial Distribution Characteristics of Target Intensity. In Proceedings of the 2021 OES China Ocean Acoustics (COA), Harbin, China, 14–17 July 2021; pp. 234–239. [Google Scholar] [CrossRef]
  28. Liu, X.; Yang, Y.; Hu, Y.; Yang, X.; Li, Y.; Xiao, L. Data Augmentation Based on Highlight Image Models of Underwater Maneuvering Target. Xibei Gongye Daxue Xuebao/J. Northwestern Polytech. Univ. 2024, 42, 417–425. [Google Scholar] [CrossRef]
  29. Liggins, M., II; Hall, D.; Llinas, J. Handbook of Multisensor Data Fusion: Theory and Practice, 2nd ed.; CRC Press: Boca Raton, FL, USA, 2017; pp. 7–8. [Google Scholar] [CrossRef]
  30. Zhang, W.; Lin, B.; Yan, Y.; Zhou, A.; Ye, Y.; Zhu, X. Multi-Features Fusion for Underwater Acoustic Target Recognition Based on Convolution Recurrent Neural Networks. In Proceedings of the 2022 8th International Conference on Big Data and Information Analytics (BigDIA), Guiyang, China, 24–25 August 2022; pp. 342–346. [Google Scholar] [CrossRef]
  31. Chen, Y.; Liang, H.; Li, H.; Song, S. A Lightweight Time-Frequency-Space Dual-Stream Network for Active Sonar-Based Underwater Target Recognition. IEEE Sens. J. 2025, 25, 11416–11427. [Google Scholar] [CrossRef]
  32. Ma, N.; Zhang, X.; Zheng, H.-T.; Sun, J. ShuffleNet V2: Practical Guidelines for Efficient CNN Architecture Design. arXiv 2018, arXiv:1807.11164. [Google Scholar] [CrossRef]
Figure 1. Spatial spectrum: (a) multi-source interference; (b) volume targets.
Applsci 15 05744 g001
Figure 2. The P3SF spectrum: (a) multi-source interference; (b) volume targets.
Applsci 15 05744 g002
Figure 3. Target echoes: (a) multi-source interference; (b) volume targets.
Applsci 15 05744 g003
Figure 4. The PWVD spectrum for MSI (RHOA = 75 ° ): (a) before processing; (b) after processing.
Applsci 15 05744 g004
Figure 5. The ETFF spectrum (RHOA = 30 ° ): (a) multi-source interference; (b) volume targets.
Applsci 15 05744 g005
Figure 6. The DFSDF spectrum: (a) multi-source interference; (b) volume targets.
Applsci 15 05744 g006
Figure 7. Network framework and composition.
Applsci 15 05744 g007
Figure 8. Network structure and parameters of the base learners: (a) HasNet-5 is designed for the spatial feature P3SF. (b) TFasNet-7 is designed for the time–frequency feature ETFF. (c) DasNet-9 is designed for the Doppler feature DFSDF.
Applsci 15 05744 g008
Figure 9. Structure of the MRConv module.
Applsci 15 05744 g009
Figure 10. MAML-based meta-learning workflow.
Applsci 15 05744 g010
Figure 11. Network architecture for target tasks.
Applsci 15 05744 g011
Figure 12. Architecture of MFasNetV1 and parameters of the feature fusion classifier.
Applsci 15 05744 g012
Figure 13. Highlight models: (a) underwater vehicles; (b) four types of interferences.
Applsci 15 05744 g013
Figure 14. A schematic diagram of the verification process.
Applsci 15 05744 g014
Figure 15. Validation accuracy curves in meta-learning: (a) meta-learning validation curve for the spatial feature P3SF; (b) meta-learning validation curve for the time–frequency feature ETFF; (c) meta-learning validation curve for the Doppler feature DFSDF.
Applsci 15 05744 g015
Figure 16. Validation curves for various feature extraction networks.
Applsci 15 05744 g016
Figure 17. Relationship between accuracy and RHOA.
Applsci 15 05744 g017
Figure 18. Validation curves for the feature fusion classifier.
Applsci 15 05744 g018
Figure 19. Validation curve for the feature-data-level fusion recognition network.
Applsci 15 05744 g019
Table 1. Summary of various algorithms.
Algorithm TypeLimitations or Unresolved Challenges
Parameter estimation algorithmsThese algorithms exhibits limited environmental adaptability, restricted interference discrimination capability, and relatively low recognition accuracy.
Target scale-recognition algorithmsResearch on the fine scattering characteristics of targets has primarily concentrated on static targets and has not yet been applied to the recognition of moving targets. Highlight-based image recognition algorithms exhibit sensitivity to the relative attitude of targets.
Time–frequency feature recognition algorithmsAlgorithm verification predominantly depends on pool experiments or simulation data. A few researchers have utilized experimental data to validate the classification between moving targets and static objects. Nevertheless, the limitations regarding the algorithm’s applicability to the relative attitude of targets have not been adequately addressed.
Doppler feature recognition algorithmsMicro-Doppler features in the radar domain have been extensively utilized for target recognition. In contrast, in the sonar domain, Doppler features are primarily employed for target detection and velocity estimation, whereas the acquisition of micro-Doppler signatures remains challenging.
Table 2. The settings of RHOA and RPA for sample generation.
Target TypeRelative Horizontal
Orientation Angles (°)
Relative Pitch Angle (°)
Underwater vehicle15, 30, 45, 60, 75, 901.5
Type I interference15, 30, 45, 60, 75, 901.5
Type II interference15, 30, 45, 60, 75, 901.5
Type III interference15, 30, 45, 60, 75, 901.5
Type IV interference15, 30, 45, 60, 75, 901.5
Table 3. The composition of the target task sample library.
Sample Set TypeExperimental
Data
Simulation Data
(PC3)
Simulation Data
(PC4)
Total
Training set1001600260
Validation set650140205
Test set20500205
Table 4. Test results of the MFasNetV1.
Data TypeClassification ResultsRecall Rate
InterferenceUnderwater Vehicle
Type I interference A320100 %
Type I interference B31196.9%
Type II interference250100%
Type III interference24196.0%
Type IV interference24196.0 %
Underwater vehicle36395.4%
Table 5. The results of the ablation experiment.
Test TypeSpatial
Feature P3SF
Time–
Frequency
Feature ETFF
Doppler Feature
DFSDF
Accuracy
P3SF 93.6%
ETFF 90.2%
DFSDF 87.8%
P3SF and ETFF 96.6%
P3SF and DFSDF 95.6%
ETFF and DFSDF 96.1%
All97.1%
The checkmark symbol (✓) signifies that an option has been selected.
Table 6. The parameters and test accuracy of the five networks.
ModuleParameters (M)FLOPs (M)Accuracy (%)
MFasNetV1HasNet-51.0611.197.1
TFasNet-73.56324.5
DasNet-90.84428.4
FFC0.390.4
ResNet1811.681824.094.1
MobileNetV23.51327.693.2
EfficientNetB05.29412.892.7
ShuffleNetV2x11.26146.091.2
Table 7. Test results categorized according to fusion stages.
Stage of FusionModuleAccuracy (%)
Data-levelResNet1894.1
MobileNetV293.2
EfficientNetB092.7
ShuffleNetV2x191.2
Feature-levelMFasNetV197.1
Decision-levelMFasNetV194.1 *
* This value is derived from the intermediate outputs of MFasNetV1.
Disclaimer/Publisher’s Note: The statements, opinions and data contained in all publications are solely those of the individual author(s) and contributor(s) and not of MDPI and/or the editor(s). MDPI and/or the editor(s) disclaim responsibility for any injury to people or property resulting from any ideas, methods, instructions or products referred to in the content.

