Article

A Novel Approach for Acute Mental Stress Mitigation Through Adapted Binaural Beats: A Pilot Study

1
Department Electronics and Telecommunications, Politecnico di Torino, 10129 Turin, Italy
2
Department of Neuroscience, University of Torino, 10125 Turin, Italy
*
Author to whom correspondence should be addressed.
Appl. Sci. 2025, 15(10), 5742; https://doi.org/10.3390/app15105742
Submission received: 16 April 2025 / Revised: 12 May 2025 / Accepted: 19 May 2025 / Published: 21 May 2025
(This article belongs to the Special Issue Emerging Technologies in Innovative Human–Computer Interactions)

Abstract

:
Stress significantly impacts our society, making strategies for its mitigation necessary. A possible approach may involve binaural beats (BBs), i.e., an auditory stimulation obtained by presenting pure tones with slightly different frequencies to the user’s ears, resulting in a third phantom beat ( f B B ) . While studies in the literature investigate the effects of BBs at a constant stimulation frequency, with this pilot study, we present an innovative approach that adapts the beat frequency in real time within the theta range (4.0–8.0 Hz) to reduce acute mental stress. A stress index, obtained from the predictions of a random forest regressor, was considered to adjust the stimulation. The regressor considered features from an electrocardiogram (ECG) and the ECG-derived respiratory signal. Thirteen healthy subjects underwent a stressful protocol involving multiple mental arithmetic tasks during which constant (CBB) or adapted (ABB) stimulation occurred. Task performances like accuracy and reaction times were recorded. The results show that ABBs significantly lowered the average stress index ( p < 0.05 ) and heart rate ( p < 0.05 ) compared to CBBs. No statistically significant differences were detected in task performance. The results support the importance of adaptive and personalized approaches for mitigating stress. Future research is necessary to assess the goodness of our proposal, considering a larger sample, different stressors, and an objective and external assessment of stress (e.g., cortisol levels).

1. Introduction

Given the significant impact of stress in our society, especially in the professional sphere [1], innovative solutions for its detection are necessary. A consolidated and widely employed methodology for stress recognition is the analysis of cortisol levels, which requires either salivary, hair, urinary, plasma, serum, or sweat fingernail samples [2]. Nevertheless, this approach is not suited for real-time assessment [3], making the analysis of physiological signals, e.g. those, collected through wearable devices [4,5], a more practical alternative. In this regard, a significant role is played by machine learning [6,7] and deep learning algorithms [8,9], which combine data from wearable sensors to detect stress effectively. Once a stressful response is detected, the secondary objective is to relieve stress. Nowadays, there are different strategies for this purpose, and one potential approach is auditory stimulation through binaural beats (BBs) [10,11]. BBs are obtained by presenting two pure tones with different frequencies to the ears of the user (e.g., f 0 and f 0 + δ Hz to the left and right ears), resulting in a third phantom beat, named in the following as f B B , centred at the difference between the two frequencies.
Studies in the literature investigated this stimulation both during passive listening [12,13] and the execution of cognitive tasks [14,15,16], which are commonly adopted to induce acute mental stress in controlled conditions [17]. Overall, the majority of the studies involving during-task stimulation focus on assessing the enhancement of cognitive performances through BB stimulations at different frequency bands: for example, beta (13.0–30.0 Hz) [18] and gamma (above 30 Hz) [18,19]. An interesting application of this auditory stimulation is working memory enhancement, with different studies highlighting its effectiveness [14,20,21]. Concerning the use of BBs for stress mitigation, studies have already explored the impact of this stimulation in reducing the effects of acute mental stress [16,22,23], making this stimulation an alternative to meditation–relaxation techniques [24] and mindfulness-based stress reduction programs [25]. Furthermore, the findings of the systematic review in ref. [26] suggest BBs as a promising and user-friendly tool for alleviating the symptoms of anxiety and depression.
Despite the fascinating outcomes mentioned above, other studies indicate either absent or inconsistent improvements in cognitive performance [27] and absent or unclear brainwave entrainment toward the frequency of stimulation [12,28,29], which is the concept at the basis of the BB stimulation. As suggested in ref. [30], a missed brainwave entrainment is probably due to a lack of consensus about its definition and methodological issues, which include varied frequencies used as carriers ( f 0 ), different f B B , duration of the stimulation, and presence or absence of embedded noise to mask the beats.
Given the missing consensus, the efficacy of BBs is still an open problem regardless of their application, making further research necessary to understand the effect of this stimulation better. With particular reference to the methodological issues listed above, we believe that a significant role is played by the frequency of the beats, i.e., f B B . In particular, almost all studies in the literature focus on a stimulation at constant frequencies, belonging to different bands of electroencephalography activity, such as theta (4.0–8.0 Hz), alpha (8.0–13.0 Hz), and beta (13.0–30.0 Hz), but not at personalized frequencies. To the best of our knowledge, only one study [31] investigated a personalized stimulation by adjusting f B B for each participant in the theta and beta range based on their heart rate using the Brain–Body Coupling Theorem proposed by Klimesch [32].
Inspired by the above, with this pilot study, we investigate a novel approach of stimulation by continuously adjusting f B B on the participant’s physiological response within the theta range to reduce acute mental stress. We named this approach adaptive binaural beats (ABBs) stimulation, and, as physiological signals, we considered the electrocardiogram (ECG) and the ECG-derived respiratory (EDR) signals. In other words, we propose a closed-loop system that considers participants’ cardiac and respiratory activity to adjust the stimulation (see Figure 1A). To the best of our knowledge, this is the first study to investigate the use of BBs within a closed-loop system for stress mitigation. In this work, the adaptive approach is compared to constant BB stimulation (CBB), which, as previously noted, represents the standard method commonly adopted in the literature.
This paper is structured as follows: Section 2 provides a detailed description of the participants involved in the experiment, along with the instruments, experimental protocol, and algorithm to adapt the f B B ; Section 3 focuses on the performance comparison between our approach and the constant stimulation, whereas Section 4 and Section 5 will be dedicated to the discussion, limitations, and future directions.

2. Materials and Methods

2.1. Participants

For this work, 18 healthy Italian students were enrolled. The sample was composed of 11 women and 7 men, 23.21 ± 1.45 years old and with a body mass index of 21.29 ± 2.11 kg/m2 (mean and standard deviation, respectively). To minimize the influence of the circadian cycle, all the experiments were conducted between 11 a.m. and 3 p.m. Volunteers were asked to refrain from consuming substances like coffee, narcotics, memory or concentration supplements, alcohol, or drowsiness-inducing medications at least 3 h before the experiment. Participants had a minimum education qualification of a high school degree and no history of traumatic events. Given their effect on stress perception, details relative to the hours of sleep (6.75 ± 1.12 h) were collected as well. This study was conducted following the Declaration of Helsinki and was authorized by the University of Turin’s Ethics Committee (approval number 0125508).

2.2. Instruments

The ECG was collected through the PolarH10 chest strap. The signal was sampled at 130 Hz and streamed in real time to a workstation (HP Laptop 14s-dq0xxx, Intel i5-8265U @ 1.60 GHz CPU and 8 GB RAM–HP, Palo Alto, CA, USA). The tones were presented to the left and right ears (see Figure 1A) and were created through a Python (version 3.11) script, with a carrier ( f 0 ) at 400.0 Hz. The beat frequencies ( f B B ) ranged within the theta range (4.0–8.0 Hz), and the beat modulation was obtained by modifying the frequency of the right tone ( f R , see Figure 1A). Sennheiser HD 201 headphones were used to deliver the sounds. To avoid discomfort during the auditive stimulation, a relaxing song [33] in mono format (i.e., identical for both channels) was summed to the tones, thus not altering the creation of the BBs given the exact contribution to both the left and right channels. It is worth noting that other studies also consider the possibility of embedding the BBs into sounds like pink noise [34] and natural sounds (e.g., the sound of the sea [35]). The signal-to-music ratio chosen was −6.0 dB, and the sounds were reproduced at 40 dB(A) (measured with the Decibel X app—version 9.9.0 and iPhone 12 mini, Apple Inc., Cupertino, CA, USA).

2.3. Experimental Protocol

In a preliminary phase lasting approximately 10 min, we let participants acclimatize before the beginning of the experiments, and we asked them to fill out two forms: an informed consent and a form to gather information like hours of sleep, body weight, and height. With particular reference to the latter, the form proposed by ref. [36] was used. Additionally, participants filled out two questionnaires: the Stress-Trait Anxiety Inventory (STAI) and the Perceived Stress Scale (PSS). All the documents were written in Italian.
To induce acute mental stress in the investigated sample, a modified version of the mental arithmetic task (MAT) was adopted. The task was developed using a Python script and consisted of 60 operations, with 4 s for each question. All the operations were considered, and a maximum of 2-digit numbers were used. Participants used the workstation’s keyboard to respond to the questions. We informed the participants that they could perform the tasks once and that their performances would be compared with all the above to elicit a more significant stress response during the execution of the experiment [17].
The framework of the experimental protocol can be appreciated in Figure 1B. It includes a sequence of relaxing videos (VIDs) and MATs for a total of 3 blocks. The temporal duration of the tasks was 2 and 4 min for the VIDs and MATs, respectively. For this study, we used videos of natural settings, given their efficacy in enhancing physiological restoration and relaxation [37]. Furthermore, we asked the participants to fill out a visual analog scale (VAS) questionnaire at the end of each step. This procedure allowed us to keep track of the participants’ stress perception. The questionnaire had 5 levels ranging from 0 (no stress) to 5 (high stress).
Data collected during steps 1 and 2 were used to train a regressor for stress detection (described in Section 2.4). Step 3 served as a relaxing phase, whereas step 4 investigated the effects of either a constant or adapted BB stimulation. Step 5 was dedicated to the last resting phase, and step 6 served to test the remaining condition. Participants received auditory stimulation only during steps 4 and 6 (STIM ON), whereas BBs were turned off (STIM OFF) during the relaxing video. Half of the participants received constant stimulation followed by the adaptive one, whereas the latter experienced the opposite condition. The order of stimulation was chosen randomly, and the VIDs were different for steps 1, 3, and 5. Regarding the MATs, participants received the same questions during the three tasks, and the individual performance, expressed as the response’s accuracy and reaction time (i.e., the required time to respond), was monitored. At the end of the protocol, a NASA-TLX questionnaire was filled out by volunteers to assess their mental workload. Both the VAS and the NASA-TLX are commonly adopted self-assessment reports used in experimental protocols studying stress [17].

2.4. Stress Index Estimation

To adapt the f B B , we needed to assess the participants’ level of stress over time. For this purpose, we implemented a random forest regressor for each subject to estimate a stress index. Data collected during steps 1 and 2 (see Figure 1B) were used to train the regressor, with samples labeled as 0 (no stress) during the VID and 1 (stress) during the MAT.
Features from the ECG and the ECG-derived respiratory (EDR) signals were estimated. Concerning the ECG, we estimated the R R interval (the time between consecutive R peaks), the Q T interval (the temporal duration between the Q and T waves), the Q T c interval (defined as the ratio between the Q T and the square root of the R R interval), and the R T R and R P R ratios, which represent the amplitude ratios between the R peak and the T and P peaks, respectively. Concerning the EDR, we estimated the duration of the breath cycle ( R P ), the ratio of the consecutive peaks’ amplitude ( P R ), and the ratio between a peak and the next valley ( A p p ). We refer the reader to Figure 2A,B, where an example of an ECG from one participant and the graphical representation of some investigated features, both for the ECG and EDR, are reported. The Neurokit2 toolbox (version 0.2.7) was used to estimate the mentioned features.
Concerning the ECG, the R R interval is certainly the most adopted feature to assess the onset of a stressful response. However, the use of features like Q T and Q T c is not new for the stress assessment. Indeed, studies highlighted a change in Q T [38,39] and Q T c [40] intervals during the execution of cognitive tasks. On the other hand, features like R P R and R T R are not commonly adopted in stress-inducing and assessment studies. However, a significant T-wave reduction was documented during the execution of a cognitive task [41]. For this reason, we took into account the changes in the T and P waves to the R peak, to have a relative measure in every ECG waveform. We included also the duration of breath cycles in the EDR signal due to the physiological responses that typically occur under stressful conditions [42]. In addition, A p p and P R can measure the irregularities of one’s breath during a stressful condition [43]. Finally, supplementary features were considered along with traditional ones used for stress detection (e.g., the R R interval) in order to extract more insights from the data and possibly enhance the accuracy of the estimation.
To consider the different dynamics of the ECG and EDR signals, we used the respiratory cycles to naturally segment the ECG signal. Therefore, the features within each respiratory cycle were averaged to obtain a single value. Additionally, to enrich the model, we considered the temporal variation in the feature over time. Specifically, we assessed changes in the average feature values across windows spanning three respiratory cycles with a two-cycle overlap. This was performed by calculating the ratios of feature values between each cycle. For each stress index value, three consecutive cycles were taken into account, with an overlap of two.
Before training the regressor, the feature set was standardized, and the mean and standard deviation of the features were saved and later used in the subsequent stages of the experiments. To determine the optimal regression model for each subject, a grid search was performed to evaluate various hyperparameters, including the number of trees (400, 700, and 1000), tree depths (unrestricted, 10, 20, and 30), and the minimum samples required for splits and leaves (2, 5, and 10 and 2, 4, and 6, respectively). Bootstrap sampling was consistently applied throughout the process. Each combination was assessed using 5-fold cross-validation, and the model with the highest average coefficient of determination ( R 2 ) was selected.

2.5. Adaptive f B B Stimulation

Stress index values were at the basis of the adaptive stimulation approach. Indeed, they were used to estimate a stress predictor (S) described in the next lines. For every four values of the stress index while stimulating at a certain f B B , S was calculated considering the average of the last two index values (the first two are discarded as their effect could be affected by a transient) and f B B was modified to minimize S. Initially, three f B B were investigated: f B B 0 and f B B 0 ± Δ f B B , with Δ f B B = 1 Hz. Thereafter, the f B B value corresponding to the minimum S was identified. Then, Δ f B B was halved and the frequencies f B B ± Δ f B B were explored, choosing the stimulation frequency for which S was smaller. The previous steps were then iterated. The f B B research started with a beat frequency of 6.0 Hz, and Δ f B B could not be lower than 0.125 Hz. The beat frequencies remained within the theta range (4.0–8.0 Hz), and if an extreme was reached, f B B was varied by 0.25 Hz in the opposite direction to move away from the approached extreme. The number of stress index values used to adjust f B B was determined experimentally, along with the number of respiratory cycles taken into account by the regressor. It is important to mention that the duration of the stimulation at a specific f B B is not fixed and depends on the time required to estimate the four stress indexes for evaluating the predictor S (related to the breath rate). Once initialized, the f B B adaptation continues for the whole duration of the cognitive task.

2.6. Statistical Analysis

Statistical analyses on the collected data were performed with MATLAB® (MathWorks, Inc., Natick, MA, USA, R2024a). To assess the effects of multiple treatments, we applied the 2-way ANOVA Scheirer–Ray–Hare test [44], considering treatment and subject as factors without interaction terms to account for repeated measurements. For pairwise comparisons, we employed the Wilcoxon signed-rank test. A significance level ( α ) of 0.05 was set for all analyses.

3. Results

As mentioned in Section 2.3, the data collected in steps 1 and 2 (see Figure 1B) were used to train the regressor. Participants showing an average coefficient of determination ( R 2 ) lower than 50% during cross-validation were excluded, along with those not simultaneously showing an increase in heart rate during steps STIM ON compared to STIM OFF (see Figure 1B) and a level of perceived stress estimated through the VAS lower than three, thus indicating that the tasks were not perceived as sufficiently stressful. Additionally, one subject was excluded due to technical issues after the training. Overall, a total of 13 subjects were considered for the subsequent analysis. For those participants, the results of the questionnaires, indicated as mean ± standard deviation, were 22.08 ± 6.99 for the PSS, 37.54 ± 9.86 for the STAI, and 57.69 ± 9.38 for the NASA-TLX. Considering the ranges reported in [45] for the PSS (i.e., low: [0–13], moderate: [14–26], and high [25–40]) and the ones in [46] for the STAI (i.e., low: [20–37], moderate: [38–44], and high: [45–80]), the mean values of the self-report assessment indicate moderate stress and state anxiety before the beginning of the experiment. On the other hand, the results of the NASA-TLX suggest that participants experienced a high mental workload because of the experiment [17].
The stress index trends for all the participants during training are shown in Figure 3A. The purple block includes the predictions during the VID, whereas the remaining is relative to the MAT. Overall, regressors showed an average R 2 of 0.78 during the training phase. In addition to the stress index, the average heart rates during the tasks and the results of the VAS are shown in Figure 3B,C, respectively. For the latter plots, the median values of the two distributions are reported. The results indicate statistically significant differences ( p < 0.01 ) between the VID and MAT.
Figure 4A illustrates the regressor’s feature ranking, where the average importance of each feature is reported. The R R interval finds the first place in the ranking with an average importance of about 50%. Despite the general trend, this was not valid for all the participants. Indeed, Figure 4B,E show the top five features of two participants, and the R R was not always in first place. Figure 4C,F depict the boxplots of the R R intervals during the two tasks, whereas Figure 4D,G are relative to R T R . Despite the statistically significant differences between the VID and MAT’s distributions (not represented in Figure 4), it is possible to appreciate differences in the overlap of the boxplots, which can be quantified through the area under curve (AUC) of the receiver operating characteristic.
For the first subject (Figure 4C,D), the A U C was higher for the R R interval rather than the R T R . On the other hand, an opposite result can be appreciated for the second subject (Figure 4F,G), with a higher A U C for R T R than the R R interval.
The stress predictor (S) changes over time are reported in Figure 5A,B. The figures take into account the two possible stimulation orders: adapted stimulation followed by a constant one (AC) and vice versa (CA). The purple block represents predictions during the VIDs (STIM OFF), whereas the yellow and light orange blocks correspond to adaptive (ABB) and constant (CBB) stimulation (STIM ON), respectively. For both Figure 5A,B, the participant stress predictor is reported in gray, whereas the black line represents the average of the curves. Regardless of the stimulation order, ABBs showed lower mean values of S: 0.69 (ABB) and 0.76 (CBB) for AC, and 0.68 (CBB) and 0.59 (ABB) for CA. Ultimately, Figure 5C shows the f B B frequencies over time for the ABB condition.
Figure 6A enriches the content of Figure 5A,B by considering the average of the stress index in each step of the protocol (except the training) for each subject. The results indicate that ABB led to statistically lower values of the average stress index compared to CBB ( p < 0.05 ), with a reduction of approximately 17% (considering the median of the distributions). As reported in Figure 5B, no statistically significant differences were detected in the VAS results for the CBB and ABB conditions. Similarly, no statistical differences were detected for the MAT performances (i.e., accuracies and reaction times). It is important to note that for Figure 6A,B, the pairwise comparisons with VIDs were omitted for brevity, despite being statistically significant.
To facilitate the pairwise comparison between the CBB and ABB conditions, Figure 7A displays the average stress indexes during CBB and ABB stimulations for all the participants. Furthermore, given the significant importance of the R R interval (see Figure 4A), the participants’ average heart rates were estimated for the two stimulation conditions. The results are shown in Figure 7B and, except for one participant indicated in red, the ABB led to a reduction in the average heart rate. It is worth noting that the same participant also showed an increase in the average stress index, as shown in Figure 7A. In addition, we investigated another temporal metric linked to parasympathetic predominance: the root mean square of successive differences (RMSSD) [47]. No statistically significant differences were found in the pairwise comparison. However, the median of the ABB distribution is higher than that of the CBB distribution, and the p-value from the statistical test ( p = 0.068 ) slightly exceeded the level of significance. Similarly to what is conducted for the previous part of the Figure 7, the participant showing worsening as a result of ABBs is also shown in red.

4. Discussion

Given the significant impact of stress on our society, new solutions for its mitigation are necessary. In this regard, BBs may play a significant role, given their convenience and non-invasiveness. Overall, a consensus about their effectiveness is missing, and this is certainly due to missing standardized approaches, methodological issues, and personalized treatments. With this work, we present a different stimulation approach, which takes into account the physiological response of the subject to adapt f B B and reduce acute mental stress artificially recreated through a modified version of the MAT.
To adapt the f B B in real time, we considered the output of a regressor, which was implemented to recognize a stressful condition. For this reason, the training phase was pivotal. The outcomes of that phase, which are reported in Figure 3, highlight that the protocol was capable of inducing acute mental stress in the participants. Indeed, both the average heart rate and the VAS outcome resulted in higher values compared to the relaxing condition, as expected [17]. The R R interval played a significant role, as evidenced by the ranking of the different features (as shown in Figure 4A), followed by others that manifest changes during acute mental stress conditions, e.g, R T R [41] and the QT interval [40,48]. Despite the significance of the R R interval, Figure 4 highlights the variability among subjects in feature importance, showing that other features, such as R T R , may prevail over R R in recognizing a stressful condition. This underlines the importance of a subject-specific approach, taking into account the physiological response of the users.
The importance of adapting to the user can be appreciated also in Figure 5, where the changes over time of the stress predictor (S) are reported. By constantly changing f B B on the users’ response, lower values of S were obtained, regardless of the stimulation order. The significance of modulating the stimulation on the user’s physiological response is highlighted in Figure 5C, where no consistent trend in f B B over time is evident among subjects, and high variability occurs. A comparison among the average stress indexes of steps 3 to 6 of the experimental protocol (see Figure 1B) can be appreciated in Figure 6A. The results align with Figure 5A,B, indicating a statistically significant reduction in the average stress index during the ABB stimulation.
Surprisingly, no statistical difference was detected in the comparison of the VAS questionnaires after ABBs and CBBs. In this regard, some considerations should be made. Questionnaires are surely a rapid and cost-effective method of data collection [17], but care should be taken because they are not entirely reliable due to a large subjective component and social desirability bias (i.e., the propensity to over-report more desirable attributes while under-reporting socially undesirable activities [49]). The previous considerations, along with the limited sample size, may be the reason for the missing significance in the comparison.
Concerning the MAT performances, no statistical difference was detected in either accuracies or reaction times. This result makes us assume that the task complexity was comparable, ensuring a reliable comparison between CBBs and ABBs. It is worth noting that the f B B for this study (i.e., 4.0–8.0 Hz) was chosen to elicit relaxation [11] and not an improvement in cognitive performance, which would rather require a stimulation in the beta range, as performed in refs. [14,21]. Therefore, an absence of improvement in the task’s performance may be linked to this factor.
An in-depth analysis of the average stress index is shown in Figure 7A. The pairwise comparison shows that all the participants showed lower average index values with the ABB stimulation, except one. The advantage of ABBs over CBBs is supported by the reduction in the average heart rate shown in Figure 7B. Interestingly, the only participant who showed an increase in heart rate during ABB stimulation was the same who exhibited a rise in the average stress index. This suggests that the adaptation algorithm may have failed for this subject, not achieving optimal stimulation throughout the task. It is worth mentioning that the consistency in the direction of the differences between subjects may lead to statistical significance despite a small median difference between the distributions.
In addition to average heart rate, we investigated an additional feature commonly considered to assess parasympathetic predominance: the RMSSD. The results do not indicate a significant increase in this temporal metric, which is associated with lower acute mental stress [50]. However, the difference between the medians is in favor of ABBs, and the result of the statistical test ( p = 0.068 ) is slightly above the level of significance, suggesting a possible effect on this index as well. Interestingly, the participants who showed worsening in the average stress index and heart rate also exhibited a lower RMSSD, thus supporting the failure of adaptation in these cases.
Altogether, this work emphasizes the necessity of personalized treatments [51], which in this case are meant to mitigate acute mental stress. From a psychological perspective, stress response varies significantly among individuals, being influenced by personal [52,53] and situational factors [53,54]. By combining the above with the outcomes of this study, it is clear that there is no one-size-fits-all approach for BBs stimulation, justifying the need for closed-loop treatments, which takes into account the individual’s specific characteristics.

Limitations and Future Directions

Despite the promising results of this pilot study, it is not free of limitations. Altogether, we identify five main aspects that should be taken into account in future research:
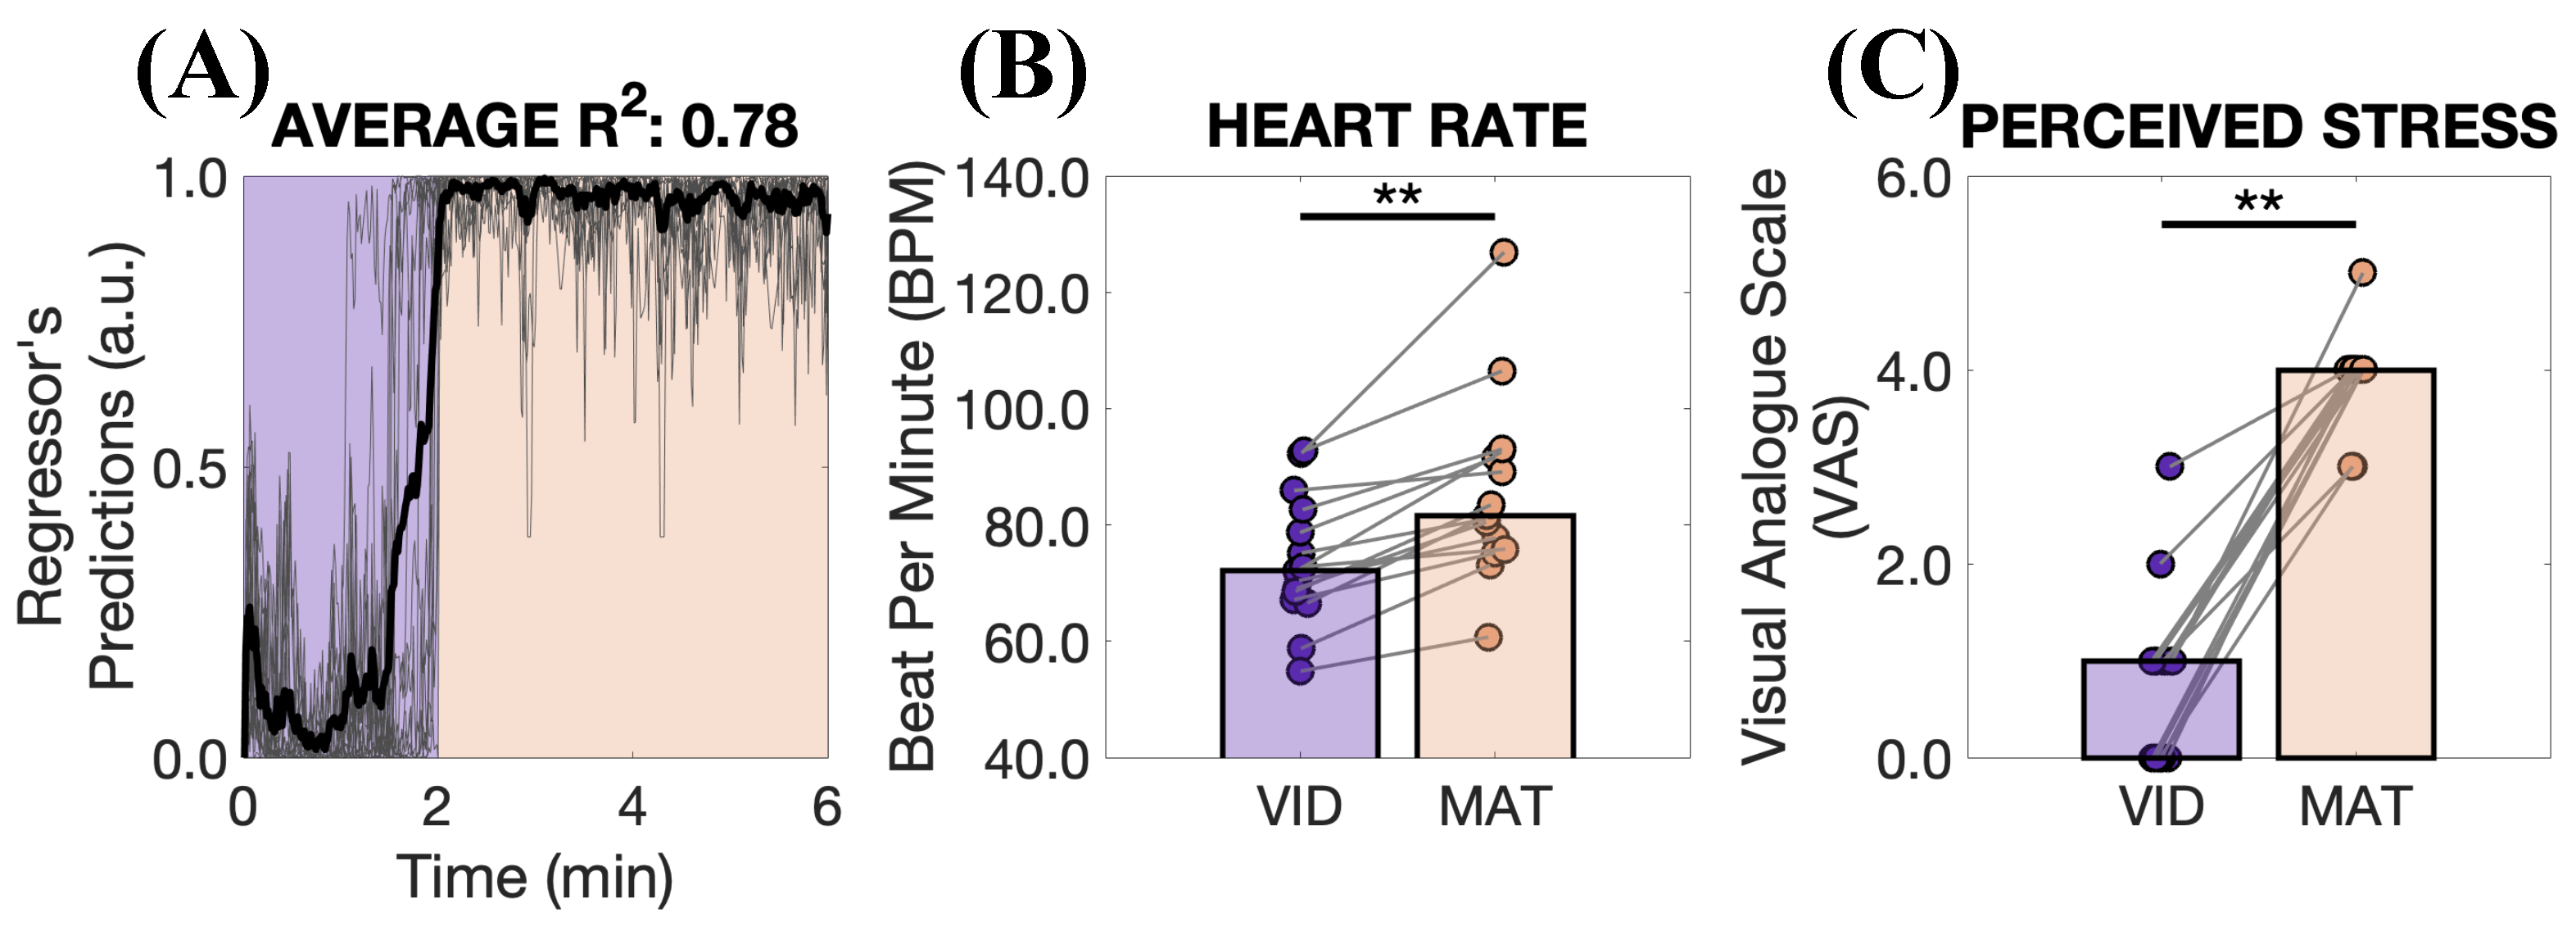
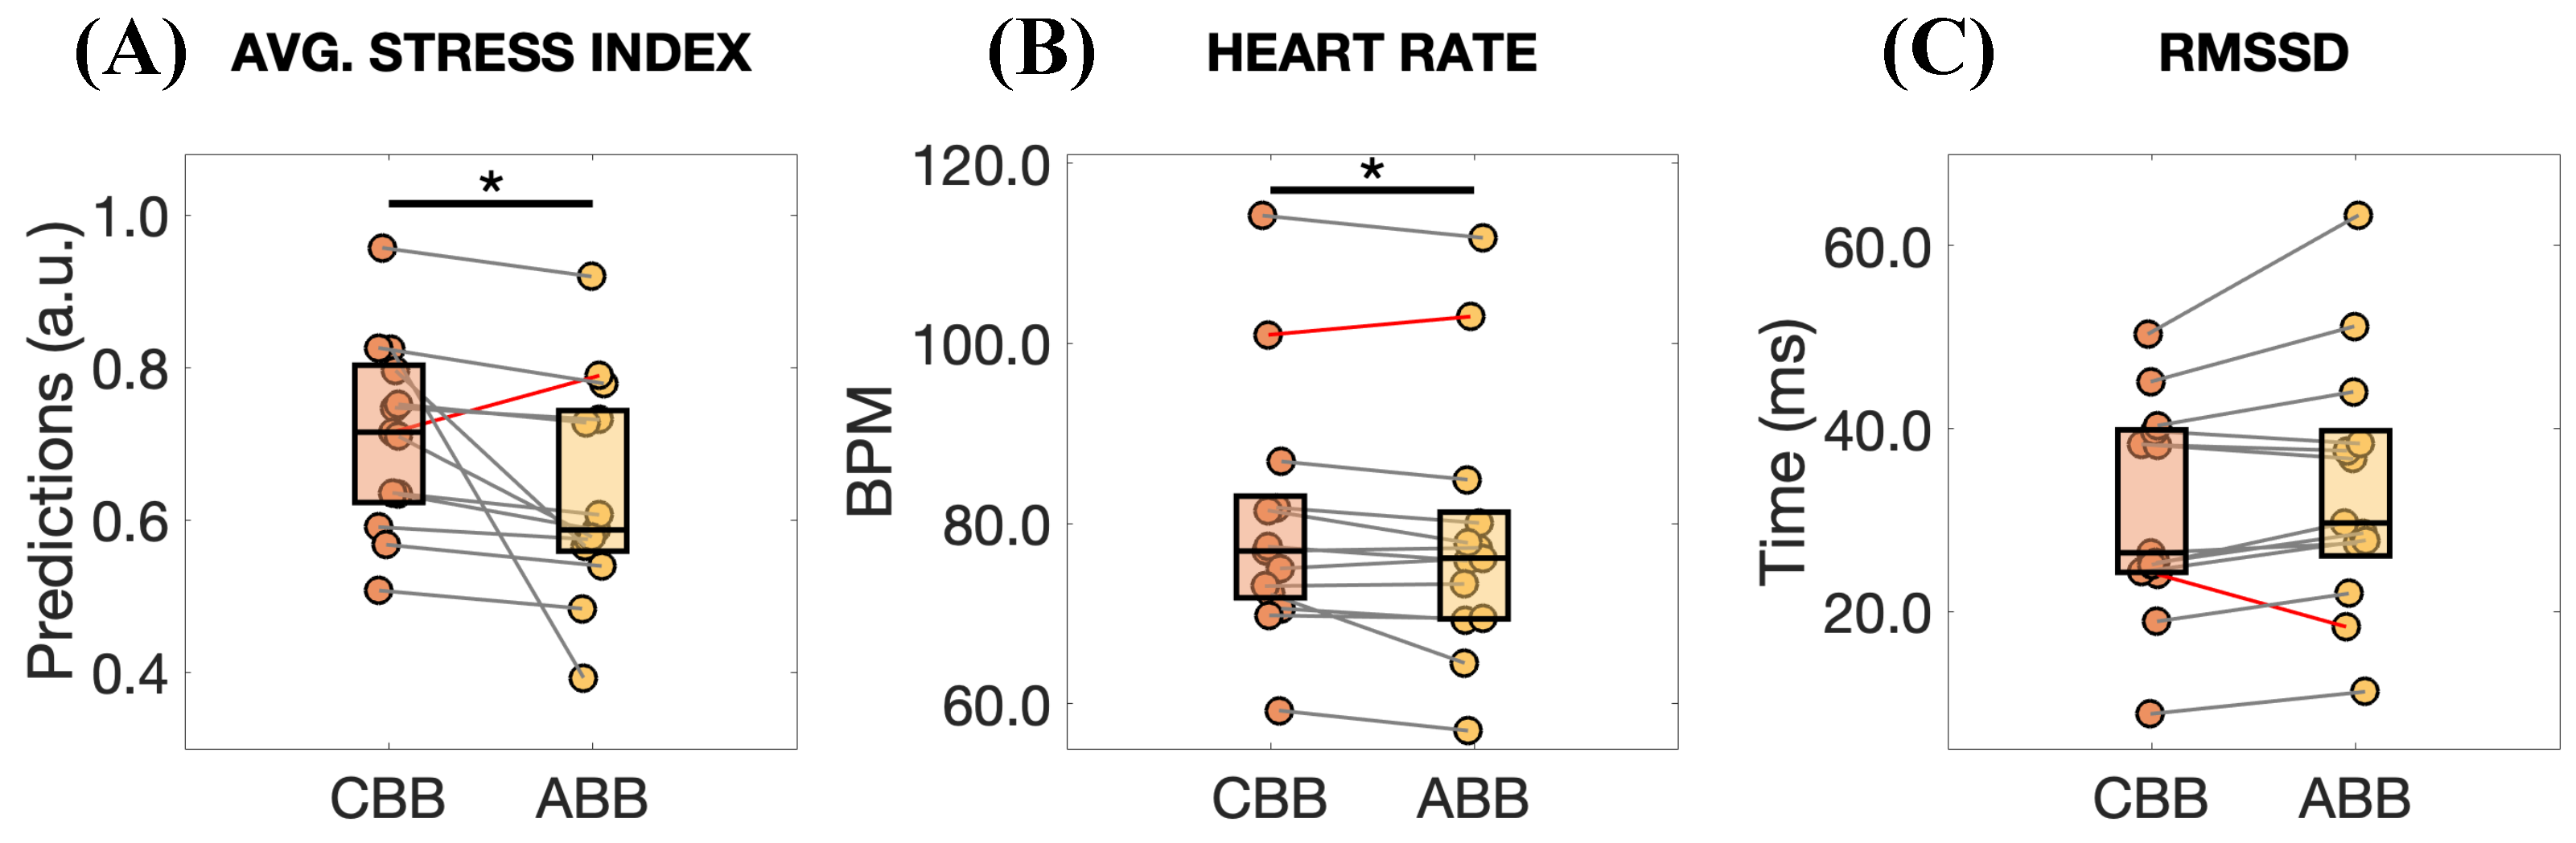
  • Number of participants and their mental health condition: The small number of participants limits the trustworthiness of our approach. For this reason, it is necessary to consider a wider sample and structure the experiments to account for multiple factors influencing cortisol levels [17]. However, additional consideration should be given. Despite the interesting results of this study, the effects of this stimulation are modest, especially in the HR and RMSSD changes (see Figure 7). We believe this result is largely attributable to the fact that our participants were healthy individuals. Accordingly, we anticipate that a more pronounced effect might be observed in individuals experiencing chronic stress, as they may have greater potential for improvement.
  • Task: Given the intrinsic variability in the subject’s response to stress [52,53,54], recreating a stressful event for all the participants is still a challenge [17]. In this regard, technologies like virtual and augmented reality can be utilized to design laboratory experiments that replicate the stress levels encountered in real-world situations [55].
  • Sensors: For this pilot study, a commercial chest strap (PolarH10) was used to collect the ECG. This device does not ensure that the signal quality meets medical standards. Therefore, future studies could consider using higher-quality sensors while simultaneously ensuring user comfort, such as integrating electrodes into clothes [56]. In our work, we decided to minimize the number of sensors, but future experiments could consider the acquisition of additional signals like electrodermal activity, which is well established for stress detection [57,58], and the EEG, which could permit a better understanding of the physiological and neural response of the participants during the stimulation. However, it should be pointed out that increasing the number of sensors can significantly increase the complexity of the system and discomfort on the part of the user, which could also impact stress perception.
  • Algorithm for f B B modulation: The proposed algorithm can certainly be optimized. For instance, it does not currently include a “reset” to restart the search for the optimal stimulation frequency (e.g., from the initial one at 6.0 Hz). Implementing this feature would enhance adaptability, allowing the algorithm to better accommodate variations in the subject’s optimal stimulation frequency throughout the task or under stressful conditions.
  • Loudness of the BBs: In this study, we chose to focus solely on the frequency of the BBs, keeping their loudness constant. Indeed, our choice was to work on one degree of freedom at a time, leaving the combination of more stimulation parameters (e.g., beat frequency and amplitude) for future works, to assess if better results than the ones presented here can be obtained.
All the above justify the need for additional research to investigate the efficacy of this novel stimulating approach. Once validated, an important application could involve this technology, either alone or in combination with others like vagus nerve stimulation, to alleviate the effects of psychological disorders.

5. Conclusions

With this work, we propose a novel approach for stress mitigation based on adaptive BBs stimulation within the theta range driven by the user’s physiological response. The results of this study emphasize the importance of a subject-specific technique to recognize stress and adapt the auditory stimulation. Despite the promising results, e.g., reduction in the intra-task stress index and heart rate, future research is needed to test the goodness in new stressful scenarios, with a bigger sample and considering an objective and external assessment of the stress level (e.g., the cortisol level).

Author Contributions

Conceptualization, M.R. and L.M.; methodology, M.R. and S.C.; software, S.C.; validation, M.R. and S.C.; formal analysis, M.R. and S.C.; investigation, M.R., S.C., S.R., R.R. and L.M.; data curation, M.R. and S.C.; writing—original draft preparation, M.R.; writing—review and editing, L.M., R.R. and S.R.; visualization, M.R.; supervision, L.M.; project administration, L.M. All authors have read and agreed to the published version of the manuscript.

Funding

This research received no external funding.

Institutional Review Board Statement

This study was conducted in accordance with the Declaration of Helsinki and approved by the Ethics Committee of the University of Turin (approval number 0125508).

Informed Consent Statement

Informed consent was obtained from all subjects involved in this study.

Data Availability Statement

The data are available upon reasonable request to the corresponding author.

Acknowledgments

This work was supported in part by the European Union—NextGenerationEU.

Conflicts of Interest

The authors declare no conflicts of interest.

References

  1. UK Mental Health. The Burnout Report; Report; Mental Health UK: London, UK, 2024. [Google Scholar]
  2. Iqbal, T.; Elahi, A.; Wijns, W.; Shahzad, A. Cortisol detection methods for stress monitoring in connected health. Health Sci. Rev. 2023, 6, 100079. [Google Scholar] [CrossRef]
  3. Benchekroun, M.; Istrate, D.; Zalc, V.; Lenne, D. Mmsd: A Multi-modal Dataset for Real-time, Continuous Stress Detection from Physiological Signals. In Proceedings of the HEALTHINF: 15th International Conference on Health Informatics, Virtual, 9–11 February 2022; pp. 240–248. [Google Scholar]
  4. Giannakakis, G.; Grigoriadis, D.; Giannakaki, K.; Simantiraki, O.; Roniotis, A.; Tsiknakis, M. Review on psychological stress detection using biosignals. IEEE Trans. Affect. Comput. 2019, 13, 440–460. [Google Scholar] [CrossRef]
  5. Taskasaplidis, G.; Fotiadis, D.A.; Bamidis, P. Review of Stress Detection Methods Using Wearable Sensors. IEEE Access 2024, 12, 38219–38246. [Google Scholar] [CrossRef]
  6. Gedam, S.; Paul, S. A review on mental stress detection using wearable sensors and machine learning techniques. IEEE Access 2021, 9, 84045–84066. [Google Scholar] [CrossRef]
  7. Nath, R.K.; Thapliyal, H.; Caban-Holt, A.; Mohanty, S.P. Machine learning based solutions for real-time stress monitoring. IEEE Consum. Electron. Mag. 2020, 9, 34–41. [Google Scholar] [CrossRef]
  8. Robles, D.; Benchekroun, M.; Zalc, V.; Istrate, D.; Taramasco, C. Stress detection from surface electromyography using convolutional neural networks. In Proceedings of the 2022 44th Annual International Conference of the IEEE Engineering in Medicine & Biology Society (EMBC), Glasgow, UK, 11–15 July 2022; pp. 3235–3238. [Google Scholar]
  9. Gil-Martin, M.; San-Segundo, R.; Mateos, A.; Ferreiros-Lopez, J. Human stress detection with wearable sensors using convolutional neural networks. IEEE Aerosp. Electron. Syst. Mag. 2022, 37, 60–70. [Google Scholar] [CrossRef]
  10. Puzi, N.M.; Jailani, R.; Norhazman, H.; Zaini, N.M. Alpha and Beta brainwave characteristics to binaural beat treatment. In Proceedings of the 2013 IEEE 9th International Colloquium on Signal Processing and its Applications, Kuala Lumpur, Malaysia, 8–10 March 2013; pp. 344–348. [Google Scholar]
  11. On, F.R.; Jailani, R.; Norhazman, H.; Zaini, N.M. Binaural beat effect on brainwaves based on EEG. In Proceedings of the 2013 IEEE 9th International Colloquium on Signal Processing and its Applications, Kuala Lumpur, Malaysia, 8–10 March 2013; pp. 339–343. [Google Scholar]
  12. Vernon, D.; Peryer, G.; Louch, J.; Shaw, M. Tracking EEG changes in response to alpha and beta binaural beats. Int. J. Psychophysiol. 2014, 93, 134–139. [Google Scholar] [CrossRef]
  13. Ala, T.S.; Ahmadi-Pajouh, M.A.; Nasrabadi, A.M. Cumulative effects of theta binaural beats on brain power and functional connectivity. Biomed. Signal Process. Control 2018, 42, 242–252. [Google Scholar]
  14. Beauchene, C.; Abaid, N.; Moran, R.; Diana, R.A.; Leonessa, A. The effect of binaural beats on visuospatial working memory and cortical connectivity. PLoS ONE 2016, 11, e0166630. [Google Scholar] [CrossRef]
  15. Lane, J.D.; Kasian, S.J.; Owens, J.E.; Marsh, G.R. Binaural auditory beats affect vigilance performance and mood. Physiol. Behav. 1998, 63, 249–252. [Google Scholar] [CrossRef]
  16. Katmah, R.; Al-Shargie, F.; Tariq, U.; Babiloni, F.; Al-Mughairbi, F.; Al-Nashash, H. Mental stress management using fnirs directed connectivity and audio stimulation. IEEE Trans. Neural Syst. Rehabil. Eng. 2023, 31, 1086–1096. [Google Scholar] [CrossRef]
  17. Raggi, M.; Moore, L.J.; Mesin, L. Inducing and Assessing Acute Mental Stress in Controlled Conditions: Topical Review and Guidelines for Effective Experimental Protocols. IEEE Access 2025, 13, 10022–10042. [Google Scholar] [CrossRef]
  18. Melnichuk, A.; Cooper, R.K., Jr.; Hawk, L.W., Jr. A parametric investigation of binaural beats for brain entrainment and enhancing sustained attention. Sci. Rep. 2025, 15, 4308. [Google Scholar] [CrossRef] [PubMed]
  19. Engelbregt, H.; Barmentlo, M.; Keeser, D.; Pogarell, O.; Deijen, J.B. Effects of binaural and monaural beat stimulation on attention and EEG. Exp. Brain Res. 2021, 239, 2781–2791. [Google Scholar] [CrossRef] [PubMed]
  20. Wang, L.; Zhang, W.; Li, X.; Yang, S. The effect of 40 Hz binaural beats on working memory. IEEE Access 2022, 10, 81556–81567. [Google Scholar] [CrossRef]
  21. Beauchene, C.; Abaid, N.; Moran, R.; Diana, R.A.; Leonessa, A. The effect of binaural beats on verbal working memory and cortical connectivity. J. Neural Eng. 2017, 14, 026014. [Google Scholar] [CrossRef]
  22. Kelton, K.; Weaver, T.L.; Willoughby, L.; Kaufman, D.; Santowski, A. The Efficacy of Binaural Beats as a Stress-buffering Technique. Altern. Ther. Health Med. 2021, 27, 28. [Google Scholar]
  23. Al-Shargie, F.; Katmah, R.; Tariq, U.; Babiloni, F.; Al-Mughairbi, F.; Al-Nashash, H. Stress management using fNIRS and binaural beats stimulation. Biomed. Opt. Express 2022, 13, 3552–3575. [Google Scholar] [CrossRef]
  24. Carrington, P.; Collings, G.H., Jr.; Benson, H.; Robinson, H.; Wood, L.W.; Lehrer, P.M.; Woolfolk, R.L.; Cole, J.W. The use of meditation–relaxation techniques for the management of stress in a working population. J. Occup. Environ. Med. 1980, 22, 221–231. [Google Scholar]
  25. Grossman, P.; Niemann, L.; Schmidt, S.; Walach, H. Mindfulness-based stress reduction and health benefits: A meta-analysis. J. Psychosom. Res. 2004, 57, 35–43. [Google Scholar] [CrossRef]
  26. Baseanu, I.C.C.; Roman, N.A.; Minzatanu, D.; Manaila, A.; Tuchel, V.I.; Basalic, E.B.; Miclaus, R.S. The Efficiency of Binaural Beats on Anxiety and Depression—A Systematic Review. Appl. Sci. 2024, 14, 5675. [Google Scholar] [CrossRef]
  27. Klichowski, M.; Wicher, A.; Kruszwicka, A.; Golebiewski, R. Reverse effect of home-use binaural beats brain stimulation. Sci. Rep. 2023, 13, 11079. [Google Scholar] [CrossRef]
  28. López-Caballero, F.; Escera, C. Binaural beat: A failure to enhance EEG power and emotional arousal. Front. Hum. Neurosci. 2017, 11, 557. [Google Scholar] [CrossRef] [PubMed]
  29. Gao, X.; Cao, H.; Ming, D.; Qi, H.; Wang, X.; Wang, X.; Chen, R.; Zhou, P. Analysis of EEG activity in response to binaural beats with different frequencies. Int. J. Psychophysiol. 2014, 94, 399–406. [Google Scholar] [CrossRef] [PubMed]
  30. Ingendoh, R.M.; Posny, E.S.; Heine, A. Binaural beats to entrain the brain? A systematic review of the effects of binaural beat stimulation on brain oscillatory activity, and the implications for psychological research and intervention. PLoS ONE 2023, 18, e0286023. [Google Scholar] [CrossRef]
  31. Corona-González, C.E.; Alonso-Valerdi, L.M.; Ibarra-Zarate, D.I. Personalized theta and beta binaural beats for brain entrainment: An electroencephalographic analysis. Front. Psychol. 2021, 12, 764068. [Google Scholar] [CrossRef]
  32. Klimesch, W. The frequency architecture of brain and brain body oscillations: An analysis. Eur. J. Neurosci. 2018, 48, 2431–2453. [Google Scholar] [CrossRef] [PubMed]
  33. Musicoterapia. Musicoterapia Musica Rilassante + Musica Zen + Da Massaggio + Per Yoga + Musica New Age. 2024. Available online: https://www.youtube.com/watch?v=kADG8l20Yuc (accessed on 30 September 2024).
  34. Wahbeh, H.; Calabrese, C.; Zwickey, H.; Zajdel, D. Binaural beat technology in humans: A pilot study to assess neuropsychologic, physiologic, and electroencephalographic effects. J. Altern. Complement. Med. 2007, 13, 199–206. [Google Scholar] [CrossRef]
  35. Kraus, J.; Porubanová, M. The effect of binaural beats on working memory capacity. Stud. Psychol. 2015, 57, 135. [Google Scholar] [CrossRef]
  36. Linares, N.N.; Charron, V.; Ouimet, A.J.; Labelle, P.R.; Plamondon, H. A systematic review of the Trier Social Stress Test methodology: Issues in promoting study comparison and replicable research. Neurobiol. Stress 2020, 13, 100235. [Google Scholar]
  37. Grassini, S.; Segurini, G.V.; Koivisto, M. Watching nature videos promotes physiological restoration: Evidence from the modulation of alpha waves in electroencephalography. Front. Psychol. 2022, 13, 871143. [Google Scholar] [CrossRef]
  38. Huang, M.; Ebey, J.; Wolf, S. Responses of the QT interval of the electrocardiogram during emotional stress. Psychosom. Med. 1989, 51, 419–427. [Google Scholar] [CrossRef] [PubMed]
  39. Haapalahti, P.; Mäkijärvi, M.; Montonen, J.; Korhonen, P.; Salorinne, Y.; Oikarinen, L.; Viitasalo, M.; Toivonen, L. Effects of cardiovascular autonomic function tests on QT dispersion in the 12-lead electrocardiogram of healthy patients. J. Electrocardiol. 2000, 33, 321–327. [Google Scholar] [CrossRef] [PubMed]
  40. Andrássy, G.; Szabo, A.; Ferencz, G.; Trummer, Z.; Simon, E.; Tahy, Á. Mental stress may induce QT-interval prolongation and T-wave notching. Ann. Noninvasive Electrocardiol. 2007, 12, 251–259. [Google Scholar] [CrossRef] [PubMed]
  41. Heslegrave, R.J.; Furedy, J.J. Sensitivities of HR and T-wave amplitude for detecting cognitive and anticipatory stress. Physiol. Behav. 1979, 22, 17–23. [Google Scholar] [CrossRef]
  42. Widjaja, D.; Orini, M.; Vlemincx, E.; Van Huffel, S. Cardiorespiratory Dynamic Response to Mental Stress: A Multivariate Time-Frequency Analysis. Comput. Math. Methods Med. 2013, 2013, 451857. [Google Scholar] [CrossRef]
  43. Grossman, P. Respiration, stress, and cardiovascular function. Psychophysiology 1983, 20, 284–300. [Google Scholar] [CrossRef]
  44. Scheirer, C.J.; Ray, W.S.; Hare, N. The analysis of ranked data derived from completely randomized factorial designs. Biometrics 1976, 32, 429–434. [Google Scholar] [CrossRef]
  45. Gambetta-Tessini, K.; Mariño, R.; Morgan, M.; Evans, W.; Anderson, V. Stress and health-promoting attributes in Australian, New Zealand, and Chilean dental students. J. Dent. Educ. 2013, 77, 801–809. [Google Scholar] [CrossRef]
  46. Kayikcioglu, O.; Bilgin, S.; Seymenoglu, G.; Deveci, A. State and trait anxiety scores of patients receiving intravitreal injections. Biomed. Hub 2017, 2, 1–5. [Google Scholar] [CrossRef]
  47. Shaffer, F.; Ginsberg, J.P. An overview of heart rate variability metrics and norms. Front. Public Health 2017, 5, 258. [Google Scholar] [CrossRef] [PubMed]
  48. Paiva, J.S.; Rodrigues, S.; Cunha, J.P.S. Changes in ST, QT and RR ECG intervals during acute stress in firefighters: A pilot study. In Proceedings of the 2016 38th Annual International Conference of the IEEE Engineering in Medicine and Biology Society (EMBC), Orlando, FL, USA, 16–20 August 2016; pp. 3378–3381. [Google Scholar]
  49. Latkin, C.A.; Edwards, C.; Davey-Rothwell, M.A.; Tobin, K.E. The relationship between social desirability bias and self-reports of health, substance use, and social network factors among urban substance users in Baltimore, Maryland. Addict. Behav. 2017, 73, 133–136. [Google Scholar] [CrossRef]
  50. Seipäjärvi, S.M.; Tuomola, A.; Juurakko, J.; Rottensteiner, M.; Rissanen, A.P.E.; Kurkela, J.L.; Kujala, U.M.; Laukkanen, J.A.; Wikgren, J. Measuring psychosocial stress with heart rate variability-based methods in different health and age groups. Physiol. Meas. 2022, 43, 055002. [Google Scholar] [CrossRef] [PubMed]
  51. Caravati, E.; Barbeni, F.; Chiarion, G.; Raggi, M.; Mesin, L. Closed-Loop Transcranial Electrical Neurostimulation for Sustained Attention Enhancement: A Pilot Study towards Personalized Intervention Strategies. Bioengineering 2024, 11, 467. [Google Scholar] [CrossRef]
  52. Lazarus, R.S. Stress and Emotion: A New Synthesis; Springer Publishing Company, Inc.: New York, NY, USA, 1999. [Google Scholar]
  53. Thatcher, J.; Day, M.C. Re-appraising stress appraisals: The underlying properties of stress in sport. Psychol. Sport Exerc. 2008, 9, 318–335. [Google Scholar] [CrossRef]
  54. Lazarus, R.S. Emotions and interpersonal relationships: Toward a person-centered conceptualization of emotions and coping. J. Personal. 2006, 74, 9–46. [Google Scholar] [CrossRef]
  55. Ladakis, I.; Filos, D.; Chouvarda, I. Virtual reality environments for stress reduction and management: A scoping review. Virtual Real. 2024, 28, 50. [Google Scholar] [CrossRef]
  56. Li, M.; Xiong, W.; Li, Y. Wearable measurement of ECG signals based on smart clothing. Int. J. Telemed. Appl. 2020, 2020, 6329360. [Google Scholar] [CrossRef]
  57. Raju, A.R.; Ramadevi, R.; Babu, P.R.; Vetriselvi, D. Galvanic Skin Response based Stress Detection System using Machine Learning and IoT. In Proceedings of the 2023 Second International Conference on Augmented Intelligence and Sustainable Systems (ICAISS), Trichy, India, 23–25 August 2023; pp. 709–714. [Google Scholar]
  58. Navea, R.F.; Buenvenida, P.J.; Cruz, C.D. Stress detection using galvanic skin response: An android application. In Proceedings of the International Conference on Biomedical Engineering, Penang Island, Malaysia, 26–27 August 2019. [Google Scholar]
Figure 1. (A) Graphical representation of the proposed adaptive stimulation approach considering the features of the electrocardiogram (ECG) and ECG-derived respiratory (EDR) signals. (B) Experimental protocol. It consists of a sequence of relaxing videos and mental arithmetic tasks, acting as stressors. Steps 1 and 2 were considered for training the random forest regressor, whereas steps 4 and 6 were used to test the effect of constant and adapted stimulations (STIM ON). Notably, during the viewing of the relaxing videos (steps 3 and 5), the auditive stimulation was turned off (STIM OFF). At the end of each task, a visual analog scale (VAS) questionnaire was presented to the participants with values ranging from 0 (no stress) to 5 (high stress) to assess the perceived stress. The temporal duration of the tasks was 2 and 4 min, respectively, for the relaxing videos and mental arithmetic tasks.
Applsci 15 05742 g001
Figure 2. (A) Example of signal received in real time from PolarH10 chest strap with red circular marker indicating the R peaks. (B) Average ECG waveform from one participant with a graphical representation of some investigated features like R P R , Q T interval, and R T R . (C) EDR signal from the same subject including an illustration of some investigated features: R P , P R , and A p p . The reader is referred to Section 2.4 for a detailed explanation of the acronyms.
Applsci 15 05742 g002
Figure 3. (A) Stress index trends during steps 1 and 2 (training phase) for all the participants. The solid black line represents the average of the curves. Results indicate an average determination coefficient ( R 2 ) of 0.78. (B) Average heart rate for the investigated sample during the relaxing video (VID) and the mental arithmetic task (MAT). (C) Results of the visual analog scale (VAS) questionnaire for both the VID and MAT. Statistically significant differences are indicated with ** for p < 0.01 . Concerning (B,C), the bar represents the median of the distribution.
Applsci 15 05742 g003
Figure 4. (A) Ranking of the features as determined by the random forest regressor. The values are reported as average values between the participants. (B) Ranking of the top 5 features for subject 1 (S1). (C) RR interval estimated during VID and MAT. (D) R T R during the same tasks. (EG) Same as (BD) but for another subject, i.e., subject 2 (S2).
Applsci 15 05742 g004
Figure 5. (A) Stress predictor (S) for the participants receiving the adapted (ABB) and constant (CBB) stimulation, with this specific order. (B) Similar to (A) but considering the participants receiving the opposite stimulation order. (C) f B B changes during the ABB stimulation. The solid black line represents the average of the curves, each relative to one participant.
Applsci 15 05742 g005
Figure 6. (A) Average stress indexes from all the participants considering steps 3, 4, 5, and 6. (B) Results of the VAS questionnaire. (C) Accuracies of the MATs during CBB and ABB stimulations. (D) Reaction times of the MATS during CBB and ABB stimulations. Statistically significant differences are indicated with * for p < 0.05 .
Applsci 15 05742 g006
Figure 7. (A) Average stress indexes with pairwise comparison for CBB and ABB stimulations. (B) Comparison of the average heart rates. (C) Comparison of the root mean square of successive differences (RMSSD). Statistically significant differences are indicated with * for p < 0.05 . Observe that one particular subject exhibits behavior contrary to the trend seen in the others; this deviation is highlighted by the red segments.
Applsci 15 05742 g007
Disclaimer/Publisher’s Note: The statements, opinions and data contained in all publications are solely those of the individual author(s) and contributor(s) and not of MDPI and/or the editor(s). MDPI and/or the editor(s) disclaim responsibility for any injury to people or property resulting from any ideas, methods, instructions or products referred to in the content.

