1. Introduction
Automotive noise originates from multiple sources, including engine operation, exhaust flow, tire–road interaction, and aerodynamic effects. Among these, engine noise in internal combustion engine vehicles is a major contributor, stemming from mechanical operations, fuel combustion, and gas expulsion within the exhaust system. At high speeds, aerodynamic noise and friction noise from tire–road contact also significantly impact overall vehicle noise levels.
Despite extensive research into these noise sources, noise-related complaints remain a persistent challenge for manufacturers. Recently, drivers of a compact passenger vehicle reported an abnormal noise—described as resembling gravel or sand rushing through a pipe—that occurred when the engine speed increased suddenly during cold starts. This study revealed, through experiment and analysis, that the abnormal noise was caused by cavitation occurring in the heater core. This study aims to identify the causes of this cavitation-induced noise and propose effective mitigation strategies.
Cavitation is a critical fluid dynamic phenomenon that occurs under specific pressure and velocity conditions. It involves the formation and collapse of vapor bubbles within a fluid due to rapid pressure fluctuations, which can lead to mechanical damage, performance degradation, vibration, noise generation, and even system failure. In rotating machinery such as centrifugal pumps, propellers, and turbines, cavitation is typically induced by localized pressure drops from dynamic fluid motion. In stationary systems like valves and nozzles, it is often caused by flow geometry changes that reduce pressure and lead to bubble formation.
Substantial research has addressed cavitation noise in centrifugal pumps. Cernetic [
1] used vibration and noise signals to detect and monitor cavitation in kinetic pumps. Dong et al. [
2] developed an experimental method for detecting cavitation inception, while Zhou et al. [
3] optimized sensor placement for improved fault diagnosis. Si et al. [
4] characterized cavitation noise using testing and simulation, and Wang et al. [
5] analyzed inlet and outlet noise across different flow rates and cavitation stages.
Similarly, cavitation noise in marine propellers has been extensively studied. Salvatore and Ianniello [
6] numerically predicted acoustic pressure fields from cavitating propellers. Lee et al. [
7] used time-frequency analysis techniques to identify cavitation noise patterns, while Park and Seong [
8] proposed a scaling law to predict tip vortex noise. Lyu et al. [
9] presented noise suppression strategies, and Köksal et al. [
10] conducted numerical predictions of propeller cavitation noise.
In turbines, Wang et al. [
11] examined cavitation, noise, and slipstream behavior in tidal turbines. Rus et al. [
12] studied acoustic emissions in Kaplan turbines, while Pitsikoulis et al. [
13] found that increased blade skewness reduced cavitation noise and vibration at the cost of efficiency. Feng et al. [
14] developed a test system integrating cavitation imaging and vibration analysis, and Zuo et al. [
15] used numerical modeling to predict inter-blade vortex behavior in Francis turbines.
Stationary components such as valves have also been investigated. Zou et al. [
16] combined numerical and experimental methods to study cavitation in non-circular spool valves. Yi et al. [
17] explored the interaction between poppet vibration and cavitation in relief valves. Wang et al. [
18] analyzed the effects of spool radial deviation in hydraulic cone valves, while Qiu et al. [
19] used simulations to optimize valve design for noise reduction. Zhang et al. [
20] validated numerical findings with experiments on short-tube throttle valves.
Cavitation noise in nozzles has also received attention. Zhang et al. [
21] examined the high-frequency characteristics of water jet cavitation collapse. Xu et al. [
22] analyzed noise from gas jets in submerged nozzles, and Hassanzadeh et al. [
23] studied wall injection effects on diesel injector flows. Jablonská et al. [
24] performed spectral analysis of pressure, noise, and vibration in convergent–divergent nozzles.
Cavitation phenomena in automotive systems have been widely studied due to their detrimental impact on system performance and component durability. For instance, vibration-based diagnostic methods have been employed to detect cavitation in gerotor pumps used for engine lubrication, offering a non-intrusive and effective means of monitoring [
25,
26]. Additionally, recent numerical modeling efforts have addressed cavitation-induced damage in critical components such as the connecting rod big end bearing, further emphasizing the need for both experimental and computational approaches to understanding cavitation in complex engine systems [
27]. These studies collectively underscore the importance of cavitation monitoring, aligning with the objectives of our work on heater core-induced noise and vibration. On the other hand, Aoyama et al. [
28] investigated cavitation noise in diesel engine main bearings, attributing it to oil film cavitation, journal instability, and excitation forces. Given this research gap, the present study focuses on cavitation noise originating from the heater core of a compact passenger vehicle. The goal is to deepen the understanding of this phenomenon and offer practical mitigation strategies.
Despite the breadth of existing literature on cavitation in automotive systems—particularly in components such as oil pumps, bearings, injectors, and valves—there remains a lack of focused investigation into cavitation phenomena occurring within the heater core, especially under transient cold-start conditions. Previous research has primarily addressed cavitation in rotating or high-pressure components, often emphasizing fluid delivery performance, component degradation, or lubrication system reliability. However, little attention has been given to cavitation-induced noise and vibration in low-pressure, thermally regulated circuits such as those found in HVAC systems. This study addresses this critical research gap by examining a real-world case of abnormal noise reported in a compact passenger vehicle, identifying its root cause as cavitation in the heater core, and validating the findings through a combination of experimental noise and vibration measurements, flow simulations, and flow visualization techniques. The proposed noise mitigation strategies derived from this integrated approach offer new insights applicable to the design and refinement of thermal management systems in future vehicles.
At the outset, the cause of the abnormal noise during high-speed engine operation in a small-displacement, four-cylinder turbocharged engine during cold starts was unknown. This paper documents the research process undertaken to identify the source and propose solutions.
Section 2 describes experiments that measured noise and vibration during noise events and led to the identification of cavitation noise.
Section 3 presents flow analysis simulations used to estimate the cause and location of cavitation, followed by flow visualization experiments using a transparent pipe to validate the findings and measure noise and vibration.
Section 4 discusses noise reduction strategies, first evaluated through simulations and then experimentally verified. Finally,
Section 5 summarizes the findings and conclusions of this study.
2. Measurement and Analysis of Noise and Vibration from the Heater Core
The engine cooling system in an automobile consists of key components, including the water pump, radiator, heater core, and connecting hoses, as shown in
Figure 1. The red arrows in the figure indicate the direction of coolant flow. This system functions to regulate engine temperature by circulating coolant through the engine block, radiator, and associated components, thereby dissipating excess heat to prevent overheating and ensure optimal performance.
Within the heating, ventilation, and air conditioning (HVAC) system, the heater core plays a crucial role as a heat exchanger that utilizes hot engine coolant to warm the air entering the cabin. The HVAC system is responsible for controlling airflow, temperature, and humidity, with the heater core specifically supplying heated air in low-temperature conditions. A blower fan directs air over the heater core, facilitating heat transfer from the coolant to the air, which is subsequently distributed through the cabin vents.
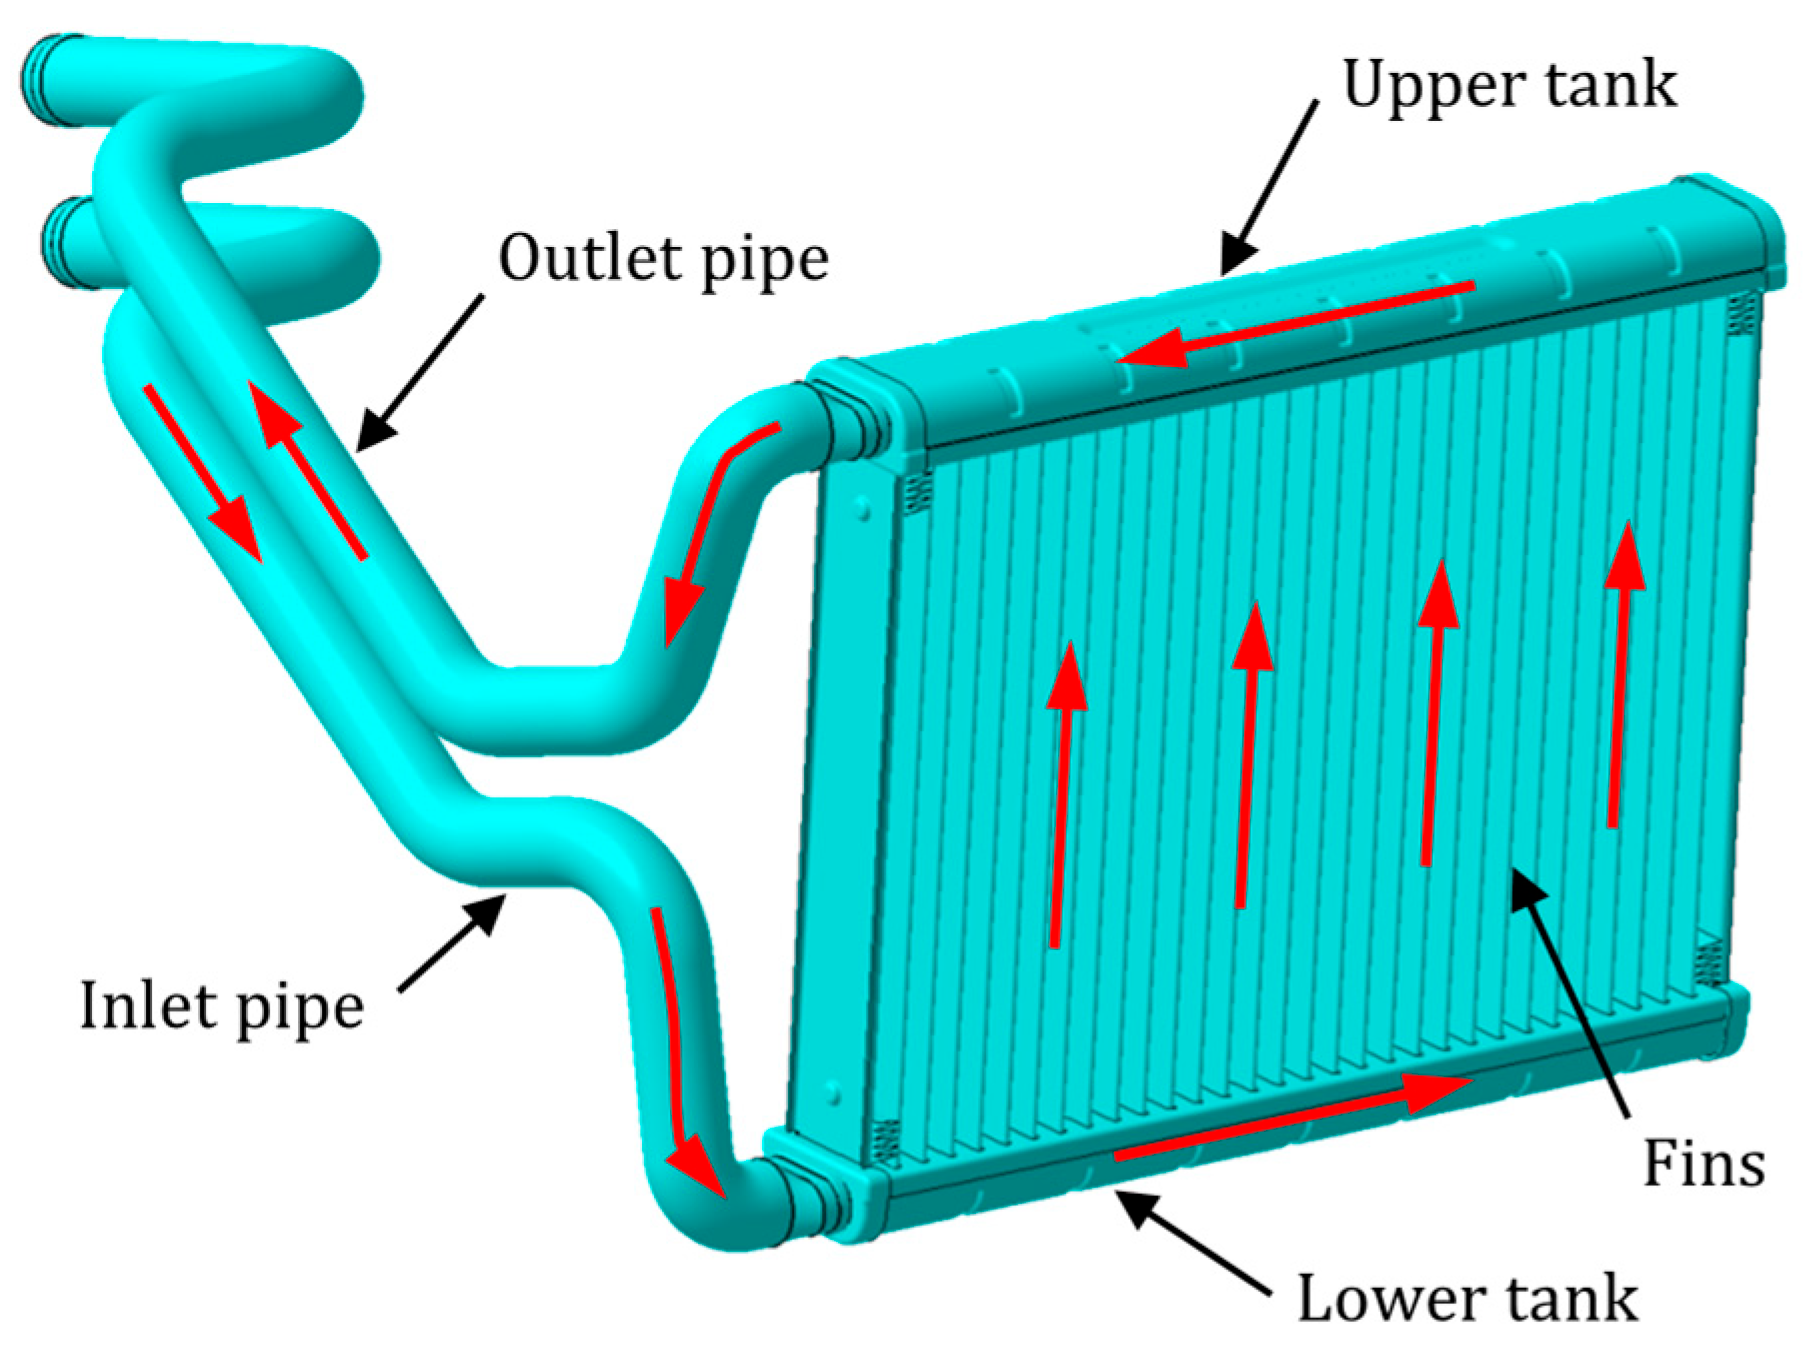
As illustrated in
Figure 2, the heater core consists of a compact heat exchanger composed of upper and lower tanks, thin metal fins, and inlet/outlet pipes. These components are typically constructed from aluminum or copper to enhance heat transfer efficiency. Hot coolant enters the lower tank via the inlet pipe, flows through the fins, and exits into the upper tank before returning to the water pump. Air passing over the fins absorbs heat from the coolant, enabling effective thermal management while maintaining a lightweight and compact design that seamlessly integrates into the HVAC system.
2.1. Measurement and Analysis in the Experimental Setup
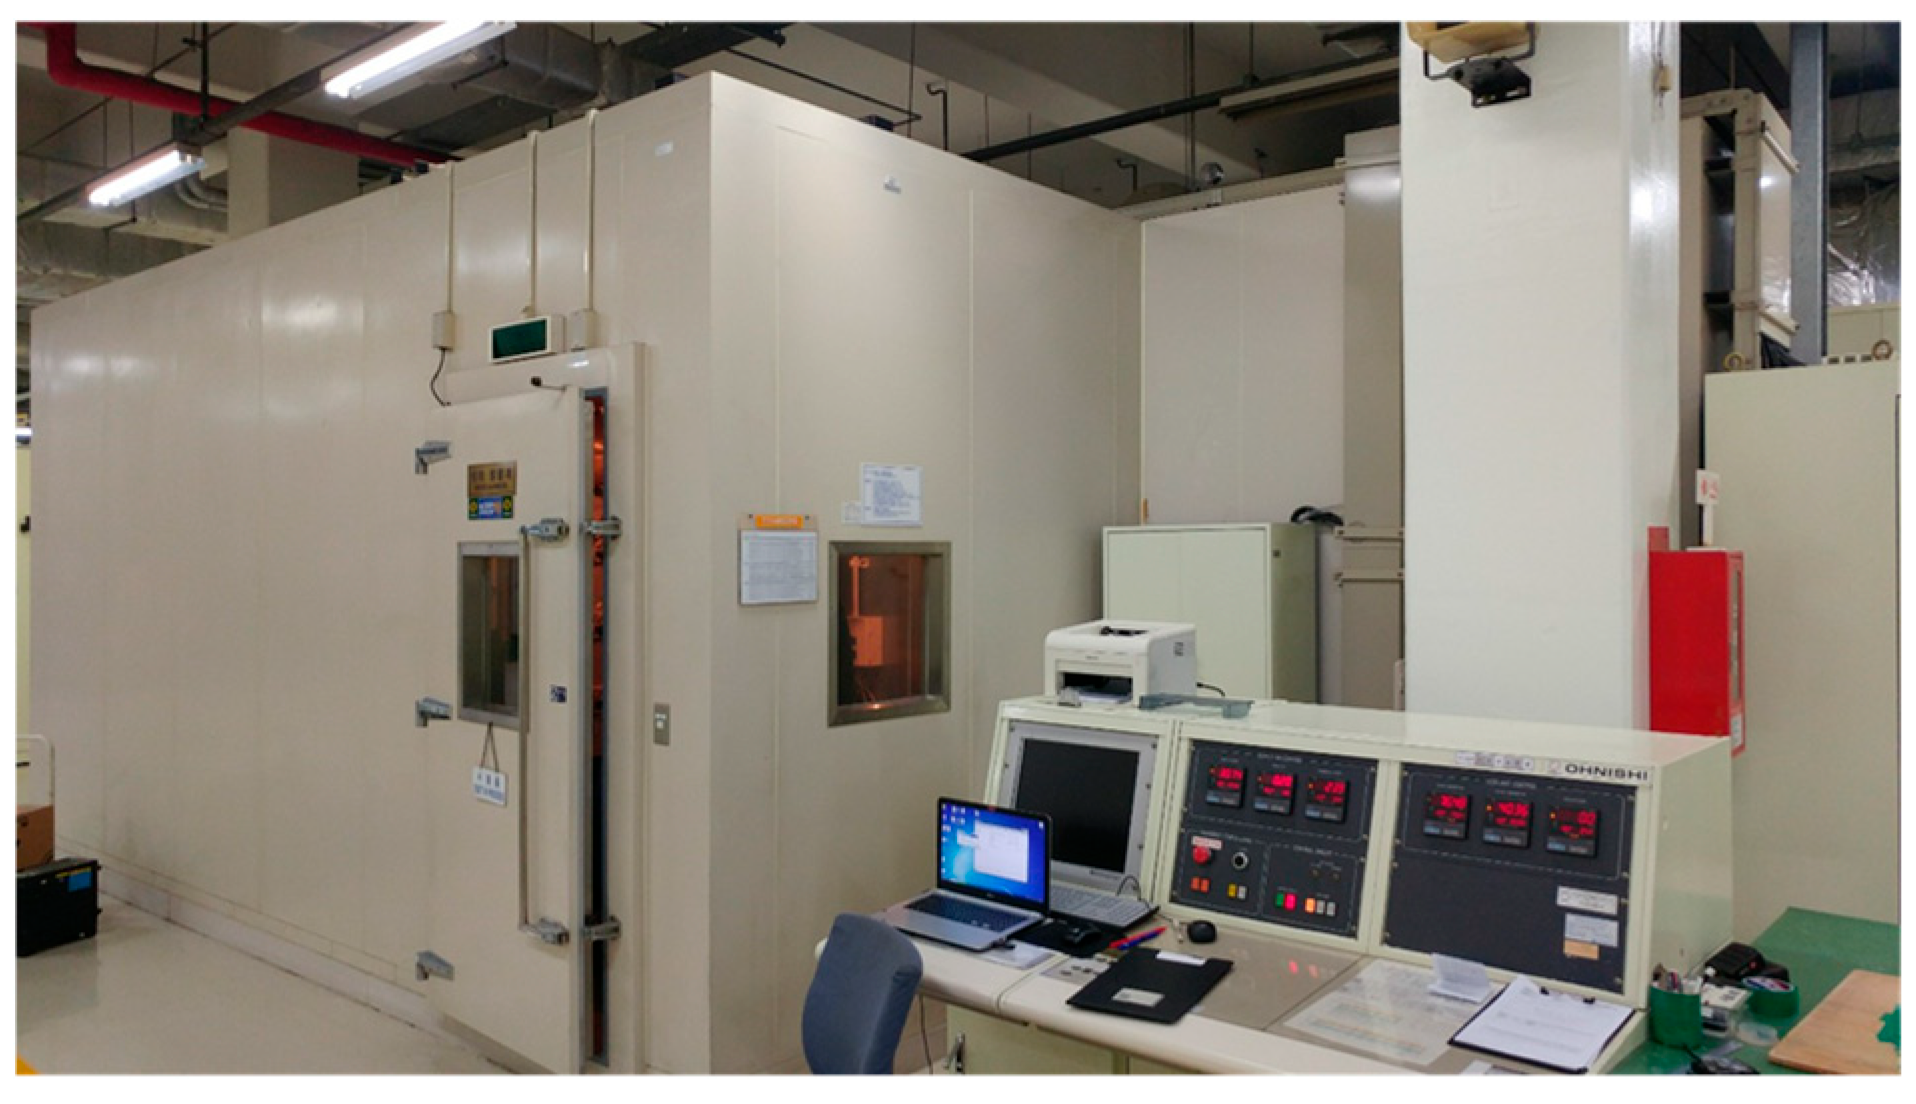
To investigate noise and vibration characteristics, coolant was supplied to the heater core using controlled equipment capable of regulating temperature and flow rate, as depicted in
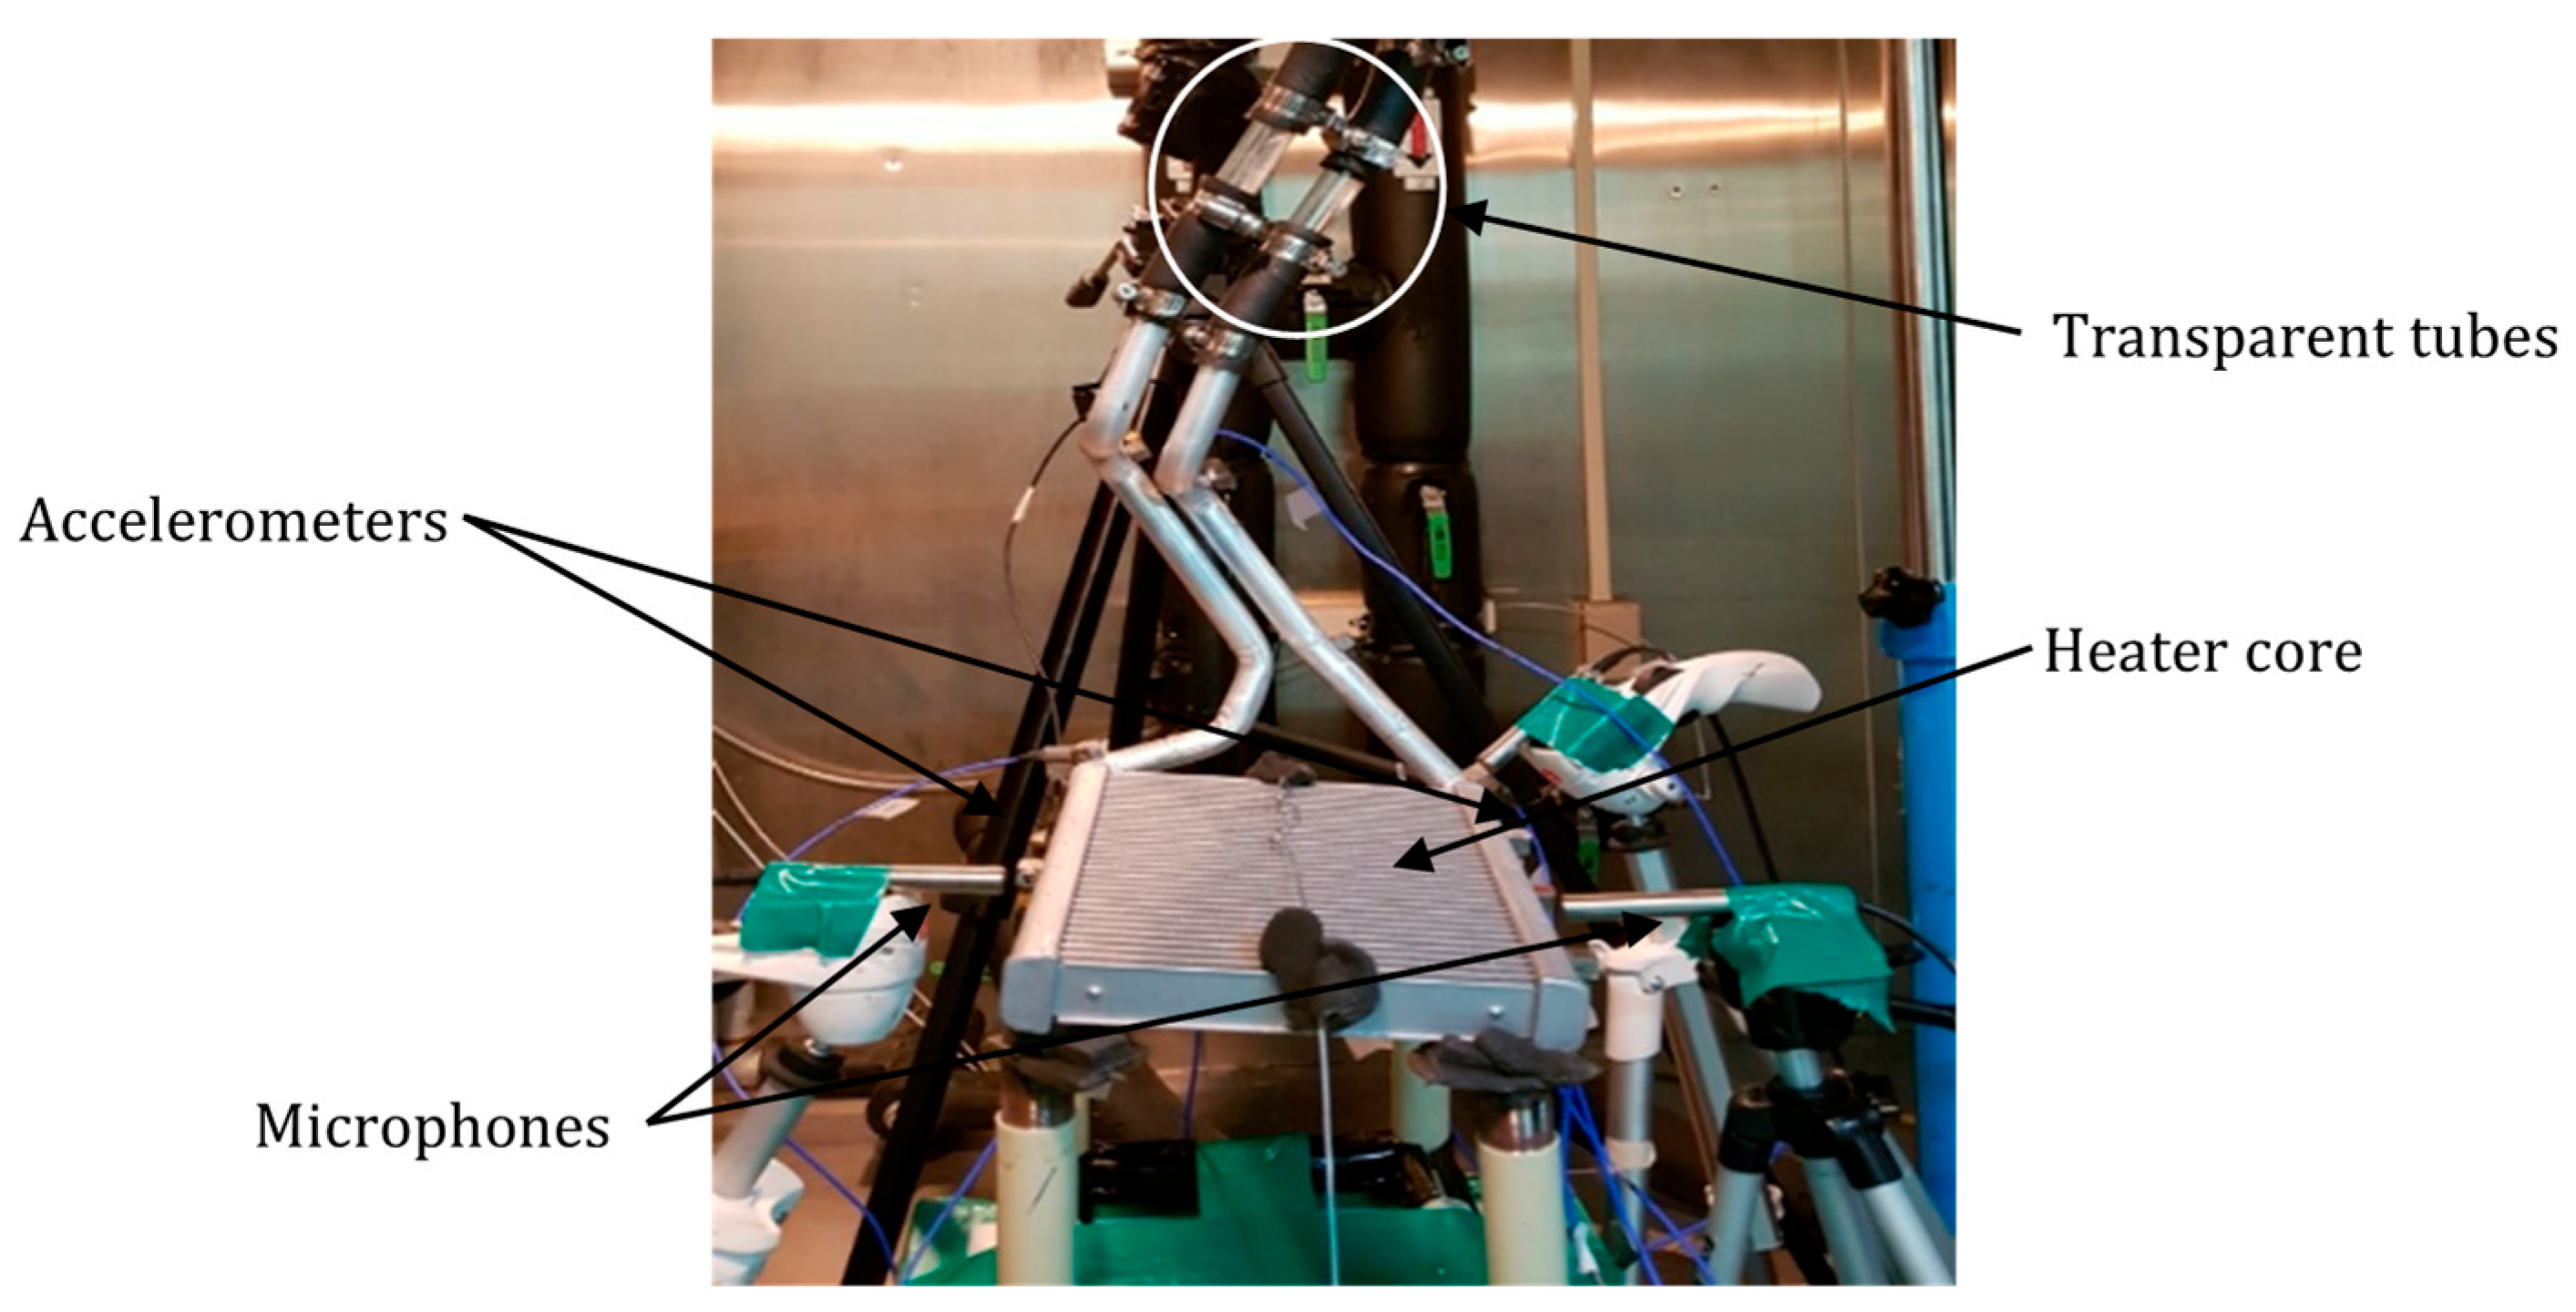
Figure 3. The experimental setup shown in
Figure 4 was employed to measure the noise and vibration generated by the heater core. Noise measurements were conducted using microphones (PCB 378B02, PCB Piezotronics, Depew, NY, USA), while accelerometers (B&K 4383, Brüel & Kjær, Nærum, Denmark) captured vibration data. The acquired signals were processed using a spectrum analyzer (B&K 3050-B-060, Brüel & Kjær, Nærum, Denmark) to analyze responses in both time and frequency domains. To examine cavitation-induced bubble formation, transparent tubes were installed in the inlet and outlet pipes for visual observation.
Cavitation bubble formation was investigated under varying coolant conditions, with temperatures set at 75 °C, 80 °C, and 85 °C and flow rates of 20, 25, 30, and 35 L/min.
Table 1 summarizes the observations, where “O” denotes cavitation occurrence and “X” indicates its absence. The results demonstrate that cavitation is more likely to occur at lower coolant temperatures and higher flow velocities. Specifically, at 75 °C, cavitation occurred at 30 and 35 L/min but was absent at lower flow rates. At 80 °C, cavitation was observed only at 35 L/min, while at 85 °C, cavitation did not occur at any tested flow rate. Since the cross-sectional area of the inlet and outlet pipes remains constant, an increase in flow rate leads to a corresponding increase in flow velocity, promoting cavitation formation under specific conditions.
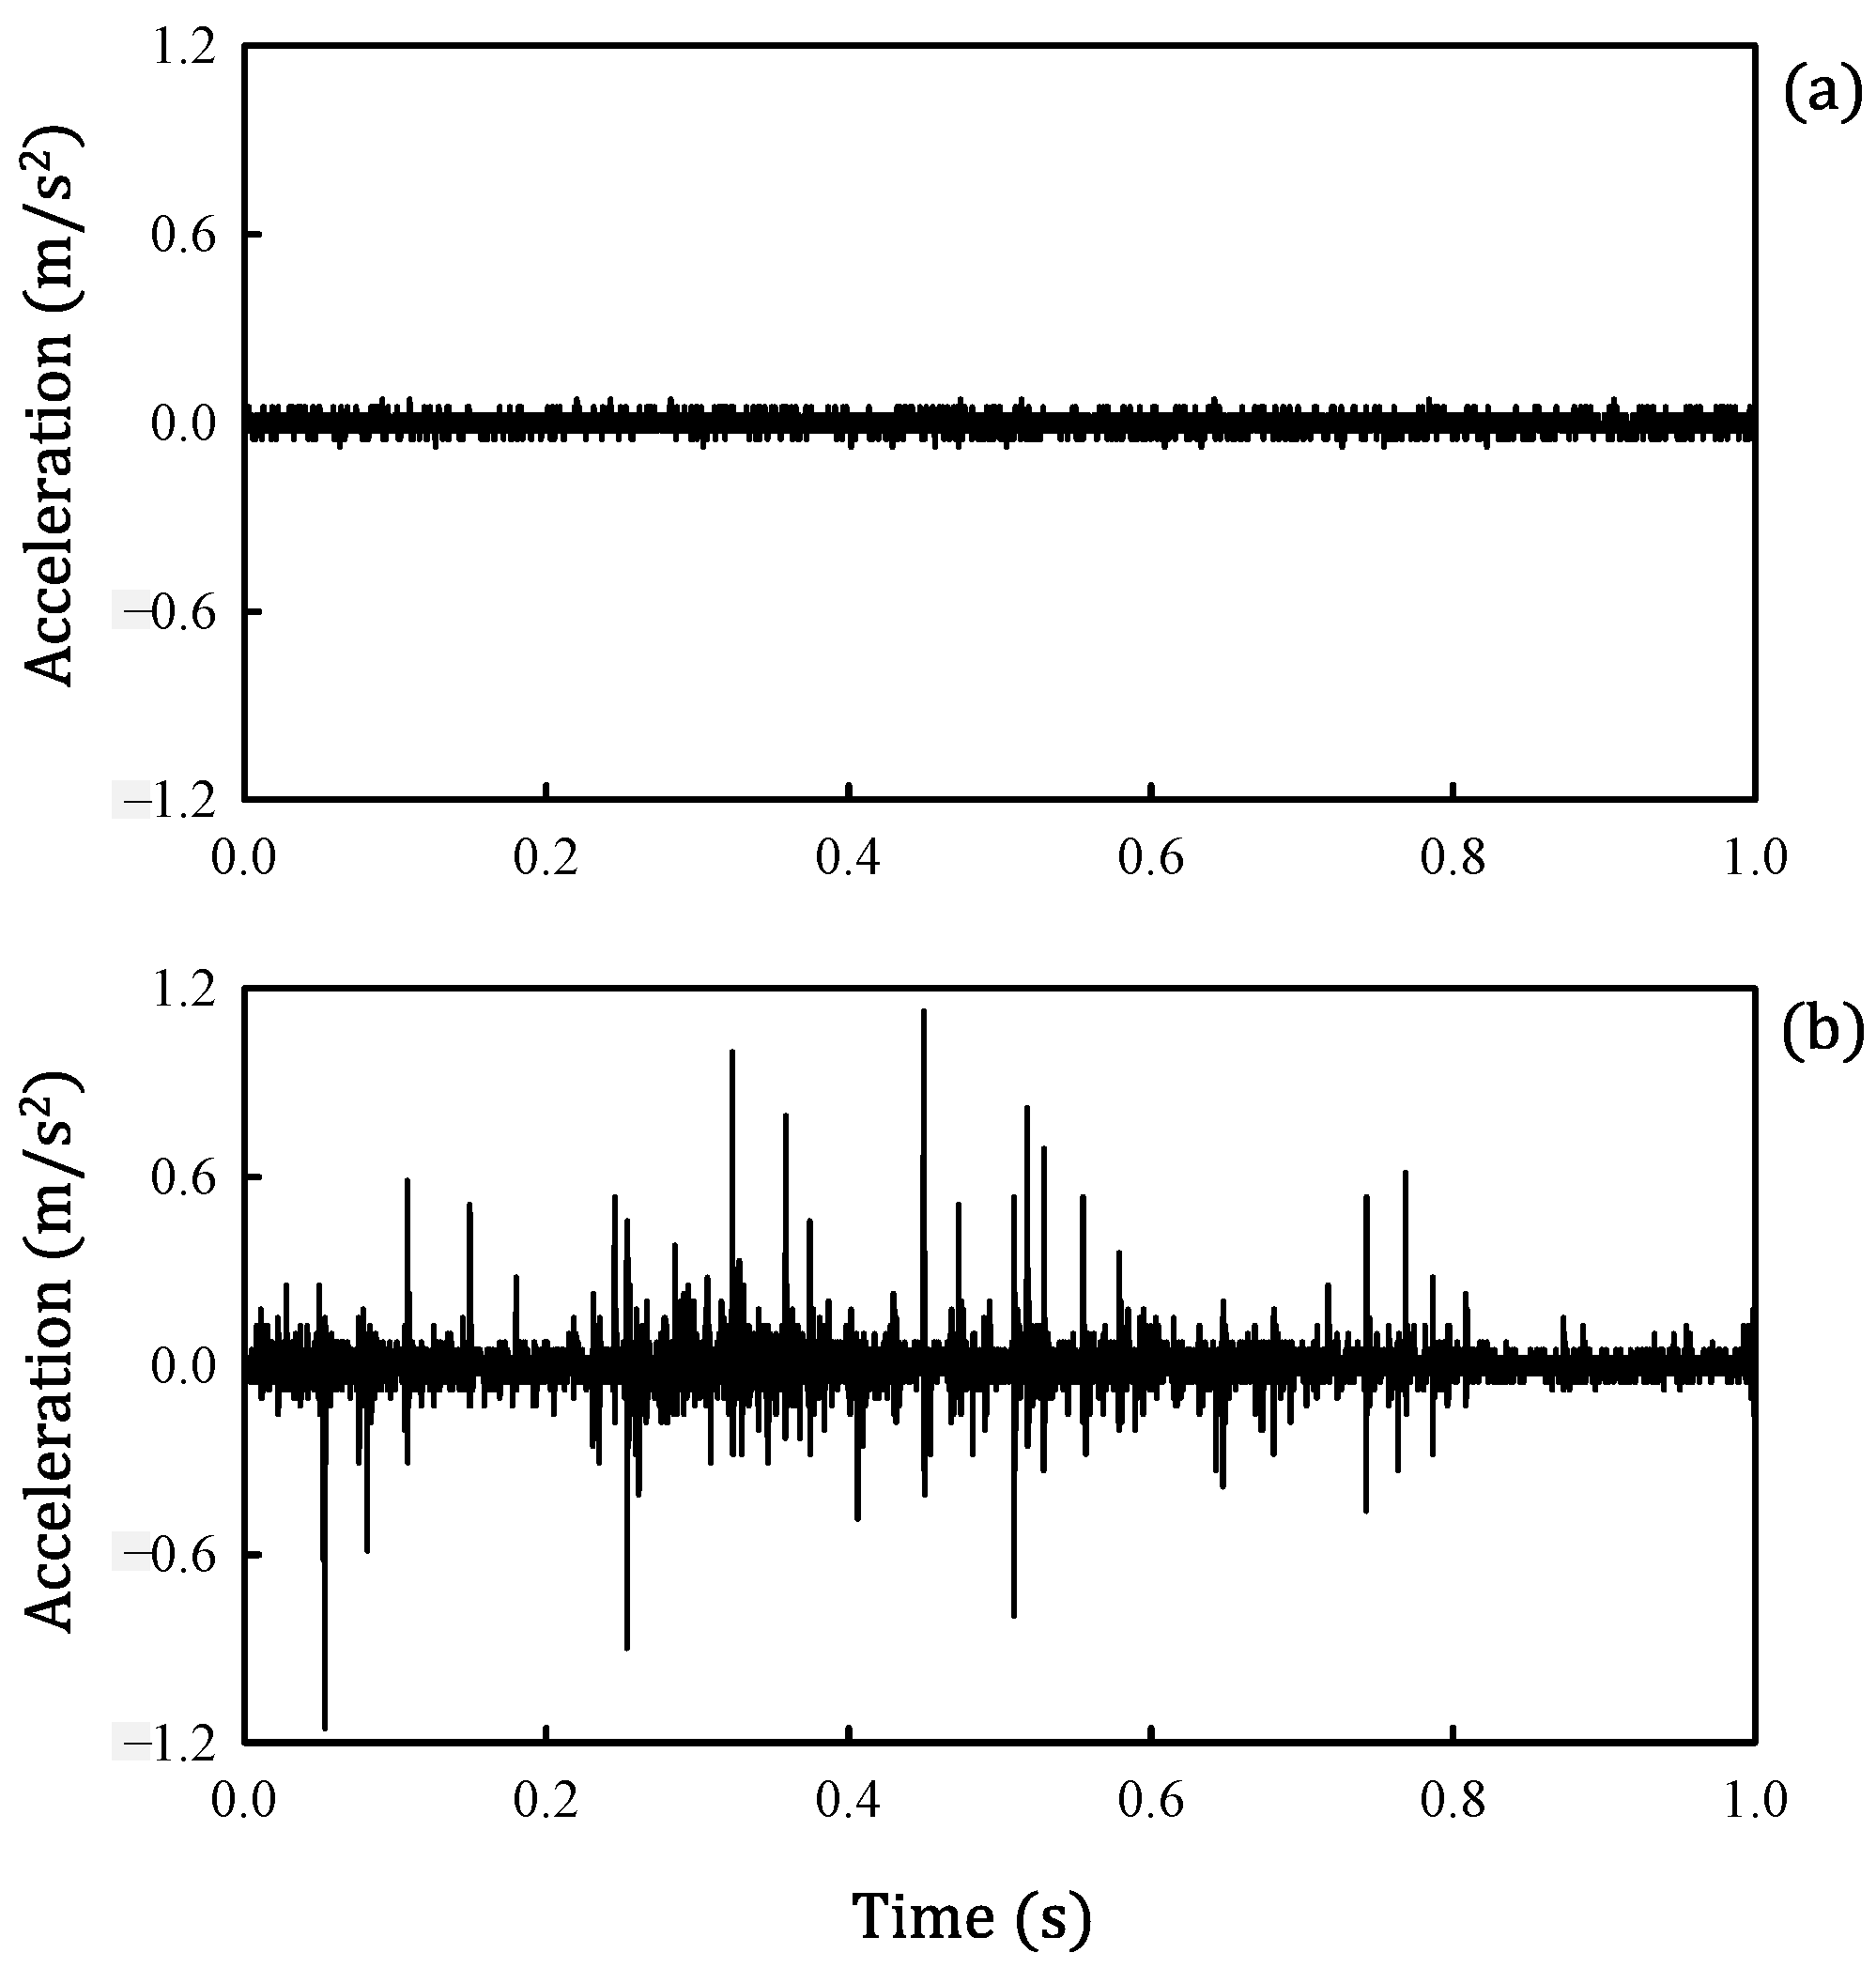
Noise and vibration measurements were conducted under two operating conditions: (1) without cavitation (85 °C, 20 L/min) and (2) with cavitation (75 °C, 35 L/min).
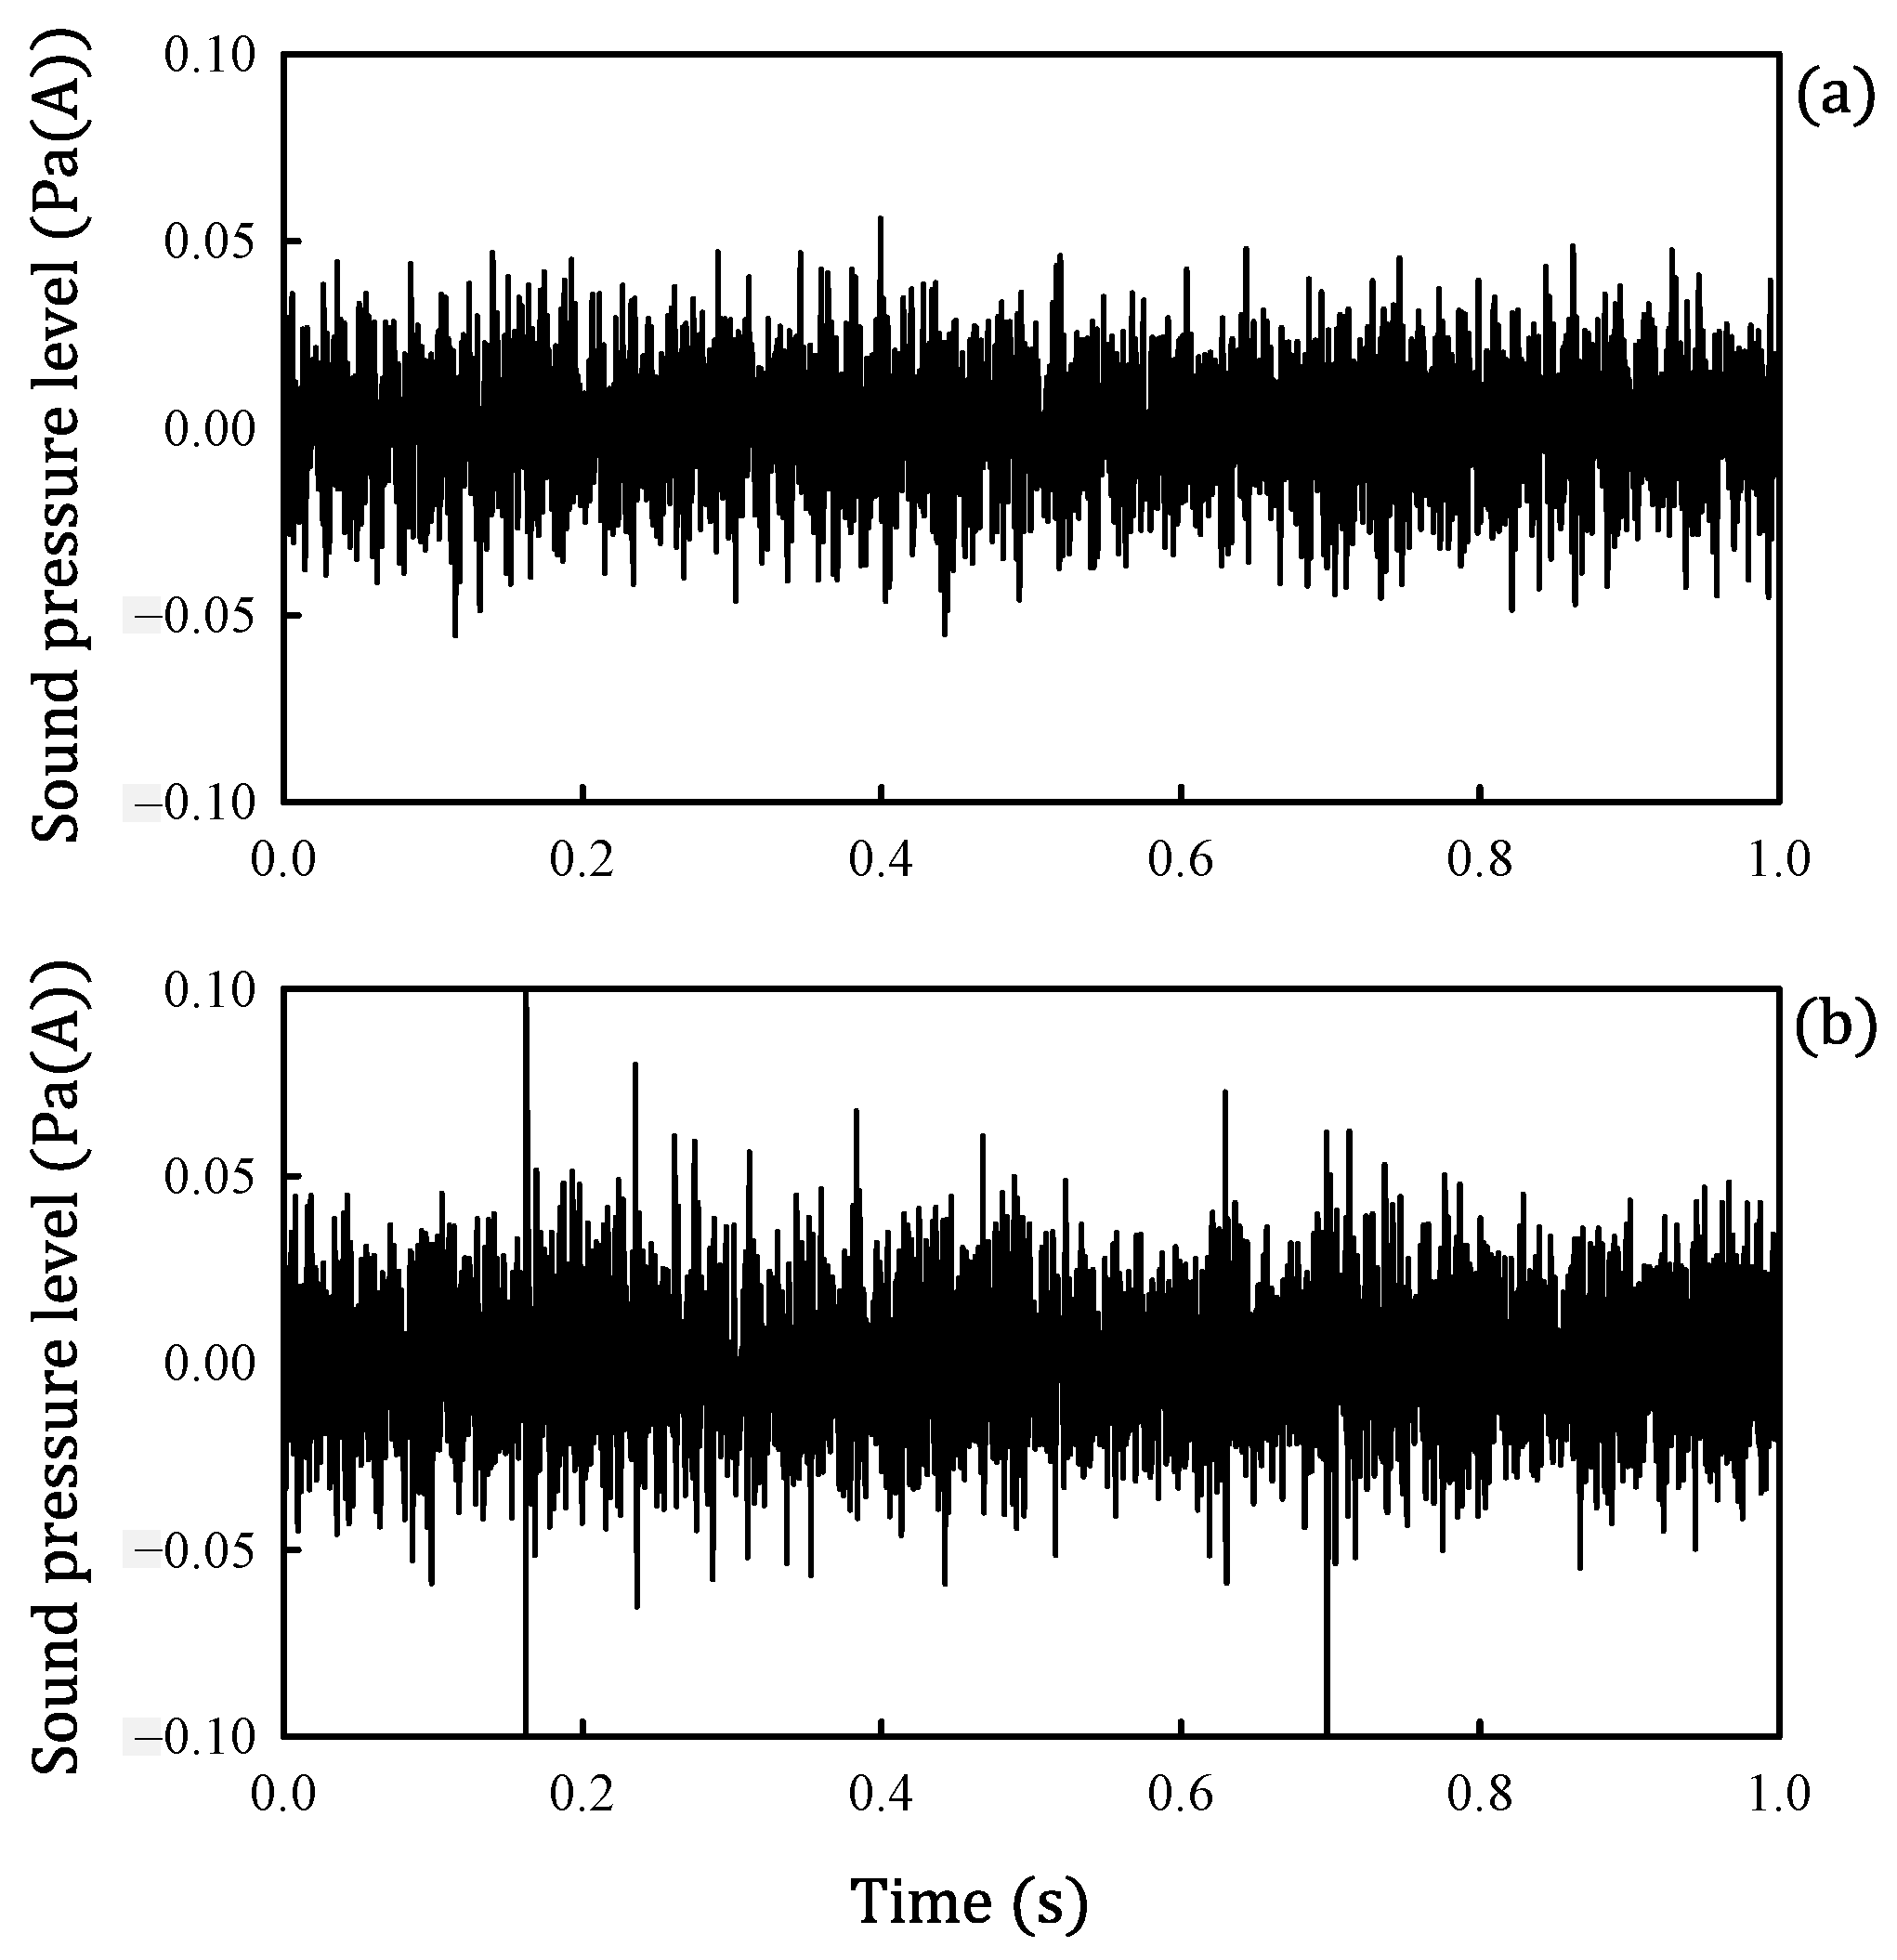
Figure 5 presents noise signals in the time domain, expressed in A-weighted sound pressure levels. The comparison between
Figure 5a,b indicates that noise levels are higher in the presence of cavitation. However, it should be noted that the difference in flow rate between the two cases may also influence the acoustic characteristics, and therefore, the specific contribution of cavitation to the noise cannot be completely isolated. This limitation is acknowledged in interpreting the results.
In contrast, vibration signals recorded using an accelerometer mounted on the upper tank of the heater core exhibit a more distinct difference between conditions. As shown in
Figure 6, the vibration amplitudes are significantly higher in the cavitation-present condition (
Figure 6b) due to cavitation-induced impacts on the inner wall of the upper tank. Moreover, high-peak impulses observed in the time-domain vibration signals suggest the presence of strong, transient forces, which are consistent with the collapse of cavitation bubbles rather than a mere increase in flow rate.
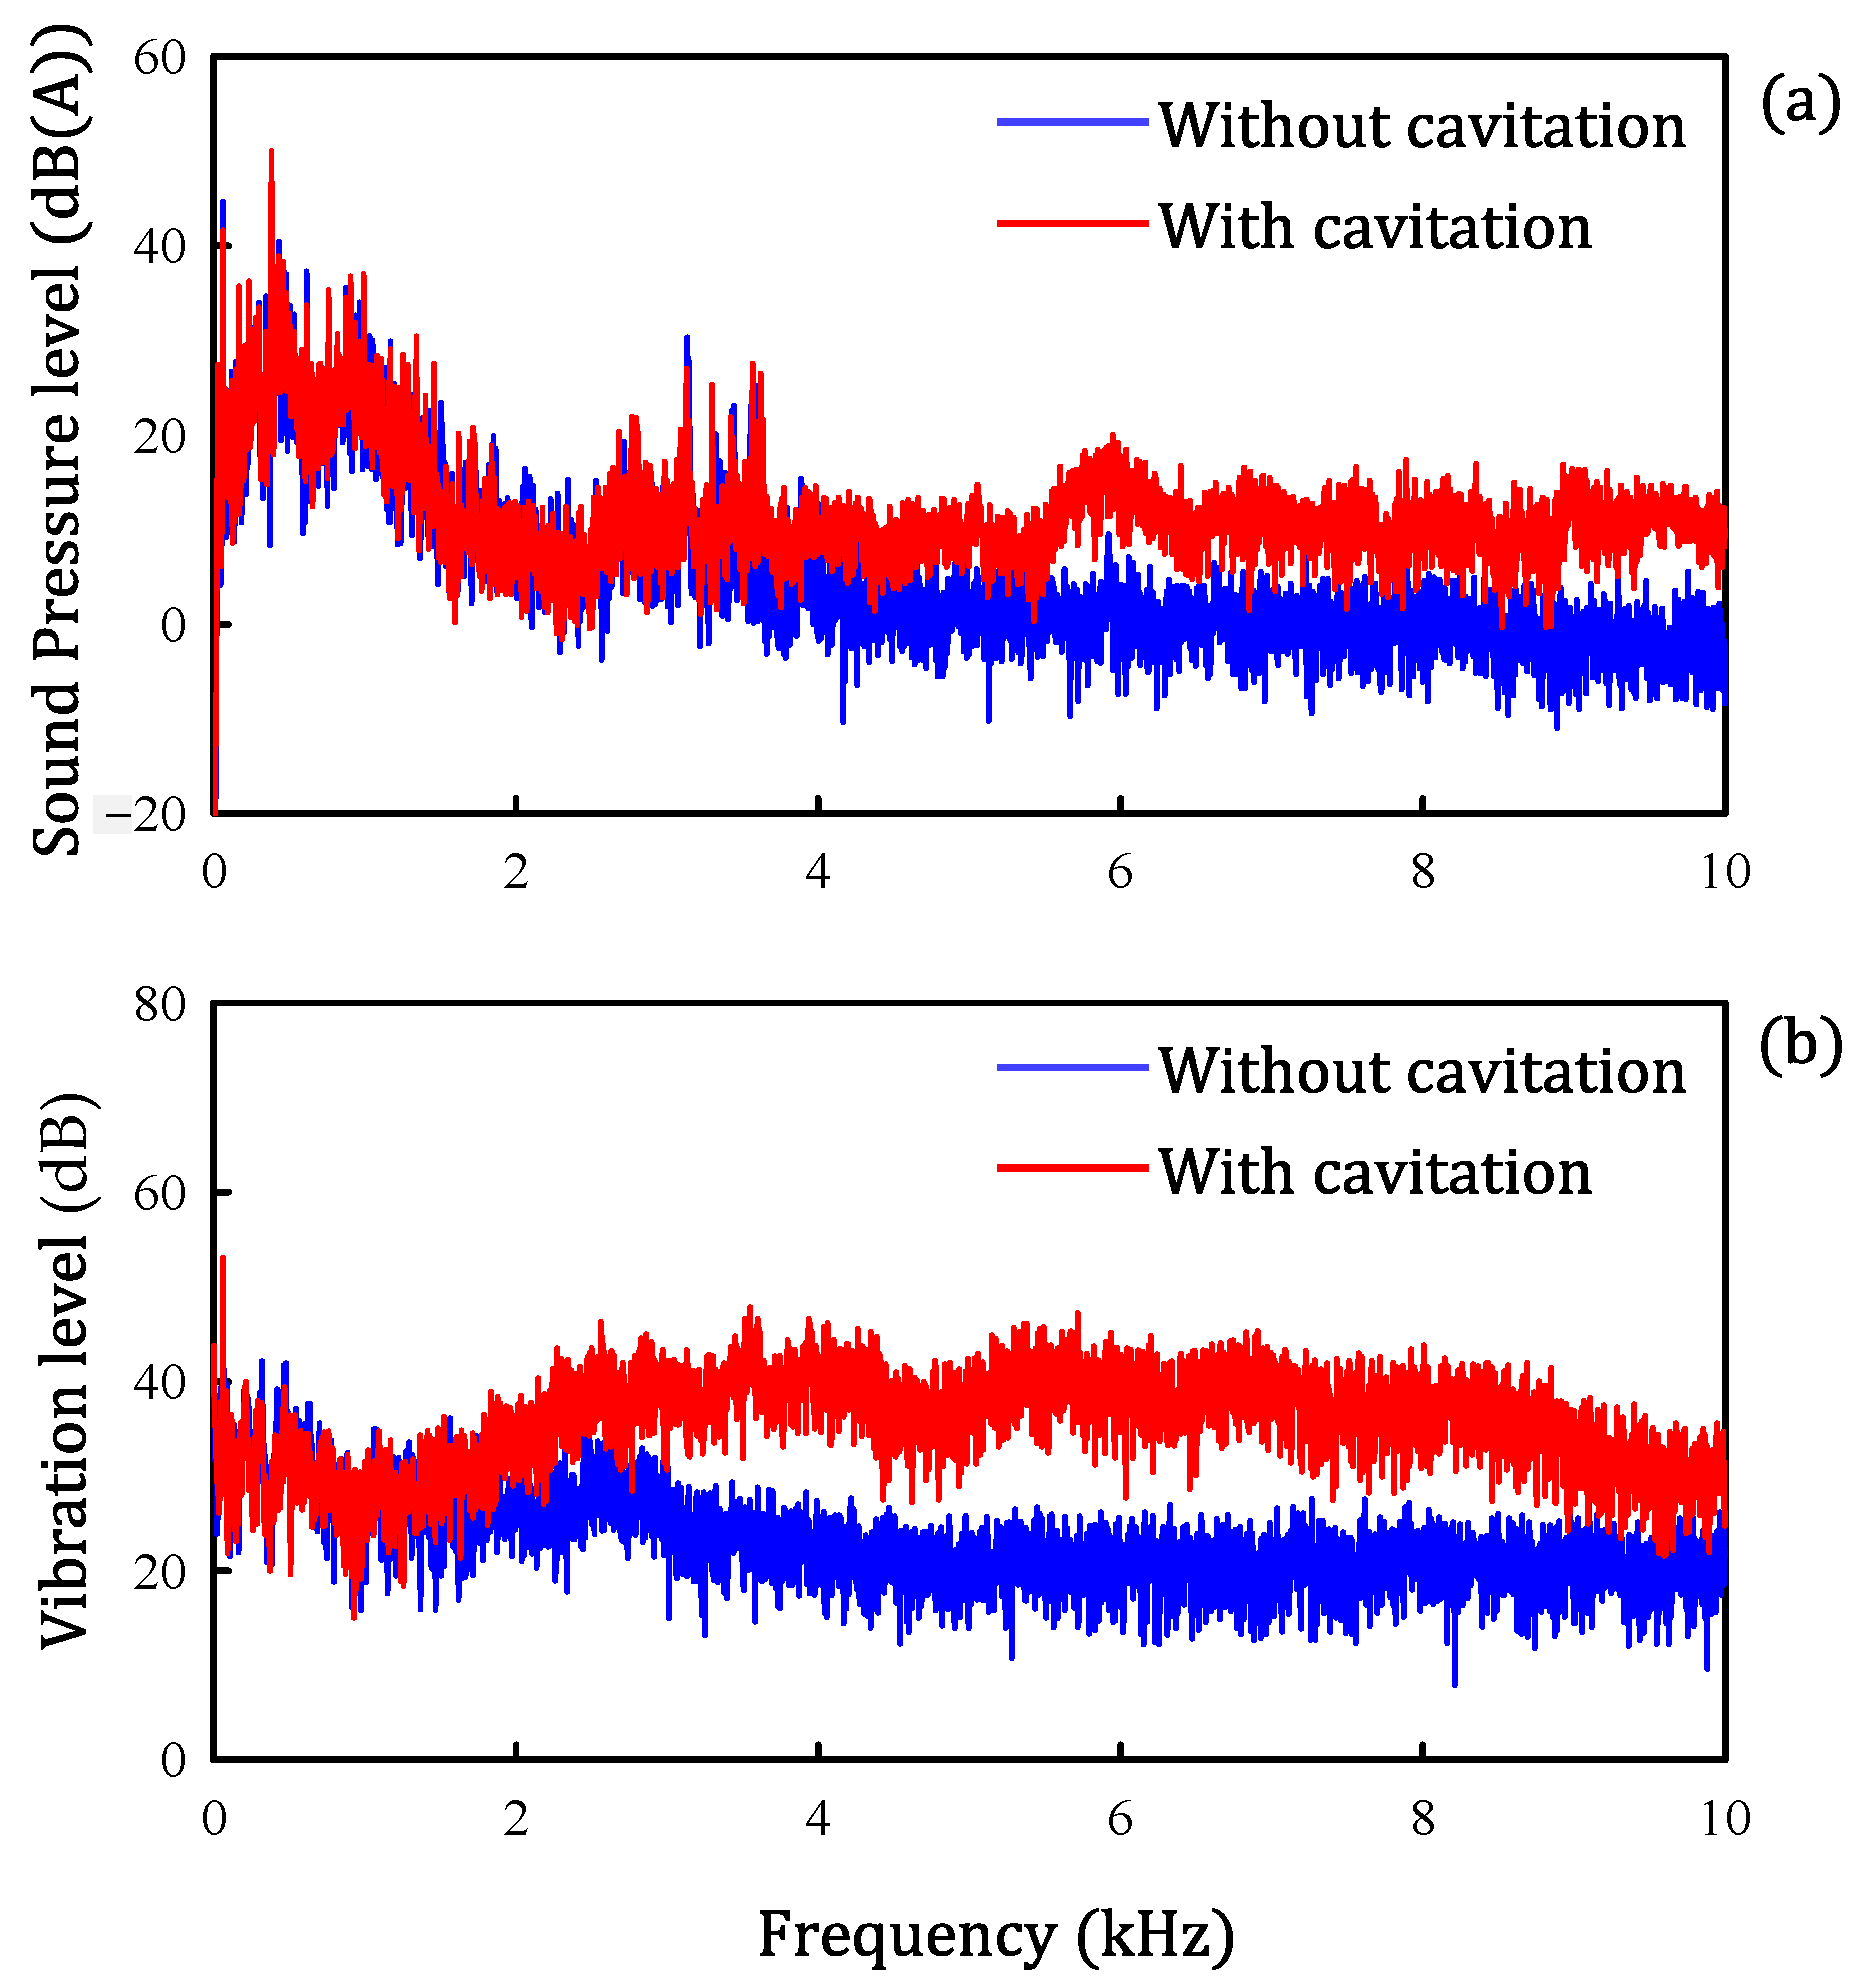
To further analyze the effects of cavitation, time-domain signals (
Figure 5 and
Figure 6) were transformed into frequency-domain spectra (
Figure 7). The noise spectrum (
Figure 7a) shows an increased amplitude above 2.5 kHz in the presence of cavitation, while the vibration spectrum (
Figure 7b) displays a marked rise in levels above 2 kHz. These high-frequency increases are attributed to the collapse of cavitation bubbles, which generate impulsive forces that impact the heater core walls. In addition, the occurrence of cavitation bubbles was visually confirmed through the transparent section of the outlet pipe, providing further evidence that the observed noise and vibration characteristics are attributable to cavitation.
The purpose of this controlled experimental setup is to investigate the fundamental characteristics of cavitation under systematically varied coolant conditions, allowing for repeatable and isolated analysis of its effects on noise and vibration. These findings provide a foundational understanding that complements the real-world observations presented in the subsequent section.
2.2. Measurement and Analysis in an Actual Vehicle
Noise and vibration measurements were carried out using an actual vehicle—a compact passenger car equipped with a 1.6 L, four-cylinder turbocharged engine. The coolant used was a 50/50 mixture of ethylene glycol and water. As described in the Introduction, cavitation noise generated by the heater core tends to occur when the engine operates at high speed under cold conditions. To replicate such conditions, the test was conducted in a cooling chamber maintained at −10 °C, ensuring that the coolant temperature was initially 1 °C. The engine was then started and gradually accelerated to 5000 RPM over a five-second period. Once this speed was reached, it was held constant while noise and vibration data were recorded. The engine speed was specifically maintained at 5000 RPM because cavitation noise does not occur at lower speeds, such as 4000 RPM.
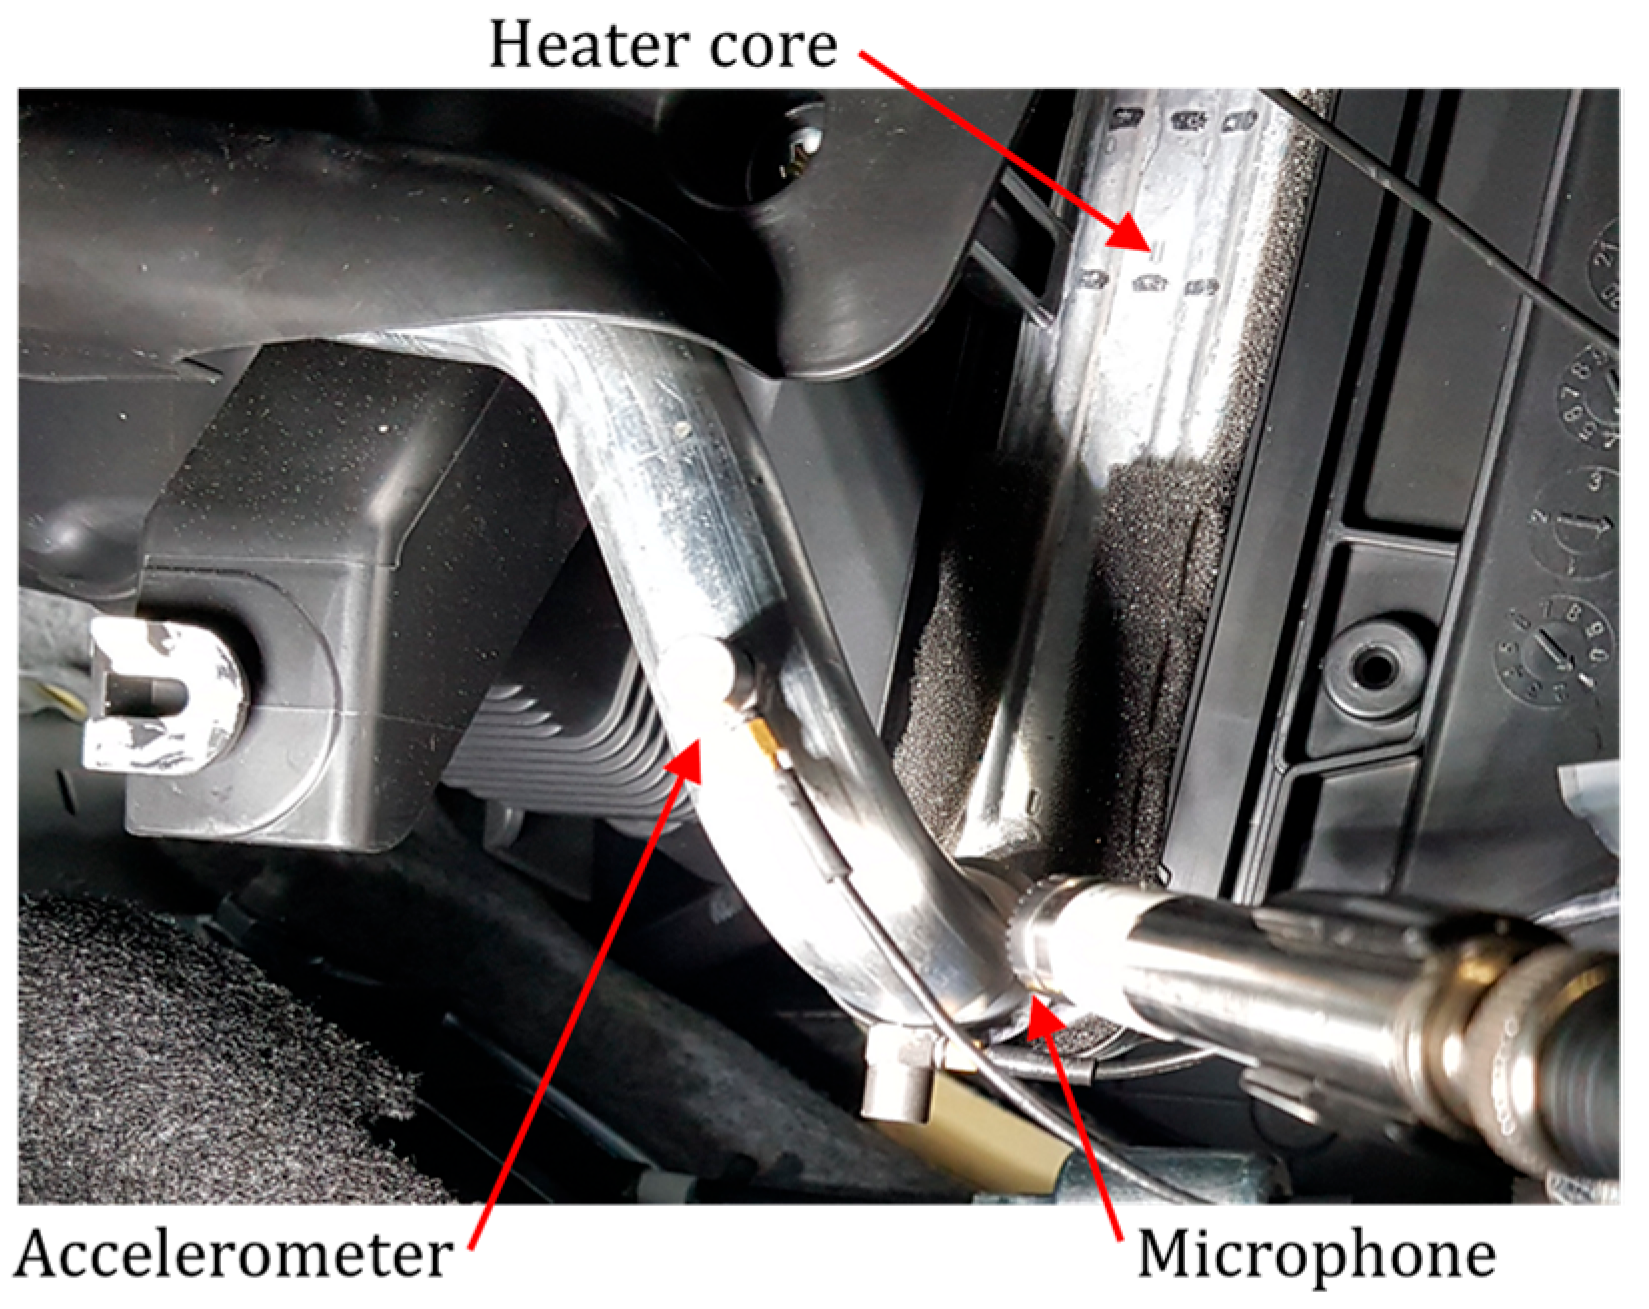
For experimental accessibility, a section of the bulkhead and heater core pipe cover was removed, as illustrated in
Figure 8. A microphone was positioned 1 cm from its side surface to capture noise, while an accelerometer was mounted on the heater core pipe to measure vibrations. The acquired signals were analyzed using a spectrum analyzer to extract dynamic response and frequency spectra.
To ensure the reliability of the measured noise and vibration signals and minimize mutual interference between different sources, several precautions were taken during data collection and preprocessing. Prior to the main experiments, a preliminary frequency analysis was performed to identify the characteristic frequency ranges of various sources such as the engine, coolant pump, and fan. Based on these findings, the analysis of cavitation effects focused on signals above 2 kHz, a range in which the influence of cavitation is more pronounced and interference from other sources is relatively limited.
To further minimize mechanical cross-talk, microphones (PCB 378B02, PCB Piezotronics, Depew, NY, USA) and accelerometers (B&K 4383, Brüel & Kjær, Nærum, Denmark) were mounted on structurally isolated locations, preventing direct mechanical coupling between the acoustic and vibration sensing elements. The microphones used had a frequency response of 3.15 Hz to 20 kHz with an accuracy of ±1 dB, while the accelerometers operated within a range of 1 Hz to 16 kHz with an accuracy of ±5%.
All signals were simultaneously recorded using a B&K 3050-B-060 spectrum analyzer (Brüel & Kjær, Nærum, Denmark), which supports up to six input channels with a frequency range extending from DC to 51.2 kHz. The analyzer accepts both CCLD (IEPE) and voltage input types and supports high-fidelity data transfer and synchronization via LAN with Power over Ethernet (PoE). The front panel (UA-2100-060, NF Corporation, Yokohama, Japan) provided six BNC input connectors for convenient sensor connection, and the system was operated in conjunction with BK Connect® (Brüel & Kjær, Nærum, Denmark) and PULSE™ LabShop software 25.1 (Brüel & Kjær, Nærum, Denmark) for data acquisition and post-processing. These configurations and methodologies ensured high-precision measurement of cavitation-induced signals while minimizing interference from unrelated noise and vibration sources.
Experimental results indicated that an abnormal noise, resembling gravel or sand passing through a pipe, persisted for approximately 30 s after reaching 5000 RPM before dissipating.
Figure 9 compares noise signals under cavitation-free (
Figure 9a) and cavitation-present (
Figure 9b) conditions, revealing higher sound pressure levels in the presence of cavitation. Similarly, vibration signals, as shown in
Figure 10, exhibit increased magnitudes with cavitation, characterized by impulse-type signals absent in non-cavitating conditions. These impulses are likely caused by the collapse of cavitation bubbles impacting the heater core walls.
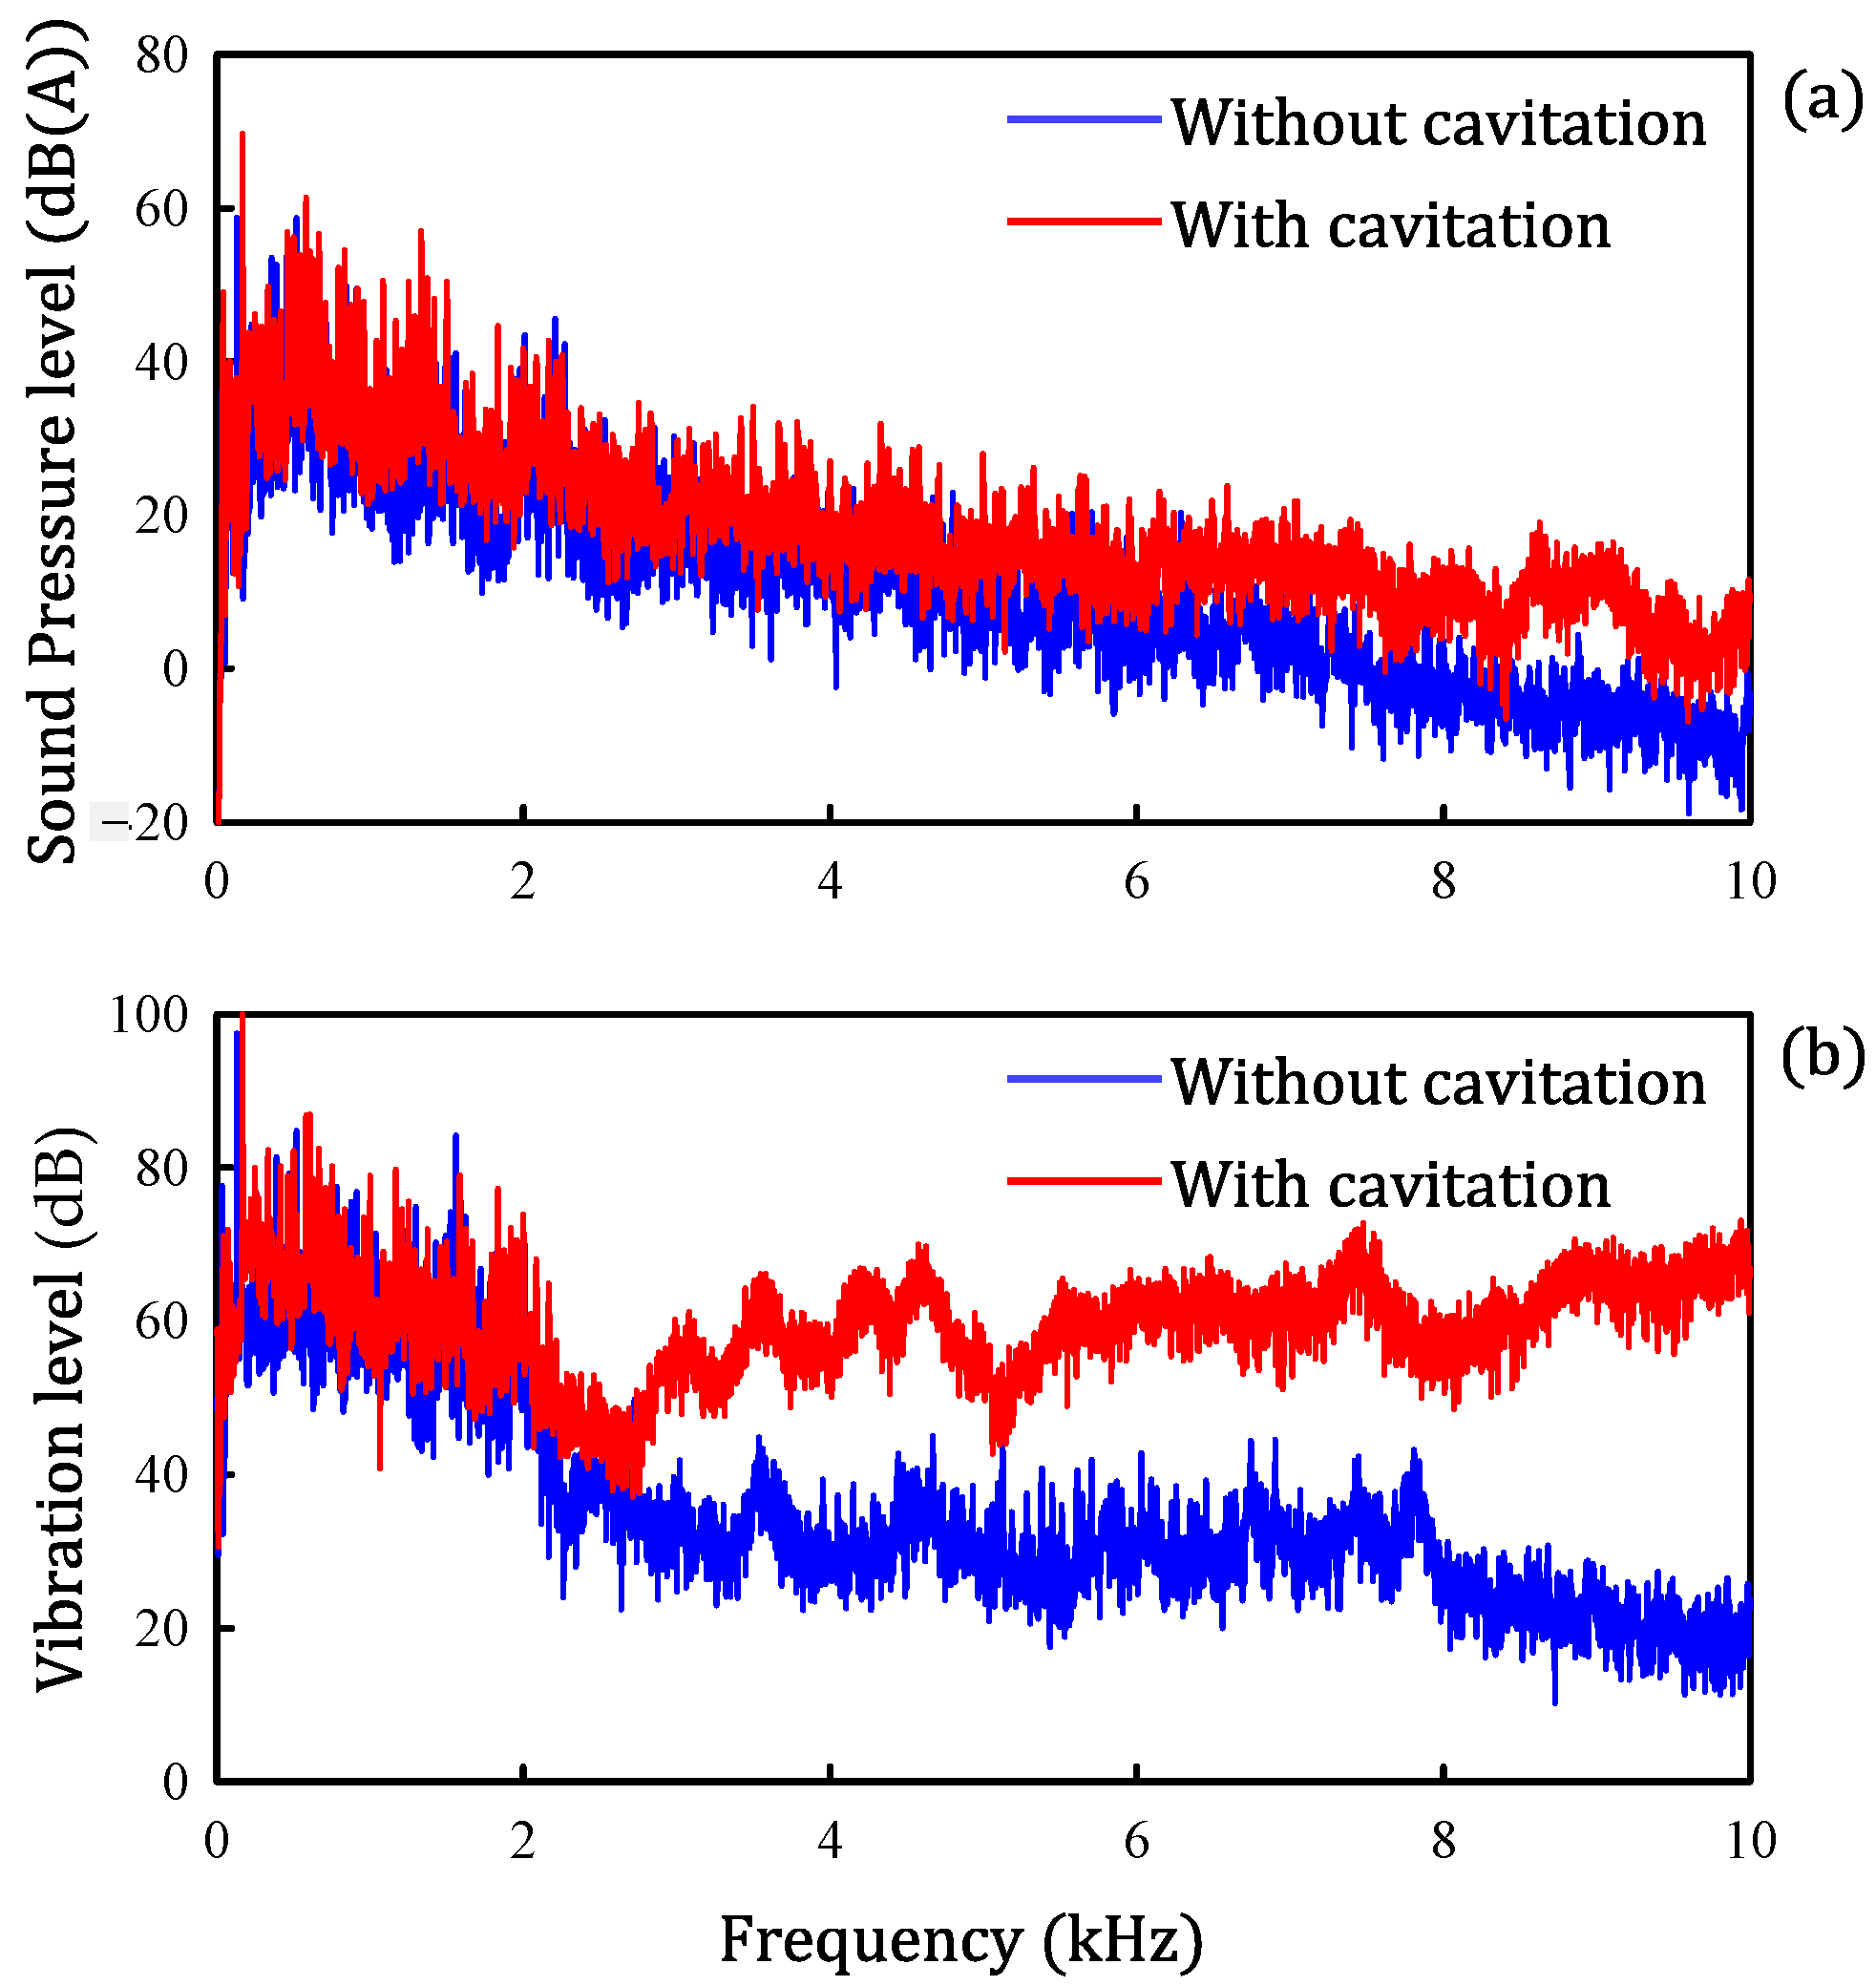
Frequency spectra further illustrate these effects, as presented in
Figure 11. The noise spectrum (
Figure 11a) exhibits increased levels above 5 kHz under cavitation conditions, while low-frequency noise remains dominated by engine-generated sounds. Additionally, due to the removal of a portion of the engine compartment partition, engine noise propagates into the cabin, contributing to increased low-frequency noise levels. The vibration spectrum (
Figure 11b) demonstrates significantly higher amplitudes above 2 kHz in the presence of cavitation, with vibration signals showing a clearer distinction between conditions compared to noise signals.
The cavitation phenomenon, characterized by bubble collapse near the heater core walls, manifests as impulse signals in time-domain vibration data, resulting in broadband characteristics in frequency spectra. These findings confirm that cavitation significantly influences heater core noise and vibration, particularly under high-speed, cold-engine conditions.
3. Identification of the Cavitation Noise Generation Mechanism
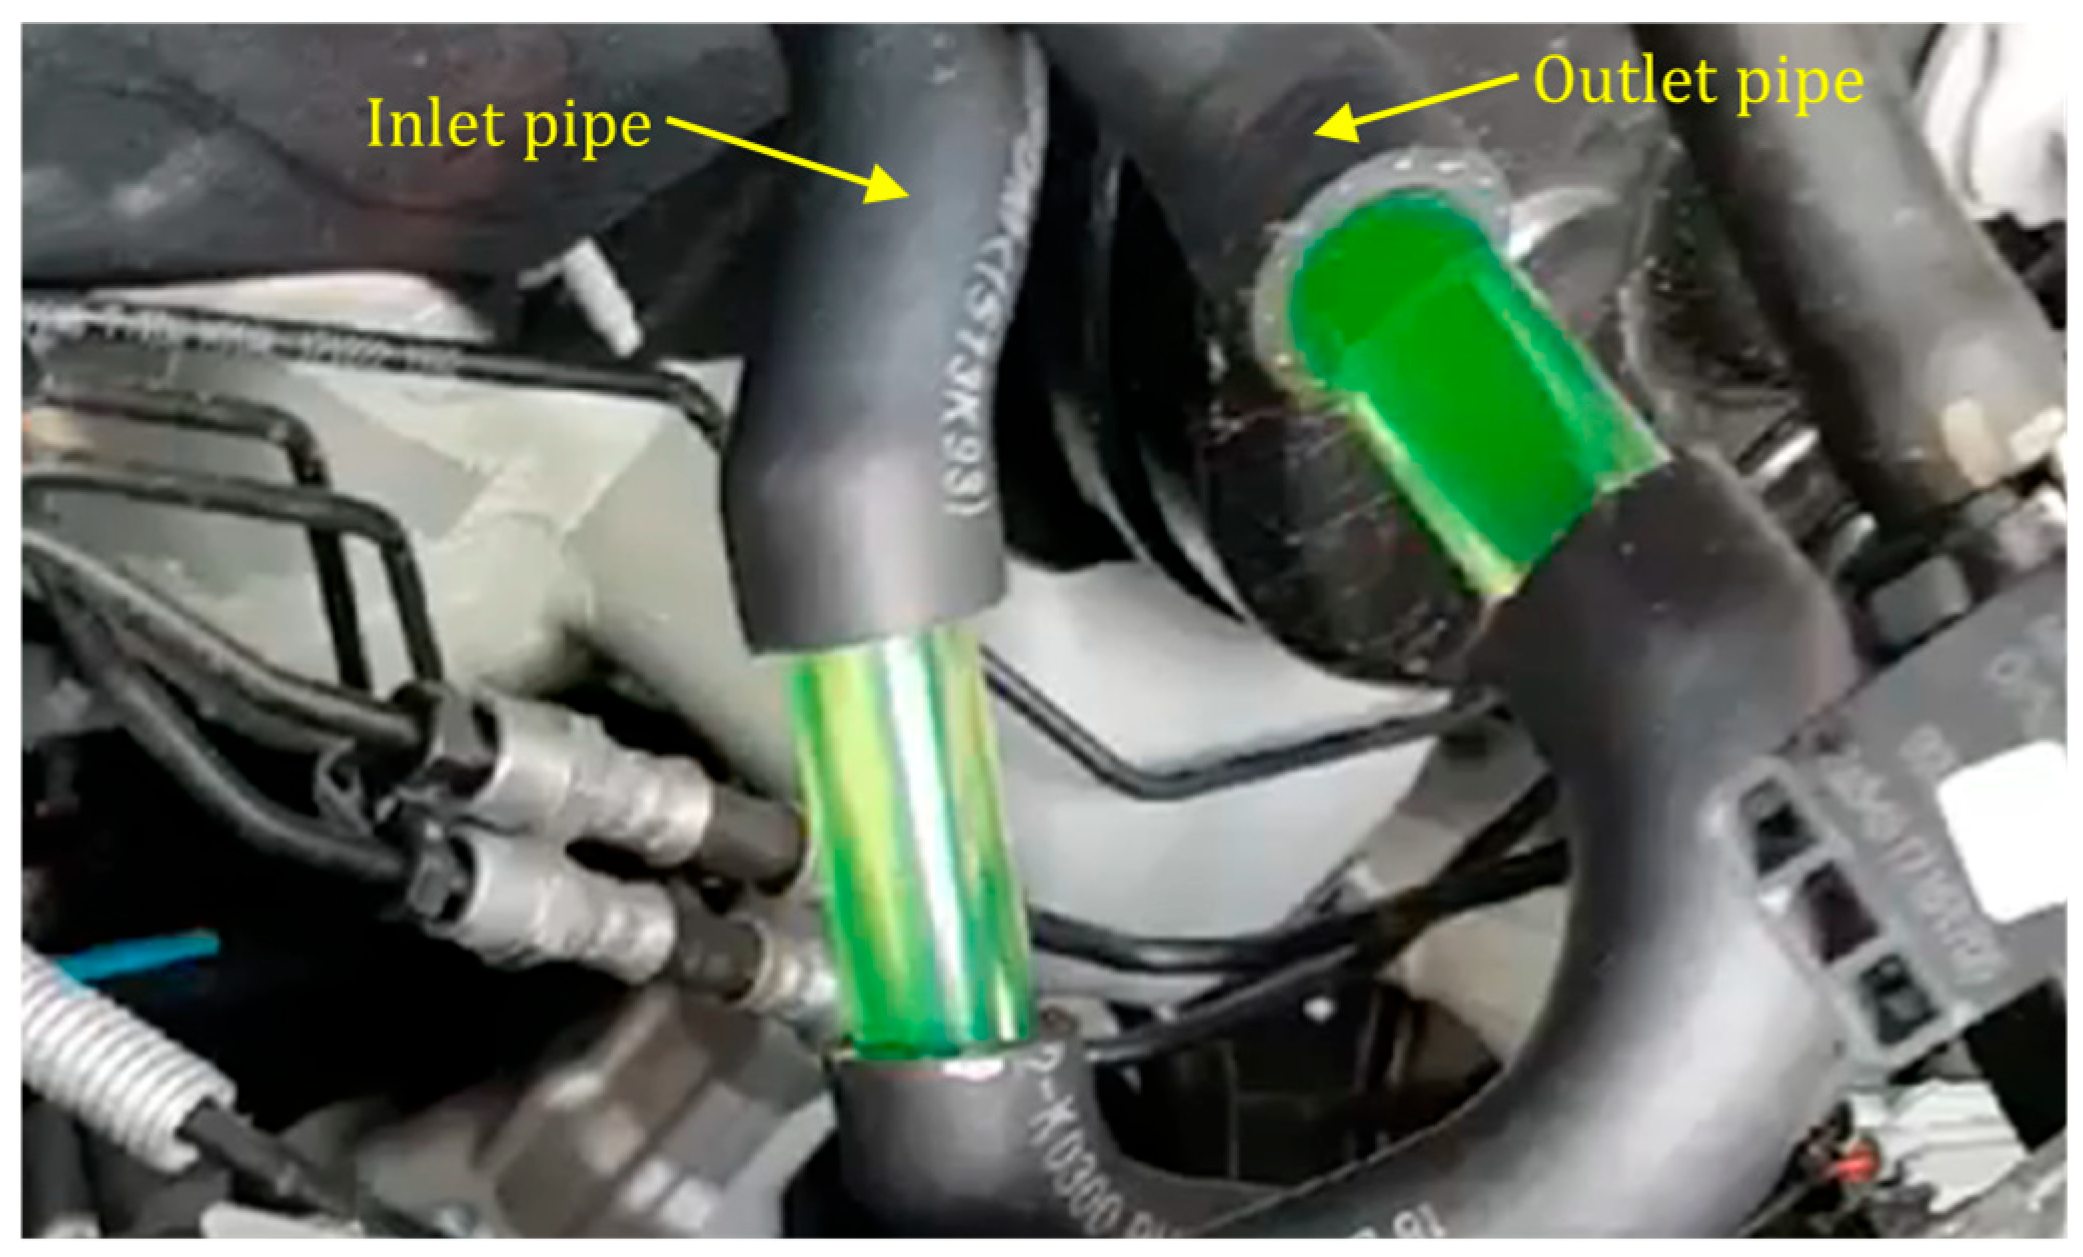
To determine whether cavitation occurs in the heater core or the water pump, transparent tubes were installed in the inlet and outlet pipes of the compact passenger car, as shown in
Figure 12, to observe the presence of cavitation-induced bubbles. If the bubbles are observed in the transparent tube of the inlet pipe, it strongly suggests that cavitation originates in the water pump. Conversely, if bubbles are absent in the inlet pipe but appear in the transparent tube of the outlet pipe, it confirms that cavitation occurs in the heater core.
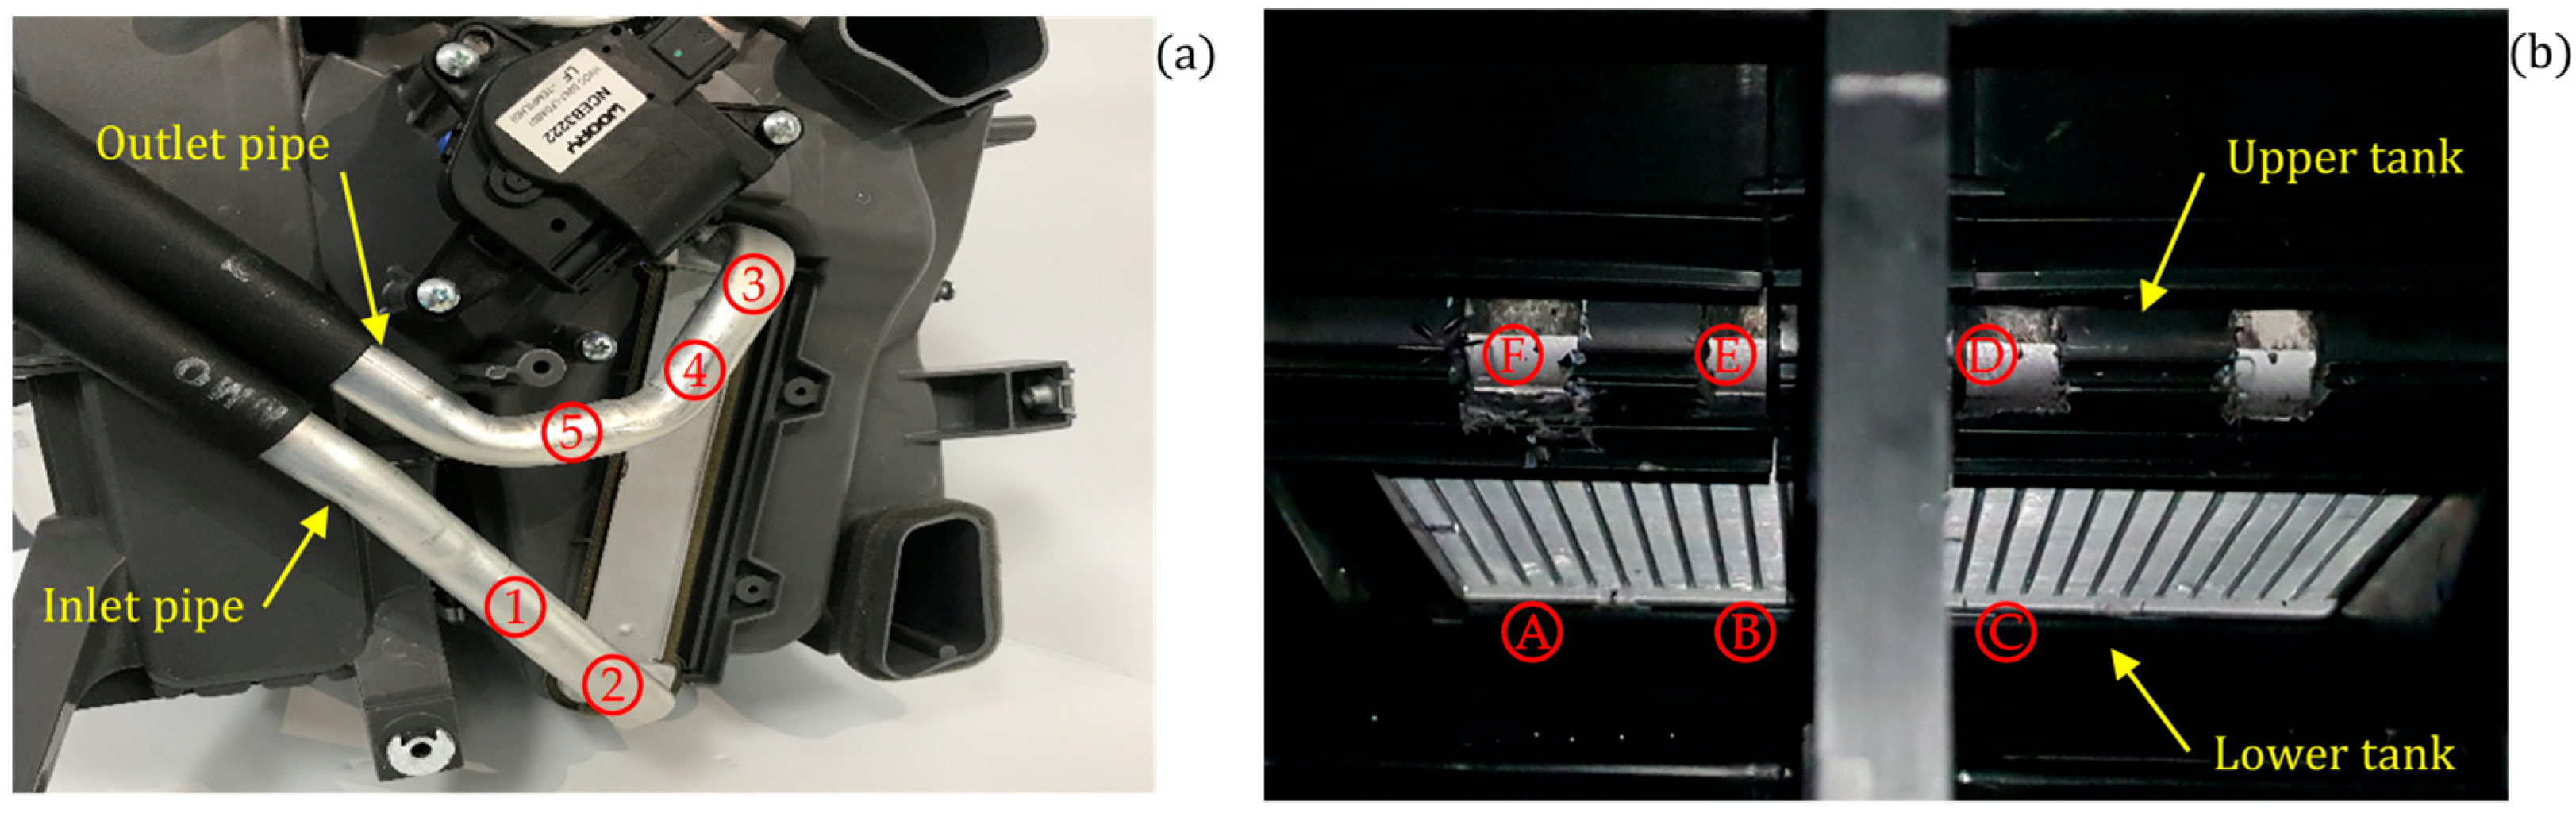
Vibration signals were measured at an initial coolant temperature of 1 °C and at two engine speeds: 4000 and 5000 RPM. As shown in
Figure 13, accelerometers were attached at five points on the inlet and outlet pipes of the heater core and six points on the upper and lower tanks. These sensors were used to measure vibration signals to identify the locations where bubbles collapse due to cavitation. To attach the accelerometers to the heater core tank surfaces, some sections of the HVAC system were removed to expose the heater core. In addition to measuring the pressures in the inlet and outlet pipes, pressure gauges were also installed at the ends of these pipes, and a flow meter was also installed to measure the flow rate.
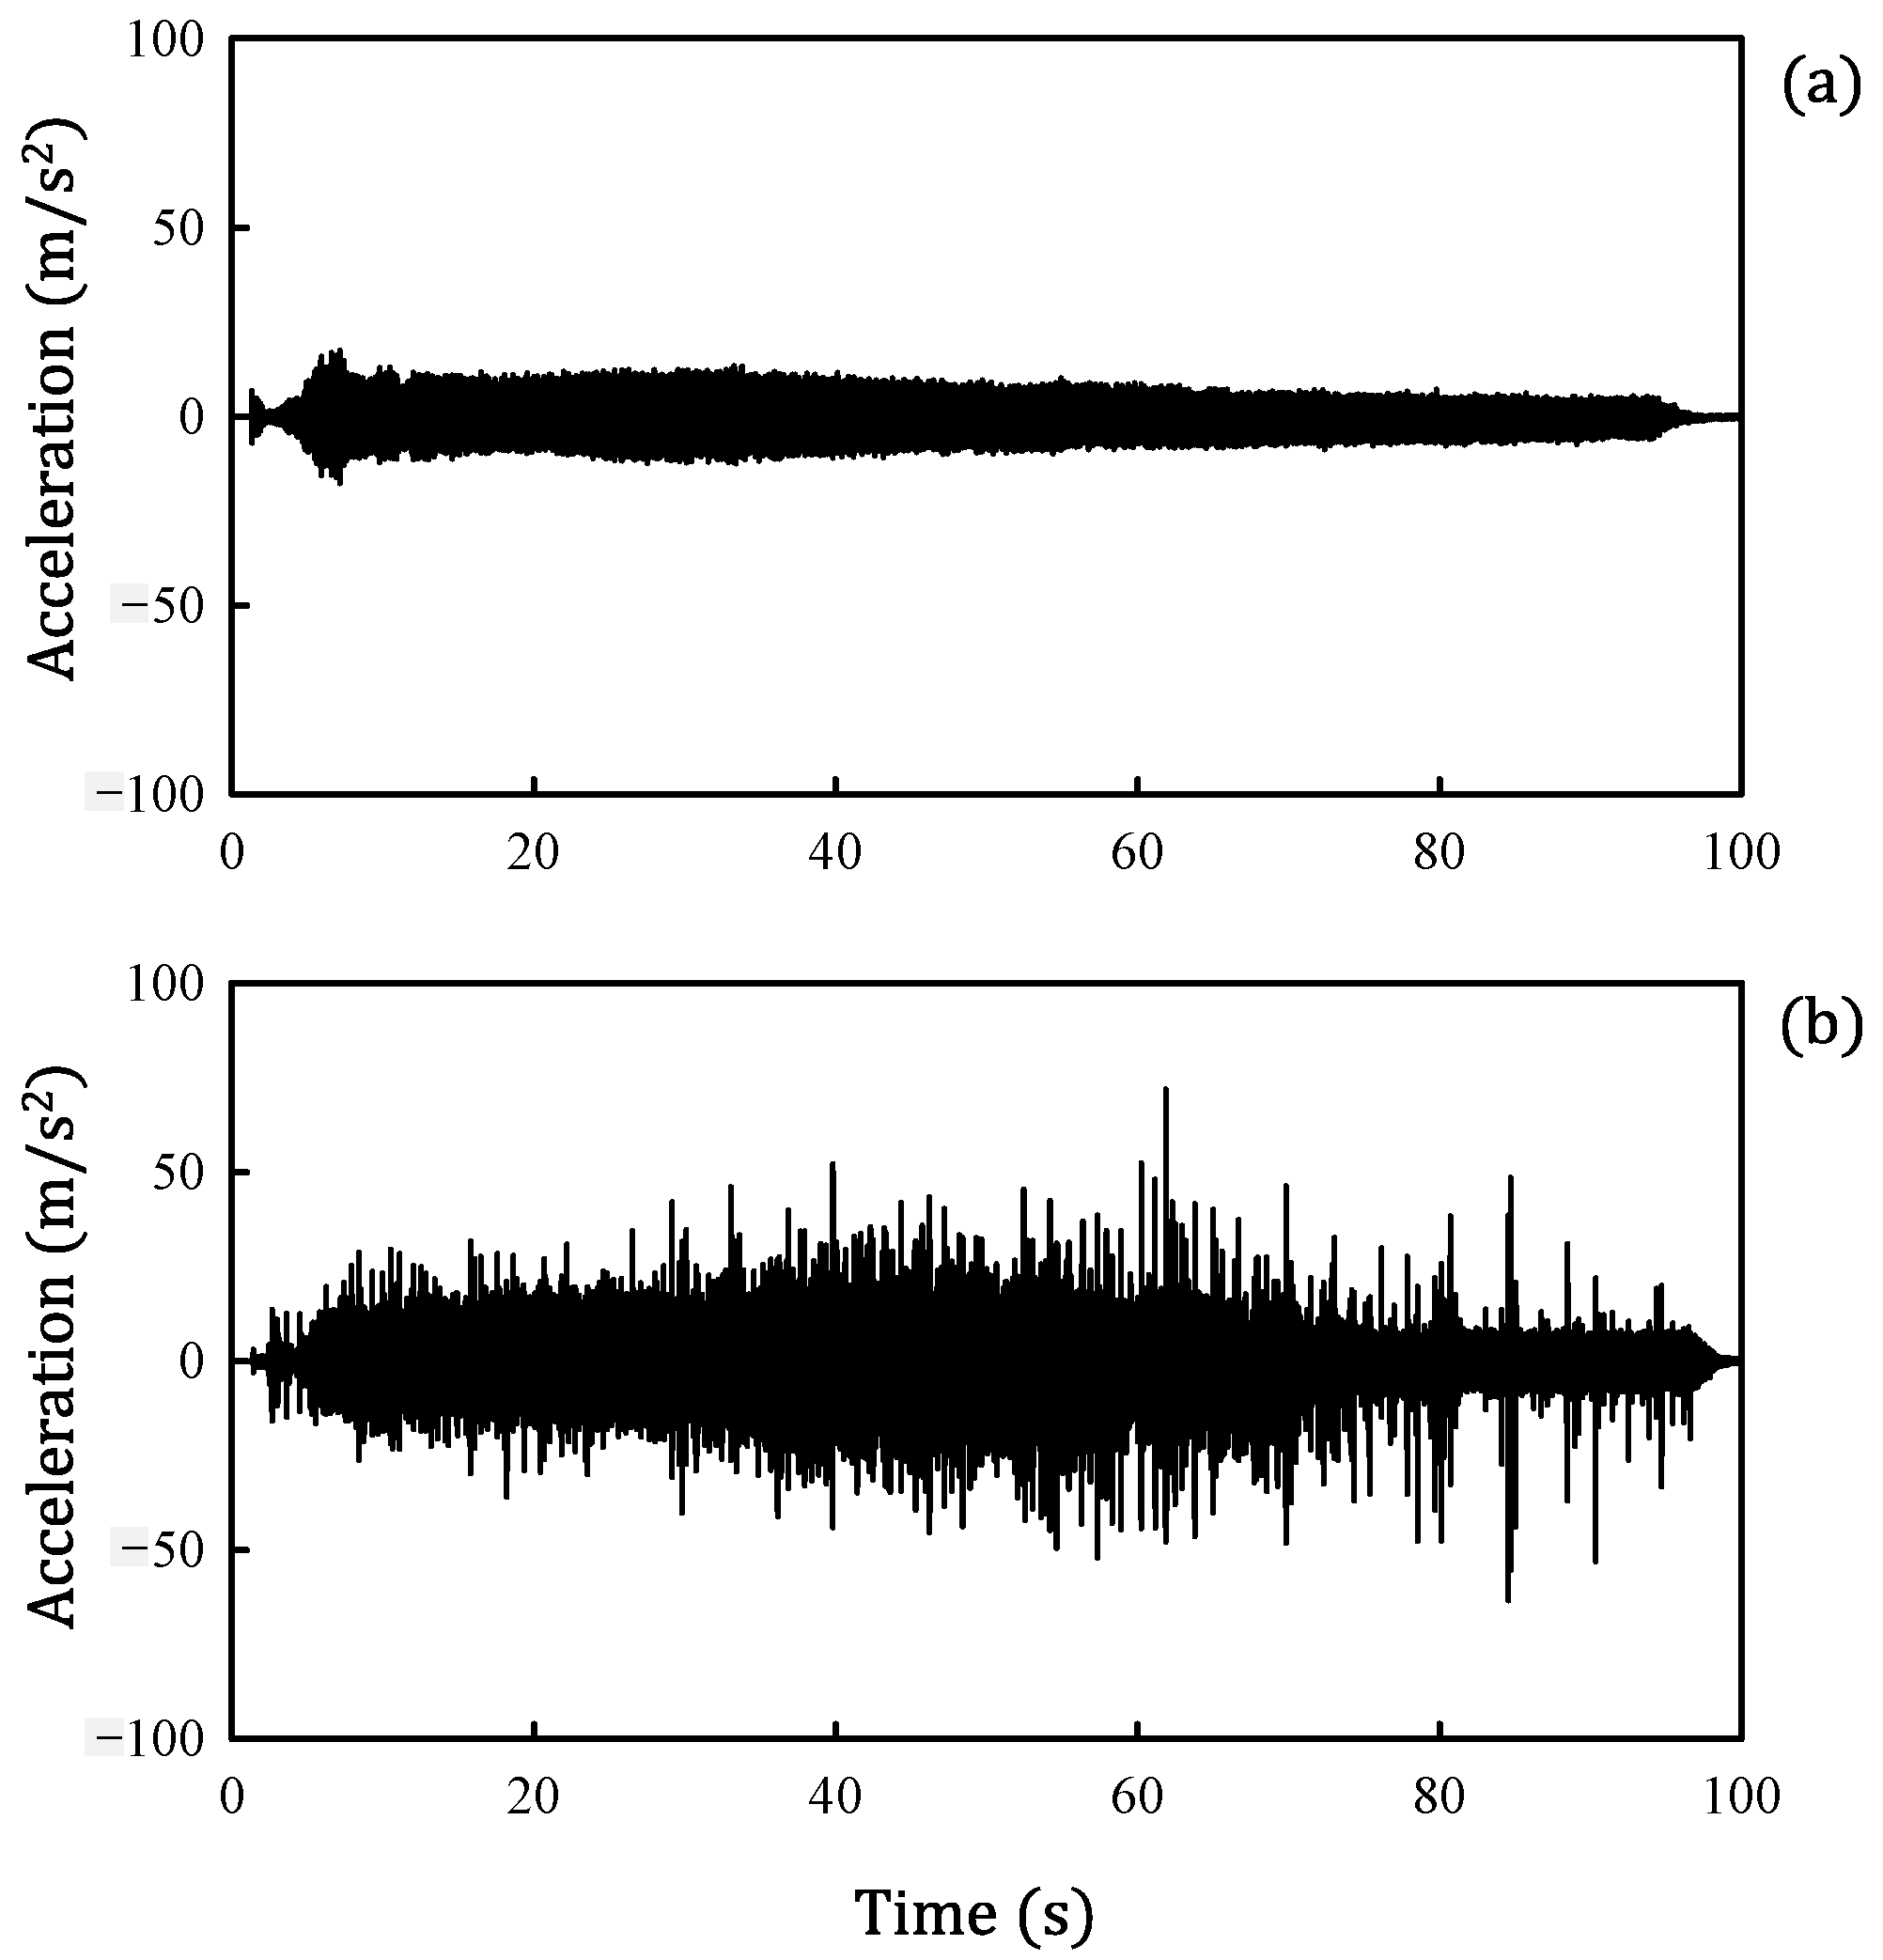
Experimental results indicate that at an engine speed of 4000 RPM, no cavitation-induced bubbles were observed in either the inlet or outlet pipes. However, at 5000 RPM, bubbles were absent in the inlet pipe but were detected in the outlet pipe, confirming that cavitation occurs in the heater core. The vibration signals measured at point F on the upper tank of the heater core are shown in
Figure 14.
Figure 14a presents the vibration signal at 4000 RPM without cavitation, while
Figure 14b shows the signal at 5000 RPM with cavitation. As seen in these figures, the vibration magnitude during cavitation is higher than that in non-cavitation conditions. Furthermore, in the presence of cavitation, the vibration signals exhibit impacts caused by bubble collapse against the inner walls of the tank.
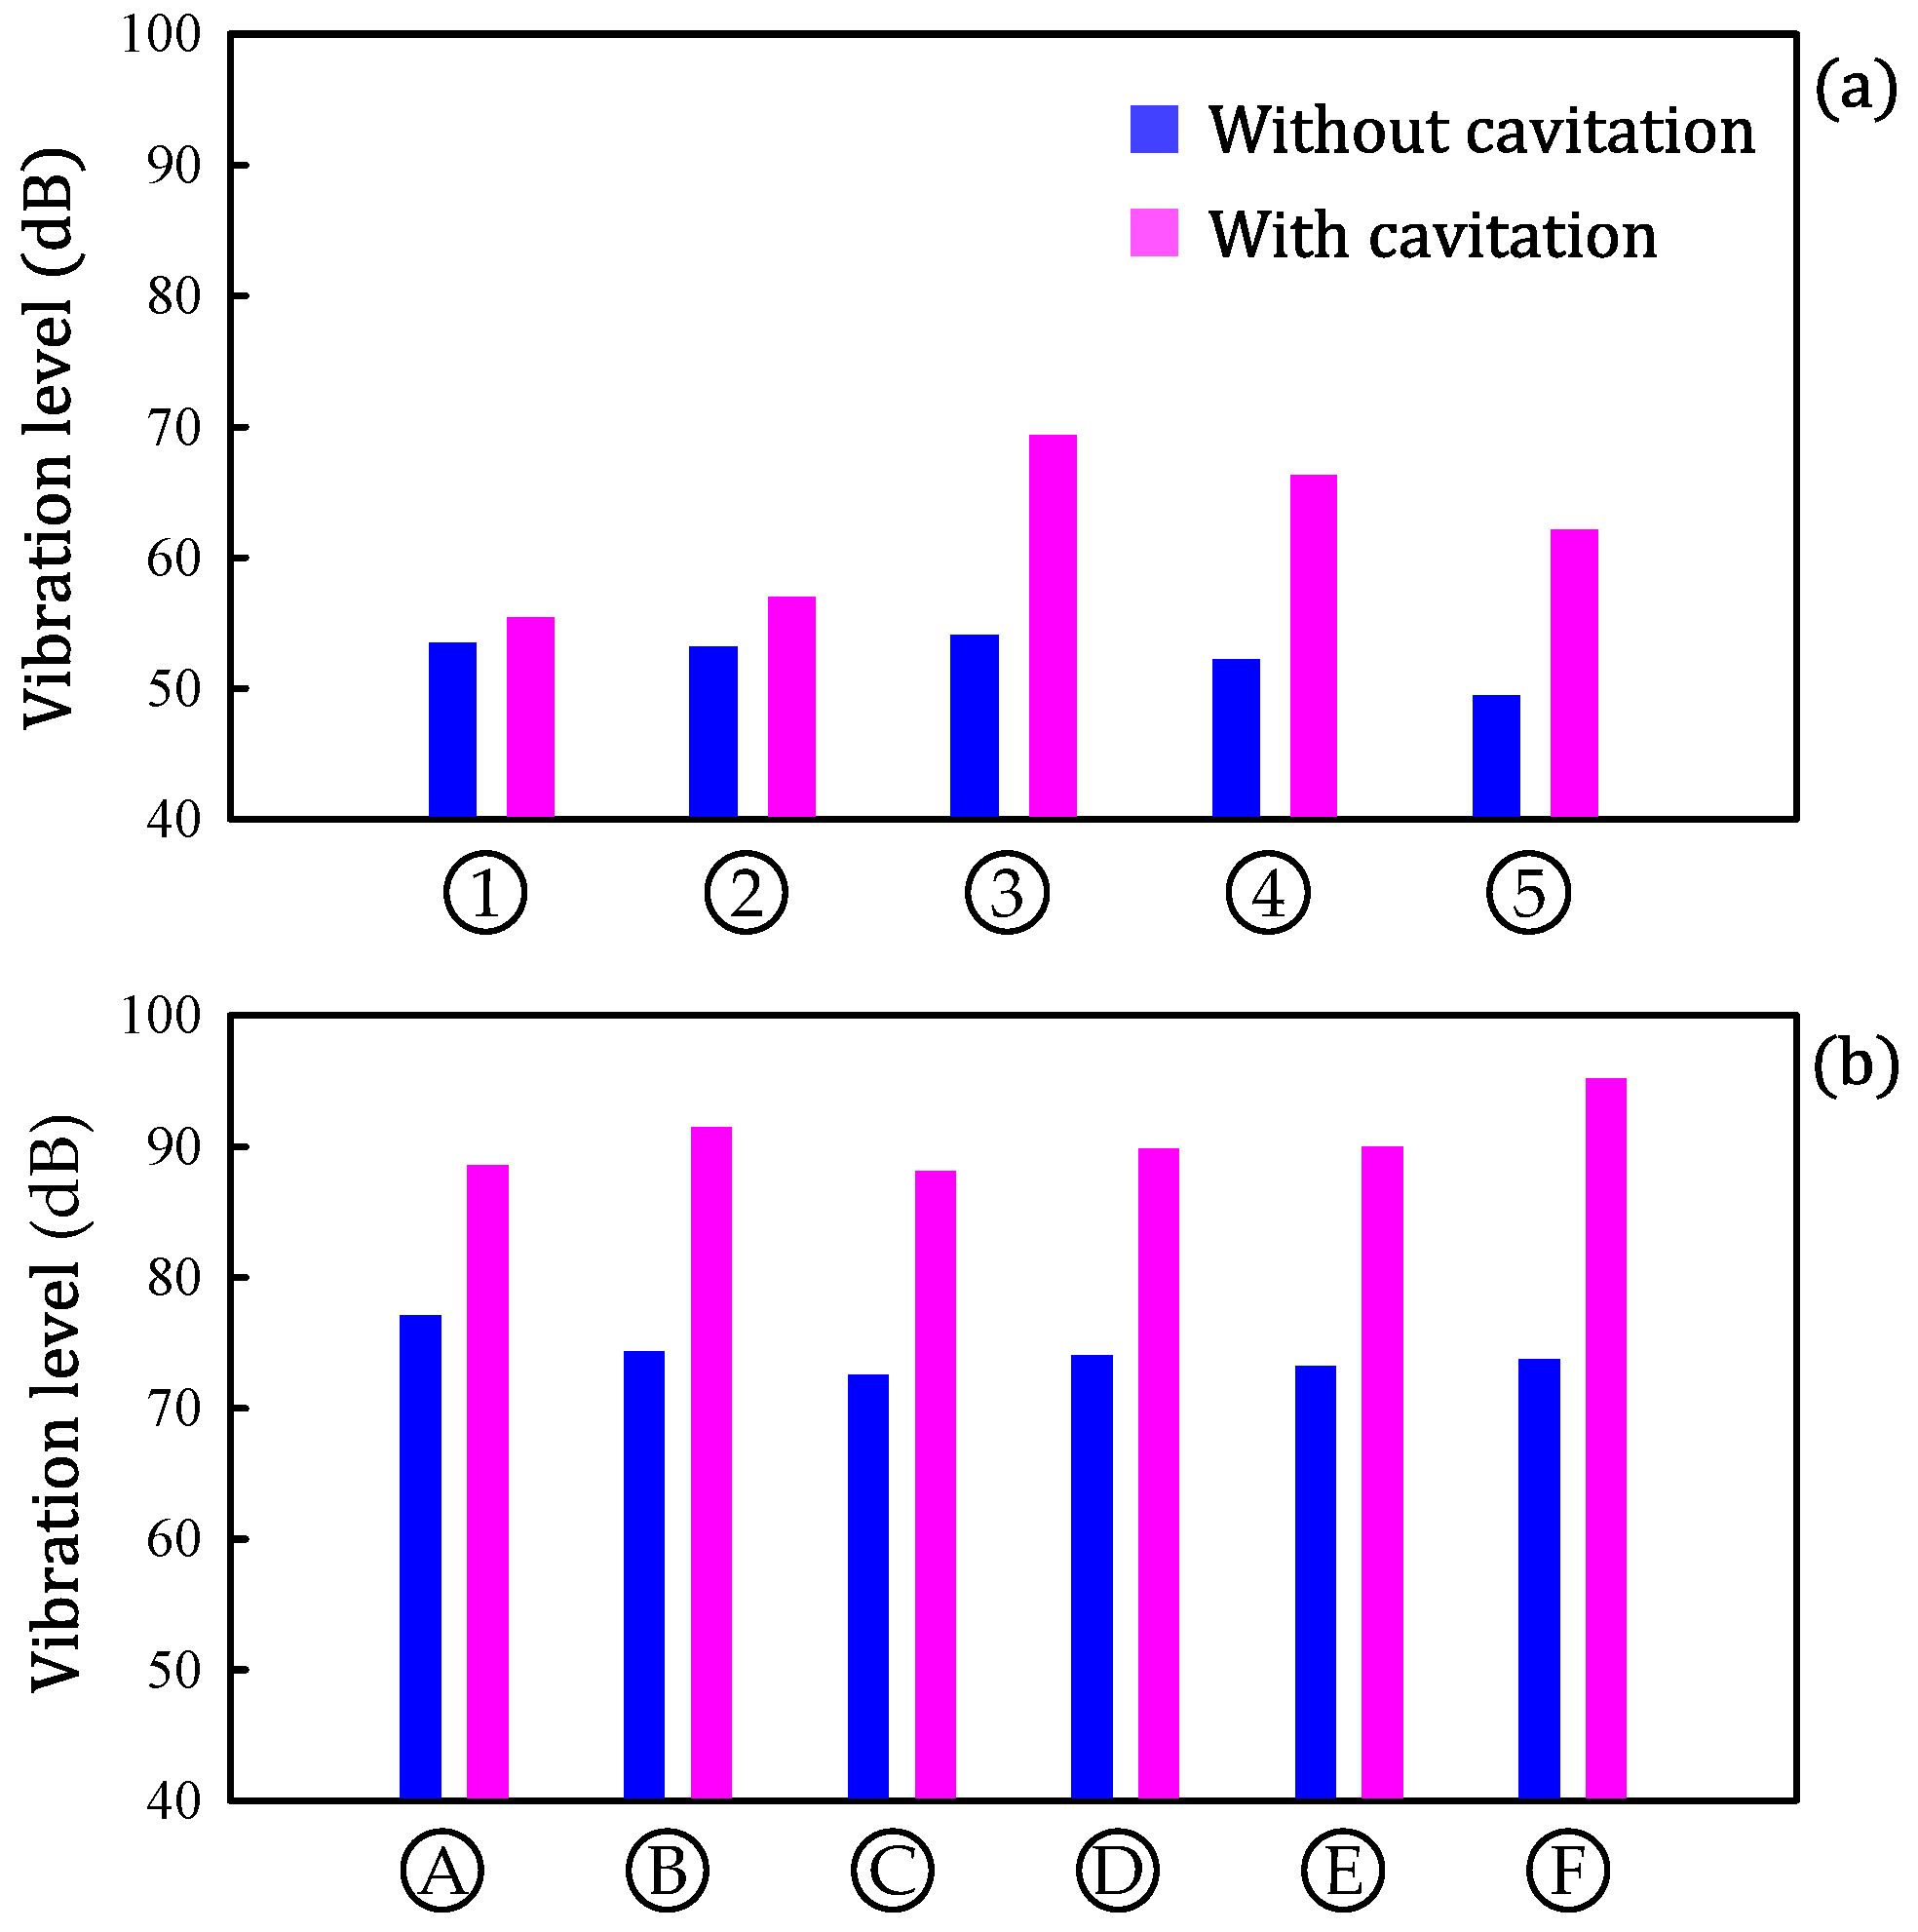
To further identify cavitation bubble collapse locations in the heater core, vibration magnitudes at different measurement points, as shown in
Figure 13, were compared. As indicated in
Figure 11b, frequency spectrum differences due to cavitation are observed above 2 kHz. Therefore, the root mean square (RMS) values of vibration magnitudes within the 2–10 kHz frequency range were chosen for comparison. The vibration magnitudes measured at five points on the inlet and outlet pipes (
Figure 13a) and six points on the upper and lower tanks (
Figure 13b) are compared in
Figure 15.
Figure 15a shows the vibration magnitudes at the five pipe measurement points, while
Figure 15b shows those at the six tank measurement points. The blue bars represent vibration magnitudes at 4000 RPM without cavitation, whereas the pink bars indicate those at 5000 RPM with cavitation.
Figure 15 reveals that vibration magnitudes at all points are higher when cavitation occurs than when it does not. This indicates that collapsing cavitation bubbles induce vibrations in the heater core pipes and tanks. Additionally, vibration magnitudes in the tanks are greater than those in the pipes. The difference in vibration magnitudes between cavitation and non-cavitation conditions is also more pronounced in the tanks than in the pipes. A particularly interesting observation is that, in the absence of cavitation, vibration magnitudes remain relatively uniform across different locations in both the pipes and tanks. However, under cavitation conditions, significant location-dependent variations in vibration magnitude are observed. Specifically,
Figure 15a indicates that among the points on the pipes, point 3 exhibits the highest vibration magnitude, while
Figure 15b shows that among the points on the tanks, point F has the highest vibration magnitude. Considering that point 3 on the outlet pipe and point F on the upper tank are adjacent, it can be inferred that cavitation bubbles collapse near the junction of the outlet pipe and the upper tank.
To investigate why cavitation bubble collapse occurs near this junction, computational fluid dynamics (CFD) simulations were conducted. The simulations were performed using the commercial software Ansys Fluent 2021 R1 [
29] to analyze the velocity and pressure distributions of the coolant within the heater core.
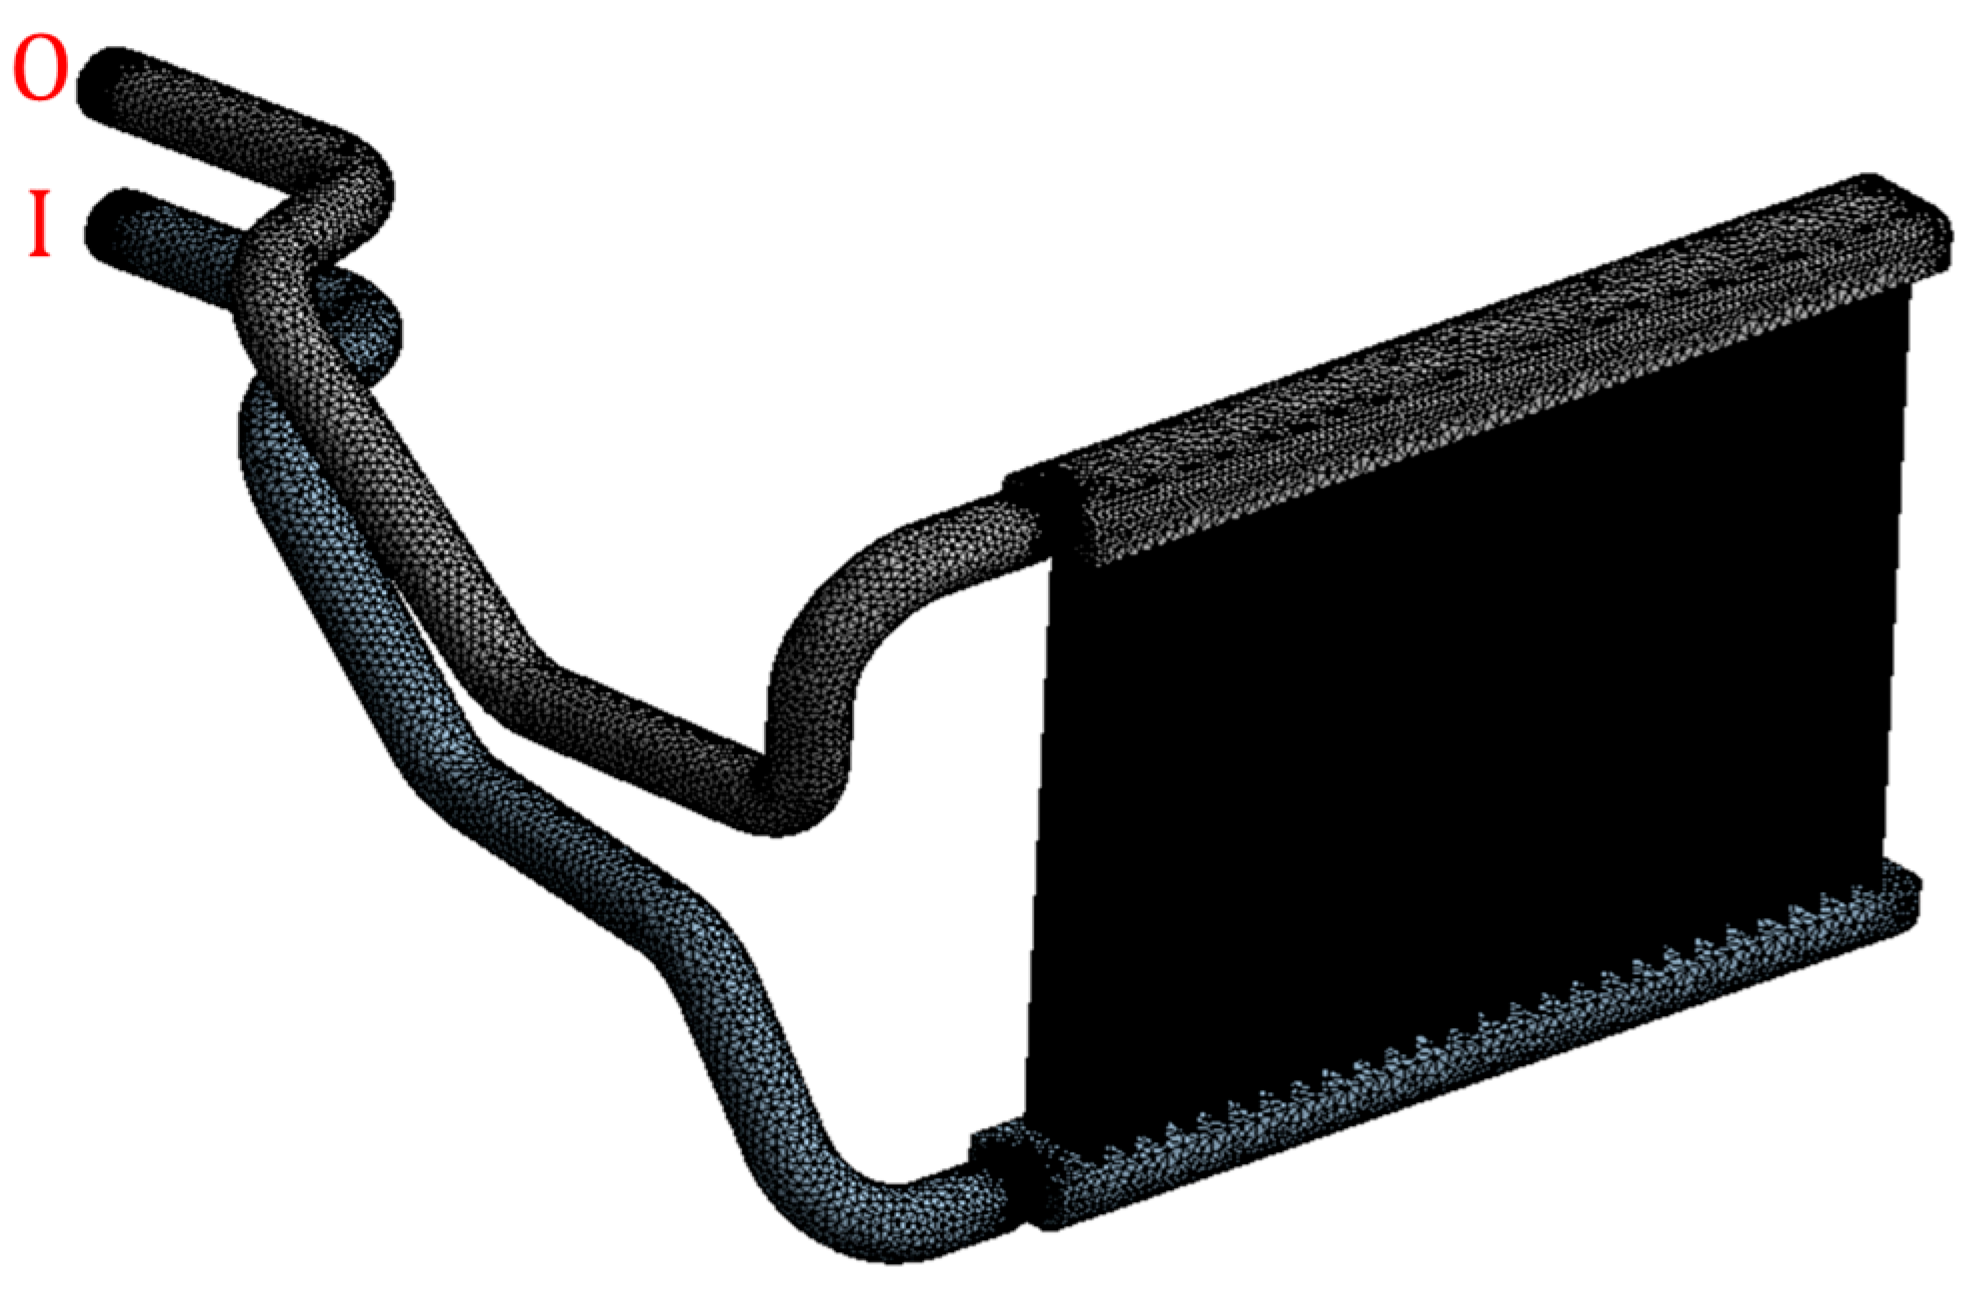
Figure 16 shows the CFD mesh model representing the coolant flow domain within the heater core. The mesh comprises structured and unstructured elements designed to capture the complex heater core geometry and resolve coolant flow characteristics accurately. This model was employed to analyze the fluid velocity and pressure distributions within the heater core.
A coolant temperature of 1 °C was set, and pressures of 101 kPa and 58 kPa were applied at points I and O of
Figure 16, respectively, corresponding to the inlet and outlet pipe ends. These pressure values were obtained from actual vehicle measurements using pressure gauges. A ‘no-slip wall’ boundary condition was applied at the interface between the fluid and the structure. The Shear Stress Transport (SST) turbulence model was used to capture turbulence characteristics near the walls while maintaining robustness in separated flow regions. A steady-state analysis was performed to obtain a converged solution and assess flow behavior under the specified conditions.
The computational domain consisted of approximately 2 million cells. To resolve near-wall flow structures accurately, especially around the junctions and the outlet pipe where complex flow behavior is expected, five prism layers (inflation layers) were applied. A mesh sensitivity analysis was conducted using meshes with 1.5 million, 2.0 million, and 2.5 million cells. The results showed that the local velocity and pressure distributions became stable with increasing cell count, confirming mesh independence. Accordingly, the mesh with 2 million cells was selected for the final simulations. The y+ values near the walls were maintained below 1, satisfying the resolution requirements of the SST turbulence model used in the analysis.
The CFD simulations provided detailed velocity and pressure distributions of the coolant within the heater core. To verify the accuracy of these results, the simulated flow rate of 56.1 L/min was compared with the experimentally measured value of 57.0 L/min. The resulting discrepancy was only 1.6%, demonstrating the reliability of the CFD simulation model.
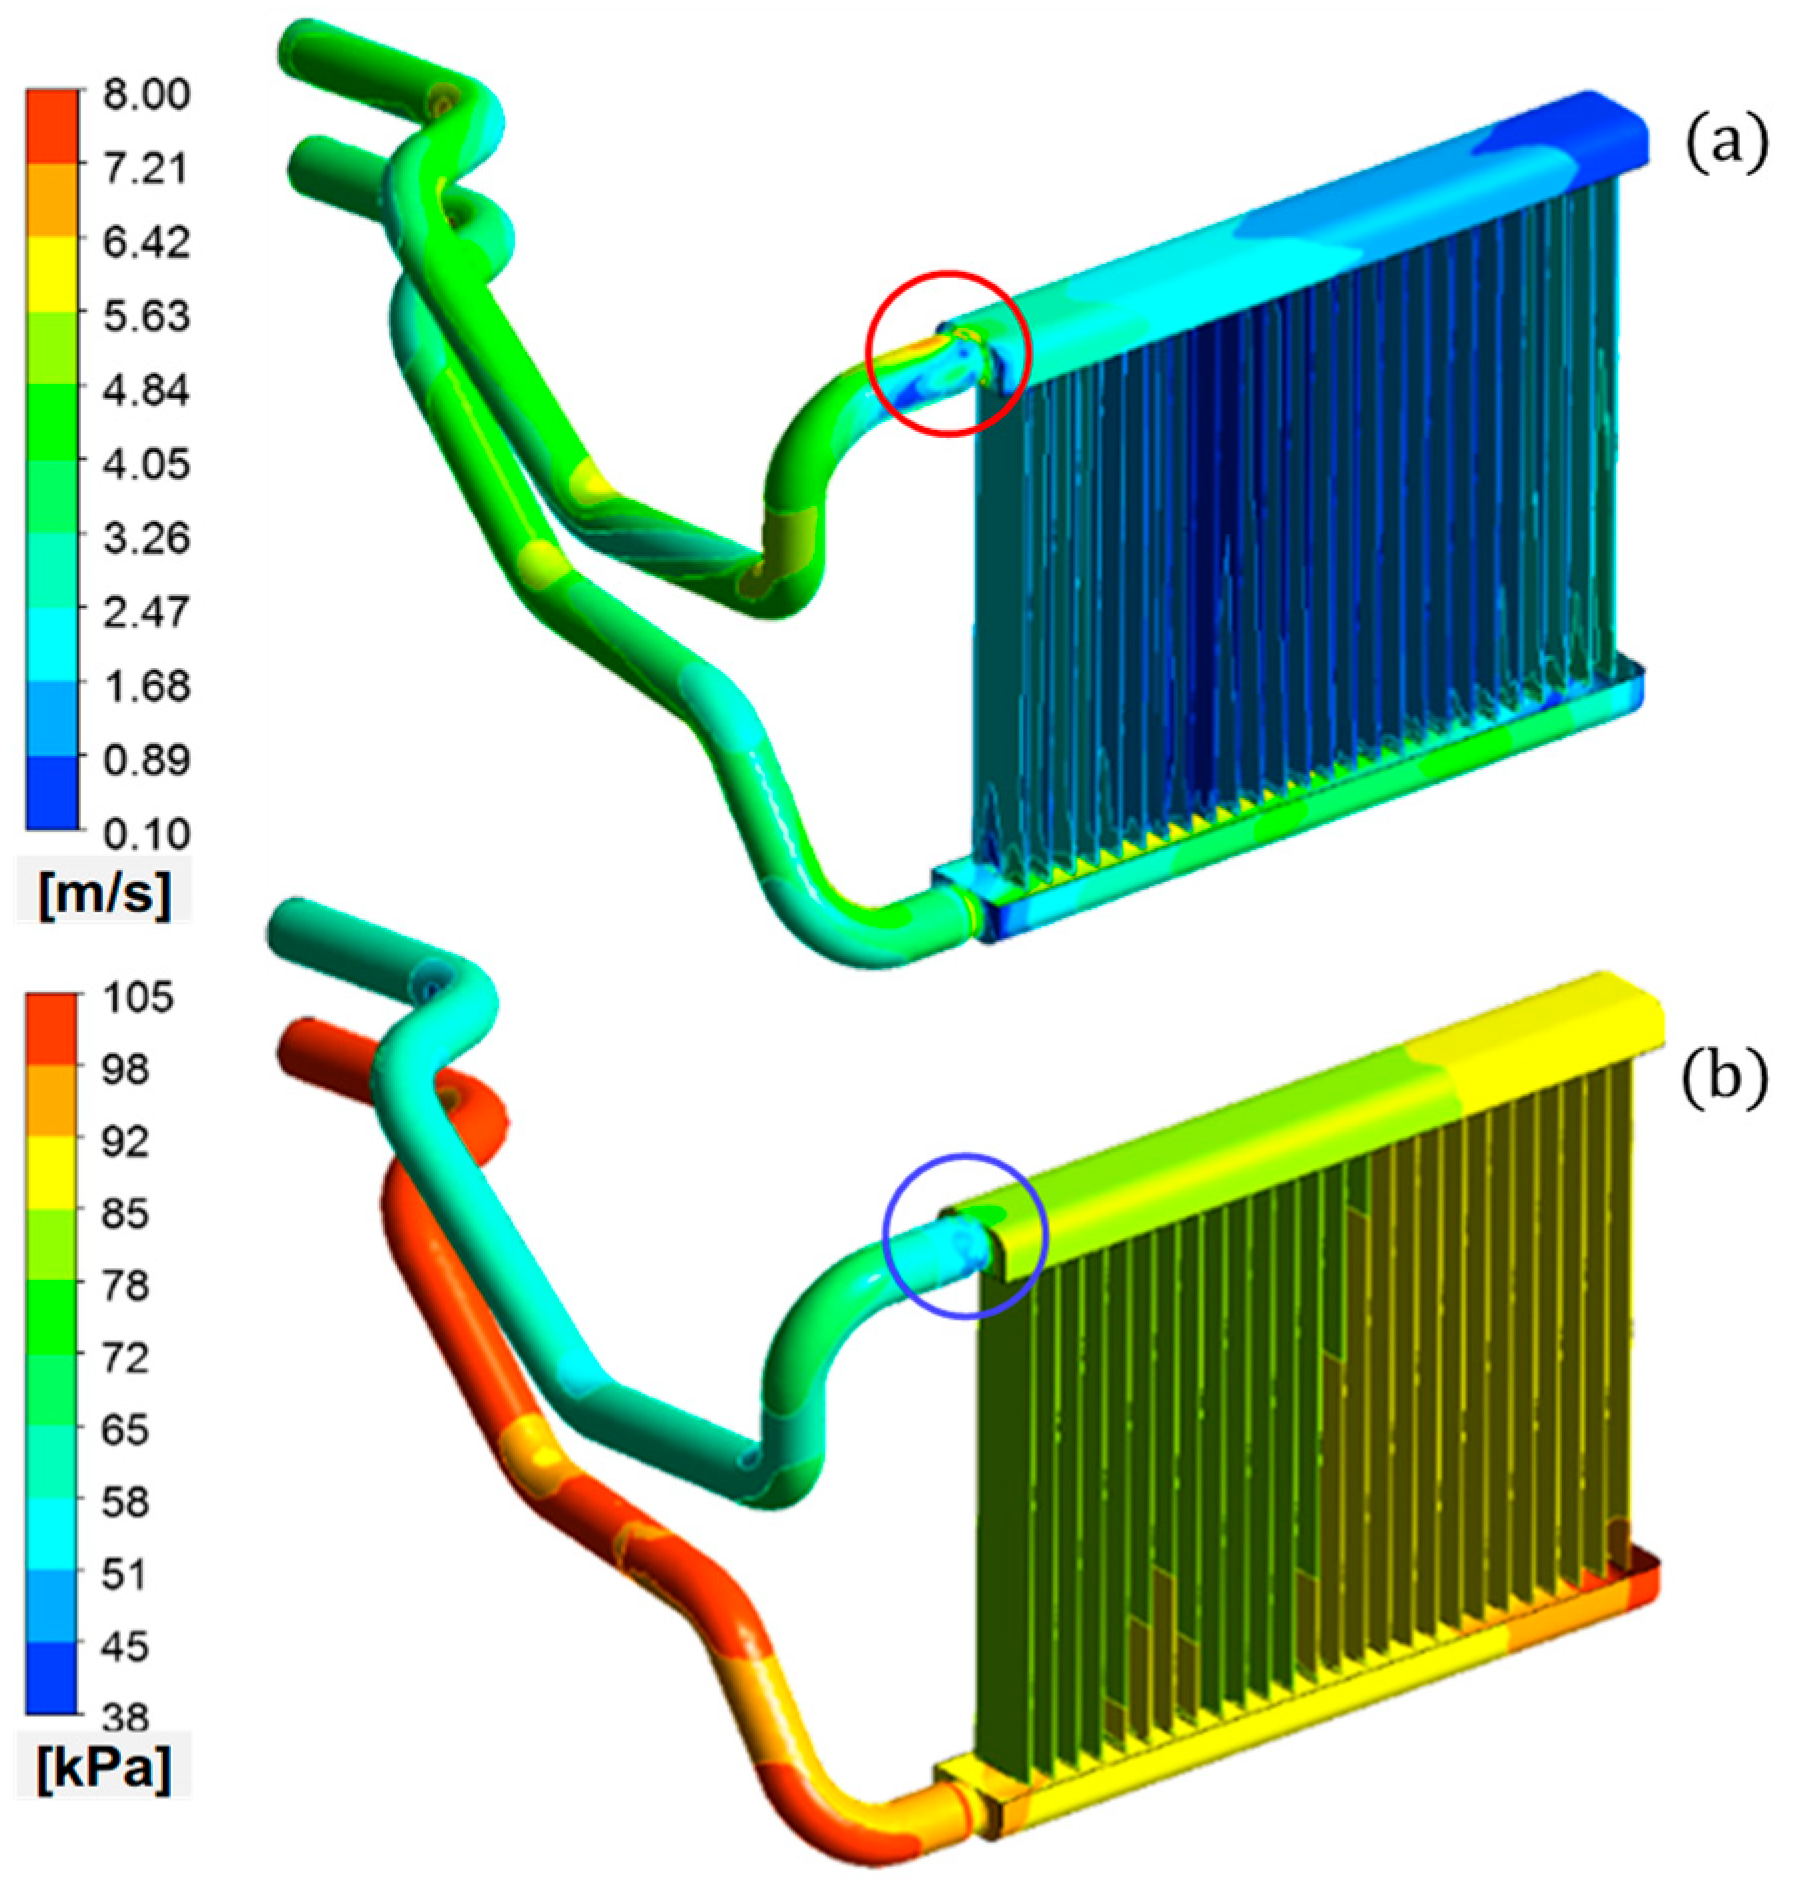
Figure 17a,b present the velocity and pressure distributions, respectively. Note that in
Figure 17a, although the velocity appears to be non-zero at the wall surfaces, this is due to the visualization method used in the CFD software (Ansys Fluent 2021 R1). The displayed values are interpolated from the first layer of cells adjacent to the wall, not from the wall itself, where the velocity is zero due to the no-slip boundary condition. As shown in
Figure 17a, the highest coolant velocity occurs at the junction between the upper tank and the outlet pipe, highlighted by a red circle. Correspondingly,
Figure 17b reveals that the lowest pressure is also observed at this same location, marked with a blue circle. The specific point, exhibiting both the highest velocity and the lowest pressure, corresponds to the location with the lowest cavitation index [
30]. The cavitation index is a dimensionless parameter that indicates the potential for cavitation in a fluid system; lower values signify a greater likelihood of occurrence. Cavitation is expected when the cavitation index drops below 1.
Figure 18 illustrates the cavitation index distribution in the midplane of the heater core. At the junction between the upper tank and the outlet pipe—marked by a circle—the cavitation index is 0.876, which is below the threshold of 1. This confirms a high probability of cavitation forming in this region.
The cavitation index is defined as
where
is the fluid pressure,
is the saturated vapor pressure,
is the fluid density, and
is the velocity. According to this equation, the cavitation index decreases as the flow velocity increases or as the pressure difference between the pipe and the vapor pressure decreases. Both of these conditions increase the likelihood of cavitation. Additionally, a higher flow rate or lower coolant temperature results in a lower cavitation index, further increasing the probability of cavitation.
To further validate this relationship, experimental data measured in the actual vehicle were analyzed. At an engine speed of 5000 RPM, the measured flow rate was 57.0 L/min, while at 4000 RPM, the flow rate was 45.1 L/min. Cavitation noise was observed at the higher flow rate of 57.0 L/min but not at 45.1 L/min. This supports the conclusion that as the flow rate (and consequently the velocity) increases, the cavitation index decreases, thereby increasing the likelihood of cavitation.
Moreover, the relationship between the coolant pressure and cavitation index was analyzed. At 5000 RPM, when cavitation noise occurred, the saturated vapor pressure was 1 kPa, and the pressure at the outlet pipe was 50 kPa. When no noise was observed, the saturated vapor pressure was 19 kPa, and the outlet pipe pressure was 100 kPa. Therefore, when cavitation noise occurred, the pressure difference between the pipe and the saturated vapor pressure was 49 kPa, whereas when no noise occurred, the difference was 81 kPa. This further supports the conclusion that the cavitation index is lower when noise is present, which aligns with the observed presence or absence of cavitation.
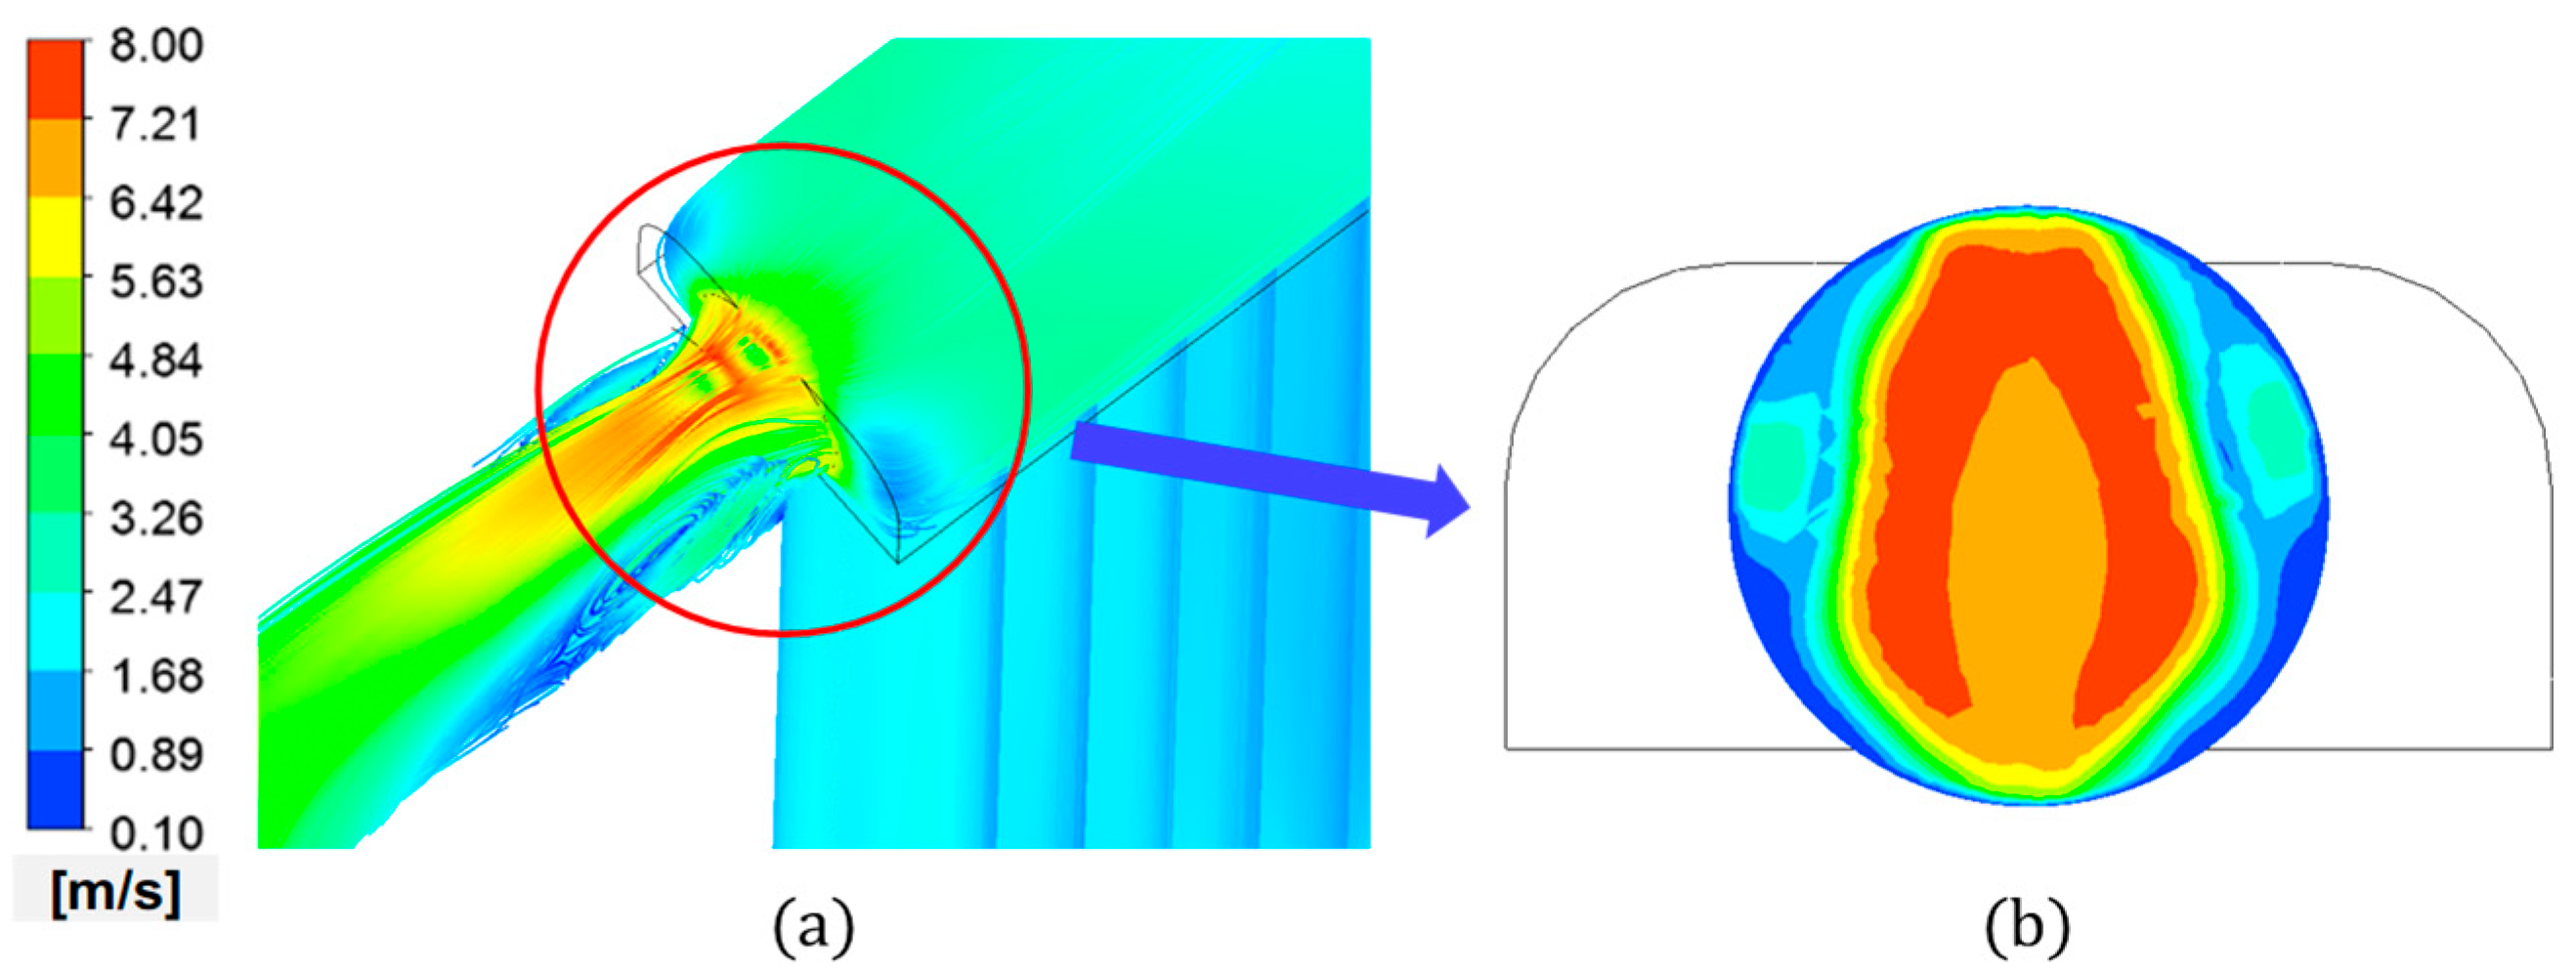
To understand why the coolant velocity reaches its maximum around the junction between the upper tank and the outlet pipe, the velocity distribution in this region is magnified and presented in
Figure 19. As shown in
Figure 19a, the area marked with a circle indicates the location of the highest velocity. To examine the velocity distribution more clearly, a magnified view of the velocity profile in the cross-section of the outlet pipe at the junction is provided in
Figure 19b. The red regions in
Figure 19b represent a high-velocity area, revealing that the velocity increases significantly only in a specific portion of the cross-section of the outlet pipe.
This localized high velocity results from the abrupt reduction in cross-sectional area at the junction between the upper tank and the outlet pipe. As the coolant flows from the wider cross-section of the upper tank into the narrower outlet pipe, its velocity increases sharply while the pressure decreases. This rapid increase in velocity and corresponding drop in pressure induce cavitation at the junction, confirming that the abrupt contraction in cross-sectional area is the primary cause of this phenomenon.
4. Reduction of the Cavitation Noise
In the previous section, it was demonstrated that cavitation noise was generated at the junction between the upper tank and the outlet pipe. This phenomenon was attributed to the abrupt change in cross-sectional area at the junction, which induced a high coolant velocity and a rapid pressure drop, creating favorable conditions for cavitation.
Related to this issue, structural modifications were implemented at the junction to reduce cavitation noise.
Figure 20 illustrates the design changes. The original configuration (
Figure 20a) featured a step-like transition between the upper tank and the outlet pipe, resulting in a sudden contraction in flow area. This was redesigned into a tapered connection (
Figure 20b), allowing for a smoother and more gradual transition in cross-sectional area. Additionally, the cross-sectional area of the outlet pipe was increased, thereby reducing the area ratio between the outlet pipe and the upper tank from 54% to 38%. These changes were aimed at reducing the flow velocity and pressure drop at the junction, which are primary contributors to cavitation.
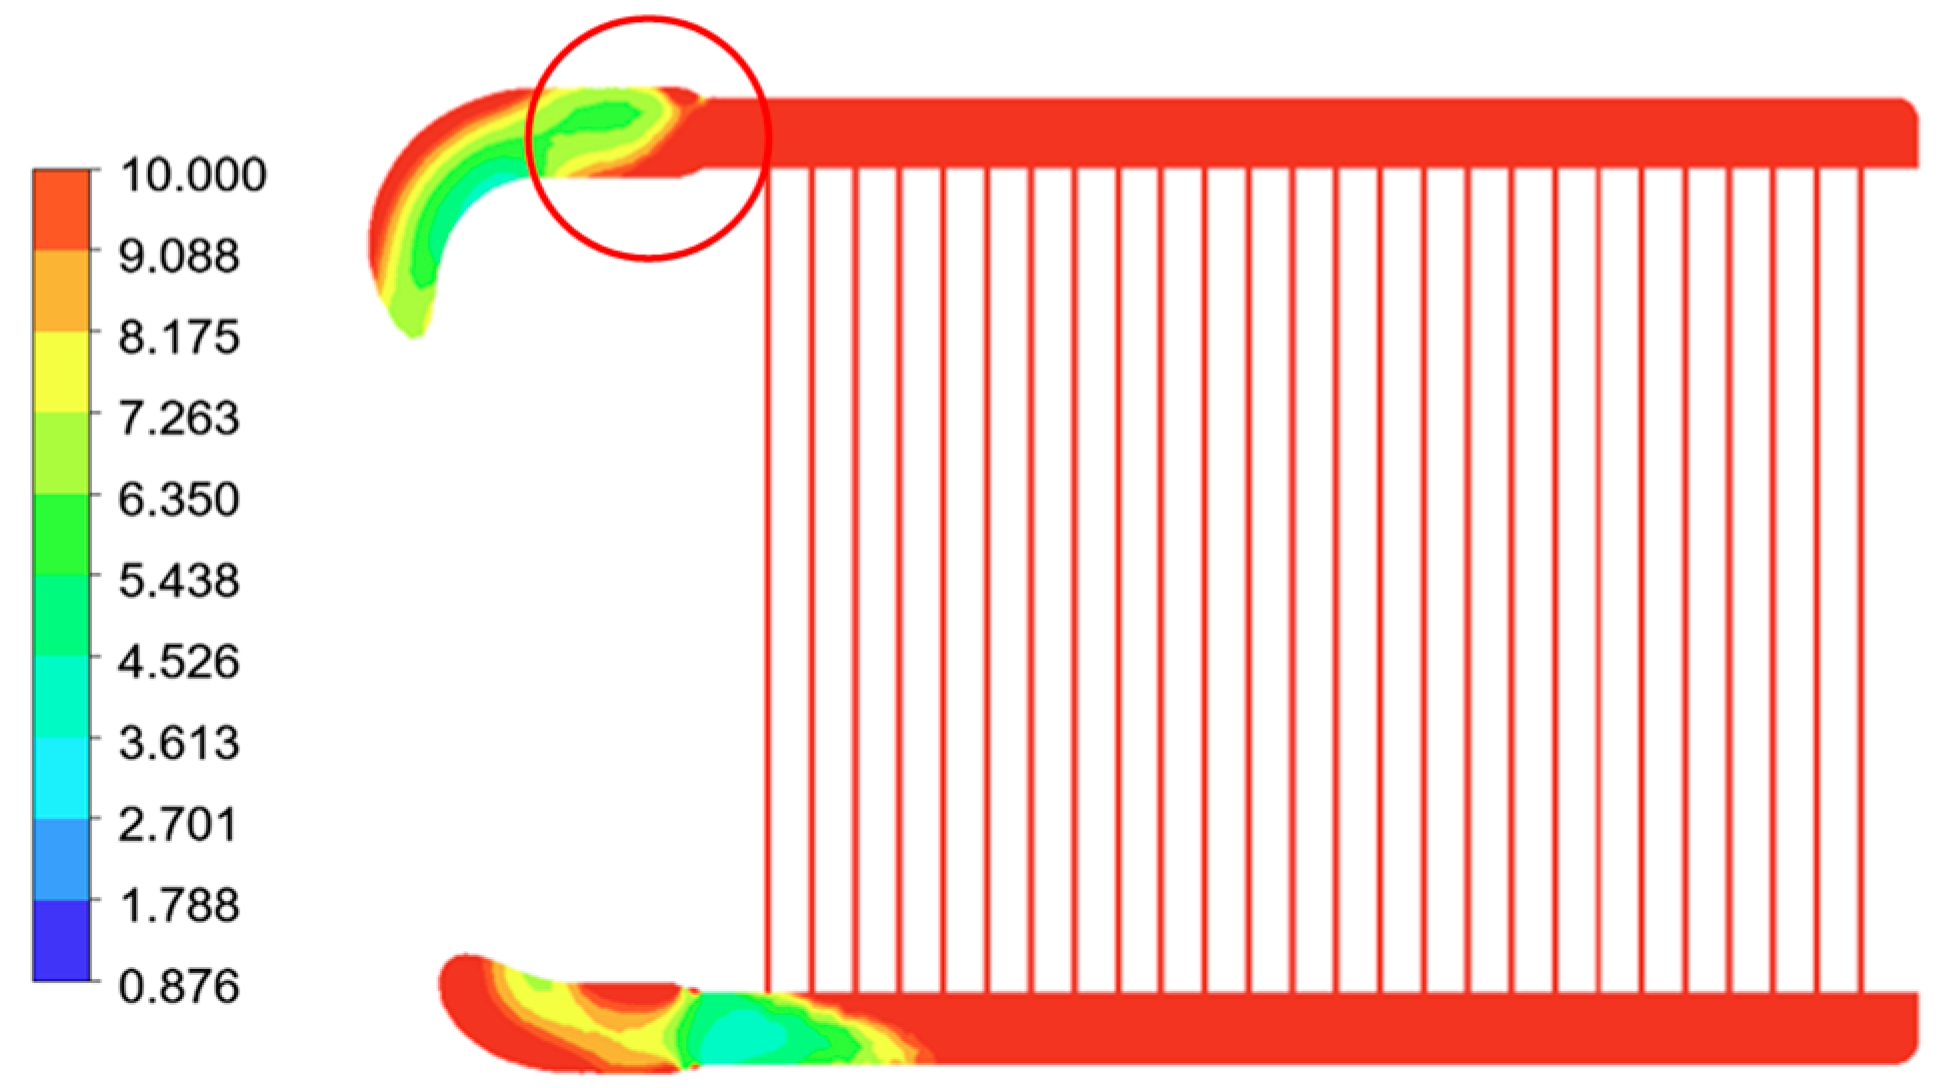
To evaluate the effectiveness of the modified design, a CFD simulation was performed under the same boundary conditions used in the previous analysis to ensure a fair comparison. The resulting velocity distribution near the junction is presented in
Figure 21a, while
Figure 21b shows the velocity distribution across a cross-section of the outlet pipe close to the junction. The simulation results reveal that the maximum velocity in the improved configuration is significantly lower than that in the original design (
Figure 19). This reduction is directly attributed to the elimination of the step structure and the increase in outlet pipe diameter.
The effect of these design modifications on cavitation potential was assessed using the cavitation index.
Figure 22 presents the distribution of the cavitation index at the mid-plane of the heater core. In the region where cavitation was most severe in the original design (highlighted by a circle in
Figure 22), the minimum cavitation index was improved from 0.876 to 5.604. A cavitation index of 5.604 indicates that the local pressure conditions are no longer conducive to cavitation, suggesting that the redesigned junction effectively suppresses cavitation onset.
To experimentally validate the CFD findings, a prototype heater core incorporating the improved junction geometry was fabricated. The prototype maintained identical dimensions to those used in the CFD model. Transparent tubes were installed on the inlet and outlet pipes to visually monitor bubble formation, and an accelerometer was mounted at point F on the upper tank (as shown in
Figure 13b) to capture vibration signals associated with cavitation.
The engine was accelerated from a stationary state to 5000 RPM and held at that speed for approximately 100 s, during which both visual observation and vibration measurements were conducted. No cavitation noise was detected from the structurally modified heater core, and no bubbles were observed in the transparent sections of the inlet and outlet pipes. Furthermore, the vibration signal shown in
Figure 23 did not exhibit the impulse peaks that were present in the original configuration (
Figure 14b), which were previously linked to the collapse of cavitation bubbles striking the tank wall. These experimental observations, consistent with the CFD results, confirm that the structural modification of the junction between the upper tank and the outlet pipe effectively eliminates cavitation noise in the heater core system.
5. Conclusions
This study investigated the generation mechanism of noise and vibration caused by cavitation in the heater core of an automotive HVAC system and proposed an effective design modification to mitigate the issue. Through a combination of controlled experiments, in-vehicle testing, and CFD simulations, the presence and characteristics of cavitation were thoroughly examined under various flow conditions.
The experimental results confirmed that cavitation occurs in the heater core, particularly near the junction between the upper tank and the outlet pipe, under high flow rate and low coolant temperature conditions. Noise and vibration measurements revealed that cavitation produces distinct impulsive signals, especially evident in the time-domain vibration data and high-frequency components of the frequency spectra. In-vehicle tests corroborated these findings, demonstrating that cavitation-induced noise manifests as abnormal acoustic events during cold engine start-up at high engine speeds.
Using transparent tube observations and pressure measurements, cavitation was localized to the heater core rather than the water pump. Accelerometer data further pinpointed the collapse of cavitation bubbles to the area around the upper tank–outlet pipe junction. CFD analysis showed that this region experiences both the highest flow velocity and the lowest pressure, leading to a low cavitation index and confirming the conditions necessary for cavitation onset.
To address this issue, a redesigned outlet junction with a tapered transition and increased pipe diameter was proposed. CFD simulations demonstrated a significant reduction in flow velocity and a corresponding increase in cavitation index, indicating a substantial decrease in cavitation potential. Experimental validation using a prototype heater core with the modified geometry showed complete elimination of cavitation-induced noise and vibration.
Overall, this research identifies the root cause of heater core cavitation noise and provides a validated, practical solution through structural optimization. The findings offer valuable insights for improving the acoustic performance and durability of automotive HVAC systems, with potential applications in the broader design of fluid systems where cavitation may be a concern.


