Article

Physical Simulation Test and Numerical Simulation Study on Force and Deformation of Inclined Shaft Lining Using OFDR Testing Technology

1
State Key Laboratory of Intelligent Construction and Healthy Operation and Maintenance of Deep Underground Engineering, China University of Mining and Technology, Xuzhou 221116, China
2
School of Mechanics and Civil Engineering, China University of Mining and Technology, Xuzhou 221116, China
*
Author to whom correspondence should be addressed.
Appl. Sci. 2025, 15(10), 5718; https://doi.org/10.3390/app15105718
Submission received: 13 March 2025 / Revised: 9 May 2025 / Accepted: 14 May 2025 / Published: 20 May 2025
(This article belongs to the Section Civil Engineering)

Abstract

:
The inclined shaft lining cross-section is prone to severe issues such as shaft lining cracking and even structural failure due to geometric irregularity and mechanical complexity, posing significant engineering safety hazards. To address these safety concerns, this study introduces Optical Frequency Domain Reflectometry (OFDR) as a novel monitoring approach for inclined shaft linings. OFDR was implemented to measure strain distributions across both the inner and outer surfaces of a model shaft lining, with validation through comparative analysis against strain gauge measurements and numerical simulations. The findings indicate that: (1) OFDR provides accurate strain measurements consistent with conventional methods, and (2) has the ability to detect cracks that cannot be identified by the human eye. This study preliminarily achieved full-section monitoring of strain distribution on both the inner and outer edges of inclined shaft lining using OFDR technology, which holds significant implications for underground construction projects.

1. Introduction

China is characterized by abundant coal reserves but limited oil and natural gas resources, making coal the predominant energy source for the foreseeable future [1]. Shafts serve as critical infrastructure in coal mine construction, primarily constructed as vertical or inclined shafts [2,3,4,5,6]. Among these, inclined shaft mining has played an increasingly vital role in China’s coal extraction and transportation due to its advantages of lower investment costs, faster coal extraction, higher operational efficiency, and reduced production costs [7,8]. However, inclined shafts face significant challenges in weak surface strata or water-rich rock formations characterized by soft lithology and porous water-bearing conditions [9]. During long-term operation, shaft linings are subjected to varying degrees of hydrostatic pressure, with localized water pressure distributions developing around the shaft periphery [10]. Hoek et al. [11] investigated and overcomed the squeezing issues in the La Yacambú-Quíbor Tunnel in Venezuela, analyzed the reason and given the solution. Furthermore, increasing geological complexity at greater depths exposes inclined shaft linings with irregular cross-sections to more complicated external forces. This results in highly complex stress-strain patterns that ultimately lead to lining cracks, water seepage, and potential flooding accidents through groundwater infiltration, posing substantial risks to property and human safety [12]. Application of optical fiber in inclined shaft is shown in Figure 1.
Therefore, investigating the stress-strain behavior and displacement patterns of inclined shaft lining under asymmetric loading forms a critical basis for shaft construction engineering. Sun et al. [13] studied the temperature field distribution of freezing inclined shaft, the three-dimensional physical model test of temperature field distribution law of artificial freezing inclined shaft was completed. Fu et al. [14] and Verruijt [15] given the analytical solution of the deformable tunnel in half plane by using the complex function method. Yang et al. [16] developed analytical solutions for stress and displacement distributions in inclined shaft linings under non-uniform loading, employing a combined penalty function approach and complex variable theory. Numerical modeling validated these solutions and evaluated how contact surface porosity, unloading rates, lateral pressure coefficients, and thickness to diameter ratios affect deformation. Zhou et al. [17] independently developed an experimental system for bedrock shaft linings under high water pressure. Through comparative tests between linings with limited-thickness surrounding rock and those without, they analyzed the influences of hydrostatic pressure, lining thickness, surrounding rock thickness, and shear modulus on bearing capacity. This work revealed fundamental displacement and strain patterns at lining edges and clarified failure mechanisms. Hu et al. [18] established a mechanical model for a frozen wall with its inner edge radially incompletely unloaded. A parameter, α, expressing the degree of being unloaded was introduced, and then a new method of designing and calculating the thickness of the frozen wall was proposed. Wang et al. [19] compared the mechanical properties of basalt fiber-reinforced concrete linings with steel-reinforced concrete linings through laboratory model tests, analyzing differences in crack initiation loads, stress distribution, displacement patterns, and load-bearing characteristics. Wang et al. [20] combined numerical modeling with field measurements to investigate the stress-deformation behavior of freezing walls and shaft linings during inclined shaft excavation using the freezing method. Zhang et al. [21] employed similarity theory and hydraulic capsule loading to study the mechanical response of shaft linings during thawing of bedrock freezing walls. Xu et al. [22] focused on the deformation mechanisms of shaft linings during thawing processes in surface soil layers. Zhang et al. [23] applied localized jack loading to model linings, revealing deformation patterns under partial pressure conditions. Zhou et al. [24] conducted three-dimensional photoelastic model tests to characterize stress distribution in inclined shaft linings within thick sand layers. Wang et al. [25] investigated the mechanical behavior and design principles of inclined shaft linings in surface soil layers during freezing wall thawing through physical modeling and finite element simulations. Chen et al. [26] examined the mechanical performance of steel-concrete composite floor structures in water-rich bedrock by applying axial and confining pressures via hydraulic loading. Ren et al. [27,28] combined laboratory tests, field monitoring, and numerical simulations to analyze the stress characteristics and temperature fields of inclined shaft linings in water-saturated sand layers during freezing. Zhang et al. [29] integrated analytical, numerical, and experimental methods to study the deformation mechanisms of single-layer linings in porous water-bearing rock strata during freezing excavation. Zhang et al. [30] systematically investigated ground settlement and structural stress variations in inclined shafts traversing thick water-rich sandstone layers under dewatering conditions, employing theoretical analysis, scaled modeling, and numerical approaches. Ma et al. [31] clarified the failure mechanisms of inclined shaft linings in anisotropic strata. While these studies achieved significant advancements in understanding lining deformation patterns, their reliance on conventional strain gauges limited comprehensive measurement of full-section strain distributions. Building on previous studies, this work further develops and refines the experimental methodology. Jiang et al. [32] studied the influence of different burial depths and different soil lining spacing on soil stress field and lining external load distribution during excavation and support of shallow buried tunnels by using the discrete element method. Moreover, Studies on lining support issues in other underground engineering structures also provide valuable references. Meguid et al. [33] conducted a comprehensive review of typical physical models in soft soil tunnel research, providing an in-depth exploration of multiple testing methods for soil deformation and failure mechanisms. Di Murro et al. [34] employed advanced monitoring techniques, including BOTDR, to track and analyze the behavior of the tunnel lining over a three-year period. Metje et al. [35] and Moffat et al. [36] embedded optical fibers into rod-shaped structural members and tightly bonded them to the monitored structures to reflect deformation behavior. Xu et al. [37,38] and Song et al. [39] conducted similarity model tests to investigate the evolution of mechanical responses and failure mechanisms in lining structures. Zhang et al. [40] investigated the mechanical performance and failure modes of lining structures under the coupled condition of vault voids and cracks. Min et al. [41] established a 3D tunnel numerical model using ABAQUS software and systematically investigated crack propagation patterns in asymmetrical multi-arch tunnel structures with/without voids by introducing the extended finite element method (XFEM). Lu et al. [42] applied FLAC3D to conduct numerical simulations on the deformation of inclined shaft under four different fill ratios, revealing the deformation and failure patterns of the shaft. Xu et al. [43] addressed the significant deformation issues during the excavation of dark inclined shafts by establishing a UDEC numerical model. Based on the “stress weakening coefficient” indicator, they conducted a back analysis on the deformation and crack distribution characteristics of the surrounding rock in the roadway, thereby revealing the deformation and failure mechanisms of the roadway. Chouhan et al. [44] presents a comprehensive review on numerical simulation methods for large deformations in geotechnical engineering. Alternatively, Zhuo et al. [45] investigated the cracking behavior of straight-wall tunnel linings under varying burial depths using the PFC2D numerical simulation model. With the increasing maturity of Optical Frequency Domain Reflectometry (OFDR) technology, its application in underground geotechnical engineering measurements has expanded significantly [46,47,48].
A critical research question is whether OFDR can be integrated into inclined shaft lining construction to provide more comprehensive and accurate stress-strain measurements. Based on similarity theory, this study calculated the dimensions of the shaft lining model and surrounding rock thickness to construct scaled physical models. To obtain model shaft linings with deformation characteristics consistent with prototype conditions, three experimental groups were designed, Group No. 1: direct contact between the shaft lining and surrounding rock; Group No. 2: a polytetrafluoroethylene (PTFE) plate inserted at the shaft lining-surrounding rock interface; Group No. 3: composite filling with both a PTFE plate and fine sand at the interface. Four key monitoring points were established along the inner circumference of the shaft lining section, with one strain gauge installed at each point. Distributed optical fibers were deployed along both the inner and outer circumferences of the monitoring section. Hydraulic jacks apply bidirectional loading in the X and Y directions, simulating stress-strain conditions under asymmetric ground pressure. The experimental study recorded strain-time histories from both conventional strain gauges and distributed optical fiber sensors throughout the loading process. A comprehensive verification was performed by comparing synchronous strain measurements obtained from colocated fiber optic and strain gauge sensors. This comparative analysis assessed the potential of OFDR technology to substitute for conventional strain gauges in the application of inclined shaft lining deformation monitoring. Through systematic analysis of model shaft lining strain monitoring data and prototype deformation characteristics, the investigation identified the most appropriate contact condition from the three predefined experimental configurations. The experimental results informed subsequent numerical simulations, with comparison between numerical simulations and physical measurements serving to further validate the measurement capabilities of OFDR technology for shaft lining strain monitoring.

2. OFRD Method

The test utilized tight-buffered optical fibers produced by NanZee Sensing Technology company in Suzhou, China and a distributed fiber optic interrogator (OSIDI-A) from Luna Innovations Incorporated in Roanoke, USA. The fiber optic testing was conducted on three prismatic concrete specimens measuring 100 mm × 100 mm × 400 mm. The monitoring period spanned from the initial pouring stage to the final setting.

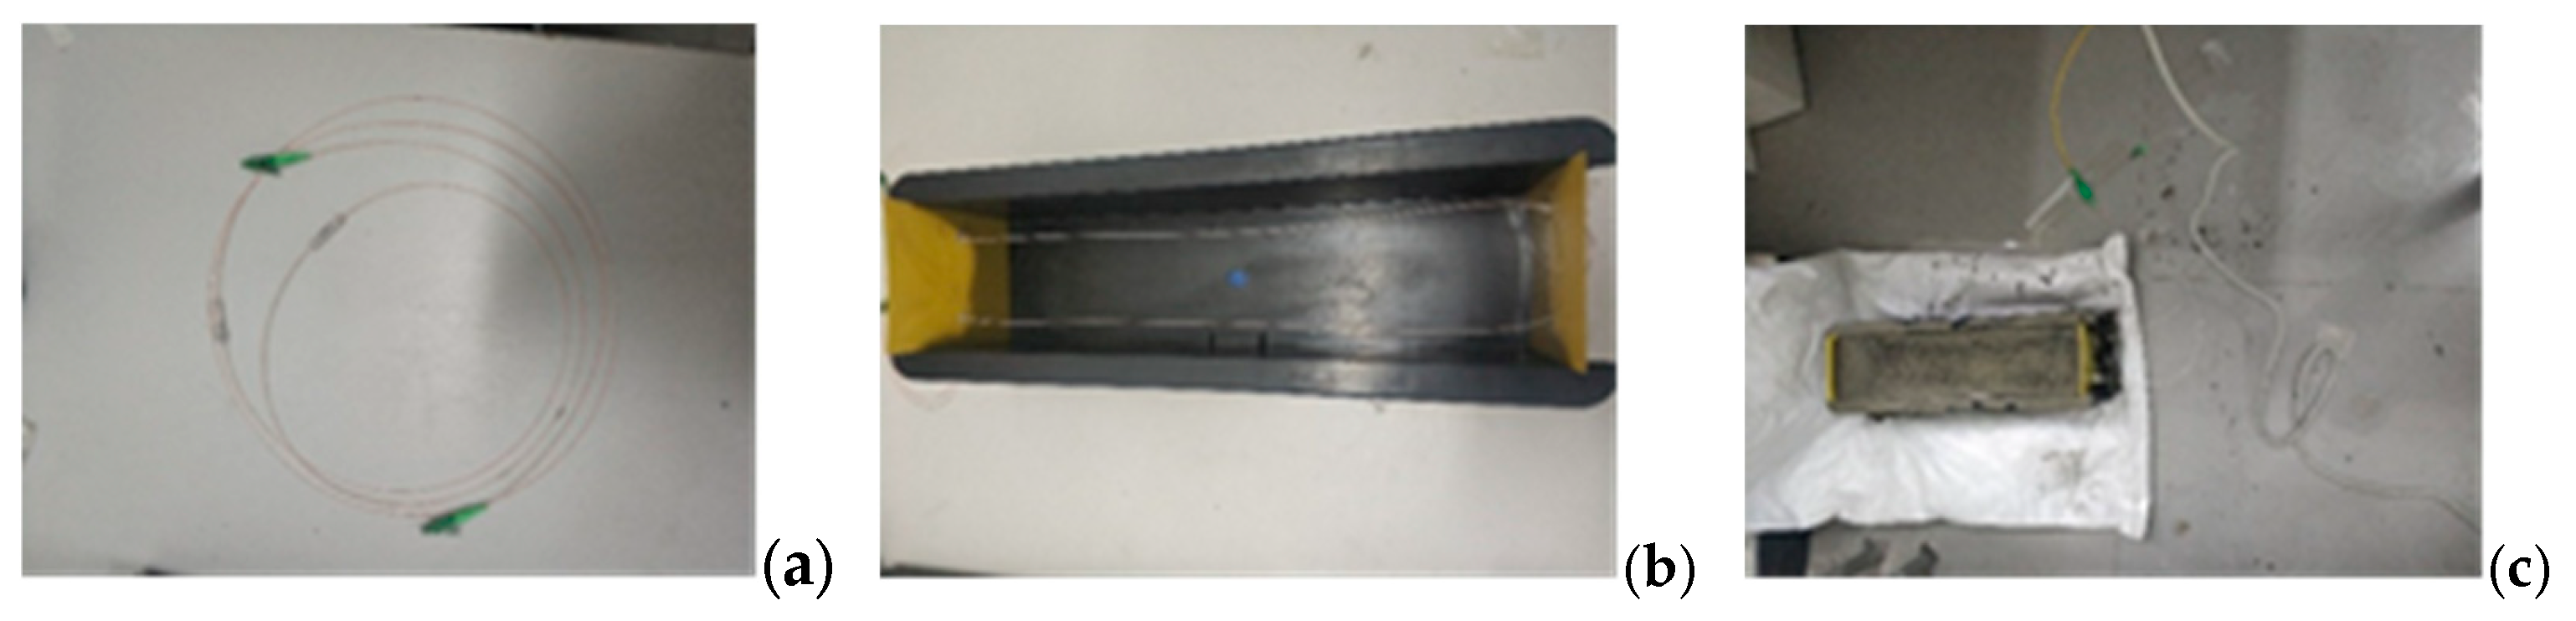
2.1. Fiber Protection Test

To address potential fiber damage caused by stress concentrations during the concrete curing process, pre-testing was conducted prior to the shaft lining model experiments. Selected fibers were embedded in concrete specimens (Point A), protected by adhesive-sealed plastic tubes at the concrete-air interface (Point B), while others remained exposed (Point C). Continuous signal monitoring was performed throughout the concrete curing process. The test configuration is illustrated in Figure 2, with corresponding monitoring results shown in Figure 3. Figure 3 shows the following results: at Point A, the fiber was embedded in concrete. Initially, tensile strain increased due to heat from concrete hydration. Later, compressive strain developed as the concrete hardened and shrank. At Point B, the fiber was not embedded. The strain remained stable throughout the test. At Point C, the fiber was at the concrete-air interface without protection. Strain increased over time due to stress concentrations. This confirms that protective measures can reduce stress concentrations effectively. The results prove that protecting fibers minimizes damage from stress concentrations. It also ensures stable and reliable signal collection during monitoring.

2.2. Fiber Bending Test

Optical fiber installation often involves right-angle or parallel bends. Excessive bending causes light attenuation, which significantly reduces the signal-to-noise ratio (SNR) and renders measurements unreliable. This study determined the minimum allowable bending radius. Test Procedure: Printed circles with radii of 0.5 cm, 1 cm, 1.5 cm, 2 cm, 2.5 cm, and 3 cm on A4 paper. Tested fibers by adhering them starting from the largest radius to identify the minimum viable bending radius. Validated results through parallel bends (180° curvature). Key Findings: (1) Plastic sleeves were installed at non-critical stress concentration zones to protect the fiber during testing; (2) The bending radius must exceed 1 cm at all turn points.

3. Physical Model Test

3.1. Similitude Modeling and Design of Shaft Lining Models

3.1.1. Similitude Modeling

By considering key factors—such as lining materials, geometric parameters, and external loads—that influence the mechanical behavior of inclined shaft linings, this study establishes the governing parametric equations:
F(B, H, R, t1, t2, Ec, μc, fc, ε, PX, PY) = 0
where: B—Outer half-span of the shaft lining/m; H—Inner sidewall height of the shaft lining/m; R—Outer radius of the lining invert/m; t1—Thickness of the lining invert/m; t2—Thickness of the sidewalls and crown of the lining/m; Ec—Elastic modulus of the lining concrete/MPa; µc—Poisson’s ratio of the lining concrete/dimensionless; fc—Uniaxial compressive strength of the lining concrete/MPa; ε—Strain of the lining concrete/dimensionless; PX—External load in the X-direction/MPa; PY—External load in the Y-direction/MPa.
Through factorization, the following results are obtained:
Constant Criterion:
π1 = επ2 = μc
Geometric Criterion:
π3 = t1/B, π4 = H/B, π5 = t2/B, π6 = t2/B
Mechanical Criterion:
π7 = PX/Ec, π8 = PY/Ec, π9 = fc/Ec
Dimensionless Criterion:
π1 = ϕ(π2,π3,π4,π5,π6,π7,π8,π9)

3.1.2. Model Geometric Parameters

In this study, the prototype shaft lining corresponds to the D4A-D4A cross-section of the main inclined shaft in Macheng Iron Mine, Tangshan City, Hebei Province, China. The prototype lining length is set to 6 m. To investigate its stress-deformation behavior, strain gauges are installed on the lining’s inner surface. Considering experimental practicality and model size constraints, the outer half-span (B) of the lining is determined as 120 mm. The dimensional parameters of both prototype and model linings are summarized in Table 1.
In practical engineering, the surrounding rock thickness of prototype shaft linings is substantial. Therefore, thicker model surrounding rock better replicates actual prototype conditions. Considering practical constraints and experimental setup limitations, numerical simulations using ANSYS software were conducted to analyze the errors in inner and outer edge strains of the shaft lining relative to reference values when the ratio of surrounding rock radius (r) to inner diameter of the lining crown (d) varies between 1 and 10. The results are shown in Figure 4. Typically, a 10-fold surrounding rock model approximates real-world conditions more closely and was thus used as the reference. The analysis reveals that larger surrounding rock ranges reduce errors in circumferential strains at the lining edges. At r/d = 1, significant discrepancies exist between measured and reference strains. When r/d = 1.5, these errors decrease markedly. Consequently, an r/d ratio of 1.5 was selected for the shaft lining model tests.

3.1.3. Model Mechanical Parameters

The mechanical parameters of the model are consistent with those of the prototype, as shown in Table 2.

3.2. Physical Model Test Instrument and Process

To achieve horizontal non-uniform loading, the experimental setup shown in Figure 5, includes the following components from the inside out: the model shaft lining, surrounding rock, and loading steel plates capable of applying differential loads in the X and Y directions. Each steel plate surface uses a 100 T hydraulic jack for pressure control, enabling combined horizontal and vertical non-uniform loading on the inclined shaft lining. Strain monitoring combines distributed optical fibers (detailed in Section 2.1) with BQ120-10AA strain gauges from Zhonghang Electric Measurement. Temperature compensation was achieved using embedded copper-constantan thermocouples, with data collected through a DT85G data logger from Australia.
The test procedure was conducted as follows: (1) Fiber Pre-installation. Optical fibers were attached to planned positions in the mold using low-viscosity double-sided tape. Hotspot identification ensured accurate alignment of each test segment. (2) Shaft Lining Casting. The concrete shaft lining model was cast using molds. Three 100 × 100 × 100 mm concrete cubes and three 100 × 100 × 300 mm concrete prisms were also cast. (3) Demolding and Curing. After 24 h, the shaft lining model was demolded-inner molds first, then outer molds. The model and specimens were cured under natural conditions for 7 days. (4) Strain Gauge and Thermocouple Installation: Strain gauges and thermocouples were installed at planned locations along the inner edge of the shaft lining. (5) Surrounding Rock Casting: Cement mortar porous surrounding rock was cast around the shaft lining. Each layer was compacted equally to ensure uniformity. (6) Surrounding Rock Curing and Demolding: The surrounding rock was cured for 5 days under natural conditions, then demolded. (7) Preloading Test: Apply synchronous graded loading in the X and Y directions, the X-direction confining pressure was 0.2 MPa, and the Y-direction confining pressure was 0.22 MPa; (8) Elastoplastic loading Test: Apply synchronous graded loading in the X and Y directions until shaft wall failure, with a loading gradient of 0.24 MPa in the X direction and 0.4 MPa in the Y direction. (9) Data Collecting: The shaft lining model was placed in the loading apparatus. Sensors were connected to the data acquisition system, and data collection began. (10) Test Recording: Crack development in the shaft lining was observed, and data were saved. (11) Elastic Modulus and Poisson’s Ratio Testing: Specimens cast with the shaft lining were tested under compression to measure elastic modulus and Poisson’s ratio. Surrounding rock specimens were tested using the same method.

3.3. Results and Analysis of Shaft Lining Test

3.3.1. Analysis of No. 1 Shaft Lining Test Data

In this test, the circumferential optical fibers were distributed along the inner and outer edges of the shaft lining. The measurement points and test results are shown in Figure 6. As seen in Figure 6b, the temperature variation of the shaft lining model remained within 1 °C throughout the test, indicating a minimal impact on fiber optic measurements (20–30 με). Compared to the overall test data, this temperature effect is negligible. Therefore, temperature fluctuations did not significantly interfere with strain measurements during the experiment.
Throughout this article, the term “location” on the horizontal axis of all figures denotes the measured distance (m) to the reference point along the shaft lining section.
Figure 6c shows the strain monitoring results of the fiber at the inner edge of the shaft lining. The data demonstrate that the fiber can fully monitor strain changes along the inner edge. At points B and F, cracks appeared and expanded as loading increased. However, despite crack growth, the shaft lining itself did not fail (As shown in Figure 7). This provides direct evidence of the potential of distributed fiber optics for crack monitoring in shaft linings, highlighting its practical engineering value. Similarly, Figure 6d shows that the fiber also provides complete strain coverage at the outer edge of the shaft lining. Cracks formed and expanded in segments IJ and LG, but due to the surrounding rock, these cracks were not visible on the surface. This suggests that the mechanical properties of the surrounding rock may affect crack visibility at the outer edge. Fiber optic technology still faces challenges in such applications, especially in areas where cracks cannot be directly observed.
Comparing Figure 6e,g, the measurements from strain gauges and fiber optics showed differences of less than 200 µε in most cases, indicating strong agreement. However, significant discrepancies were observed in Figure 6f,h, especially at crack locations. Specifically, in Figure 6f, the strain gauge and fiber optic measurements exhibited opposite trends. This mismatch likely resulted from fiber slippage at cracked areas, causing deviations between the actual strain values and the measured data. In Figure 6h, after 1200 s, measurement errors between the fiber and strain gauges increased significantly. This suggests that crack propagation caused fiber displacement, reducing data accuracy in later testing stages.
Although the test achieved full-section strain monitoring of the shaft lining’s inner and outer edges using fiber optics, significant deviations from theoretical predictions were observed. Notably, at crack locations, strain gauge and fiber optic measurements showed clear discrepancies. These errors may result from large gaps between the outer edge of the shaft lining and the surrounding rock. These gaps could cause the surrounding rock to bear a larger portion of the load, while the shaft lining experiences relatively smaller forces. As a result, strain changes in the shaft lining may appear slower, failing to reflect the true mechanical interaction between the surrounding rock and the shaft lining. To test this hypothesis, a comparative experiment was added to the No. 2 shaft lining model tests. Loading tests were conducted on models with polytetrafluoroethylene (PTFE) plates to study the potential impact of mechanical differences between the shaft lining and surrounding rock.

3.3.2. Analysis of No. 2 Shaft Lining Test Data

The strain curves of the inner edge of the shaft lining for two test groups are shown in Figure 8.
In this experiment, axial and circumferential optical fibers were installed along the inner and outer edges of the shaft lining for comprehensive strain monitoring. Figure 8a,b show the strain curves of the fibers at the inner edge for the first and second test groups. In the tests without PTFE plates, significant measurement errors were observed, especially in the strain variations of the FE segment, which showed notable fluctuations. In the first test group, large deviations occurred in multiple areas, reflecting uneven stress distribution during loading. This unevenness may result from interactions between the outer edge of the shaft lining and the surrounding rock. In contrast, after adding PTFE plates in the second test group, measurements stabilized in most areas, showing clear compressive strain characteristics. In the FE segment, the fiber measurements indicated a tensile strain of 800 µε, suggesting significant stress changes in this region. These results confirm the hypothesis explaining the large errors in the No. 1 model tests.
Detailed results of the No. 2 shaft lining loading test are shown in Figure 9, including temperature changes, fiber optic strain monitoring, and comparisons between fiber optics and strain gauges. According to Figure 9b, the temperature variation remained within 1 °C throughout the test, ensuring reliable strain measurements. Figure 9c demonstrates that the fiber optics fully monitored strain changes at the inner edge of the shaft lining. Larger compressive strains were observed at points E and C, and the EF segment showed a tendency for cracking, although no actual cracks were observed. This indicates that fiber optics can detect minor deformations before cracks become visible. In the strain monitoring of the outer edge, Figure 9d shows that the fiber optics effectively monitored the entire cross-section. No significant tensile strain zones were observed, consistent with the stress distribution during loading.
Figure 9e,g show good agreement between fiber optic and strain gauge measurements, with small errors. However, in Figure 9f, the fiber optic measurements slightly exceeded those of the strain gauge. This discrepancy may result from the large spacing between Strain Gauge 2 and the fiber, combined with excessive adhesive, which reduced the strain gauge readings. Figure 9h demonstrates the fiber optic response during shaft lining cracking. After installing PTFE plates, the stress transitioned from tensile to compressive zones. The fiber consistently recorded positive strains, likely due to fiber slippage caused by cracking, indicating reduced accuracy in reflecting actual deformations during this phase. In Figure 9i, the axial strain curve shows values exceeding 110 µε, confirming that the shaft lining behaves under plane stress conditions. The negative values and reverse strain trends in Strain Gauge 4 validate crack formation, aligning with fiber optic data and improving crack location accuracy. These results confirm the effectiveness of fiber optics for strain monitoring in shaft linings, particularly for crack detection. However, factors like cracking-induced fiber slippage may limit accuracy in certain cases.
Axial and radial strain curves at different key points during the second loading test of the NO. 2 shaft lining model are shown in Figure 10. According to Figure 10b,e, the axial strain at point b showed tensile behavior, increasing gradually as the test progressed. This aligns with the expected increase in stress at this point during loading. In contrast, Figure 10c,d show compressive strain at point a, which also increased over time. This suggests cracking at point a. However, no tensile strain was detected by the circumferential fiber optics, likely because the cracks did not reach the fiber installation area. For radial strain, Figure 10f–j show compressive strains at all measurement points, which gradually increased with loading. This aligns with the radial compressive deformation of the shaft lining under stress and matches the actual stress distribution during loading. These data agree with theoretical predictions of compressive strain distribution, demonstrating the elastic behavior of the shaft lining under load. Although the fiber optics failed to detect early-stage cracking at point a, changes in axial and radial strains provided critical insights into the shaft lining’s stress state. The progressive increase in radial compressive strain reflects interactions between the shaft lining and surrounding rock, as well as the material’s elastic response. These findings offer empirical support for shaft lining design and crack prediction.

3.3.3. Analysis of No. 3 Shaft Lining Test Data

The test involved the installation of optical fibers along both the inner and outer edges of the shaft lining in axial and hoop orientations. PTFE plates were placed between the surrounding rock and the shaft lining, with the gaps between the PTFE plates and steel plates filled with fine sand. The test results are shown in Figure 11. First, Figure 11b shows that the temperature variation during the test was controlled within 0.5 °C, ensuring the reliability of fiber optic monitoring. As indicated in Figure 11c, the optical fibers achieved comprehensive strain monitoring at the inner edge of the shaft lining. Notably, significant compressive strain was measured at Points E and C, while tensile strain approaching 400 με was detected near Point A, suggesting localized cracking. However, despite the detected tensile strain, no visible cracks were observed, highlighting the capability of distributed optical fibers to capture micro-strain changes during early-stage cracking, which is critical for practical shaft lining monitoring. In contrast, Figure 11d demonstrates full-section strain monitoring at the outer edge of the shaft lining, where no significant tensile strain was observed, aligning with theoretical predictions. Data from Figure 11f–h reveals close agreement between strain gauge and fiber optic measurements, validating the accuracy of fiber optic technology in shaft lining strain monitoring. However, Figure 11e indicates that near Strain Gauge 1, fiber slippage occurred during cracking, resulting in lower fiber measurements compared to strain gauge values. This suggests that fiber slippage due to cracking may compromise measurement precision in fractured zones. Figure 11i shows that the axial strain of the shaft lining exceeded 100 με, supporting the suitability of plane stress state analysis for this structure. After filling with fine sand, the measured axial strain closely matched theoretical values, further confirming the stress state consistency. Overall, the optical fibers effectively monitored strain across both inner and outer edges of the shaft lining, with results consistent with strain gauge data. However, minor discrepancies in cracked regions were attributed to potential fiber slippage. Errors in OFDR measurements caused by slippage are inevitable.

4. Numerical Simulation of Inclined Shaft Lining

4.1. Numerical Calculation Model

The Group No. 3 model test is simulated using ANSYS software. Based on experimental results, the numerical simulation is compared with physical measurements to further validate the measurement capability of OFDR technology for strain.

4.1.1. Basic Assumptions

To facilitate the analysis, the following fundamental assumptions are adopted for the model:
(1) The shaft lining is a homogeneous, continuous, isotropic medium with small deformations.
To ensure safety, the shaft lining must always remain in an elastic state during service. Furthermore, strength verification based on elastic analysis results generally provides a conservative safety margin. In fact, concrete is a multiphase heterogeneous material.
(2) The self-weight of the shaft lining is negligible during burial.
For deeply-buried inclined shaft lining, the in-situ earth pressure and pore water pressure constitute the primary loads, where neglecting the self-weight of the shaft lining does not introduce significant errors.
(3) Plane analysis follows the generalized plane strain model.
Extensive research findings demonstrate that both the inclined shaft lining and surrounding rock exist in a state of plane strain. The plane strain model will fail when axial deformation is present and cannot simulate end effects.
(4) Three-dimensional analysis follows the generalized plane stress model.
The three-dimensional model analysis, when simplified using a plane stress model, is not applicable to cases with significant axial loads and neglects end effects at the shaft lining boundaries.

4.1.2. Establishment of Model

The simulation is conducted using an axisymmetric model. The geometric model dimensions and material parameters of the well wall model are listed in Table 3 and Table 4, respectively, are consistent with those of the No. 3 model test.
Following the completion of the Group No. 3 model test, material specimens are extracted for comprehensive analysis, as shown in Figure 12. The elastic modulus and Poisson’s ratio of the concrete specimens cast with the shaft lining are 15.971 GPa and 0.289, respectively. For the surrounding rock specimens, these values are 13.809 GPa and 0.221.
The stiffer surface is selected as the target surface. Based on the above configurations, both plane and 3D finite element models are established. In the 2D finite element model, quadrilateral elements PLANE82 are used for meshing, while in the 3D finite element model, hexahedral elements SOLID45 are employed for meshing. Both plane and three-dimensional models were established, as shown in Figure 13.
A load of 4 MPa is applied in the Y-direction, and 2.4 MPa in the X-direction, on the simulated model.

4.2. Results and Analysis of Numerical Simulation

Two types of models, planar and three-dimensional, were established as shown in Figure 14. The contact model establishes mechanical interaction between the shaft lining and surrounding rock, whereas the non-contact model omits such interface behavior. The fundamental distinction lies in whether to consider the rock-lining interaction-neglecting this effect may lead to significant deviations from actual field conditions. As shown in Figure 14a, except for the invert and sidewall areas where the plane model strain exceeds that of the 3D non-contact model, strains in other locations are nearly identical between the 3D and plane models. Due to reduced stress concentration in contact models, the 3D contact model exhibits the smallest strain. Figure 14b shows that at the crown, strains decrease in the following order: 3D contact model, 3D non-contact model, plane non-contact model, and plane contact model. At the invert, the strain trend of the 3D contact model is completely opposite to the other three models.
Calculations confirm that the plane contact model aligns with theoretical predictions, making it suitable for analysis. Comparative results for the No. 3 shaft lining are shown in Figure 15 and Figure 16.
As shown in Figure 15, fiber optic measurements at the inner edge of the shaft lining generally align with theoretical predictions. Minor deviations at certain points may result from errors in dimensions, installation, or other factors. The large tensile strain at point A is likely caused by dimensional differences, casting issues, or gaps between the surrounding rock and loading plates. Except for point A, most fiber optic measurements closely match numerical simulation results. This confirms that fiber optics can effectively monitor strain across the entire inner edge of the shaft lining.
As shown in Figure 16, fiber optic measurements at the outer edge of the shaft lining generally align with theoretical predictions. Minor deviations at certain points may result from errors in dimensions, installation, or other factors. The large compressive strain at point G, which contradicts numerical simulation results, is likely caused by dimensional differences, casting issues, or gaps between the surrounding rock and loading plates. Except for point G, most fiber optic measurements closely match numerical simulation results. This confirms that fiber optics can effectively monitor strain across the entire outer edge of the shaft lining.
In summary, numerical simulations and model test results are largely consistent. Minor discrepancies may arise from issues such as mold imperfections, installation errors, gaps between the surrounding rock and loading plates, or cracking in the shaft lining.

5. Conclusions

This study investigated the mechanical deformation behavior of a model shaft lining under simulated non-uniform ground pressure by applying differential loads in the X and Y directions. Distributed fiber optic sensing based on OFDR technology was utilized to explore strain transfer characteristics in the model test. Key findings are summarized below:
(1) Comparison demonstrates strong agreement between OFDR technology and strain gauge measurements in axial strain monitoring of shaft linings.
OFDR technology enabled full cross-section monitoring of the inner and outer edges of the shaft lining, with generally accurate results.
(2) OFDR technology has the ability to detect some cracks in shaft lining that cannot be identified by the human eye.
(3) The composite filling of a PTFE plate and fine sand at the interface between the model shaft lining and the surrounding rock can produce model shaft linings whose deformation characteristics closely match those of the prototype.
(4) During fiber installation, adhesive-sealed plastic tubes are used at the inter-face between the shaft lining and air to protect the fibers from environmental effects and prevent signal attenuation or damage caused by bending or compression. Additionally, the bending radius of the fibers can be maintained above 1 cm to ensure proper functionality. Embedding distributed fibers in the shaft lining mold allowed comprehensive monitoring of axial, circumferential, and radial strains, providing precise data for structural health monitoring and maintenance.
The test results have some errors in the crack location range, and the optical fiber measurement has a certain weakening in the location of the stress concentration in the shaft lining, this is a limitation of the study. How to use optical fiber to measure the three-dimensional strain at any point of the well wall and realize the quantitative analysis of random cracks is the future development direction of this technology. Automation methods have become an indispensable part of modern engineering testing, significantly improving testing efficiency, coverage, and reliability. Adopting automation methods is highly beneficial for the analysis of inclined shaft lining test results, representing a future trend in testing research. We will strive to apply automation methods in subsequent studies [49,50].

Author Contributions

Conceptualization, W.Y. (Weihao Yang) and Z.Y.; methodology, T.L. and Z.Y.; validation, W.Y. (Wenjie Yao) and W.Y. (Weihao Yang); formal analysis, W.Y. (Wenjie Yao), T.L. and Z.Y.; investigation, W.Y. (Wenjie Yao); resources, W.Y. (Weihao Yang); data curation, W.Y. (Wenjie Yao), T.L. and Z.Y.; writing—original draft preparation, W.Y. (Wenjie Yao), T.L.and Z.Y. writing—review and editing, T.L., W.Y. (Weihao Yang) and Z.Y.; visualization, W.Y. (Wenjie Yao) and T.L.; supervision, W.Y. (Weihao Yang) and Z.Y.; project administration, W.Y. (Weihao Yang); funding acquisition, W.Y. (Weihao Yang). All authors have read and agreed to the published version of the manuscript.

Funding

This study was supported by the National Key Research and Development Program of China (grant NO. 2016YFC0600904).

Institutional Review Board Statement

Not applicable.

Informed Consent Statement

Not applicable.

Data Availability Statement

The data presented in this study are available on request from the corresponding author.

Conflicts of Interest

The authors declare no conflict of interest.

References

  1. Zhou, Z.Q.; Niyaz, R. Cross regional agglomeration and flow of large provincial state-owned coal enterprises in China based on an analytical framework of scale reorganization. J. China Univ. Min. Technol. (Soc. Sci.) 2023, 25, 109–122. [Google Scholar]
  2. Wang, G.F.; Pang, Y.H. Review of coal industry development and super coal mine construction. Coal Eng. 2024, 56, 1–11. [Google Scholar]
  3. Hu, J. The utilization status, supply and demand pattern, and development trend of global coal resources. China Coal 2024, 50, 153–162. [Google Scholar]
  4. Peng, W.Q.; Feng, S.H. Research on the support technology for deep large-section refuge chambers in broken surrounding rock in a roadway. Appl. Sci. 2024, 14, 7527. [Google Scholar] [CrossRef]
  5. Yang, Z.J.; Chen, Y.L.; Luo, T.T.; Han, T.; Jia, C.W.; Zhang, T.; Yang, W.H. Experimental study on the strength characteristics of cast-in-situ mortar specimens in a slurry environment. Appl. Sci. 2024, 14, 11225. [Google Scholar] [CrossRef]
  6. Wang, J.X.; Abbasi, N.S.; Pan, W.Q.; Alidekyi, S.N.; Li, H.; Ahmed, B.; Asghar, A. A review of vertical shaft technology and application in soft soil for urban underground space. Appl. Sci. 2025, 15, 3299. [Google Scholar] [CrossRef]
  7. Qi, Y.; Liu, B.G.; Shi, X.M.; Wang, Y. Stability study of inclined shield tunnels under deep mining. Chin. J. Rock Mech. Eng. 2018, 37, 3584–3592. [Google Scholar]
  8. Wang, Y.S.; Yang, R. Monitoring and analysis of the stress and deformation of shaft lining and the influence of freezing tube fracture in deep topsoil. Cold Reg. Sci. Technol. 2022, 193, 103420. [Google Scholar] [CrossRef]
  9. Liu, Z.Q.; Song, C.Y.; Cheng, S.Y.; Jing, G.Y.; Gao, W.; Li, S.S. Seventy years innovation development and popularization practice of coal mine construction technology and equipment in China. Coal Sci. Technol. 2024, 52, 65–83. [Google Scholar]
  10. Tang, X.G. Grouting Method Application in the Vertical Shaft of Coalmine Construction Rich Water Area. Ph.D. Thesis, Shijiazhuang Tiedao University, Shijiazhuang, China, 2016. [Google Scholar]
  11. Hoek, E.; Guevara, R. Overcoming squeezing in the yacambu-quibor tunnel, venezuela. Rock Mech. Rock Eng. 2009, 42, 389–418. [Google Scholar] [CrossRef]
  12. Zhu, A.Y.; Wang, Q.F.; Li, C.W.; Wang, C.H. Research on the prediction of death number in coal mine accidents under the rapid increase of coal production. J. China Coal Soc. 2024, 49, 340–347. [Google Scholar]
  13. Sun, J.L.; Ren, J.X.; Qiu, M.M.; Cao, H.L.; Cao, X.Y. Physical simulation test on temperature field distribution of freezing inclined shaft. Coal Sci. Technol. 2021, 49, 328–335. [Google Scholar]
  14. Fu, J.Y.; Yang, J.S.; Klapperich, H.; Wang, S.Y. Analytical prediction of ground movements due to a nonuniform deforming tunnel. ASCE Int. J. Geomech. 2016, 16, 04015089. [Google Scholar] [CrossRef]
  15. Verruijt, A. A complex variable solution for a deforming circular tunnel in an elastic half-plane. Int. J. Numer. Anal. Methods Geomech. 1997, 21, 77–89. [Google Scholar] [CrossRef]
  16. Yang, R.S.; Wang, Q.X. Elastic analysis of full stress and displacement field for inclined shaft liner subjected to non-uniform stresses. J. China Coal Soc. 2020, 45, 3726–3734. [Google Scholar]
  17. Zhou, X.M.; Ma, C.G.; Ji, H.G.; Deng, B.; Zhou, G.; Liang, H. Research on the model test system of shaft lining interacting with enclosure rock under deep and high water pressure. In Proceedings of the 2011 International Conference on Electrical and Control Engineering, Wuhan, China, 16–18 September 2011; pp. 3139–3143. [Google Scholar]
  18. Hu, C.C.; Yang, Z.J.; Han, T.; Yang, W.H. Calculation Method of the Design Thickness of a Frozen Wall with Its Inner Edge Radially Incompletely Unloaded. Appl. Sci. 2023, 13, 12650. [Google Scholar] [CrossRef]
  19. Wang, D.Y.; Qi, J.S.; Gui, G.Y.; Yang, Y.L.; Chang, J. Model test on bearing characteristics of basalt fiber-reinforced concrete lining. Adv. Mater. Sci. Eng. 2020, 2020, 3891343. [Google Scholar] [CrossRef]
  20. Wang, Q.X. Study on the Stress and Deformation Law of Inclined Shaft Frozen Wall and Shaft Lining During Freezing Sinking. Ph.D. Thesis, China University of Mining and Technology, Xuzhou, China, 2014. [Google Scholar]
  21. Zhang, X. Development and Test of Mechanical Simulation System for Inclined Shaft Frozen Wall in Pore-Water Bedrock. Ph.D. Thesis, China University of Mining and Technology, Xuzhou, China, 2015. [Google Scholar]
  22. Xu, L. Research on the Stress Law of Inclined Shaft Lining in Surface Soil During Frozen Wall Thawing Process. Ph.D. Thesis, China University of Mining and Technology, Xuzhou, China, 2015. [Google Scholar]
  23. Zhang, H.Q. Study on the Variation Rule of Stress and Deformation of Inclined Shaft Lining Under Local Uniform Pressure. Ph.D. Thesis, China University of Mining and Technology, Xuzhou, China, 2015. [Google Scholar]
  24. Zhou, T.J.; Zhou, G.Q.; Liao, B.; Zhang, H.Y.; Lai, Z.J.; Tao, X.L. Three-dimensional photoelasticity model test of inclined shaft on stress distribution in thick sand soil layer. J. China Coal Soc. 2017, 42, 1979–1986. [Google Scholar]
  25. Wang, Y. Study on Mechanical Law and Design Theory of Inclined Freezing Shaft Lining in Topsoil. Ph.D. Thesis, China University of Mining and Technology, Xuzhou, China, 2016. [Google Scholar]
  26. Chen, P.F. Study on the Mechanical Property of Steel Reinforced Concrete Composite Floor of Inclined Shaft Lining in Deep Water-Rich Bed Rock. Ph.D. Thesis, China University of Mining and Technology, Xuzhou, China, 2016. [Google Scholar]
  27. Ren, J.X.; Sun, J.L.; Zhang, K.; Wang, J.; Wang, D.X. Mechanical properties and temperature field of inclined frozen wall in water-rich sand stratum. Rock Soil Mech. 2017, 38, 1405–1412. [Google Scholar]
  28. Ren, J.X.; Sun, J.L.; Zhang, K.; Dong, X.H.; Song, Y.J. In-situ measurement on stress of frozen inner and outer inclined shaft lining in water-rich sand stratum. J. Xi’an Univ. Sci. Technol. 2017, 37, 784–789. [Google Scholar]
  29. Zhang, W. Mechanical Law of Single-Layer Inclined Shaft Lining Constructed by Freezing Method in Aqueous Porousstable Strata. Ph.D. Thesis, China University of Mining and Technology, Xuzhou, China, 2019. [Google Scholar]
  30. Zhang, L. Study on Influence of Drainage in Water Rich Sandstone Stratum on Mechanical Characteristics of Shield Inclined Shaft Segment Structure in Coal Mine. Ph.D. Thesis, Beijing Jiaotong University, Beijing, China, 2020. [Google Scholar]
  31. Ma, T.S.; Wang, H.N.; Yang, Y.; Peng, N.; Liu, Y. Wellbore fracture regularity of inclined wells in anisotropic formation under different in-situ stress states. J. Cent. South Univ. New (Sci. Technol.) 2022, 53, 1123–1135. [Google Scholar]
  32. Jiang, M.; Yin, Z.Y. Analysis of stress redistribution in soil and earth pressure on tunnel lining using the discrete element method. Tunn. Undergr. Space Technol. 2012, 32, 251–259. [Google Scholar] [CrossRef]
  33. Meguid, M.A.; Saada, O.; Nunes, M.A.; Mattar, J. Physical modeling of tunnels in soft ground: A review. Tunn. Undergr. Space Technol. 2008, 23, 185–198. [Google Scholar] [CrossRef]
  34. Di Murro, V.; Pelecanos, L.; Soga, K.; Kechavarzi, C.; Morton, R.F.; Scibile, L. Long-term deformation monitoring of CERN concrete-lined tunnels using distributed fibre-optic sensing. Geotech. Geol. Eng. 2019, 50, 1–7. [Google Scholar]
  35. Metje, N.; Chapman, D.N.; Rogers, C.D.F.; Henderson, P.; Beth, M. An optical fiber sensor system for remote displacement monitoring of structures-prototype tests in the laboratory. Struct. Health Monit. 2008, 7, 51–63. [Google Scholar] [CrossRef]
  36. Moffat, R.; Sotomayor, J.; Beltrán, J.F. Estimating tunnel wall displacements using a simple sensor based on a Brillouin optical time domain reflectometer apparatus. Int. J. Rock Mech. Min. Sci. 2015, 75, 233–243. [Google Scholar] [CrossRef]
  37. Xu, G.W.; He, C.; Yang, Q.H.; Wang, B. Progressive failure process of secondary lining of a tunnel under creep effect of surrounding rock. Tunn. Undergr. Space Technol. 2019, 90, 76–98. [Google Scholar] [CrossRef]
  38. Xu, G.W.; Wang, B.; Ma, G.Y.; Du, J.M.; Chen, X.; Hou, Z.K. Study on the damage evolutional process of secondary tunnel lining under rheological effect of surrounding rock. Eng. Fail. Anal. 2022, 142, 106758. [Google Scholar] [CrossRef]
  39. Song, W.L.; Lai, H.P.; Liu, Y.Y.; Yang, W.H.; Zhu, Z.D. Field and laboratory study of cracking and safety of secondary lining for an existing highway tunnel in loess ground. Tunn. Undergr. Space Technol. 2019, 88, 35–46. [Google Scholar] [CrossRef]
  40. Zhang, C.P.; Min, B.; Wang, H.L.; Zhang, S.L. Mechanical properties of the tunnel structures with cracks around voids behind linings. Thin-Walled Struct. 2022, 181, 110117. [Google Scholar] [CrossRef]
  41. Min, B.; Zhang, C.P.; Zhang, X.; Wang, H.L.; Li, P.F.; Zhang, D.L. Cracking performance of asymmetric double-arch tunnels due to the voids behind linings. Thin-Walled Struct. 2020, 154, 106856. [Google Scholar] [CrossRef]
  42. Lu, J.F.; Zhang, X.G.; Sun, Y.; Jiao, F.S.; Fan, Y.Q.; Zhou, Y.L. Study on deformation laws of inclined shaft with different filling rates during coal paste filling mining in industrial square. China Min. Mag. 2025, 34, 183–193. [Google Scholar]
  43. Xu, H.G.; Yang, S.; Wang, X.D. Large deformation and failure mechanism of deep sub-inclined shaft and its control technology. Coal Eng. 2023, 55, 52–57. [Google Scholar]
  44. Chouhan, K.; Chavda, J.T. A novel approach to simulate cone penetration test using conventional FEM. Geotech. Geol. Eng. 2023, 41, 1439–1451. [Google Scholar] [CrossRef]
  45. Zhuo, B.; Wang, F.; Fang, Y.; Chen, Y.; Ning, G.X. Analysis of cracking development and mechanical characteristics of high-filled cut-and-cover tunnel. KSCE J. Civ. Eng. 2020, 24, 2519–2532. [Google Scholar] [CrossRef]
  46. Wu, J.M.; Xie, H.Q.; Zhuo, L.; Xiao, M.L.; Liu, H.Z. Study of strain testing based on OFDR distributed fiber optie sensor. J. Exp. Mech. 2022, 37, 234–242. [Google Scholar]
  47. Qu, S. Research on Data Processing and Performance Improvement Based on OFDR Distributed Optic-Fiber Sensing System. Ph.D. Thesis, Shandong University, Jinan, China, 2022. [Google Scholar]
  48. Chen, G. Research on Multi-Point and Multi-Frequency Distributed Vibration Detection Based on Optical Frequency Domain Reflectometer. Ph.D. Thesis, Zhejiang University, Hangzhou, China, 2022. [Google Scholar]
  49. Du, J.W.; Wu, F.; Xing, R.X.; Li, J.H.; Gong, X.Y. An automated approach to coastline simplification for maritime structures with collapse operation. Mar. Geod. 2021, 44, 157–195. [Google Scholar] [CrossRef]
  50. Pietersen, R.A.; Beauregard, M.S.; Einstein, H.H. Automated method for airfield pavement condition index evaluations. Autom. Constr. 2022, 141, 104408. [Google Scholar] [CrossRef]
Figure 1. Application diagram of optical fiber in inclined shaft lining.
Applsci 15 05718 g001
Figure 2. Fiber Embedment Test Procedure: (a) Fiber protection using plastic tubes; (b) Fiber layout configuration; (c) Concrete curing monitoring.
Applsci 15 05718 g002
Figure 3. Fiber optic test results: (a) Strain curve of the full-length fiber; (b) Strain variation over time at specific points.
Applsci 15 05718 g003
Figure 4. Deviation of Strain at Inner/Outer Edges of Shaft Lining from Reference Values under Different r/d Ratio: (a) Inner Edges; (b) Outer Edges.
Applsci 15 05718 g004
Figure 5. Schematic diagram of physical simulation experiment loading model.
Applsci 15 05718 g005
Figure 6. Test results for the NO. 1 shaft lining: (a) Key point numbering of the shaft lining model; (b) Temperature variation during the test; (c) Strain curve at the inner edge of the shaft lining; (d) Strain curve at the outer edge of the shaft lining; (e) Comparison of circumferential strain between Strain Gauge 1 and fiber optic measurements; (f) Comparison of circumferential strain between Strain Gauge 2 and fiber optic measurements (crack location); (g) Comparison of circumferential strain between Strain Gauge 3 and fiber optic measurements; (h) Comparison of circumferential strain between Strain Gauge 4 and fiber optic measurements (crack location).
Applsci 15 05718 g006
Figure 7. The cracking failure mode of shaft lining model: (a) The cracking location near point F on the NO. 1 shaft lining model; (b) The cracking location near point B on the NO. 1 shaft lining model.
Applsci 15 05718 g007
Figure 8. Strain curves at the inner edge of the No. 2 shaft lining: (a) First test group; (b) Second test group.
Applsci 15 05718 g008
Figure 9. Test results for the first loading trial of the No. 2 shaft lining: (a) Key point numbering of the shaft lining model; (b) Temperature variation during the test; (c) Circumferential strain curve at the inner edge of the shaft lining; (d) Circumferential strain curve at the outer edge of the shaft lining; (e) Comparison of circumferential strain between Strain Gauge 1 and fiber optic measurements; (f) Comparison of circumferential strain between Strain Gauge 2 and fiber optic measurements; (g) Comparison of circumferential strain between Strain Gauge 3 and fiber optic measurements; (h) Comparison of circumferential strain between Strain Gauge 4 and fiber optic measurements (crack location); (i) Axial strain-time curve of Strain Gauge 4.
Applsci 15 05718 g009aApplsci 15 05718 g009b
Figure 10. Test results for the second loading trial of the NO. 2 shaft lining: (a) Key point numbering of the shaft lining model; (b) Axial strain curve at point b on the inner edge of the shaft lining; (c) Axial strain curve at point a on the inner edge of the shaft lining; (d) Axial strain curve at point a on the outer edge of the shaft lining; (e) Axial strain curve at point b on the outer edge of the shaft lining; (f) Radial strain curve of the GA segment of the shaft lining; (g) Radial strain curve of the FL segment of the shaft lining; (h) Radial strain curve of the KE segment of the shaft lining; (i) Radial strain curve of the DJ segment of the shaft lining; (j) Radial strain curve of the IC segment of the shaft lining.
Applsci 15 05718 g010aApplsci 15 05718 g010b
Figure 11. Test results of the No. 3 shaft lining loading: (a) Key point numbering of the shaft lining model; (b) Temperature variation during the test; (c) Circumferential strain curve at the inner edge of the shaft lining; (d) Circumferential strain curve at the outer edge of the shaft lining; (e) Comparison of circumferential strain between Strain Gauge 1 and fiber optic measurements (crack location); (f) Comparison of circumferential strain between Strain Gauge 2 and fiber optic measurements; (g) Comparison of circumferential strain between Strain Gauge 3 and fiber optic measurements; (h) Comparison of circumferential strain between Strain Gauge 4 and fiber optic measurements; (i) Axial strain-time curve of the strain gauge.
Applsci 15 05718 g011aApplsci 15 05718 g011b
Figure 12. Test results for elastic modulus and Poisson’s ratio of specimens: (a) Elastic modulus test results of concrete specimens; (b) Poisson’s ratio test results of concrete specimens; (c) Elastic modulus test results of surrounding rock specimens; (d) Poisson’s ratio test results of surrounding rock specimens.
Applsci 15 05718 g012
Figure 13. Finite element model: (a) Three-dimensional spatial model; (b) Plane model.
Applsci 15 05718 g013
Figure 14. Finite element model calculation results: (a) Circumferential strain at the inner edge of the model; (b) Circumferential strain at the outer edge of the model.
Applsci 15 05718 g014
Figure 15. Comparison between fiber optic measurements and numerical simulations at the inner edge of the NO. 3 shaft lining model: (a) X = 0.48 MPa, Y = 0.8 MPa; (b) X = 0.96 MPa, Y = 0.1.6 MPa; (c) X = 1.44 MPa, Y = 2.4 MPa; (d) X = 1.92 MPa, Y = 3.2 MPa; (e) X = 2.4 MPa, Y = 4 MPa; (f) Specific point numbering of the shaft lining model.
Applsci 15 05718 g015
Figure 16. Comparison between fiber optic measurements and numerical simulations at the outer edge of the NO. 3 shaft lining model: (a) X = 0.48 MPa, Y = 0.8 MPa; (b) X = 0.96 MPa, Y = 0.1.6 MPa; (c) X = 1.44 MPa, Y = 2.4 MPa; (d) X = 1.92 MPa, Y = 3.2 MPa; (e) X = 2.4 MPa, Y = 4 MPa; (f) Specific point numbering of the shaft lining model.
Applsci 15 05718 g016aApplsci 15 05718 g016b
Table 1. Prototype shaft lining and model dimensions.
Thickness of The Sidewalls and Crown of the Lining
t2/mm
Thickness of The Lining Invert t1/mmOuter Half-Span of the Shaft Lining B/mmInner Sidewall Height of the Shaft Lining
H/mm
Outer Radius of the Lining Invert
R/mm
Inclined Length of shaft Lining
L/mm
300.3180.20.50.4
405012070155200
Table 2. Shaft lining model parameters.
Elastic Modulus of Shaft Lining
/GPa
Poisson’s Ratio of Shaft LiningElastic Modulus of Surrounding Rock
/GPa
Poisson’s Ratio of Surrounding RockAllowable Tensile Stress
/MPa
Friction Coefficient
300.3180.20.50.4
Table 3. Shaft lining model dimensions.
Thickness of the Sidewalls and Crown of the Lining
t2/mm
Thickness of the Lining Invert t1/mmOuter Half-Span of the Shaft Lining B/mmInner Sidewall Height of the Shaft Lining
H/mm
Outer Radius of the Lining Invert
R/mm
Inclined Length of Shaft Lining
L/mm
405012070155200
Table 4. Material parameters.
Elastic Modulus of Shaft Lining
/GPa
Poisson’s Ratio of Shaft LiningElastic Modulus of Surrounding Rock
/GPa
Poisson’s Ratio of Surrounding RockAllowable Tensile Stress
/MPa
Friction Coefficient
0.40.320180.20.5
Disclaimer/Publisher’s Note: The statements, opinions and data contained in all publications are solely those of the individual author(s) and contributor(s) and not of MDPI and/or the editor(s). MDPI and/or the editor(s) disclaim responsibility for any injury to people or property resulting from any ideas, methods, instructions or products referred to in the content.

