Article

Antihyperglycemic Potential of Mace Water Extract from Myristica fragrans Houtt

by
Hasbullah
1,
Fitriya Nur Annisa Dewi
2,3,
Didah Nur Faridah
4,5,
Dias Indrasti
4,5,
Nuri Andarwulan
4,5,* and
Dominika Średnicka-Tober
4,6,*
1
Faculty of Agriculture, Khairun University, Ternate 97719, North Maluku, Indonesia
2
School of Veterinary Medicine and Biomedical Science, IPB University, Bogor 16680, West Java, Indonesia
3
Primate Research Center, IPB University, Bogor 16680, West Java, Indonesia
4
Department of Food Science and Technology, Faculty of Agricultural Technology, IPB University, IPB Dramaga Campus, Bogor 16680, West Java, Indonesia
5
Southeast Asian Food and Agricultural Science and Technology (SEAFAST) Center, IPB University, IPB Dramaga Campus, Bogor 16680, West Java, Indonesia
6
Department of Functional and Organic Food, Institute of Human Nutrition Sciences, Warsaw University of Life Sciences, Nowoursynowska 159c, 02-776 Warsaw, Poland
*
Authors to whom correspondence should be addressed.
Appl. Sci. 2025, 15(10), 5706; https://doi.org/10.3390/app15105706
Submission received: 15 April 2025 / Revised: 10 May 2025 / Accepted: 16 May 2025 / Published: 20 May 2025

Abstract

:
This in vivo study was conducted to investigate the antihyperglycemic potential of the mace water extract from Myristica fragrans Houtt (ME). Oral starch and glucose tolerance tests, measurements of fasting blood glucose, glycated hemoglobin (HbA1c), body weight, water consumption, and relative weight of organs of experimental animals were performed to evaluate the effect of ME on normal rats and hyperglycemic rats induced by streptozotocin. Acutely, ME (1.84 mg total phenolics from ME/kg BW) was able to inhibit the spike in blood glucose in the oral starch and glucose tolerance tests with a lower area under the curve (AUC) value than the negative control. Streptozotocin-induced hyperglycemic rats that received ME (1.84 mg total phenolics from ME/kg BW) for 28 days also showed lower fasting blood glucose and HbA1c than negative controls, even when compared with positive controls (10 mg acarbose/kg BW). This positive effect is also supported by the results for estimated body weight, water consumption, and relative weight of organs of experimental animals. The findings in this study indicate that ME has antihyperglycemic potential in vivo and has the opportunity to be used as a functional food ingredient.

1. Introduction

Diabetes mellitus (DM) is a chronic metabolic disease that can be recognized clinically by the presence of one or more typical symptoms such as polyuria, polydipsia, polyphagia, and weight loss that does not improve. Hyperglycemia, one of the abnormal glycemic conditions that is closely related to DM, is mainly caused by endocrine pancreatic cell deficiency and/or subsensitivity to insulin in target cells [1,2]. Blood glucose, glycated hemoglobin (HbA1c), oral starch/glucose tolerance, and some other biochemical parameters can be used to evaluate glycemic status [1,3]. Globally, DM is a disease that has a high prevalence and is expected to increase from year to year [4]. Therefore, effective glycemic status management and monitoring strategies and efforts are of great importance for public health [2].
Traditionally, parts of plants have long been used as a source of medicine and have been widely studied regarding their effects on DM [1]. Their effects originate from the phytochemical compounds they contain and can be an alternative choice when synthetic antidiabetic agents cause undesirable side effects [5]. Nutmeg (Myristica fragrans Houtt) is one of the plants that has been widely used in traditional medicine [6].
Mace is the part of the nutmeg fruit (Myristica fragrans Houtt) that covers the seed shell and is generally red when the fruit is ripe. The biological activities of mace include antioxidant, anti-inflammatory, anticancer, anti-cariogenic, hepatoprotective, and osteoblast proliferation-stimulating properties [7,8]. The phytochemical compounds contained in mace include tannins, alkaloids, saponins, flavonoids, steroids/terpenoids, and quinones [9,10]. Mace also contains some lignans and neolignans, which have many pharmacological activities [11]. This group of phytochemical compounds is thought to provide antidiabetic effects, as has been reported in several studies, especially through controlling blood glucose levels [12,13,14,15,16,17,18,19,20,21,22,23,24,25].
A systematic review of the effects of nutmeg on the glycemic status of rats and mice found that mace has the potential to reduce blood glucose levels by more than 50% [3]. Giving ethyl alcohol extract of Myristica fragrans mace (400 mg/kg BW) for 10 weeks to obese Wistar rats led to the reduction of blood glucose levels by up to 60.76% [26]. Research exploring the effects of mace on glycemic status is still limited. Only two articles were found that used mace, each extracted with methanol and ethanol [26,27]. The use of organic solvents (including methanol) in the production of food products is generally limited due to safety considerations, while in vivo studies using water as a safer solvent for extracting mace are not yet available. In fact, the mace water extract (ME) in previous in vitro studies was proven to have antioxidant activity and act as an α-amylase inhibitor (IC50 DPPH RSA 2.79 ± 0.05 mg total phenolics from extract/L; FRAP 9.16 ± 0.86 g Trolox equivalent/100 g total phenolics from extract; IC50 α-amylase inhibition 360.18 ± 6.83 mg total phenolics from extract/L) [28]. Therefore, an in vivo study on the antihyperglycemic effect of mace extract extracted using water needs to be carried out to confirm the possibility of applying mace extract to safer food products. This in vivo study was conducted to investigate the antihyperglycemic potential of ME. Oral starch and glucose tolerance tests, measurements of fasting blood glucose, glycated hemoglobin (HbA1c), body weight, water consumption, and relative weight of organs (pancreas, liver, and kidney) were carried out to evaluate the effect of ME on normal and streptozotocin-induced hyperglycemic Sprague Dawley rats.

2. Materials and Methods

2.1. Sample and Extract Preparation

Sun-dried Myristica fragrans Houtt mace was obtained from Dorpedu Village, Ternate City, North Maluku Province, Indonesia. Identification of plant species was performed by Herbarium Bogoriense, Botany Research Center–Indonesian Institute of Sciences. Dried mace was blended and sieved with a 30-mesh sieve until mace powder was obtained. Mace powder was packed tightly in plastic packaging with silica gel and stored in the freezer until used.
Extraction was carried out following the method from Hasbullah et al. [28]. Mace powder (25 g) was extracted with 250 mL of distilled water (ratio 1:10) and sonicated for 30 min at 30 °C. Next, it was filtered with V60 filter paper (first filtration). The residue was re-extracted in the same way. The results of the first filtration were then filtered with Whatman No. 1 filter paper (second filtration). The filtrate obtained was concentrated using a rotary evaporator and then dried using a freeze-dryer until the dry mace water extract (ME) was obtained.

2.2. Experimental Animals

Male Sprague Dawley rats (5 weeks old) were purchased from PT. BMTI, Bogor, Indonesia, and maintained under a 12:12 h light and dark cycle at a temperature of 25 ± 2 °C. Animals were given standard feed specifically for rodents and water (distilled water) ad libitum. The standard feed used was from PT. INDO FEED with a composition of protein (20%), fat (4%), fiber (4%), ash (4%), phosphorus (0.8%), arginine (1.25%), alanine (0.9%), and water (12%) with a total energy of 2750 kcal. Animal termination in this study was carried out by exsanguination under anesthesia. All experimental protocols in this study were carried out in accordance with ethical and animal welfare principles in the use of laboratory animals and have been approved by the Animal Ethics Committee, School of Veterinary Medicine and Biomedicine, IPB University (065/KEH/SKE/VI/2023).
For calculating sample size, a resource equation approach was applied [29]. It provides a range of the minimum and maximum number of animals recommended for a study. The estimation results show that the number of animals recommended for this study is a minimum of 3 and a maximum of 5. Considering the duration of the experiment, the minimum number (n = 3) was used for acute testing (experiment duration 2 h), while the maximum number (n = 5) was used for long-term testing (experiment duration 28 days) as an effort to anticipate the occurrence of animal illness/death during the trial period.

2.3. Test of Acute Effects of Mace Water Extract

2.3.1. Oral Starch Tolerance Test

The oral starch tolerance test (OSTT) was carried out following Poovita and Parani [30]. Normal male Sprague Dawley rats (BW 191.27 ± 16.42 g) were fasted overnight and divided into five groups (n = 3). Each group received distilled water orally (negative control), 10 mg acarbose/kg BW (positive control), 37.5 mg ME/kg BW (dose A), 75 mg ME/kg BW (dose B), and 150 mg ME/kg BW (dose C). Acarbose works by inhibiting the breakdown of polysaccharides and oligosaccharides through the enzymes α-amylase and α-glucosidase. Therefore, it is more relevant for use in the OSTT, as the substrate administered to the experimental rats is starch (a polysaccharide), not glucose (a monosaccharide).
Ten minutes after drug/sample administration, blood glucose levels were measured (minute 0), and then starch (3 g/kg BW) was given orally. Blood glucose levels were measured at 30, 60, 90, and 120 min after starch administration. Peak blood glucose (PBG) was determined by observing blood glucose levels during the test time interval. The area under the curve (AUC) value was calculated using the formula:
AUC (mg/dL.hour) = (BG0 + BG30 × 0.5)/2 + (BG30 + BG60 × 0.5)/2 + (BG60 + BG90 × 0.5)/2 + (BG90 + BG120 × 0.5)/2
where BG0 is the blood glucose level before starch administration and BG30, BG60, BG90, and BG120 are blood glucose levels 30, 60, 90, and 120 min after starch administration. Dose B (75 mg ME/kg BW), which was the lowest dose with a lower AUC value than the negative control in the oral starch tolerance test, was chosen for use in the oral glucose tolerance test and antihyperglycemic test for 28 days.
The results of our previous research [28] showed that the total phenolic content of the mace water extract used in this study was 24.53 ± 2.86 mg GAE/g ME, and thus 1 mg of extract contains 0.02453 mg GAE. Therefore, the doses of 37.5 (dose A), 75 (dose B), and 150 (dose C) mg ME/kg BW correspond to 0.92 mg total phenolics from ME/kg BW (dose A), 1.84 mg total phenolics from ME/kg BW (dose B), and 3.68 mg total phenolics from ME/kg BW (dose C), respectively (i.e., 75 mg ME×0.02453 mg GAE/mg ME = 1.84 mg GAE).

2.3.2. Oral Glucose Tolerance Test

The oral glucose tolerance test (OGTT) was carried out following Ali et al. [31]. Normal male Sprague Dawley rats (BW 244.44 ± 57.06 g) were fasted overnight and divided into three groups (n = 3), had their blood glucose levels measured at 0 min, and were then given distilled water (negative control), glibenclamide (5 mg/kg BW) as a positive control, or ME (1.84 mg total phenolics from ME/kg BW) orally. Glibenclamide works by increasing insulin secretion from the pancreas, either by interacting with sulfonylurea receptors on beta cells or by affecting ATP-sensitive potassium channels, thereby enhancing insulin release. It can also increase the sensitivity of existing insulin receptors.
Rats were given a glucose load of 2 g/kg BW orally 15 min after administering the drug or sample. Blood glucose (BG) levels were measured at 30, 60, 90, and 120 min after glucose administration. Peak blood glucose (PBG) and area under curve (AUC) values were determined as in the oral starch tolerance test.

2.4. Hyperglycemic Induction

Hyperglycemia in rats was induced by intraperitoneal injection of a single dose of 50 mg streptozotocin/kg BW (dissolved in 0.1 M citrate buffer, pH 4.5) after fasting overnight. Rats with fasting blood glucose levels above 250 mg/dL on day 7 after streptozotocin injection were categorized as hyperglycemic rats and used in the next stage of the study.

2.5. Test of Long-Term Effects of Mace Water Extract

Healthy male Sprague Dawley rats (BW 271.84 ± 9.84 g) were randomly divided into five groups (n = 5). The first group included normal rats without intervention, i.e., receiving distilled water (normal control); the second group included hyperglycemic rats without intervention, i.e., receiving distilled water (negative control); the third group included hyperglycemic rats receiving 10 mg acarbose/kg BW (positive control); the fourth group included hyperglycemic rats receiving 1.84 mg total phenolics from ME/kg BW; and the fifth group included normal rats receiving 1.84 mg total phenolics from ME/kg BW.
Test samples were administered orally using a gastric probe once daily for 28 days. Fasting blood glucose and body weight were measured on days 0, 7, 14, 21, and 28. Blood glucose levels were measured using an Easy Touch blood glucose meter (Bioptik Technology Inc., Jhunan, Taiwan). HbA1c levels were measured at the end of the study period (day 28) using the HbA1c EZ 2.0 Glycohemoglobin Analyzer and test kit from BioHermes (Wuxi, China). Fasting blood glucose and HbA1c were measured using blood samples taken from a vein at the tip of the rat’s tail.
All rats were fasted overnight at the end of the experiment and were then sacrificed under anesthesia. Rat organs (pancreas, liver, and kidney) were collected and weighed.

2.6. Estimation of Body Weight, Daily Water Consumption, and Relative Organ Weights

The clinical parameters of rats were measured by observing body weight, daily water consumption, and organ weight. Organ weight was expressed in absolute weight (grams) and relative weight (%). Absolute weight refers to the weight of an organ at autopsy. Relative weight was calculated from the rat’s body weight at autopsy and the absolute weight of organs [32] with the following formula:
Relative weight (%) = (absolute weight/body weight at autopsy) × 100%

2.7. Statistical Analysis

Statistical analysis was performed with SPSS version 26. Data are presented as mean values with standard deviation (SD). Data were analyzed using one-way ANOVA, followed by Duncan’s test. The paired t-test was used to analyze the difference between fasting blood glucose and body weight of rats before and after 28 days of treatment. Statistical analysis with p < 0.05 was considered significant. Pearson’s correlation test was applied to determine the correlation between glycemic, clinical, and organ parameters of rats, and its interpretation followed Schober and Schwarte [33].

3. Results and Discussion

3.1. Oral Starch Tolerance Test

Plant extracts may contribute to the prevention of hyperglycemia by helping insulin release by β cells in the pancreatic islets of Langerhans or by inhibiting certain enzymes responsible for increasing blood glucose levels in rats [34]. The oral starch tolerance test in this study was carried out to determine the response of normal rats that received mace water extract from Myristica fragrans Houtt (ME) in various doses to the starch load administered.
The peak blood glucose (PBG) of the ME intervention groups (except dose A) was lower than the negative control and higher than the positive control (acarbose) (Figure 1a). Blood glucose levels in the groups that received the ME intervention fell after 30 min and overall did not experience a significant spike in blood glucose. A spike in blood glucose occurred in the negative control and only started to fall after the 60th minute.
The AUC value was used to evaluate the effects produced in the oral starch tolerance test. The groups that received ME intervention (except dose A) had an AUC value lower than the negative control and higher than the positive control (Figure 1b). The AUC values of the positive control and ME-treated groups were found to be 16.32%, 12.56% (ME dose B), and 4.55% (ME dose C), respectively—each lower than the negative control. The AUC value obtained in this OSTT is considered representative of the population. This is based on the results of the confidence interval analysis, which shows that the average AUC OSTT value in all treatment groups is within the range of 95% and 99% confidence intervals. Although not statistically different (p > 0.05), the results of this test showed a trend towards a positive effect of ME on the glycemic response of rats given a starch load. A dose of 1.84 mg total phenolics from ME/kg BW (dose B) was chosen for use in the next stage of the study (oral glucose tolerance test and antidiabetic test for 28 days).

3.2. Oral Glucose Tolerance Test

The oral glucose tolerance test in this study was carried out to determine the response of normal rats that received ME to the glucose load administered. The groups that received ME had PBG that was lower than the negative control and higher than the positive control that was given glibenclamide (Figure 2a). In the group treated with ME and glibenclamide (positive control), blood glucose levels fell after 30 min and continued to decline until the end of the observation. Meanwhile, blood glucose levels in the negative control spiked and only started to fall after the 90th minute.
The AUC value was used to evaluate the effects produced in the oral glucose tolerance test. The group that received the ME intervention had an AUC value lower than the negative control and higher than the positive control (Figure 2b). Compared with the negative control, the AUC value of the group given mace extract and glibenclamide (positive control) was 8.50% and 10.88% lower, respectively. Although not statistically different (p > 0.05), the average AUC OGTT values of all treatment groups are considered representative of the population well based on the analysis of 95% and 99% confidence intervals and indicates a trend towards a positive effect of ME on the glycemic response of rats given a glucose load. These results also indicate the possibility of other mechanisms played by ME in maintaining glycemic normality besides the mechanism of inhibiting starch hydrolysis.

3.3. Effect of Mace Water Extract on Blood Glucose and HbA1c

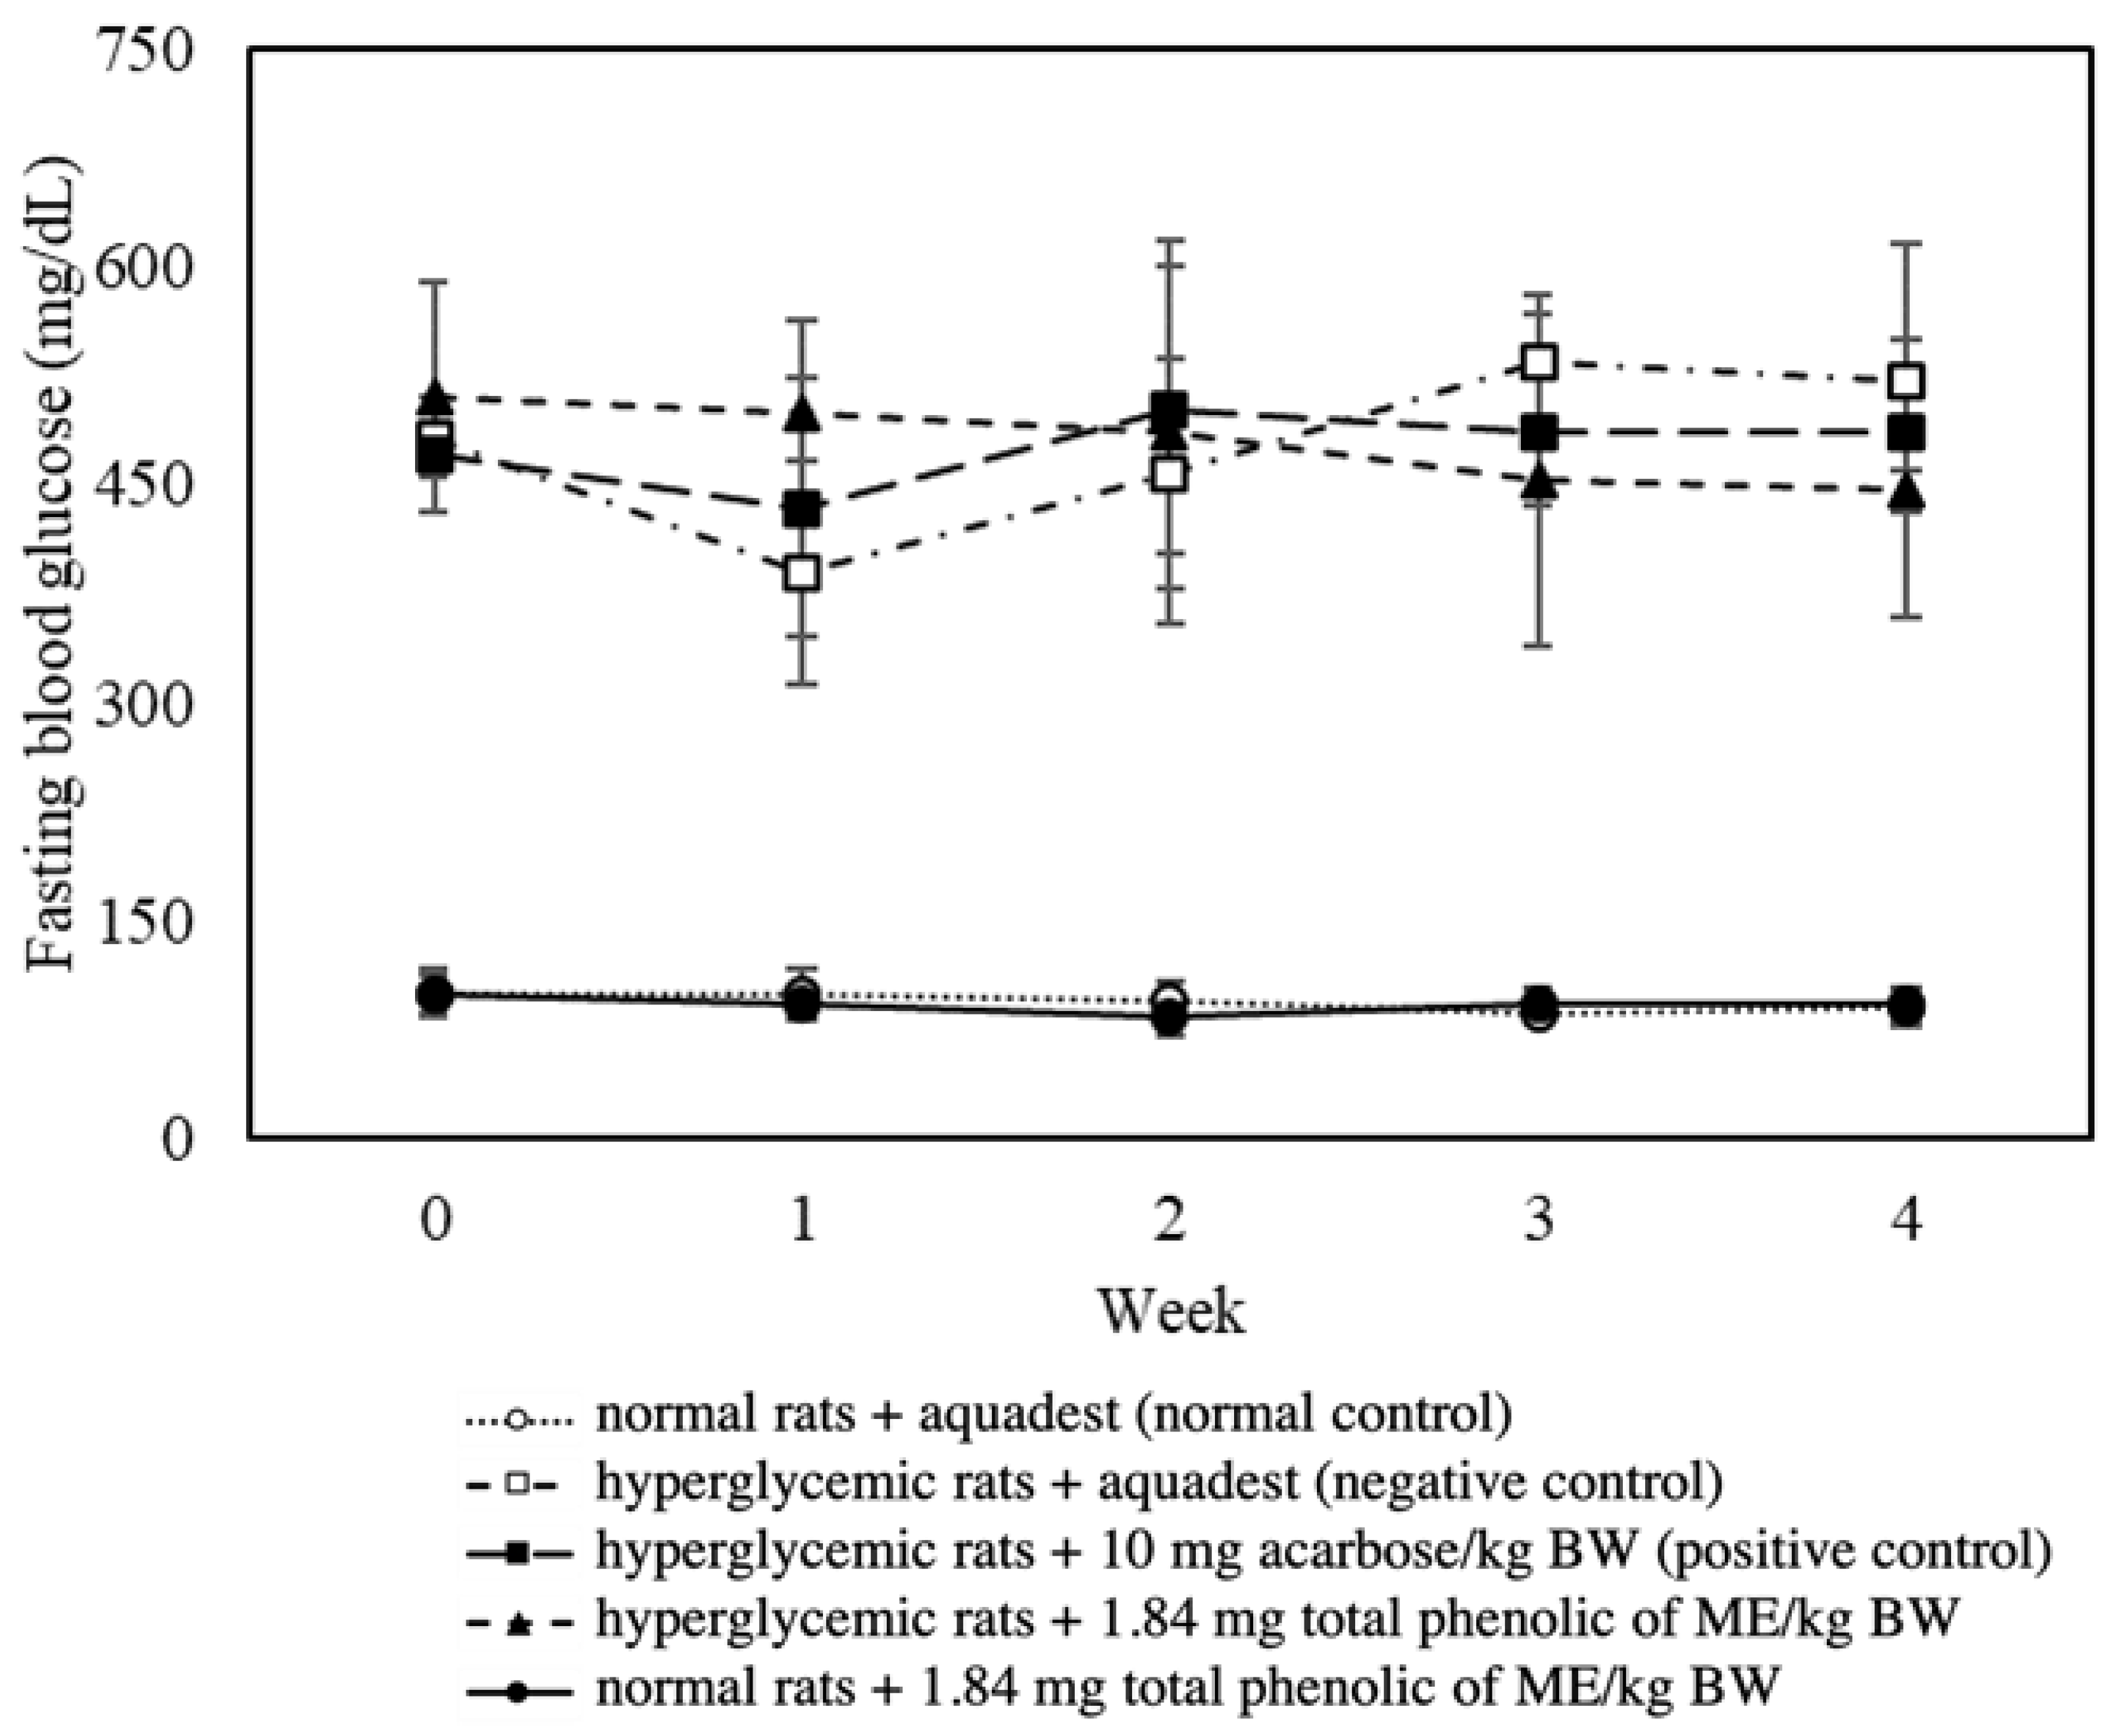
In addition to evaluating the acute effect of ME on the glycemic response of normal rats through oral starch and glucose tolerance tests, this study also investigated the long-term effects (28 days) of ME intervention on normal rats and hyperglycemic rats. Evaluation was carried out by monitoring fasting blood glucose levels every week and HbA1c levels at the end of the intervention period. The hyperglycemic rats had significantly (p < 0.05) higher blood glucose levels than the normal rats, which remained in the normal range (84.8–100.4 mg/dL) and showed relatively little change until the end of the observation period (Figure 3).
At the end of the observation period, fasting blood glucose in the hyperglycemic rats that received ME intervention was 392.27% higher than in the normal control but was still 14.29% lower than the negative control and even 8.29% lower than the positive control. The positive effect of ME can also be seen in the weekly fasting blood glucose levels, which show a decreasing trend, while in the negative control and positive control groups, there was an initial increase in the levels of fasting blood glucose.
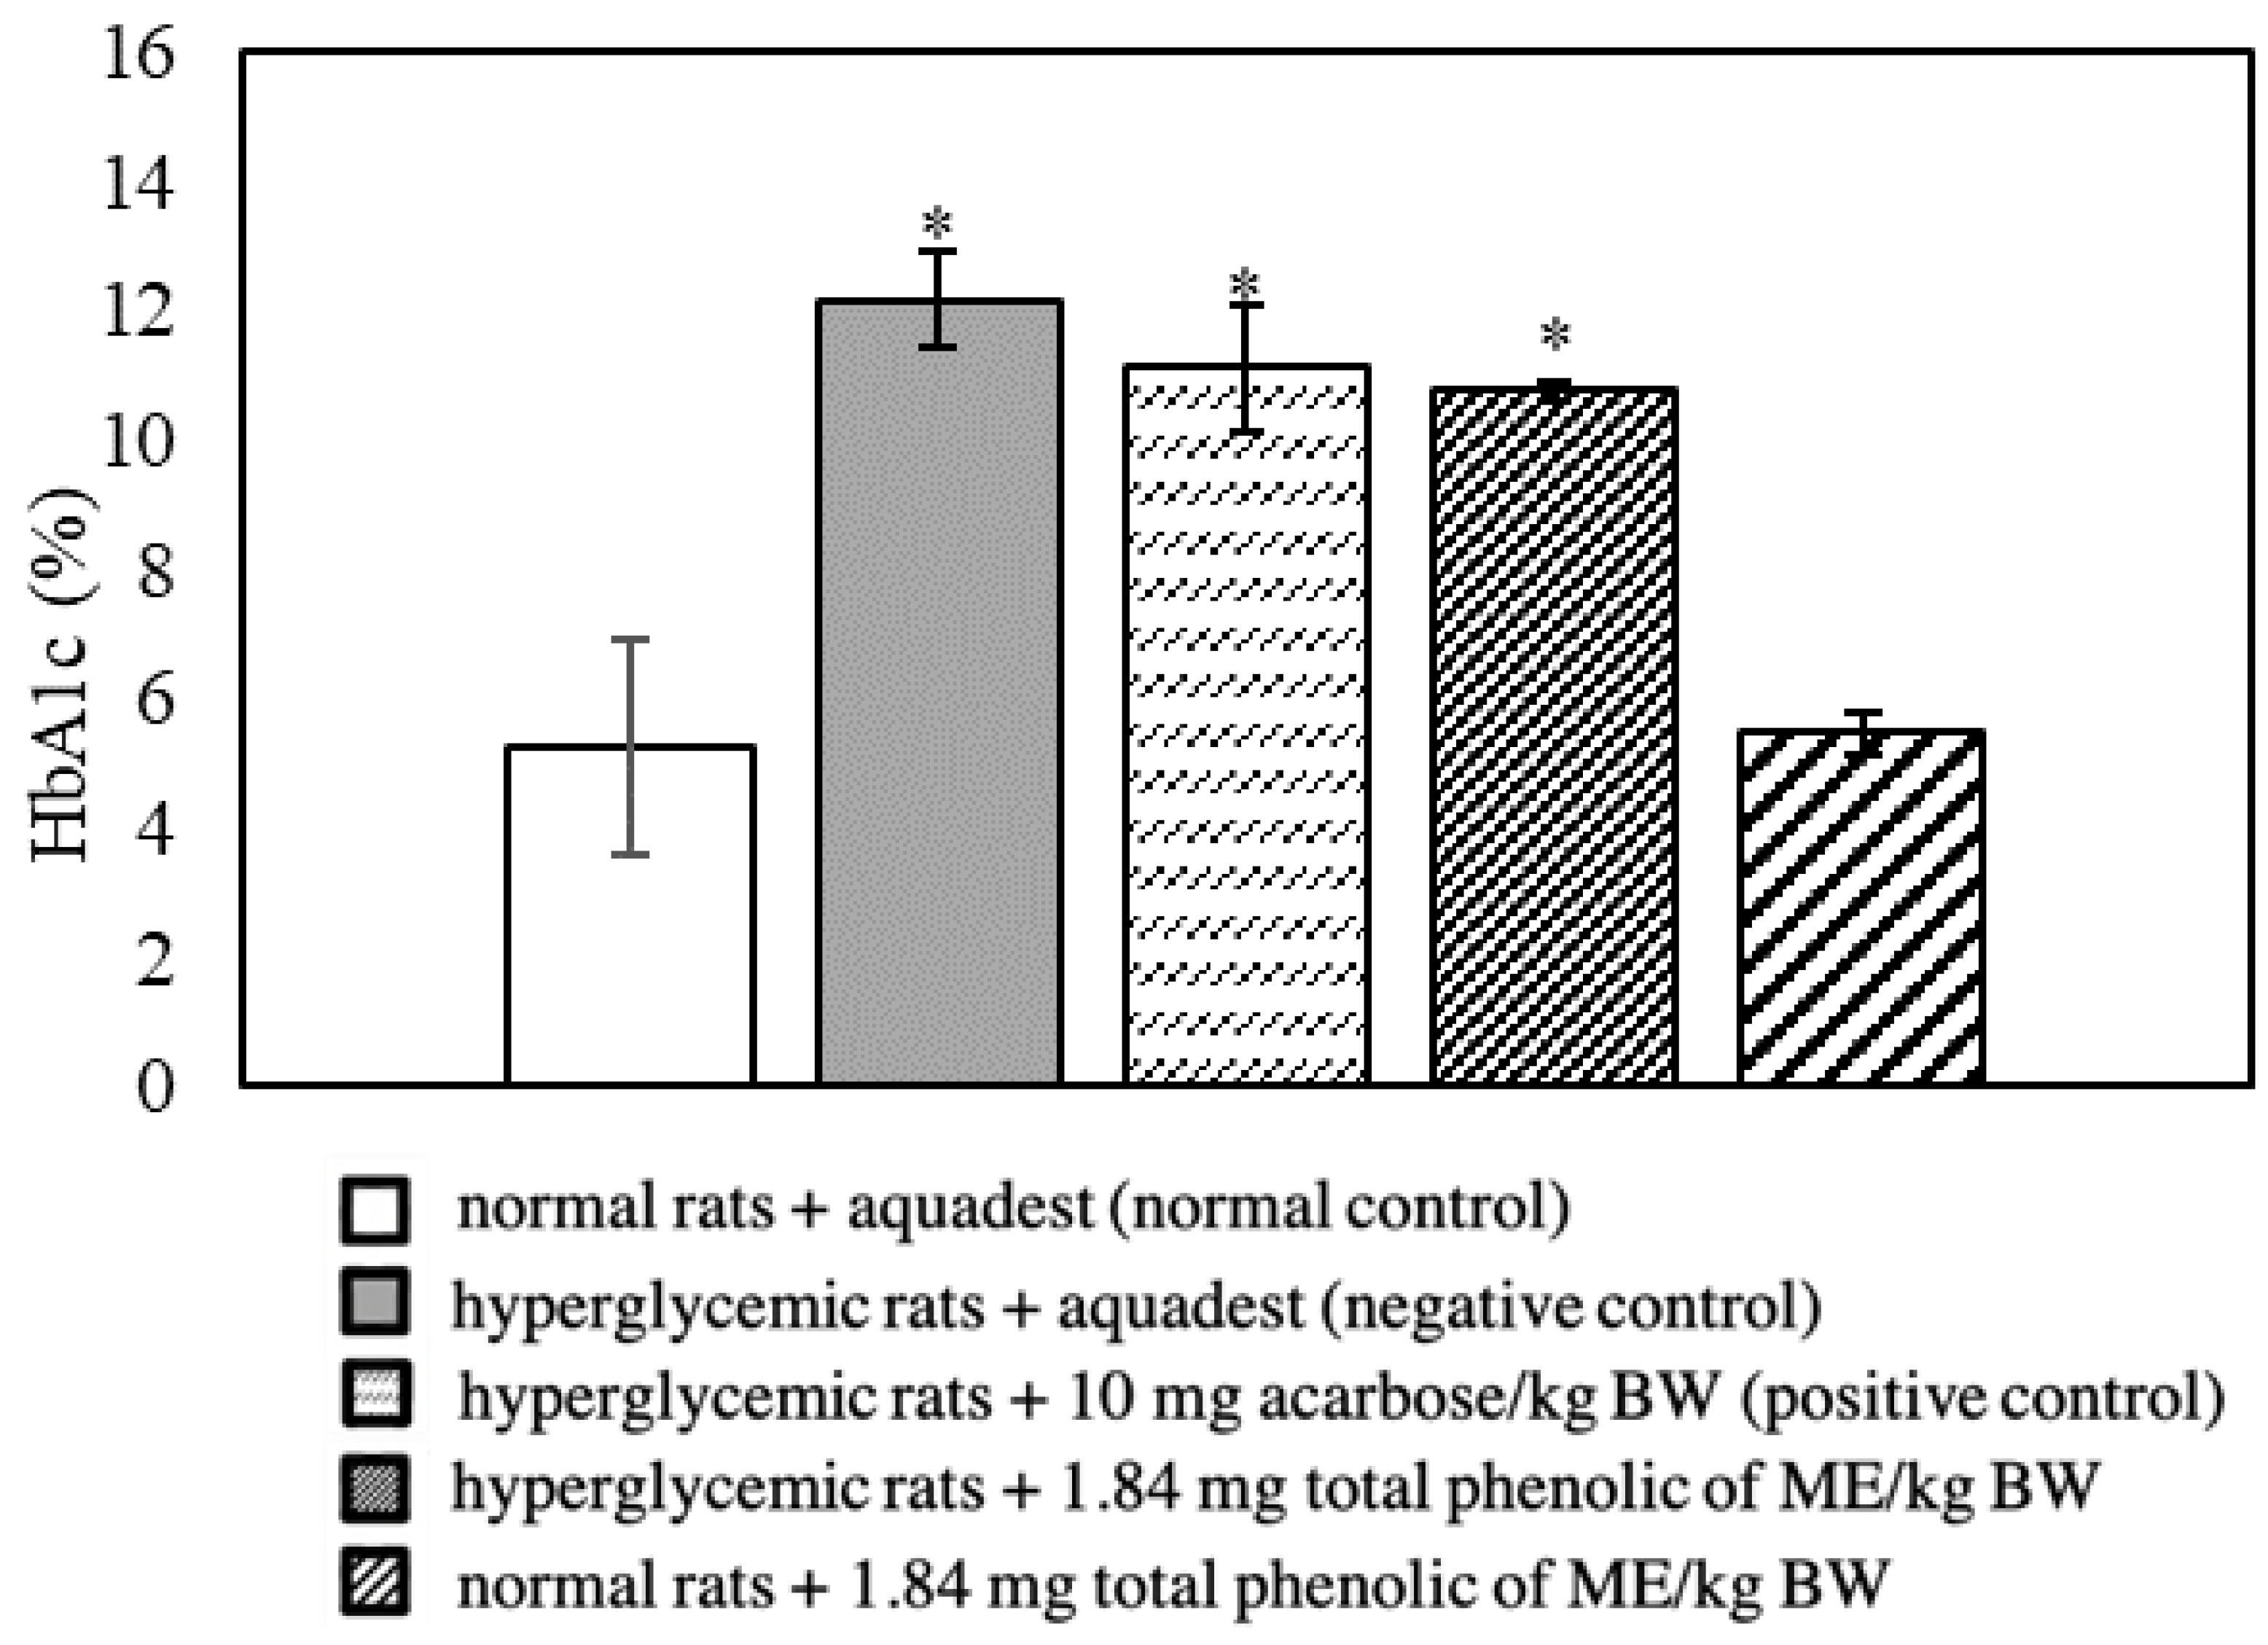
A similar trend was also found in HbA1c levels (Figure 4). The hyperglycemic rats had significantly (p < 0.05) higher HbA1c levels than the normal rats. The HbA1c level in the hyperglycemic rats that received ME intervention was 104.69% higher than in the normal control. Compared with the negative control and positive control, the HbA1c levels of the hyperglycemic rats that received ME intervention was 11.51% and 3% lower, respectively. Peungvicha et al. [35] reported that male Sprague-Dawley rats with type 2 DM who were treated with 0.5 and 1 g/kg BW of M. fragrans herbal extract for 30 days resulted in a 3.49% decrease in HbA1c compared to the positive control (5 mg glibenclamide/kg BW). Dry flaxseed extract (0.5 g) given to Wistar rats for 60 days in a study by Draganescu et al. [25] reduced HbA1c by 7.36% compared to the negative control. The results of this evaluation show the positive effect of ME in improving the glycemic status of hyperglycemic rats.

3.4. Effect of Mace Water Extract on the Glycemic Parameters of Hyperglycemic Rats

Glycemic status can be evaluated using the parameters of oral starch tolerance, oral glucose tolerance, fasting blood glucose, and HbA1c. Table 1 summarizes the effects of the ME intervention on the rats’ glycemic parameters.
The effect of ME was determined based on the % difference between each glycemic parameter of rats that received ME intervention and the comparison groups (normal control, negative control, positive control, or initial condition). The ME intervention was declared to have a positive effect (notation “+”) if the fasting blood glucose levels, HbA1c, and AUC of the oral starch/glucose tolerance tests were lower than those of the normal control, negative control, positive control, and their initial conditions, or the same as normal control and positive control. On the other hand, it was considered to have a negative effect (notation “−”) if the levels of fasting blood glucose, HbA1c, and AUC of the oral starch/glucose tolerance test were higher than the negative control. ME interventions that resulted in glycemic parameter values higher than those of the positive control, normal control, initial condition, or the same as the negative control are considered to have no effect (notation “0”). Based on the observed glycemic parameters, ME provided a positive effect when compared with the negative control, even with the positive control (on fasting blood glucose and HbA1c). This study is the first to investigate and report the effects of nutmeg water extract on the glycemic status of rats.

3.5. Effect of Mace Water Extract on Body Weight and Water Consumption

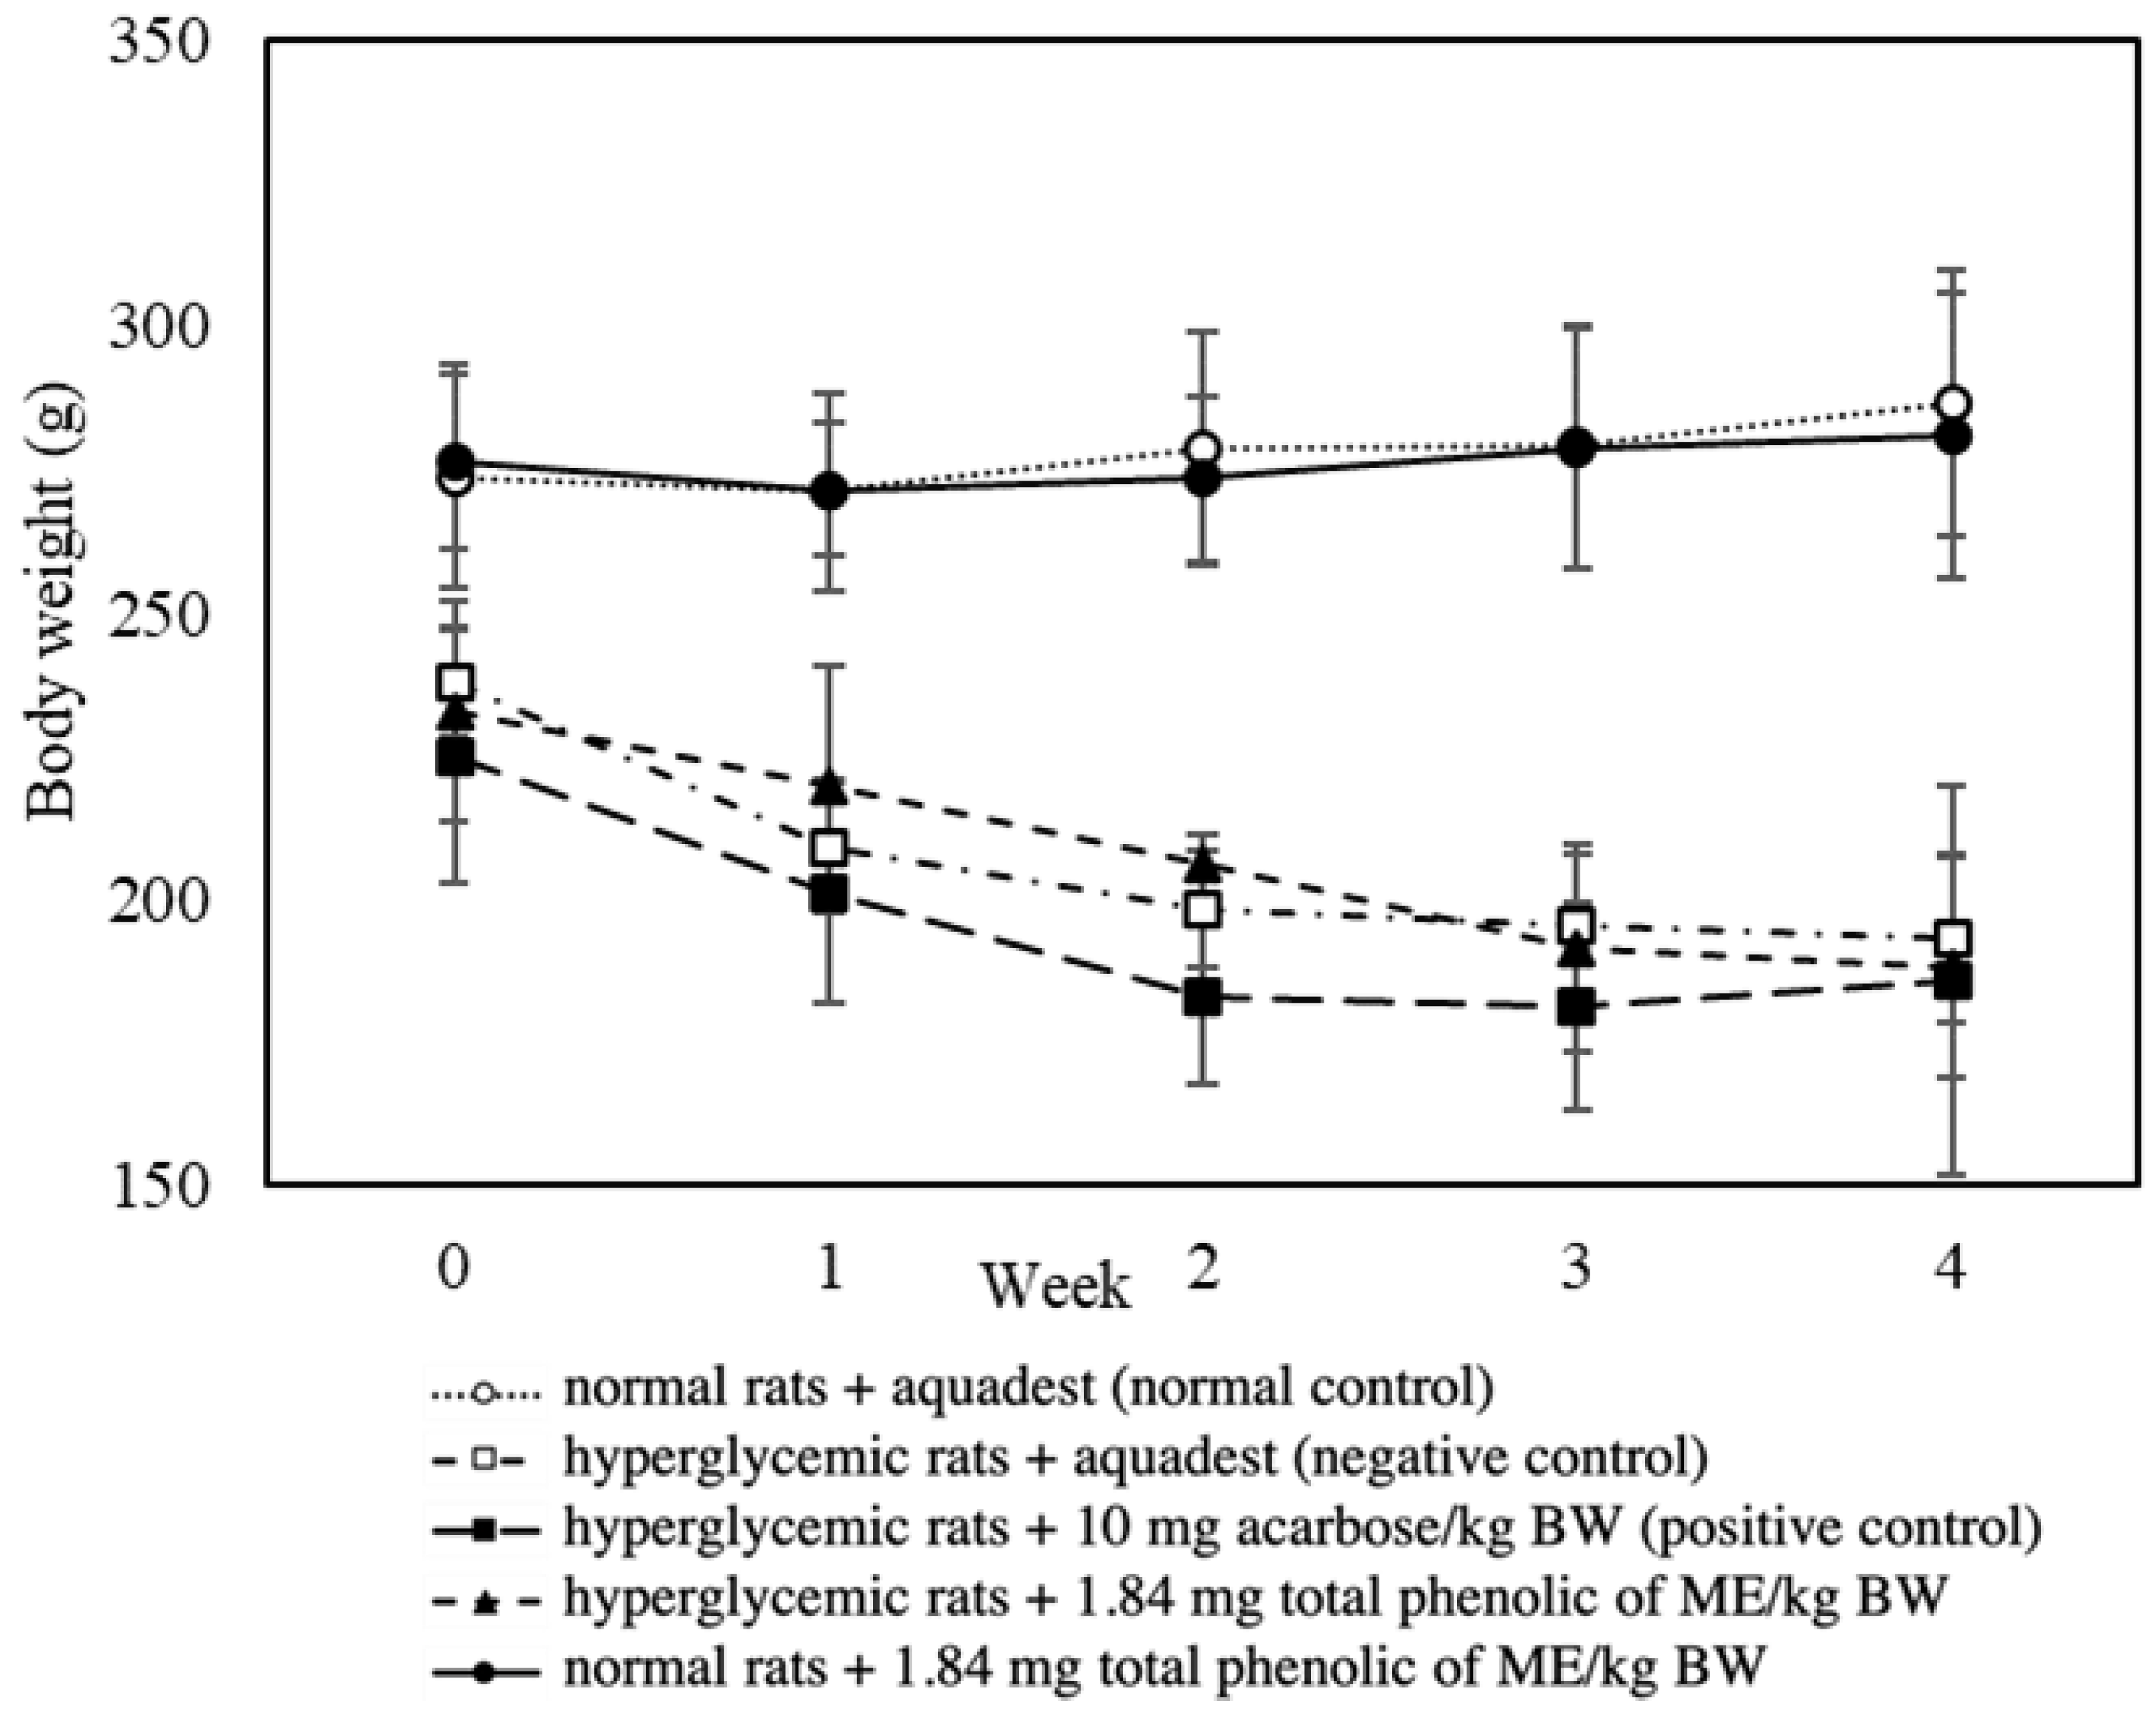
The effect of ME on changes in body weight and relative water intake of experimental rats was also observed. Severe weight loss is a common feature of DM due to the loss or degeneration of structural proteins. In this study, rats from all hyperglycemic groups experienced weight loss at various time intervals (Figure 5).
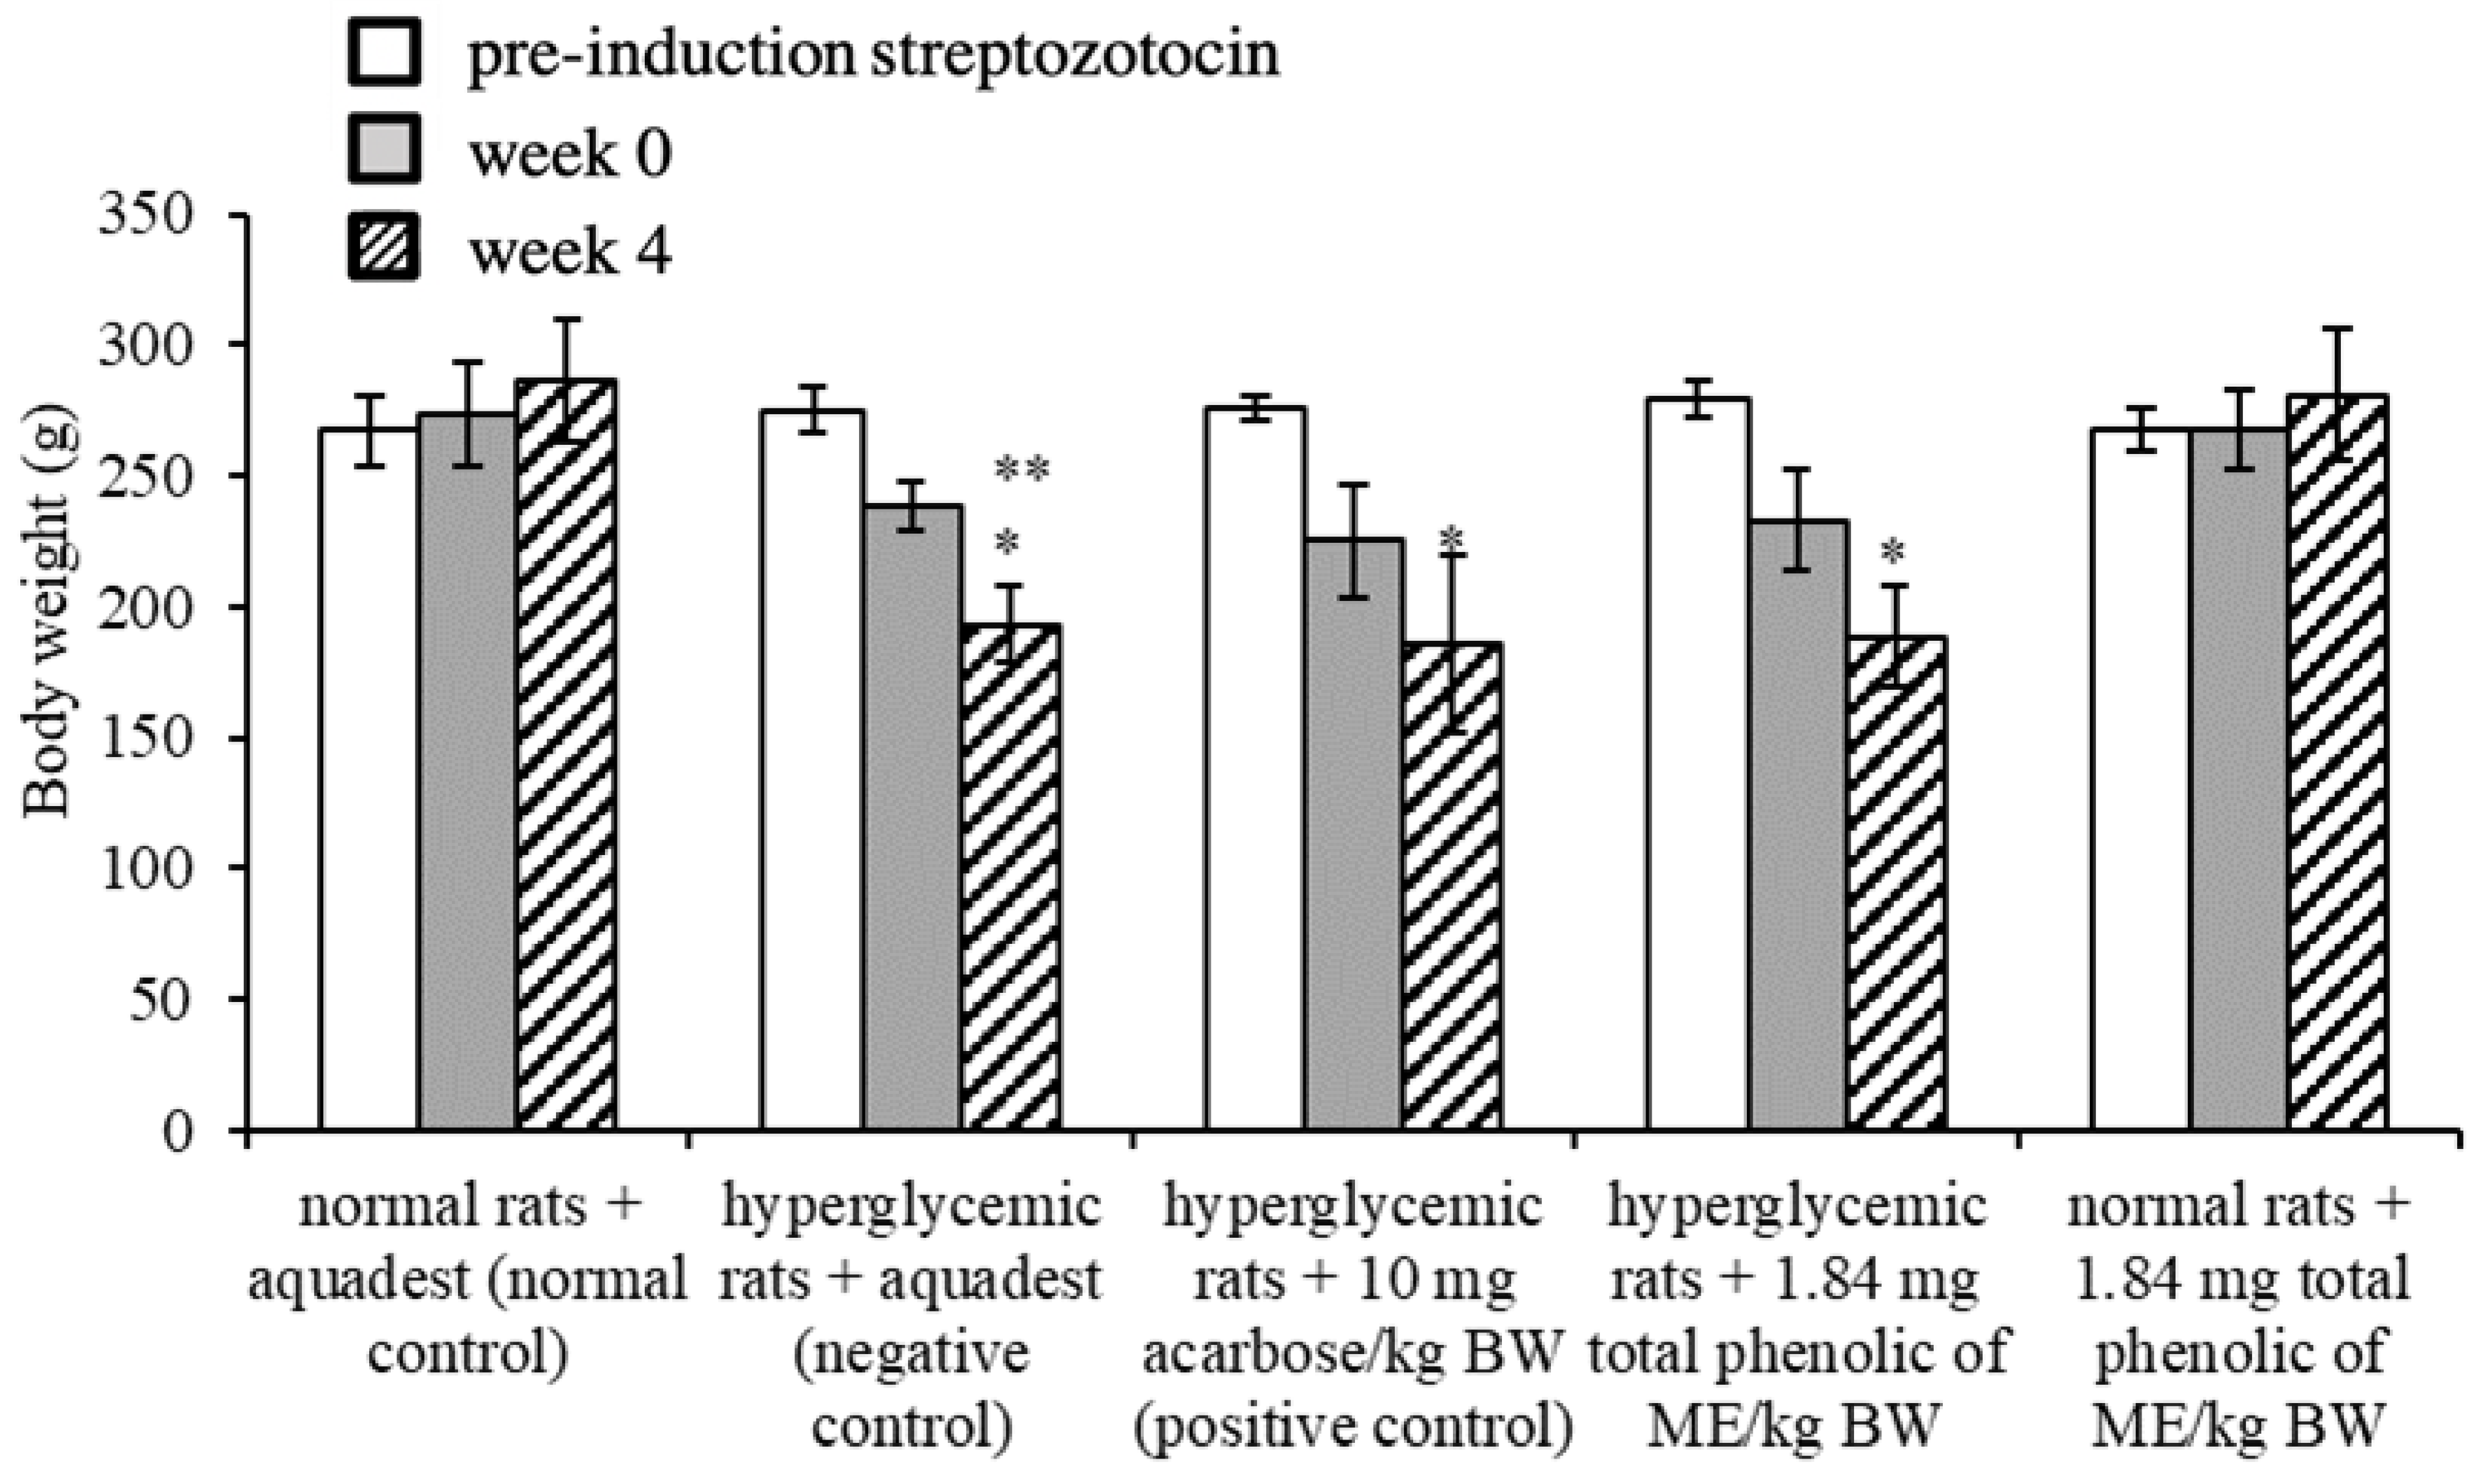
Statistically, the body weight at week 4 of the normal and hyperglycemic rats (except for negative controls) did not experience a significant change (p > 0.05) from their initial body weight (week 0) (Figure 6). The normal rats without and with ME intervention at week 4 experienced an increase in body weight of 4.75% and 1.59%, respectively. Loss of body weight in the hyperglycemic rats, namely in the negative control, positive control (acarbose), and those receiving ME at week 4, reached levels of 18.93% (significant, p < 0.05), 17.48%, and 18.88%, respectively. The decrease in body weight in the hyperglycemic rats was associated with metabolic damage due to streptozotocin induction.
Loss of body weight in the negative control and positive control groups in the 1st week reached 12.04% and 10.67%, respectively, while in the hyperglycemic rat group that received ME intervention it reached only 5.44%. In the 2nd week, the body weight loss of the negative control and positive control groups was 16.67% and 18.52%, respectively, while in the hyperglycemic rat group that received ME intervention it was only 11.46%. The rate of body weight loss in the hyperglycemic groups was confirmed by the slope values from a linear equation created up to week 2 (Figure 5).
Slower body weight loss in the hyperglycemic rats that received ME intervention (13.33 g/week) compared to the negative control (19.83 g/week) and positive control (20.83 g/week) indicates a potential restorative effect of ME, which inhibits the development of gluconeogenesis and glycogenolysis due to hyperglycemic conditions. This trend is in accordance with the study of Draganescu et al. [25], who evaluated the effects of lignans and flaxseed polyphenols on streptozotocin-induced diabetic rats, and the study of Florence et al. [36], who also evaluated the antidiabetic activity of Annona muricata (Annonaceae) water extract in streptozotocin-induced diabetic rats.
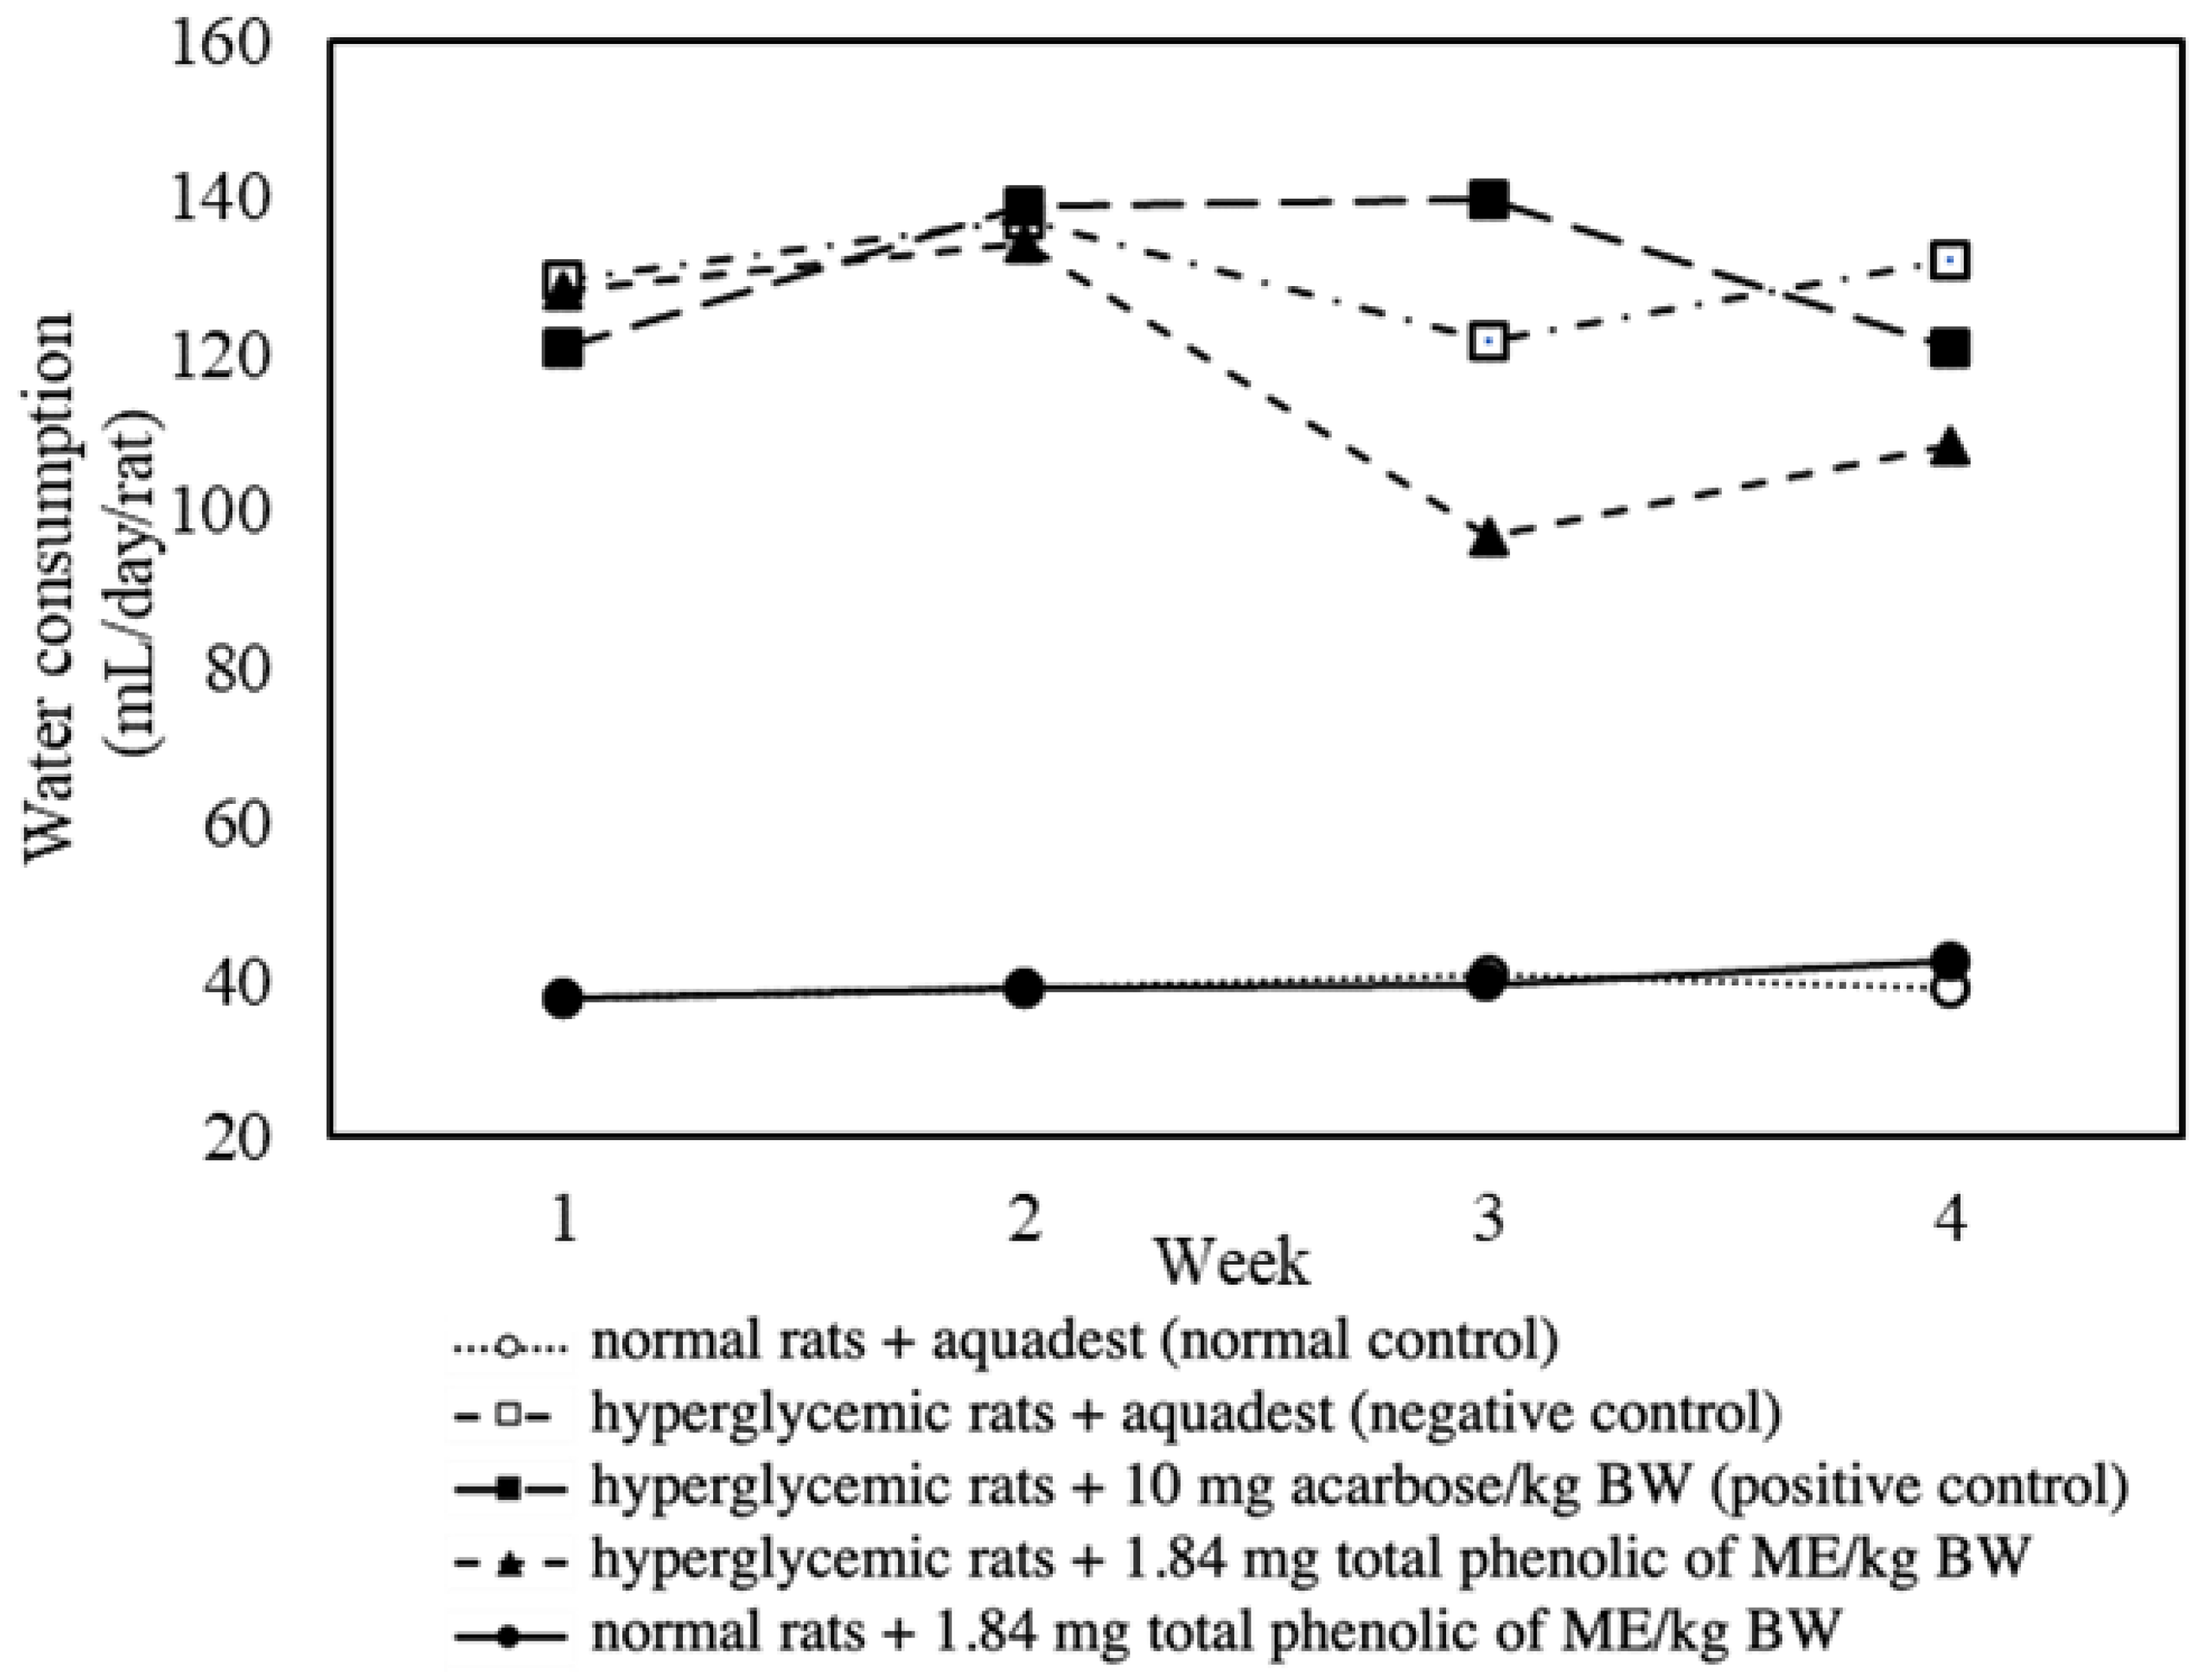
Figure 7 displays the average daily water consumption of rats from each treatment group. In the normal rats without and with ME intervention, water consumption was no more than 40 mL/day/rat (39.09 and 39.61 mL/day/rat, respectively). The average daily water consumption of hyperglycemic rats that received ME during the experimental period (28 days) was higher (~198.63%) compared to normal controls but lower than negative controls and positive controls (~10.13% and ~10.20%, respectively). These results show a reduction in polydipsia and confirm the positive effect of ME on hyperglycemic rats. A similar trend was also found in a study by Draganescu et al. [25], which examined the effects of lignans and flaxseed polyphenols on streptozotocin-induced diabetic rats. The study found that water consumption in the negative control group (diabetics without intervention) was higher compared to the normal group and the diabetic group who received flaxseed sample intervention.

3.6. Effect of Mace Water Extract on the Relative Weight of the Pancreas, Kidney, and Liver

Organ weight is an important index of physiological and pathological status in animals. The relative weight of an organ is fundamental for diagnosing whether the organ has been injured or not [37]. The pancreas, liver, and kidneys are organs that are often observed in research using hyperglycemic (experimental diabetic) animals. Several studies report that the size of the pancreas is smaller in diabetics compared to healthy patients [38,39,40]. By computed tomography or magnetic resonance imaging, the size of the pancreas is found to be smaller in diabetic patients, and its borders are irregular. Increased levels of fat, fibrosis, and inflammatory changes were also found in the pancreas of type 2 DM patients. The size of the pancreas is important in understanding the pathophysiology of diabetes. Pancreatic atrophy is found to be a consistent feature in type 1 DM patients, whereas in type 2 DM patients, although still controversial, investigations show that the size and contour of the pancreas are altered. Changes in pancreatic weight are also possible with changes in its size. Thus, it seems that information on pancreatic volume and structure has the potential to be a valuable index for clinical management and prognosis prediction in diabetic patients [41,42,43].
The results of this study showed a clear trend that the relative weight of the pancreas in hyperglycemic rats was significantly (p < 0.05) lower than in normal rats (Table 2). The hyperglycemic rats that received ME intervention had a pancreatic weight that was significantly higher than the positive control and negative control (p < 0.05). In addition, pancreas weight was found to be inversely related to HbA1c and fasting blood glucose levels at autopsy. In hyperglycemic rats given ME, the values for both glycemic parameters were lower, followed by positive and negative controls. These results are in accordance with Yagihashi’s [43] statement that in diabetes patients, the remaining total β-cell mass is inversely correlated with glycated hemoglobin and hyperglycemic levels at autopsy. The same trend was also reported by Hossain et al. [32], namely that the weight of the pancreas of normal rats and diabetic rats given Annona muricata extract was significantly higher than diabetic rats without treatment (negative control).
Changes in kidney weight may reflect renal toxicity, tubular hypertrophy, or chronic progressive nephropathy. In this study, the relative kidney weight of the hyperglycemic rats was significantly higher (p < 0.05) than that of the normal rats (Table 2). The hyperglycemic rats that received ME intervention had a lower relative kidney weight than the negative control and positive control. These results are in line with Alipin et al. [37], who reported that the relative weight of the kidneys in the group induced with streptozotocin was significantly higher than normal controls (p < 0.05) and the group treated with a combination of ginger rhizome extract and belimbing wuluh fruit (Averrhoa bilimbi L.) (767.5 mg/kg BW) resulted in a higher relative kidney weight compared to the negative control. Zafar et al. [44] also reported that the relative kidney weight of rats induced by streptozotocin for 12 weeks was significantly higher than that of rats that were not induced (normal). The study by Alabi et al. [45] also reported that induction of diabetes using fructose and streptozotocin caused a significant increase in the relative weight of the kidneys in untreated diabetic rats, and the intervention of Anchomanes difformis leaf extract was able to maintain the relative weight of the kidneys significantly. According to Alipin et al. [37], the increase in kidney weight and relative kidney weight is thought to originate from the toxic effects of streptozotocin, which causes diabetes in rats.
Vallon and Thomson [46] stated that DM affects the kidneys gradually. The onset of damage in diabetes sufferers is characterized by an increase in kidney size and glomerular filtration rate (GFR), leading to the development of kidney failure in diabetes. A study by Malini et al. [47] concluded that ethanol extract of jengkol fruit peel (Archidendron pauciflorum) had no effect on the morphological structure of the kidneys but could reduce the relative weight of the kidneys and improve the histological damage to the kidneys of diabetic model rats with an optimum dose of 770 mg/kg BW. The significant increase in the relative weight of the kidneys in diabetic rats is thought to be due to the presence of substances such as water and fat contained in the cells, so that the cell volume increases. The first change seen in the kidneys of diabetes sufferers is an increase in kidney size and hyperfiltration, which causes filtration of protein, which generally does not occur in normal conditions [47]. The higher relative weight of kidneys in diabetic rats without treatment compared to those with ginger intervention (Z. officinale Roscoe) was also reported by Elazu et al. [48]. Asuk et al. [49] also reported that the relative weight of the liver and kidneys of diabetic rats was higher than that of normal rats and diabetic rats that were intervened with Jatropha curcas leaf extract and fractions. Alabi et al. [45] reported that the relative weight of kidneys in normal rats was lower than in diabetic rats, and the intervention of Anchomanes difformis leaf extract was able to reduce the increase in the relative weight of kidneys in diabetic rats, although it was not statistically significant. Anchomanes difformis leaf extract intervention in diabetic rats was also able to significantly maintain the relative weight of the kidneys compared to those without intervention. Zafar and Naqvi [44] reported that streptozotocin-induced diabetes caused a significant reduction in the body weight of diabetic animals, while the relative weight of the kidneys and liver increased.
The relative weight of the liver of the hyperglycemic rats that received ME intervention in this study was significantly higher (p < 0.05) than that of the normal rats but lower than that of the negative control and positive control (Table 2). The higher relative weight of the liver in the streptozotocin-induced rats compared to the normal rats was caused by increased accumulation of triglycerides, which caused liver enlargement. This may be due to increased entry of fatty acids into the liver caused by hypoinsulinemia and low capacity for lipoprotein excretion–secretion from the liver due to deficiency in apolipoprotein B synthesis [44].
DM increases fatty acid oxidation due to reduced fuel requirements. However, the liver will stop oxidizing fatty acids and use them instead to synthesize triglycerides, which then accumulate abnormally in the liver. In type 1 DM, insulin deficiency upregulates hormone-sensitive lipase in adipose tissue, which in turn causes increased lipolysis and circulating free fatty acids, which then accumulate in the liver. This process increases liver uptake of very low-density lipoproteins and triglyceride synthesis. Simultaneously, increased glucagon levels inhibit liver triglyceride output. Therefore, fat accumulation in the liver may be caused by an imbalance in the absorption, synthesis, export, and oxidation of free fatty acids in the liver [50].

3.7. Correlation Between Clinical Parameters

A glycemic condition can be related to clinical or pathological conditions. In this study, the relationship between parameters was analyzed using Pearson’s correlation test (Table 3).
Fasting blood glucose and HbA1c are very strongly positively correlated. Both of these glycemic parameters were strongly positively correlated with the relative liver and kidney weights. However, both were negatively correlated with relative pancreas weight (moderately) and body weight (strongly). This means that an increase in these two glycemic parameters will be followed by an increase in the relative weight of the liver and kidneys, as well as a decrease in the relative weight of the pancreas and body weight. The relative weight of the pancreas itself was negatively correlated with the liver and kidney, moderately and weakly, respectively.
A systematic review of the effects of nutmeg on the glycemic status in rats and mice found that significant reductions in fasting blood glucose also depended on dose factors and duration of intervention [3]. Ethanolic extract of M. fragrans seeds (500 mg/kg BW) given to male hyperglycemic rats for 6 days was able to reduce fasting blood glucose levels dramatically by up to 94.52% [51]. Administration of nutmeg seed petroleum ether extract (50 mg/kg BW) for 16 weeks reduced blood glucose in male diabetic Wistar rats by 7.9%, and greater reductions were obtained with doses of 100 mg/kg BW (45.06%) and 200 mg/kg BW (55.57%) [52]. Another study reported that fasting blood glucose in Wistar DM type 2 rats given nutmeg petroleum ether extract was significantly reduced at a dose of 200 mg/kg BW, but this effect was not significant at doses of 50 and 100 mg/kg [53]. The HbA1c of male albino Wistar rats given the intervention with a spice mixture containing M. fragrans seeds and mace at a higher dose (50 mg/kg BW) for 30 days was 48.86% lower than the negative control [54]. HbA1c in male C57BL/6/J NAFLD mice was significantly reduced after intervention with an ethanol extract of M. fragrans seeds (250 mg/kg BW) for 30 days [55]. This HbA1c-lowering effect can be enhanced by increasing the dose of nutmeg [35,54]. In addition to dose, the reduction in fasting blood glucose also depends on the duration of the intervention. The blood glucose of Wistar DM type 2 rats that were intervened with safrole-free M. fragrans Houtt seed extract (5.4 mg/200 g BW) for 2, 4, and 6 weeks was reduced by 20%, 30%, and 40%, respectively [56].
This study evaluated the antihyperglycemic effect of mace water extract from Myristica fragrans Houtt (ME) using male Sprague Dawley rats as experimental animals. According to Saputra et al. [57] and Munjiati et al. [58], rats that were induced by streptozotocin to become hyperglycemic with fasting blood glucose > 400 mg/dL were categorized into a severe hyperglycemic condition. In this study, damage to pancreatic beta cells caused by administration of streptozotocin (50 mg/kg BW) in experimental rats was categorized as very severe. This is proven by the FBG level of hyperglycemic rats, which reached > 400 mg/dL on the 7th day after administration of streptozotocin. This hyperglycemic status is categorized as severe diabetes. Apart from the limited dosage and duration of ME intervention, the severe diabetic condition in hyperglycemic rats at the beginning of the experimental period is also thought to be the reason why the mace extract intervention in this study was unable to improve the glycemic status of hyperglycemic rats to the same or close to the glycemic status of normal rats. Nevertheless, ME still had a positive effect on several parameters observed in hyperglycemic rats when compared with negative controls (Table 4).
This study used male Sprague Dawley rats as experimental animals. The selection of male rats helped to avoid the confounding effects of the hormonal cycle that could interfere with the effects of the studied intervention in the case of females. However, the inclusion of female animals in future studies should be considered to allow for investigating the effectiveness of the ME, taking into account sex-specific metabolic differences [59].
The effect of ME on glycemic parameters was evaluated based on the results of oral starch and glucose tolerance tests, as well as measurements of fasting blood glucose and HbA1c after 28 days of treatment. Compared with the negative control, ME intervention (dose B) was able to reduce the AUC value in the oral starch tolerance test by up to 12.56%. These results may suggest the ability of ME to inhibit the hydrolysis of starch into simpler molecules to glucose, which will then be absorbed into the circulatory system. The suggested inhibition of starch hydrolysis is in line with findings of previous in vitro studies, where ME showed an inhibitory effect on the α-amylase enzyme with an IC50 value of 360.18 ± 6.83 mg phenolics/L [28]. The phenolic compounds contained in ME are suggested to play a role in inhibiting the α-amylase enzyme. The complex that occurs between starch and polyphenols causes the side or part of starch that is normally hydrolyzed by digestive enzymes to become unrecognizable. The more starch bonds with polyphenols, the more sites cannot be recognized by digestive enzymes, so the ability of starch hydrolysis decreases. As a result, starch digestibility becomes low, which can suppress blood glucose spikes [16]. Afandi [21] also reported that inhibition of the α-amylase enzyme by phenolic compounds was 4.5 times more effective in reducing IG than inhibition of the α-glucosidase enzyme, through an uncompetitive type of inhibition.
In addition, an oral glucose tolerance test was also conducted to see the effect of ME on the glycemic status of rats. Compared with the negative control, ME intervention was able to reduce the AUC value in the oral glucose tolerance test by 8.50%. These results suggest the possibility of inhibiting glucose absorption in the intestine as another mechanism of ME in inhibiting blood glucose spikes. In this case, ME is suggested to act as an inhibitor of glucose transporters in the intestine.
Various glucose transfer pathways across the small intestinal epithelium and their contribution to glucose absorption were studied in recent years. Most researchers agree that glucose in the intestinal lumen is transferred across the apical membrane of enterocytes via active transport mediated by the SGLT1 transporter, whereas its exit into the bloodstream is carried out via facilitated diffusion mediated by the GLUT2 transporter localized on the basolateral membrane [60,61,62,63]. Another hypothesis has been proposed that at high carbohydrate loads, the GLUT2 transporter may be rapidly inserted into the brush border membrane of enterocytes and participate in facilitated glucose diffusion across this membrane [60,63]. Several studies have shown that glucose uptake, as well as the expression and activity of the glucose transporters SGLT1 and GLUT2 in enterocytes, are increased in diabetes [62] and suggest that this may contribute to hyperglycemia [63]. The use of SGLT1 inhibitors has recently been shown to reduce blood glucose levels and improve metabolic parameters in DM patients [63,64].
Altogether, the above-described hypotheses on the mechanisms behind the antihyperglycemic effects of mace extract observed in this study, linked to the potential inhibitory effects on glucose absorption or on glucose transporters, should be further confirmed. ME intervention with a dose of 1.84 mg total phenolics ME/kg BW for 28 days was able to reduce fasting blood glucose in hyperglycemic rats by up to 14.29%. This result is still better compared to the water extract of Myristica fragrans seed (100 mg/kg BW) administered to Wistar rats for 30 days, which only reduced fasting blood glucose levels by up to 3.9% and 8.8% when combined with isoproterenol (85 mg/kg BW) [65]. Vangoori et al. [26] reported that intervention of ethyl alcohol extract of Myristica fragrans seed (400 mg/kg BW) for 10 weeks was able to reduce fasting blood glucose in obese Wistar Albino rats by up to 60.76%.
The condition of diabetes causes significant weight loss. Diabetes is accompanied by increased glycogenolysis, lipolysis, and gluconeogenesis; this biochemical activity causes muscle wasting and loss of tissue protein [66]. Compared to normal rats, diabetic rats have a significantly lower body weight. ME in this study was able to reduce weight loss in hyperglycemic rats by 0.26% compared to negative controls. Giving plant extracts containing bioactive compounds can indeed maintain the body weight of diabetic rats. Oral administration of Tinospora cordifolia root aqueous extract (2.5, 5, and 7.5 mg/kg) caused a significant reduction in blood glucose and an increase in body weight in alloxanized diabetic rats [67]. Eugenol intervention (10 mg/kg BW) in diabetic rats for 30 days, in addition to significantly reducing food intake, water intake, and urine glucose, also increased body weight compared to diabetic control rats [68]. Severe weight loss in DM may be caused by the unavailability of carbohydrates for energy metabolism and excessive degradation of structural proteins. Additionally, excessive protein catabolism in gluconeogenesis during insulin deficiency results in muscle wasting and weight loss in untreated diabetic rats [1,68].
One of the characteristics of DM, besides polyuria and polyphagia, is polydipsia [63]. Impaired regulation of blood glucose levels, which causes hyperglycemia, is a major problem in the pathophysiology of metabolic diseases such as obesity, metabolic syndrome, and DM. The intervention of ME in hyperglycemic rats in this study was able to reduce daily water consumption by 10.13%. These results confirm the hyperglycemic effect of ME, which is indicated by the lower water consumption of hyperglycemic rats that were given the ME intervention compared to the negative control. High fluid consumption (polydipsia) is necessary to dilute high blood glucose concentrations and to compensate for extra water loss (polyuria). High water consumption in hyperglycemic rats is a symptom of DM (polydipsia and polyuria) [25].
Information about weight, volume, and organ structure has the potential to be a valuable index for clinical management and the prediction of prognosis in diabetes patients [37,41,42,43]. The relative weight of the pancreas of hyperglycemic rats treated with ME intervention in this study tended to be higher than that of the negative control, while for the kidney and liver, the relative weight was lower than that of the negative control.
The study of Virostko et al. [40] reported that pancreatic volume decreases as the stage of type 1 DM increases. This loss of pancreatic volume is accompanied by microstructural changes. The study reported that individuals with type 1 DM had significantly (p < 0.001) smaller pancreas than control participants. Pancreatic volume decreases in the first year after an individual is diagnosed with type 1 DM. This decrease in pancreatic volume and weight is caused by loss of cellular structural integrity. In this study, the relative weight of the pancreas of hyperglycemic rats that received ME intervention was 20.69% higher than the negative control. The antioxidant ability of ME is thought to play an important role in inhibiting damage to pancreatic β cells due to the induction of radical streptozotocin and a number of ROS compounds formed due to oxidative stress conditions. Inhibition of oxidative damage to pancreatic β cells may help maintain pancreatic integrity.
The relative weight of the kidneys of hyperglycemic rats that received ME intervention in this study was 6.12–8.00% lower than that of the negative control. These results are in line with the study of Zafar and Naqvi [44] which found that diabetic rats induced with streptozotocin had a higher relative kidney weight than normal rats. The report contains several possible causes of kidney weight gain. One of the causes of kidney weight gain is associated with changes in mesangial cells, namely, the cells found in the glomerulus. Thomas and Versypt [69], in their review, stated that mesangial expansion is an important feature in the development of diabetic nephropathy and is characterized by aberrant mesangial cell proliferation and accumulation of matrix proteins in the central area of the glomerulus, the kidney’s filtration unit. Mesangial expansion is often used in the clinical diagnosis of diabetic nephropathy and as a marker in the discovery of antagonist agents, in testing the efficacy of a drug, as well as in the process of discovering other markers. Therefore, quantification of mesangial matrix expansion via biopsy is the gold standard for determining the progression of diabetic kidney damage. Mesangial expansion is one of the major structural changes observed in the glomerulus after the onset of diabetes in humans. Metabolic and hemodynamic changes such as hyperglycemia and hypertension generally precede and occur concurrently with these structural changes. Mesangial expansion occurs as a result of aberrant mesangial cell proliferation, accumulation of mesangial matrix, and hypertrophy caused by the diabetic state. By reviewing many in vitro and in vivo studies using diabetes models, Thomas and Versypt [69] concluded that hyperglycemia can cause mesangial matrix accumulation and mesangial cell hypertrophy.
The relative weight of the livers of hyperglycemic rats treated with ME intervention in this study was 3.85% lower than the negative control. Although not statistically significant, this result is in line with the study of Zafar and Naqvi [44]. The study found an increase in the relative weight of kidneys and liver in diabetic rats induced by streptozotocin. The increase in liver weight is thought to be due to liver enlargement caused by increased accumulation of triglycerides. This triglyceride accumulation is caused by increased entry of fatty acids into the liver, caused by hypoinsulinemia and low excretion–secretion capacity of lipoprotein from the liver due to deficiency in apolipoprotein B synthesis. Bhatt and Smith [70] stated that excessive synthesis of triglycerides in the liver is driven by the supply of fatty acids to the liver. The accumulation of excess liver fat is further exacerbated by impaired liver fatty acid oxidation due to insulin resistance. Conditions of elevated glucose levels in the context of pre-diabetes or diabetes will provide further substrates for triglyceride synthesis. Liver abnormalities in type 1 DM are closely related to glycogen hepatopathy. This condition can develop in adults or children with uncontrolled type 1 DM and is characterized by excess glycogen in hepatocytes, resulting in liver enlargement.
Although information about the weight and volume of organs, such as the pancreas, liver, and kidneys, has the potential to contribute to clinical management and prognosis in diabetes, a histological analysis of the investigated organs could undoubtedly provide crucial insights into cellular damage or repair, strengthening the mechanistic claims and hypotheses described hereto. Guasch-Ferré et al. [71] explained some relevant mechanisms linking polyphenols and DM risk. The evaluation of the antidiabetic potential in this study strongly indicates several mechanisms that can be played by nutmeg mace, namely, reducing gluconeogenesis, which is characterized by inhibiting the rate of body weight loss, improving β-cell integrity and preventing oxidative stress damage to the pancreas, and inhibiting starch hydrolyzing enzymes (α-glucosidase and α-amylase) and glucose transporters (SLGT1 and GLUT2) in the small intestine. Nutmeg mace may also work through other mechanisms, but specialized studies are required to prove this.
To validate its relevance for functional food application, the translatability of the ME doses used in experimental rats in this study to human equivalents (HED) should be discussed. The main dose of ME used in this study was 75 mg ME/kg BW (15 mg ME/200 g BW), equivalent to 1.84 mg of total ME phenolics/kg BW. Referring to Indonesian FDA (BPOM) Regulation No. 20 of 2023 on “Guidelines for preclinical pharmacodynamic testing of traditional medicine” (BPOM 20/2023), the conversion value from rat (normal BW, 200 g) to humans (normal BW, 70 kg) is 56. Thus, the dose given to experimental rats in this study, if converted to humans, would be equivalent to 840 mg ME/70 kg BW (obtained from 15 × 56 = 840) or 0.84 g ME/70 kg BW. In normal consumption of tea drinks, generally 2 g of dry tea powder is brewed with ±250 mL of hot water (the brewing conditions are relatively the same as the extraction conditions in this study). The yield of mace water extract obtained in this study was 6.31 ± 0.91% [28]. This means that 1 g of dry mace powder, extracted with water (1:10 w/v) is equivalent to 0.0631 g ME. In the opposite sense, 1 g ME is equivalent to 15.85 g of dry mace powder. Therefore, if the HED is 0.84 g ME/70 kg BW, then it will be equivalent to 13.31 g of dry mace powder/70 kg BW. This dose is still 6.65 times higher than the normal consumption dose, which is 2 g/70 kg BW (referring to the general dose of tea consumption). Thus, if this dose is reduced for application as functional food, it still promises a positive effect, considering the nature of functional food, which is more preventive than curative.
Although it did not restore the glycemic status of hyperglycemic rats to normal levels, ME intervention (1.84 mg total phenolics ME/kg BW) for 28 days still showed a promising trend in improving glycemic status. Therefore, in a preventive context, ME has the potential to be developed as a functional food product, especially in the form of beverage products. In addition, ME also has the potential to be developed into a nutraceutical product by increasing the applied dose. In this way, ME is expected to contribute to the management of DM, especially in preventive efforts, with its role as functional food and nutraceutical.

4. Conclusions

This study found that mace water extract from Myristica fragrans Houtt (ME) (1.84 mg total phenolics from ME/kg BW) was able to inhibit blood glucose spikes in oral starch and glucose tolerance tests with AUC values lower than the negative control (respectively, 12.56% and 8.50%). Fasting blood glucose and HbA1c in streptozotocin-induced hyperglycemic rats that received long-term intervention (28 days) of ME (1.84 mg total phenolics from ME/kg BW) were lower than those of the negative controls (14.29% and 11.50%, respectively), even when compared with the positive control (10 mg acarbose/kg BW). The positive effect of the long-term intervention of ME was also observed in the parameters of body weight, daily water consumption, and relative organ weight of hyperglycemic rats. The findings of this study suggest that ME has antihyperglycemic potential in vivo.
The presented work addresses the timely need for safer, food-compatible plant-based interventions for diabetes management. Its novelty lies particularly in the use of a water extract instead of organic solvent extracts, highlighting a safer approach to functional food development. However, the study has several limitations, including a relatively low number of animals per group and a limited number of targeted biomarkers, not allowing for a complex mechanistic exploration of the observed trends. Thus, future studies with larger sample sizes, further mechanistic exploration of the observed trends, and, finally, human trials would be of interest to strengthen the claims made. Such studies would benefit further from the inclusion of biomarkers that would allow for more in-depth insights into the cellular mechanisms underlying the observed findings.

Author Contributions

Conceptualization, H., F.N.A.D., D.N.F., N.A. and D.Ś.-T.; methodology, H., F.N.A.D., D.N.F., D.I. and N.A.; validation, H., F.N.A.D., D.N.F., D.I. and N.A.; formal analysis, H., F.N.A.D., D.N.F., D.I. and N.A.; investigation, H.; data curation, H., F.N.A.D., D.N.F., D.I. and N.A.; writing—original draft preparation, H.; writing—review and editing, H., F.N.A.D., D.N.F., D.I., N.A. and D.Ś.-T.; visualization, H., F.N.A.D., D.N.F., D.I., N.A. and D.Ś.-T.; supervision, F.N.A.D., D.N.F., D.I. and N.A.; funding acquisition, H., F.N.A.D., D.N.F., D.I., N.A. and D.Ś.-T. All authors have read and agreed to the published version of the manuscript.

Funding

This research was supported by the Postdoctoral Program from the Directorate of Strategic Studies and Academic Reputation–IPB University (grant number 16/IT3.D12/SP/DAPT.PD/2024).

Institutional Review Board Statement

The experimental protocol was approved by the Animal Ethics Committee of the School of Veterinary Medicine and Biomedicine, IPB University (065/KEH/SKE/VI/2023).

Informed Consent Statement

Not applicable.

Data Availability Statement

The data generated in this study are presented in the manuscript. Further inquiries can be directed to the corresponding author, Nuri Andarwulan.

Conflicts of Interest

The authors declare no conflicts of interest. The funders had no role in the design of the study, in the collection, analyses, or interpretation of the data, in the writing of the manuscript, or in the decision to publish the results.

References

  1. Gandhi, G.R.; Sasikumar, P. Antidiabetic Effect of Merremia Emarginata Burm. F. in Streptozotocin Induced Diabetic Rats. Asian Pac. J. Trop. Biomed. 2012, 2, 281–286. [Google Scholar] [CrossRef] [PubMed]
  2. Shrivastava, S.R.; Shrivastava, P.S.; Ramasamy, J. Role of Self-Care in Management of Diabetes Mellitus. J. Diabetes Metab. Disord. 2013, 12, 14. [Google Scholar] [CrossRef] [PubMed]
  3. Hasbullah; Faridah, D.N.; Dewi, F.N.A.; Indrasti, D.; Andarwulan, N. Effect of Nutmeg on Glycemic Status in Rat and Mice: A Systematic Review. Food Sci. Technol. 2023, 43, e130122. [Google Scholar] [CrossRef]
  4. Alshammari, M.; Windle, R.; Bowskill, D.; Adams, G. Diabetes Treatment Guidelines and Nurses’ Adherence to Them: A Case of the UK and Kuwait. Nurs. Healthc. Int. J. 2020, 4, 1–12. [Google Scholar] [CrossRef]
  5. Tran, N.; Pham, B.; Le, L. Bioactive Compounds in Anti-Diabetic Plants: From Herbal Medicine to Modern Drug Discovery. Biology 2020, 9, 252. [Google Scholar] [CrossRef]
  6. Simanjuntak, H.A. The Utilization of Diabetes Mellitus Medicinal Plants in Simalungun Ethnic Society of Simalungun Regency (North Sumatera Province, Indonesia). BioLink 2018, 5, 59–71. [Google Scholar] [CrossRef]
  7. Nagja, T.; Vimal, K.; Sanjeev, A. Myristica Fragrans: A Comprehensive Review. Int. J. Pharm. Pharm. Sci. 2016, 8, 9–12. [Google Scholar]
  8. Mendhekar, S.Y.; Balsaraf, C.D.; Bangar, M.S.; Jadhav, S.L.; Gaikwad, D.D. TLC Profile Study Mace (Aril) of Myristica Malabarica Lamk. (Myristicaceae). J. Phytopharm. 2017, 6, 329–334. [Google Scholar] [CrossRef]
  9. Ismiyarto; Ngadiwiyana; Mustika, R. Isolation, Identification of Essential Oil from Nutmeg Mace (Myristica fragrans) and Activity Test as a Larvicidal. J. Kim. Sains Dan Apl. 2009, 12, 23–30. [Google Scholar] [CrossRef]
  10. Arrizqiyani, T.; Sonjaya, N.; Asty, A. Optimizing the Potential of Nutmeg Plants as Antibacterial Escherichia Coli Using the Extraction Method. In Proceedings of the Seminar Nasional Publikasi Hasil-Hasil Penelitian dan Pengabdian Masyarakat; Universitas Muhammadiyah Semarang (UNIMUS): Semarang, Indonesia, 2017; pp. 375–382. [Google Scholar]
  11. Ha, M.T.; Vu, N.K.; Tran, T.H.; Kim, J.A.; Woo, M.H.; Min, B.S. Phytochemical and Pharmacological Properties of Myristica Fragrans Houtt.: An Updated Review. Arch. Pharmacal Res. 2020, 43, 1067–1092. [Google Scholar] [CrossRef]
  12. Pan, A.; Sun, J.; Chen, Y.; Ye, X.; Li, H.; Yu, Z.; Wang, Y.; Gu, W.; Zhang, X.; Chen, X.; et al. Effects of a Flaxseed-Derived Lignan Supplement in Type 2 Diabetic Patients: A Randomized, Double-Blind, Cross-over Trial. PLoS ONE 2007, 2, e1148. [Google Scholar] [CrossRef]
  13. Han, K.L.; Choi, J.S.; Lee, J.Y.; Song, J.; Joe, M.K.; Jung, M.H. Therapeutic Potential of Peroxisome Proliferators–Activated Receptor-α/ΓDual Agonist With Alleviation of Endoplasmic Reticulum Stress for the Treatment of Diabetes. Diabetes 2008, 57, 737–745. [Google Scholar] [CrossRef] [PubMed]
  14. Xu, Z.; Wang, X.; Zhou, M.; Ma, L.; Deng, Y.; Zhang, H.; Zhao, A.; Zhang, Y.; Jia, W. The Antidiabetic Activity of Total Lignan from Fructus Arctii against Alloxan-Induced Diabetes in Mice and Rats. Phytother. Res. 2008, 22, 97–101. [Google Scholar] [CrossRef]
  15. Katare, C.; Saxena, S.; Agrawal, S.; Prasad, G.; Bisen, P.S. Flax Seed: A Potential Medicinal Food Journal of Nutrition & Food Sciences. J. Nutr. Food Sci. 2012, 2, 1–8. [Google Scholar] [CrossRef]
  16. Meutia. Effect of Green Tea Extract Addition in Extruded Rice Process to Decrease Glycemic Index. Bachelor’s Thesis, Institut Pertanian Bogor, Bogor, Indonesia, 2013. [Google Scholar]
  17. Malik, A. Antidiabetic Activity and Isolation of Bioactive Compounds from Ethanol Extract of Piper betle L. Leaf. In Proceedings of the Seminar Nasional Kimia dan Pendidikan Kimia 2016, Universitas Negeri Medan (UNIMED), Medan, Indonesia, 30–31 May 2016; pp. 1–6. [Google Scholar]
  18. Topal, F. Antidiabetic Potential: Effect of Resorcinol on α-Glycosidase and α- Amylase Enzymes. Cumhur. Sci. J. 2018, 39, 828–832. [Google Scholar] [CrossRef]
  19. Lee, Y.G.; Rodriguez, I.; Nam, Y.H.; Gwag, J.E.; Woo, S.H.; Kim, H.G.; Ko, J.; Hong, B.N.; Kang, T.H.; Baek, N. Recovery Effect of Lignans and Fermented Extracts from Forsythia Koreana Flowers on Pancreatic Islets Damaged by Alloxan in Zebrafish (Danio Rerio). Appl. Biol. Chem. 2019, 62, 7. [Google Scholar] [CrossRef]
  20. Worawalai, W.; Phuwapraisirisan, P. Samin-Derived Flavonolignans, a New Series of Antidiabetic Agents Having Dual Inhibition against α -Glucosidase and Free Radicals. Nat. Prod. Res. 2019, 34, 3169–3175. [Google Scholar] [CrossRef] [PubMed]
  21. Afandi, F.A. Meta-Analysis of Factors Affecting the Glycemic Index of Starch-Based Foods and Its Verification Using Food Model. Ph.D. Thesis, Institut Pertanian Bogor, Bogor, Indonesia, 2020. [Google Scholar]
  22. Barre, D.E.; Mizier-Barre, K.A. Lignans’ Potential in Pre and Post-Onset Type 2 Diabetes Management. Curr. Diabetes Rev. 2020, 16, 2–11. [Google Scholar] [CrossRef]
  23. Zhao, C.C.; Shao, J.H.; Chen, J.; Zhang, X.H.; Gu, W.Y.; Shen, J.; Liu, Y. Lignan Constituents from the Fruits of Viburnum Macrocephalum f. Keteleeri and Their α-Amylase, α-Glucosidase, and Protein Tyrosine Phosphatase 1b Inhibitory Activities. J. Agric. Food Chem. 2020, 68, 11151–11160. [Google Scholar] [CrossRef]
  24. Afandi, F.A.; Wijaya, C.H.; Faridah, D.N.; Suyatma, N.E.; Jayanegara, A. Evaluation of Various Starchy Foods: A Systematic Review and Meta-Analysis on Chemical Properties Affecting the Glycemic Index Values Based on In Vitro and In Vivo Experiments. Foods 2021, 10, 364. [Google Scholar] [CrossRef]
  25. Draganescu, D.; Andritoiu, C.; Hritcu, D.; Dodi, G.; Popa, M.I. Flaxseed Lignans and Polyphenols Enhanced Activity in Streptozotocin-Induced Diabetic Rats. Biology 2021, 10, 43. [Google Scholar] [CrossRef]
  26. Vangoori, Y.; Dakshinamoorthi, A.; Kavimani, S. Effect of Myristica Fragrans Extract on Lipid Profile, Glucose, Body Weight, Food Intake, Liver and Renal Functions in Experimental Obese Rats. Biomed. Pharmacol. J. 2019, 12, 669–676. [Google Scholar] [CrossRef]
  27. Patil, S.B.; Ghadyale, V.A.; Taklikar, S.S.; Kulkarni, C.R.; Arvindekar, A.U. Insulin Secretagogue, Alpha-Glucosidase and Antioxidant Activity of Some Selected Spices in Streptozotocin-Induced Diabetic Rats. Plant Foods Hum. Nutr. 2011, 66, 85–90. [Google Scholar] [CrossRef]
  28. Hasbullah; Faridah, D.N.; Indrasti, D.; Dewi, F.N.A.; Andarwulan, N. In Vitro Antioxidant and Antidiabetic Activity of Mace from Myristica Fragrans Houtt. Ann. Dunarea Jos Univ. Galati Fascicle IV—Food Technol. 2023, 47, 95–109. [Google Scholar] [CrossRef]
  29. Arifin, W.N.; Zahiruddin, W.M. Sample Size Calculation in Animal Studies Using Resource Equation Approach. Malays. J. Med. Sci. 2017, 24, 101–105. [Google Scholar] [CrossRef] [PubMed]
  30. Poovitha, S.; Parani, M. In Vitro and in Vivo α-Amylase and α-Glucosidase Inhibiting Activities of the Protein Extracts from Two Varieties of Bitter Gourd (Momordica charantia L.). BMC Complement. Altern. Med. 2016, 16, 185. [Google Scholar] [CrossRef]
  31. Ali, R.B.; Atangwho, I.J.; Kuar, N.; Ahmad, M.; Mahmud, R.; Asmawi, M.Z. In Vitro and in Vivo Effects of Standardized Extract and Fractions of Phaleria Macrocarpa Fruits Pericarp on Lead Carbohydrate Digesting Enzymes. BMC Complement. Altern. Med. 2013, 13, 39. [Google Scholar] [CrossRef]
  32. Hossain, M.A.; Mostofa, M.; Awal, M.A.; Chowdhury, E.H.; Sikder, M.H. Histomorphological and Morphometric Studies of the Pancreatic Islet Cells of Diabetic Rats Treated with Aqueous Extracts of Momordica charantia (Karela) Fruits. Asian Pac. J. Trop. Dis. 2014, 4, S698–S704. [Google Scholar] [CrossRef]
  33. Schober, P.; Schwarte, L.A. Correlation Coefficients: Appropriate Use and Interpretation. Anesth. Analg. 2018, 126, 1763–1768. [Google Scholar] [CrossRef]
  34. Khadayat, K.; Marasini, B.P.; Gautam, H.; Ghaju, S.; Parajuli, N. Evaluation of the Alpha-Amylase Inhibitory Activity of Nepalese Medicinal Plants Used in the Treatment of Diabetes Mellitus. Clin. Phytoscience 2020, 6, 34. [Google Scholar] [CrossRef]
  35. Peungvicha, P.; Vallisuta, O.; Mangmool, S.; Sirithamwanich, T.; Sirithamwanich, R. Anti-Hyperglycemic Effect and Subchronic Toxicity of the Combined Extract from Sattagavata—Mathurameha—Tubpikarn Anti-Diabetic Herbal Formulae. Thai J. Pharm. Sci. 2018, 42, 6–13. [Google Scholar] [CrossRef]
  36. Florence, N.T.; Benoit, M.Z.; Jonas, K.; Alexandra, T.; Désiré, D.D.P.; Pierre, K.; Théophile, D. Antidiabetic and Antioxidant Effects of Annona Muricata (Annonaceae), Aqueous Extract on Streptozotocin-Induced Diabetic Rats. J. Ethnopharmacol. 2014, 151, 784–790. [Google Scholar] [CrossRef] [PubMed]
  37. Alipin, K.; Sari, E.M.A.P.; Setiawati, T.I.A. Kidney Histology in Streptozotocin-Induced Diabetic Male Wistar Rats Treated with Combined Extract of Temulawak Rhizome and Belimbing Wuluh Fruit. Nusant. Biosci. 2017, 9, 312–317. [Google Scholar] [CrossRef]
  38. Atkinson, M.A. Organisation of the Human Pancreas in Health and in Diabetes. Diabetologia 2020, 63, 1966–1973. [Google Scholar] [CrossRef]
  39. Garcia, T.S.; Rech, T.H.; Bauermann, C. Pancreatic Size and Fat Content in Diabetes: A Systematic Review and Meta-Analysis of Imaging Studies. PLoS ONE 2017, 12, e0180911. [Google Scholar] [CrossRef] [PubMed]
  40. Virostko, J.; Williams, J.; Hilmes, M.; Bowman, C.; Wright, J.J.; Du, L.; Kang, H.; Russell, W.E.; Powers, A.C.; Moore, D.J. Pancreas Volume Declines During the First Year After Diagnosis of Type 1 Diabetes and Exhibits Altered Diffusion at Disease Onset. Diabetes Care 2018, 42, 248–257. [Google Scholar] [CrossRef]
  41. Saisho, Y.; Butler, A.E.; Meier, J.J.; Monchamp, T.; Rizza, R.A.; Butler, P.C. Pancreas Volumes in Humans from Birth to Age One Hundred Taking Into Account Sex, Obesity, and Presence of Type-2 Diabetes. Clin. Anat. 2007, 20, 933–942. [Google Scholar] [CrossRef]
  42. Al-Mrabeh, A.; Hollingsworth, K.G.; Steven, S.; Taylor, R. Morphology of the Pancreas in Type 2 Diabetes: Effect of Weight Loss with or without Normalisation of Insulin Secretory Capacity. Diabetologia 2016, 59, 1753–1759. [Google Scholar] [CrossRef]
  43. Yagihashi, S. Diabetes and Pancreas Size, Does It Matter? J. Diabetes Investig. 2016, 8, 413. [Google Scholar] [CrossRef]
  44. Zafar, M.; Naqvi, S.N.-H. Effects of STZ-Induced Diabetes on the Relative Weights of Kidney, Liver and Pancreas in Albino Rats: A Comparative Study. Int. J. Morphol. 2010, 28, 135–142. [Google Scholar] [CrossRef]
  45. Alabi, T.D.; Brooks, N.L.; Oguntibeju, O.O. Leaf Extracts of Anchomanes Difformis Ameliorated Kidney and Pancreatic Damage in Type 2 Diabetes. Plants 2021, 10, 300. [Google Scholar] [CrossRef]
  46. Vallon, V.; Thomson, S.C. Renal Function in Diabetic Disease Models: The Tubular System in the Pathophysiology of the Diabetic Kidney. Annu. Rev. Physiol. 2013, 74, 351–375. [Google Scholar] [CrossRef]
  47. Malini, D.M.; Fitriani, N.; Laila, A.; Ratningsih, N.; Setiawati, T. Morphological and Histological Kidney Structure in Diabetic Rats Model Treated with Ethanol Extracts of Jengkol Fruit Peel (Archidendron Pauciflorum). J. Biol. Udayana 2021, 25, 208–217. [Google Scholar] [CrossRef]
  48. Eleazu, C.O.; Iroaganachi, M.; Okafor, P.N.; Ijeh, I.I.; Eleazu, K.C. Ameliorative Potentials of Ginger (Z. Officinale Roscoe) on Relative Organ Weights in Streptozotocin Induced Diabetic Rats. Int. J. Biomed. Sci. 2013, 9, 82–90. [Google Scholar] [CrossRef] [PubMed]
  49. Asuk, A.A.; Atangwho, I.J.; Ugwu, M.N.; Unimke, B. Jatropha Curcas Leaf Extract and Fractions Attenuate Hyperglycemia, Tissue Oxidation, and Kidney Dysfunction in Diabetic Rats. J. Biochem. Techol. 2021, 12, 84–90. [Google Scholar] [CrossRef]
  50. Mohamed, J.; Nafizah, N.; Zariyantey; Budin, S.B. Mechanisms of Diabetes-Induced Liver Damage: The Role of Oxidative Stress and Inflammation. Sultan Qaboos Univ. Med. J. 2016, 16, 132–141. [Google Scholar] [CrossRef] [PubMed]
  51. Lestari, K.; Hwang, J.; Hartini Kariadi, S.; Wijaya, A.; Ahmad, T.; Subarnas, A.; Supriyatna; Muchtaridi, M. Screening for PPAR γ Agonist from Myristica Fragrans Houtt Seeds for the Treatment of Type 2 Diabetes by in Vitro and in Vivo. Med. Health Sci. J. 2012, 12, 7–15. [Google Scholar] [CrossRef]
  52. Pashapoor, A.; Mashhadyrafie, S.; Mortazavi, P. Ameliorative Effect of Myristica Fragrans (Nutmeg) Extract on Oxidative Status and Histology of Pancreas in Alloxan Induced Diabetic Rats. Folia Morphol. 2020, 79, 113–119. [Google Scholar] [CrossRef]
  53. Somani, R.S.; Singhai, A.K. Hypoglycaemic and Antidiabetic Activities of Seeds of Myristica Fragrans in Normoglycaemic and Alloxan-Induced Diabetic Rats. Asian J. Exp. Sci. 2008, 22, 95–102. [Google Scholar]
  54. Rajamani, S.; Suganthi, R.; Ravichandrana, M.K.; Anuradha, C.V. Food Seasoning Spices Mixture Improves Glucose Metabolism and Lipid Profile in Fructose-Fed Hyperinsulinemic Rats. J. Med. Food 2005, 8, 502–507. [Google Scholar] [CrossRef]
  55. Zhao, W.; Song, F.; Hu, D.; Chen, H.; Zhai, Q.; Lu, W.; Zhao, J.; Zhang, H.; Chen, W.; Gu, Z.; et al. The Protective Effect of Myristica Fragrans Houtt. Extracts against Obesity and Inflammation by Regulating Free Fatty Acids Metabolism in Nonalcoholic Fatty Liver Disease. Nutrients 2020, 12, 2507. [Google Scholar] [CrossRef]
  56. Lestari, K.; Diantini, A.; Barliana, M.I.; Achmad, T.H.; Subarnas, A.; Abdulah, R.; Lesmana, R.; Hwang, J.K. Potential Natural Dual Agonist PPAR α/γ -Induced Antidiabetic and Anti- Dyslipidemic Properties of Safrole-Free Nutmeg Seed (Myristica Fragrans Houtt) Extract. Nat. Prod. J. 2019, 9, 248–253. [Google Scholar] [CrossRef]
  57. Saputra, N.T.; Suartha, I.N.; Dharmayudha, A.A.G.O. Diabetagonic Agent Streptozotocin to Make White Rats Male Diabetes Mellitus. Bul. Vet. Udayana 2018, 10, 116–121. [Google Scholar] [CrossRef]
  58. Munjiati, N.E.; Sulistiyowati, R. Kurniawan Pengaruh Pemberian Streptozotocin Dosis Tunggal Terhadap Kadar Glukosa Wistar. Meditory 2021, 9, 62–67. [Google Scholar] [CrossRef]
  59. Estoppey, P.; Clair, C.; Auderset, D.; Puder, J.J. Sex differences in type 2 diabetes. Cardiovasc. Med. 2023, 26, 96–99. [Google Scholar] [CrossRef]
  60. Kellett, G.L.; Brot-laroche, E.; Mace, O.J.; Leturque, A. Sugar Absorption in the Intestine: The Role of GLUT2. Annu. Rev. Nutr. 2008, 28, 35–54. [Google Scholar] [CrossRef] [PubMed]
  61. Wright, E.M.; Loo, D.D.F.; Hirayama, B.A.; Human, C. Biology of Human Sodium Glucose Transporters. Physiol. Rev. 2011, 91, 733–794. [Google Scholar] [CrossRef]
  62. Koepsell, H. Glucose Transporters in the Small Intestine in Health and Disease. Pflügers Arch. Eur. J. Physiol. 2020, 472, 1207–1248. [Google Scholar] [CrossRef]
  63. Gromova, L.V.; Fetissov, S.O.; Gruzdkov, A.A. Mechanisms of Glucose Absorption in the Small Intestine in Health and Metabolic Diseases and Their Role in Appetite Regulation. Nutrients 2021, 13, 2474. [Google Scholar] [CrossRef]
  64. Maria, C.; Cefalo, A.; Cinti, F.; Moffa, S.; Impronta, F.; Sorice, G.P.; Mezza, T.; Pontecorvi, A.; Giaccari, A. Sotagliflozin, the First Dual SGLT Inhibitor: Current Outlook and Perspectives. Cardiovasc. Diabetol. 2019, 18, 20. [Google Scholar] [CrossRef]
  65. Kareem, M.A.; Krushna, G.S.; Hussain, S.A.; Devi, K.L. Effect of Aqueous Extract of Nutmeg on Hyperglycaemia, Hyperlipidaemia and Cardiac Histology Associated with Isoproterenol-Induced Myocardial Infarction in Rats. Trop. J. Pharm. Res. 2009, 8, 337–344. [Google Scholar] [CrossRef]
  66. Maidadi, B.; Ntchapda, F.; Miaffo, D.; Mahamad, A.T. Journal of Traditional and Complementary Medicine Diabetes Mellitus: Preventive and Curative Therapies with Aqueous Extract of Rytigynia Senegalensis Blume (Rubiaceae) in Wistar Rats. J. Tradit. Complement. Med. 2023, 13, 358–367. [Google Scholar] [CrossRef] [PubMed]
  67. Grover, J.K.; Yadav, S.; Vats, V. Medicinal Plants of India with Anti-Diabetic Potential. J. Ethnopharmacol. 2002, 81, 81–100. [Google Scholar] [CrossRef] [PubMed]
  68. Srinivasan, S.; Sathish, G.; Jayanthi, M.; Muthukumaran, J.; Muruganathan, U.; Ramachandran, V. Ameliorating Effect of Eugenol on Hyperglycemia by Attenuating the Key Enzymes of Glucose Metabolism in Streptozotocin-Induced Diabetic Rats. Mol. Cell. Biochem. 2014, 385, 159–168. [Google Scholar] [CrossRef]
  69. Thomas, H.Y.; Versypt, A.N.F. Pathophysiology of Mesangial Expansion in Diabetic Nephropathy: Mesangial Structure, Glomerular Biomechanics, and Biochemical Signaling and Regulation. J. Biol. Eng. 2022, 16, 19. [Google Scholar] [CrossRef]
  70. Bhatt, H.B.; Smith, R.J. Fatty Liver Disease in Diabetes Mellitus. HepatoBiliary Surg. Nutr. 2015, 4, 101–108. [Google Scholar] [CrossRef]
  71. Guasch-Ferré, M.; Merino, J.; Sun, Q.; Fitó, M.; Salas-Salvadó, J. Dietary Polyphenols, Mediterranean Diet, Prediabetes, and Type 2 Diabetes: A Narrative Review of the Evidence. Oxidative Med. Cell. Longev. 2017, 2017, 6723931. [Google Scholar] [CrossRef]
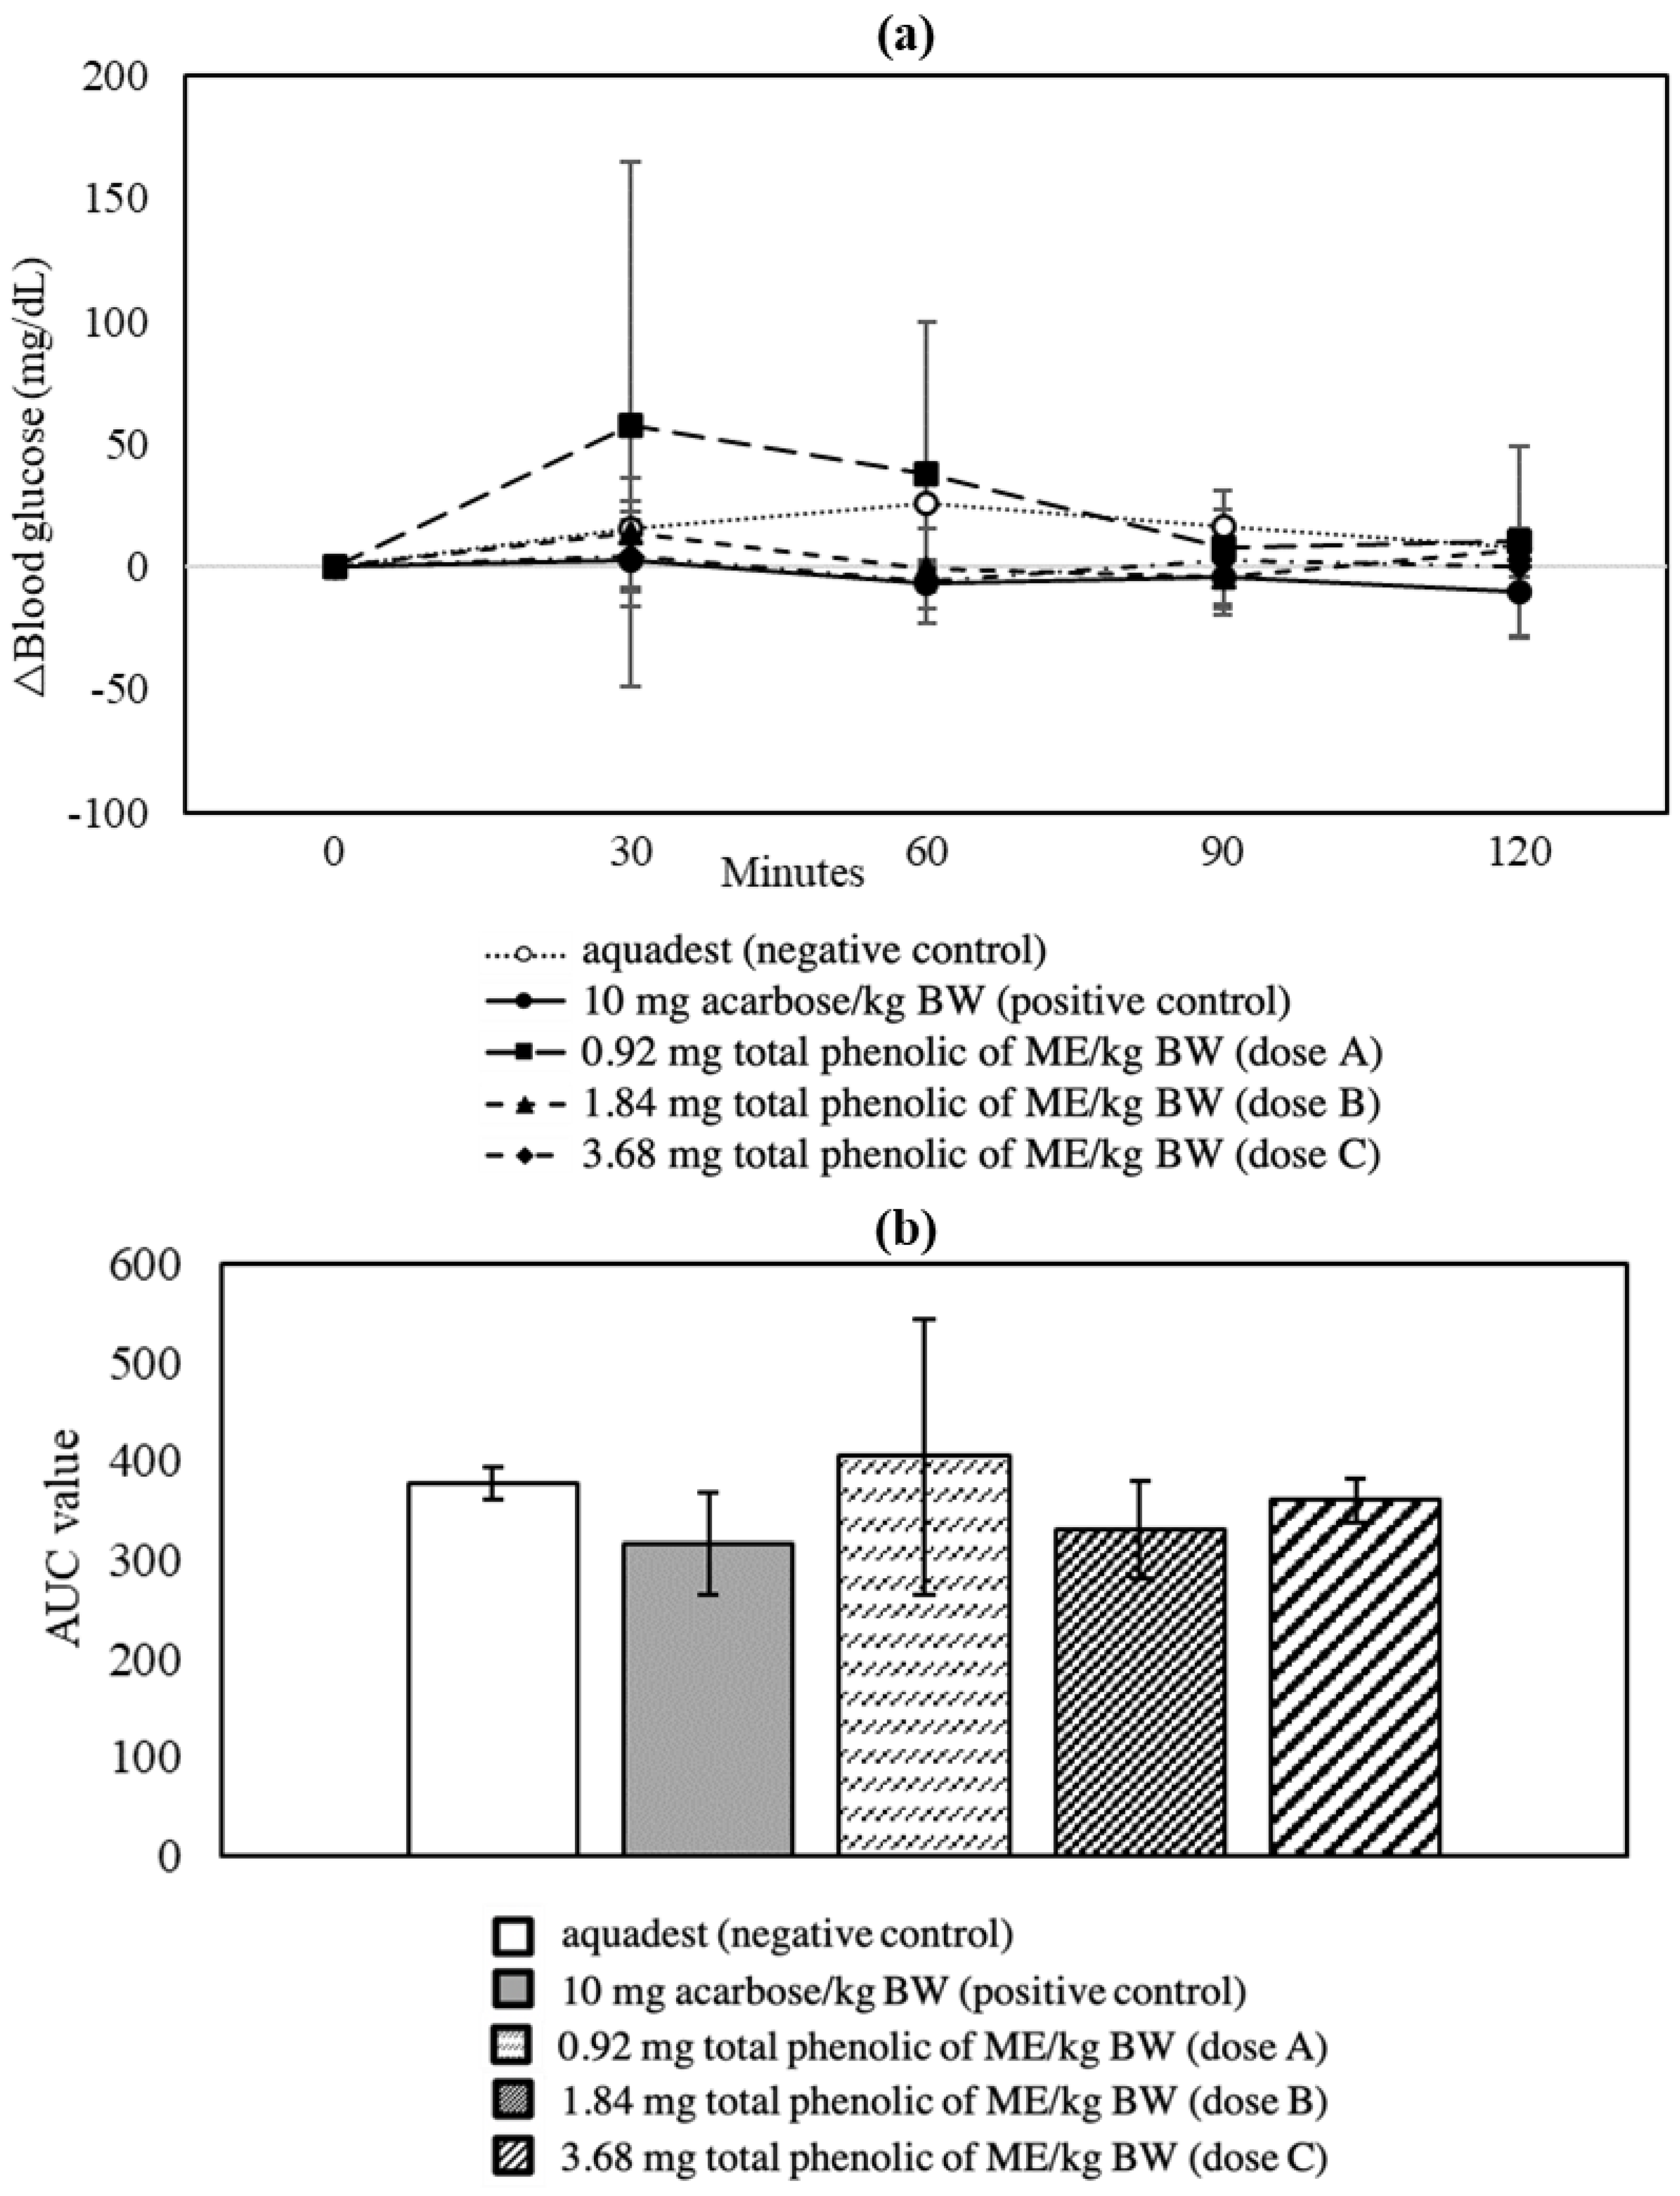
Figure 1. Oral starch tolerance test in normal rats. (a) Δ-blood glucose during the observation time of 120 min; (b) AUC value.
Applsci 15 05706 g001
Figure 2. Oral glucose tolerance test in normal rats. (a) Δ-blood glucose during the observation time of 120 min; (b) AUC value.
Applsci 15 05706 g002
Figure 3. Fasting blood glucose of normal and hyperglycemic rats during the observation period (28 days).
Applsci 15 05706 g003
Figure 4. HbA1c levels of normal and hyperglycemic rats at the end of the observation period; * indicates a significant difference (p < 0.05) from normal controls.
Applsci 15 05706 g004
Figure 5. Body weight of normal and hyperglycemic rats during the observation period (28 days).
Applsci 15 05706 g005
Figure 6. Body weight of normal and hyperglycemic rats at pre-streptozotocin induction, week 0, and week 4; * significantly different (p < 0.05) from normal controls, ** significantly different (p < 0.05) from week 0.
Applsci 15 05706 g006
Figure 7. Average daily water consumption of normal and hyperglycemic rats during the experimental period (28 days).
Applsci 15 05706 g007
Table 1. Effect of ME (1.84 mg total phenolics from ME/kg BW) on glycemic parameters (oral starch tolerance, oral glucose tolerance, fasting blood glucose, and HbA1c) in hyperglycemic rats.
Results% DifferenceEffect *
Acute effects
AUC-OSTT < negative control−12.56+
AUC-OSTT > positive control (10 mg acarbose/kg BW)4.500
AUC-OGTT < negative control−8.50+
AUC-OGTT > positive control (5 mg glibenclamide/kg BW)2.670
Long-term effects (28 days)
FBG > normal control392.270
FBG < negative control−14.29+
FBG < positive control (10 mg acarbose/kg BW)−8.29+
FBG < initial FBG (week 0)−12.61+
FBG > normal control + 1.84 mg total phenolics from ME/kg BW 385.840
HbA1c > normal control104.750
HbA1c < negative control−11.50+
HbA1c < positive control (10 mg acarbose/kg BW)−2.97+
HbA1c > normal control + 1.84 mg total phenolics from ME/kg BW 97.250
AUC-OGTT, area under the curve in the oral glucose tolerance test; AUC-OSTT, area under the curve in the oral starch tolerance test; BW, body weight; FBG, fasting blood glucose; ME mace water extract from Myristica fragrans Houtt. * Effects were declared positive (+) if FBG/HbA1c/AUC-OGTT/AUC-OSTT ≤ positive control/normal control/initial or <negative control; negative (−) if FBG/HbA1c/AUC-OGTT/AUC-OSTT ≥ negative control; no effect (0) if FBG/HbA1c/AUC-OGTT/AUC-OSTT > positive control/normal control/initial or = negative control.
Table 2. The relative weight of pancreas, kidney, and liver of normal and hyperglycemic rats at the end of the experimental period (day 28).
GroupRelative Weight of Organs (%)
PancreasRight KidneyLeft KidneyLiver
Normal rats + aquadest
(normal control)
0.36 ± 0.07 ab0.37 ± 0.02 a0.37 ± 0.03 a3.73 ± 0.29 a
Hyperglycemic rats + aquadest (negative control)0.29 ± 0.04 a0.50 ± 0.03 b0.49 ± 0.05 b4.67 ± 0.56 b
Hyperglycemic rats + 10 mg acarbose/kg BW (positive control)0.31 ± 0.03 ab0.50 ± 0.03 b0.47 ± 0.04 b4.73 ± 0.44 b
Hyperglycemic rats + 1.84 mg total phenolics from ME/kg BW 0.35 ± 0.15 ab0.46 ± 0.04 b0.46 ± 0.03 b4.49 ± 0.66 b
Normal rats + 1.84 mg total phenolics from ME/kg BW 0.44 ± 0.07 b0.38 ± 0.02 a0.39 ± 0.02 a3.33 ± 0.13 a
Different letters in the same column indicate a significant difference (p < 0.05).
Table 3. Correlation coefficients between research parameters.
vs.FBGHbA1cBWRW of LiverRW of Right KidneyRW of Left KidneyRW of Pancreas
FBG10.948−0.8710.7620.9060.858−0.461
HbA1c 1−0.8930.7940.9020.830−0.427
BW 1−0.815−0.874−0.8380.329
RW of liver 10.7250.687−0.589
RW of right kidney 10.912−0.241
RW of left kidney 1−0.199
RW of pancreas 1
BW, body weight; FBG, fasting blood glucose; RW, relative weight. The interpretation of the correlation coefficient follows Schober and Schwarte [32]; r = ±0.00–0.10: negligible correlation; r = ±0.10–0.39: weak; r = ±0.40–0.69: moderate; r = ±0.70–0.89: strong; r = ±0.90–1.00: very strong.
Table 4. Summary of the effects of mace water extract on glycemic parameters, body weight, water consumption, and relative organ weight of hyperglycemic rats.
Experimental ParametersHyperglycemic Rats + MEHyperglycemic Rats
(Negative Control)
Effects
Glycemic parameters
AUC-OSTT330.83378.33↓12.56%
AUC-OGTT330.50361.21↓8.50%
FBG (mg/dL)446.00520.33↓14.29%
HbA1c (%)10.7712.17↓11.50%
Body weight loss (g)44.3345.00↓0.26%
Daily water intake (mL)116.73129.88↓10.13%
Relative weight of organs
Pancreas (%)0.350.29↑20.69%
Right kidney (%)0.460.50↓8.00%
Left kidney (%)0.460.49↓6.12%
Liver (%)4.494.67↓3.85%
AUC-OGTT, area under the curve in the oral glucose tolerance test; AUC-OSTT, area under the curve in the oral starch tolerance test; FBG, fasting blood glucose; ME, mace water extract from Myristica fragrans Houtt; ↓—drop, and ↑—increase in the parameter following the ME intervention as compared to the negative control.
Disclaimer/Publisher’s Note: The statements, opinions and data contained in all publications are solely those of the individual author(s) and contributor(s) and not of MDPI and/or the editor(s). MDPI and/or the editor(s) disclaim responsibility for any injury to people or property resulting from any ideas, methods, instructions or products referred to in the content.