Article

Experimental Study on Multi-Cell Counting Using an Inertial Microfluidic Device

1
Department of Mechanical Engineering, School of Mechanical and Manufacturing Engineering (SMME), National University of Science and Technology (NUST), H-12, Islamabad 44000, Pakistan
2
Department of Mechanical Engineering, Capital University of Science and Technology (CUST), Islamabad 46000, Pakistan
3
Department of Mechanical Engineering, University of Management and Technology (UMT), Sialkot 51310, Pakistan
4
School of Mechanical Engineering, Dalian University of Technology, Dalian 116024, China
*
Author to whom correspondence should be addressed.
Appl. Sci. 2025, 15(10), 5701; https://doi.org/10.3390/app15105701
Submission received: 7 April 2025 / Revised: 13 May 2025 / Accepted: 14 May 2025 / Published: 20 May 2025

Abstract

:
Inertial microfluidics has gained significant attention for cell counting applications due to its simplicity, high throughput, and precision. This study utilized an inertial flow microfluidic device to count blood cell-sized microparticles, simulating normal and diseased conditions. The device could focus on and count cells sized between 7 µm and 16 µm while being observed under optical microscopes, with controlled flow rates from 1 to 15 µL/min. Suspensions of cells with ratios of 600:1 for normal conditions and 400:1 for diseased conditions were studied in microchannels at different flow rates. The methodology for counting involved using a syringe pump for precise flow actuation and employing an image-based particle counting technique through optical microscopy, utilizing the passive technique of inertial microfluidics. Results were compared using two optical microscopes across both suspension types. The key findings showed that at a 600:1 ratio of 8 µm and 15 µm cells, counts of 6.45 × 10⁷ cells/mL and 1.10 × 10⁷ cells/mL, respectively, while in the 400:1 ratio of both cells, counts of 4.5 × 10⁷ cells/mL and 2.16 × 10⁷ cells/mL, respectively, were achieved at optimal parameters. This study employed an inertial flow microfluidic device to count microparticles the size of blood cells. We assessed the counting performance using optical microscopy at two different cell ratios and validated our results against hemocytometer counts. Our findings demonstrate that the channel size 150 µm and the flow rate at 1 µL/min provided the optimal counting accuracy for both particle sizes. This device offers an efficient and adaptable solution for accurate multi-cell counting under optimized conditions and supporting applications in resource-limited medical diagnostics.

1. Introduction

Microfluidic technology has increasingly impacted healthcare diagnostics, especially in developing countries, where limited access to advanced medical facilities contributes to high mortality rates [1]. These devices have gained prominence in biomedical applications such as cell counting and segregation, crucial for diagnosing and managing diseases where cell counts are indicative of patient health [2]. For instance, fluctuations in white blood cell counts are common in diseases such as malaria, viral infections, and typhoid, which are prevalent in many resource-limited settings [3]. In such scenarios, microfluidic devices offer a rapid and accurate means of performing cell counts, enabling prompt diagnosis and monitoring [4]. Microfluidic devices operate with precision, manipulating small fluid volumes through carefully designed microstructures [5]. The controlled environment within these devices enables the effective analysis of minimal sample volumes, leading to accurate diagnostics with reduced material costs. Their high sensitivity, low operational costs, and suitability for resource-limited settings have made them particularly valuable in healthcare [6].
Cell counting and sorting in microfluidics can be broadly categorized into active and passive techniques. Active techniques like dielectrophoresis (DEP), magnetophoresis, acoustophoresis, and optical tweezers manipulate cells using external force fields [7]. While they offer high resolution and real-time adjustability, they often require complex external setups and have limited throughput due to the need to overcome hydrodynamic drag [8]. Passive techniques, on the other hand, leverage channel geometries and intrinsic hydrodynamic forces for cell manipulation including methods like microscale filtration, pinched flow fractionation, deterministic lateral displacement, and inertial microfluidics [9]. These methods are generally simpler, more robust, and capable of higher throughput, making them suitable for diverse applications [10].
Several techniques for cell counting in microfluidic systems have been developed, including impedance-based cell counting, which leverages the electrical properties of cells for detection and quantification [11]. However, this method’s accuracy can be influenced by factors such as the cell size, shape, and internal composition, and scaling it for a wide range of cell concentrations presents challenges. Seto et al. proposed a microparticle counting method using a metal mesh device (MMD) to trap particles above a certain size [12]. The MMD sensor effectively collects and detects particulate matter (PM) through size fractionation, but it primarily captures larger particles. As a result, smaller particles may not be detected efficiently, which highlights a limitation in the method’s ability to monitor all PM sizes [13]. Huo et al. explored various optical detection methods, highlighting the use of techniques like fluorescence and absorption while also addressing the challenges of integrating multiple functionalities on a single microfluidic platform [14].
Optical and electrical detection methods both offer significant advantages in microfluidic cell analysis. Electrical detection methods, such as electrochemistry and Coulter counting, provide high sensitivity without the need for labeling [15], while optical methods like spectroscopy and photometric approaches offer label-free detection with simpler equipment, suitable for point-of-care testing [16]. Strohm et al. introduced an acoustic flow cytometer that combines microfluidics with high-frequency ultrasound for non-invasive cell size measurement [17]. Proper focusing in microfluidic channels is crucial for accurate cell analysis, achieved through methods such as sheath flow, dielectrophoretic, acoustic, inertial, and hydrodynamic focusing [18]. Hydrodynamic focusing, in particular, allows for the precise control of particle positioning within microfluidic channels, facilitated by factors like channel geometry, flow rates, and Reynolds number [19].
The fabrication of microfluidic devices is accomplished through techniques such as photolithography, laser ablation [20], 3D printing, and soft lithography [21]. Soft lithography, as explored by Mukherjee et al., is a widely used method known for its simplicity and effectiveness in creating microscale features. Traditional cell counting techniques, such as hemocytometers and flow cytometry [22], face significant challenges that hinder their effectiveness in various applications. Hemocytometers are labor-intensive, time consuming, and require skilled personnel, leading to variability in results. Furthermore, they are not well-suited for high-throughput scenarios, making them inefficient for processing large sample volumes [23].
Despite the recent advancements in microfluidic technologies for particle manipulation, there is a gap in the development of a reliable, image-based microfluidic platform capable of counting multiple sized cells at clinically relevant ratios. Most prior research has focused on high-end technologies for single-cell analysis or utilized complex instrumentation unsuitable for limited resource communities. In this study, we present an image-based technique using an inertial microfluidic device for the multi-size microparticle counting of normal and diseased cell conditions. The microchannel dimensions and flow rates were selected based on the literature review, and full factorial analysis was conducted to enhance the particle counting accuracy based on the principles of inertial microfluidics. This device offers a comparable counting accuracy to conventional techniques like hemocytometers, suitable for conditions such as anemia, infections, and autoimmune disorders. The experiments aimed to identify the optimal device parameters, such as geometry of 150 µm and the flow rate at 1 µL/min, varying the cell size ratios that maximize counting accuracy while also validating the results against traditional hemocytometer measurements. The proposed integrated inertial microfluidic system streamlines and automates the entire process of counting microparticles, making it more accessible and affordable at the point-of-care.

2. Materials and Methods

2.1. Fabrication of Microchannels

A square geometry was chosen to ensure uniform inertial lift forces along both channel walls, enhancing the predictability of particle focusing behavior. This geometry promotes predictable particle behavior, improving the separation between cells for efficient focusing and counting [24], as shown in Figure 1. Channel sizes of 150 μm, 200 μm, and 250 μm were selected to optimize inertial focusing and the separation of microcells, which typically measure 6–20 μm in diameter. These dimensions ensure that the particle-to-channel size ratio (a/Dh) remains within the ideal range of 0.05–0.2, facilitating efficient inertial migration for particle focusing [25]. The selected microchannel geometry incorporates advanced features beyond a simple straight channel to leverage inertial microfluidics, a passive technique for manipulating particles [26]. This structured, curved geometry generates inertial lift forces and secondary Dean flows, which promote the lateral migration of particles to well-defined equilibrium positions within the channel [27]. This passive focusing effect significantly improves the particle alignment and ensures a more uniform distribution across the channel’s cross-section as particles travel through the observation zone.
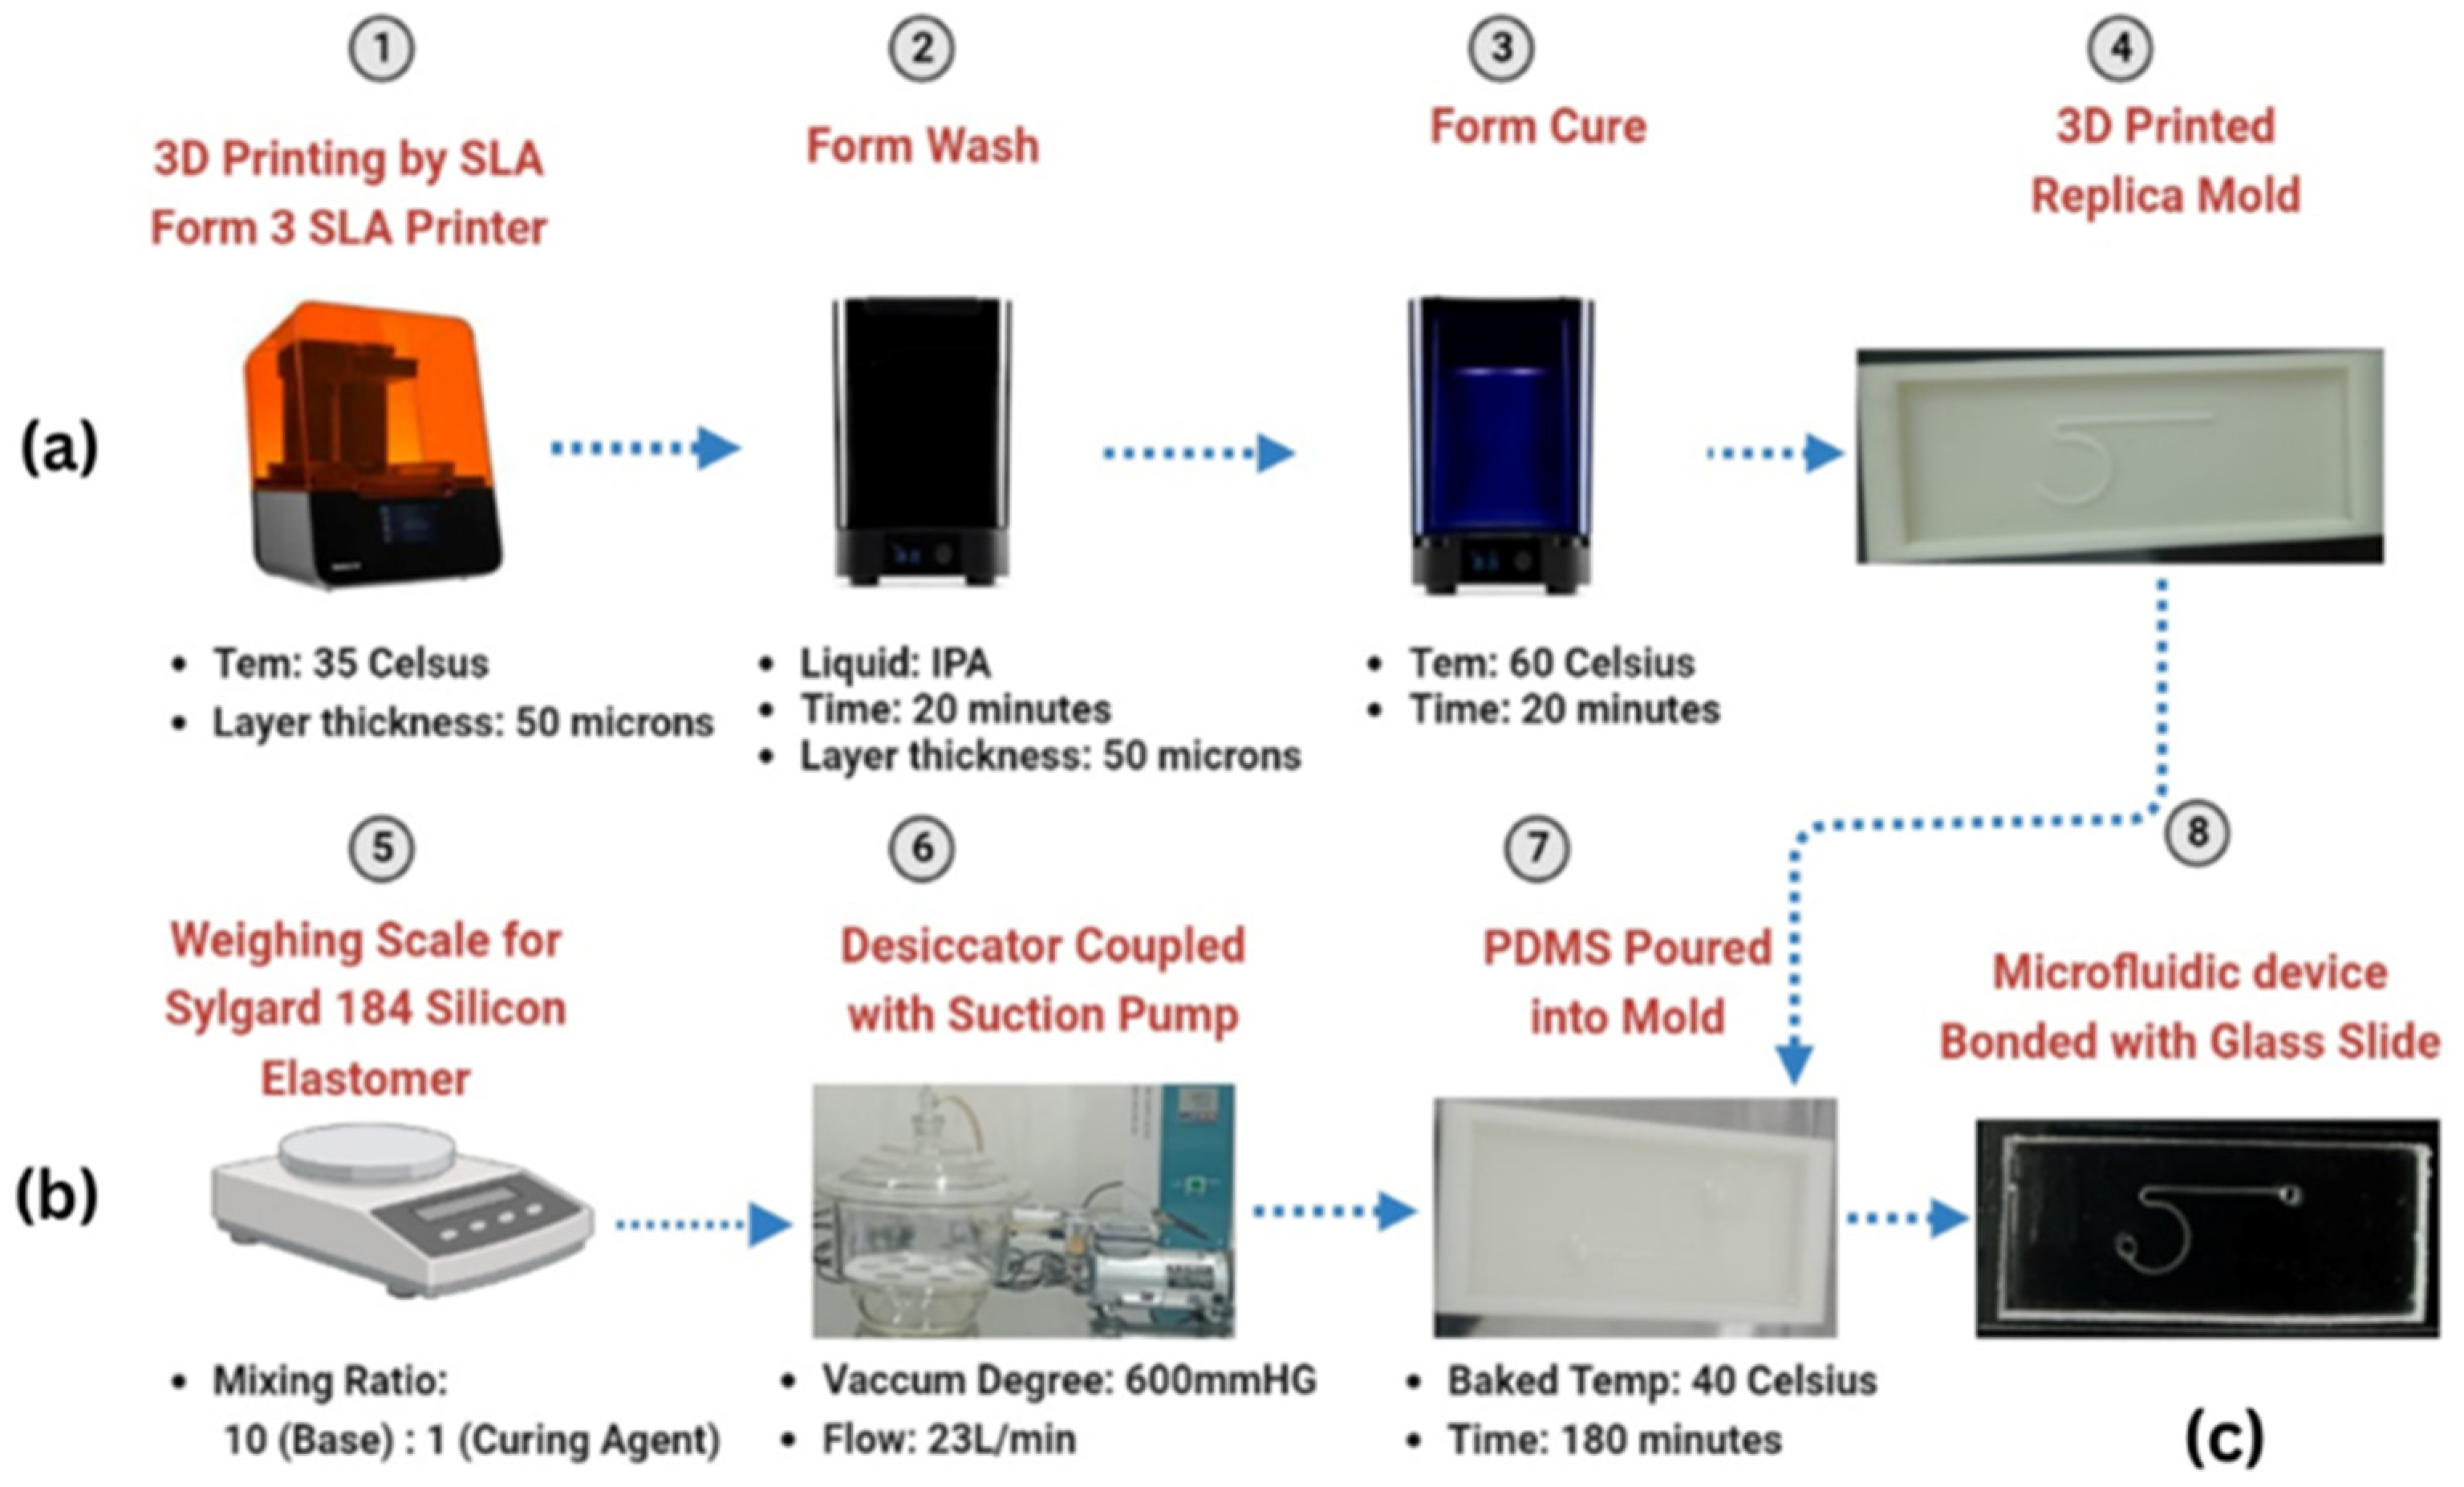
The microchannels were fabricated using the soft lithography method, which involves creating a patterned mold through 3D printing technology. A 3D printer (Form 3, Form Lab SLA 3D printer) was utilized to produce the master mold with high precision, as shown in Figure 1 [28]. This technique allows for intricate designs and accurate replication of the microchannel patterns.

2.1.1. Mold Preparation

The master mold was created using stereolithography (SLA) 3D printing with a Form 3 printer, achieving a layer resolution of 50 microns [29]. After printing at 35 °C, the mold underwent post-processing, which involved washing it in isopropyl alcohol for 20 min and curing it at 60 °C for another 20 min. This process resulted in a durable structure featuring intricate microchannel patterns, ideal for PDMS replication, as shown in Figure 2a.

2.1.2. PDMS Preparation and Casting

PDMS (polydimethylsiloxane) was used as the base material for microchannel fabrication due to its excellent flexibility, optical transparency, and biocompatibility. PDMS (Sylgard-184) was prepared by mixing the base and curing agent in a 10:1 weight ratio (Figure 2b) [30]. The mixture was thoroughly stirred to ensure uniformity. The mixture was degassed in a desiccator for 2 h to eliminate air bubbles, ensuring the smooth formation of microchannels [31]. This was then poured into a 3D-printed mold and cured at 40 °C for 180 min, creating the microchannel structure while maintaining material integrity during low-temperature baking (Figure 2b,c) [32].

2.2. Device Assembly

After curing, the PDMS layer was peeled off from the mold, creating a negative replica of the microchannel design. The inlet and outlet ports were formed by punching the PDMS layer, followed by bonding the microfluidic chip to a glass slide using plasma treatment with a BD-20AC corona discharge device. This bonding technique was applied to both the PDMS and glass surfaces to enhance adhesion and create a durable, leak-proof seal [33] (Figure 2c).
Figure 2 illustrates the entire fabrication process to ensures high reproducibility and precision in microchannel fabrication, suitable for various microfluidic applications.

2.3. Sample Flow Preparation

The fluid sample was prepared to mimic the viscosity and composition of normal human whole blood, providing a relevant medium for studying the sorting of microparticles analogous to blood cells [34]. The solution was composed of 59.98 vol% water, 40 vol% glycerol, 0.01 wt% xanthan gum, and 0.01 wt% starch. This specific mixture was chosen to replicate the shear-thinning properties of blood, ensuring that the experimental conditions closely simulated physiological environments.

2.3.1. Microparticle Selection and Ratios

To represent the cellular components of blood, microparticles were selected to match the sizes of erythrocytes (RBCs) and monocytes (WBCs). These microparticles had diameters of approximately 8 µm and 15 µm, respectively [35]. Two different ratios of these microparticles were prepared to reflect normal (600:1) and diseased (400:1) conditions.
These ratios were selected based on their clinical relevance, providing a model to study how changes in cell composition could affect separation in microfluidic devices. Table 1 provides a detailed overview of various RBC-to-WBC ratios and their associated medical conditions:

2.3.2. Sample Preparation Process

A total of 0.0125 g of microparticles was added to the prepared fluid medium in specified ratios, followed by 20 min of sonication to achieve uniform dispersion [41]. This sample preparation method ensured that the fluid dynamics and particle interactions closely mimicked physiological conditions, providing a controlled environment to study the sorting efficiency of different cellular compositions under various flow conditions [42].

2.4. Experimental Setup and Procedure

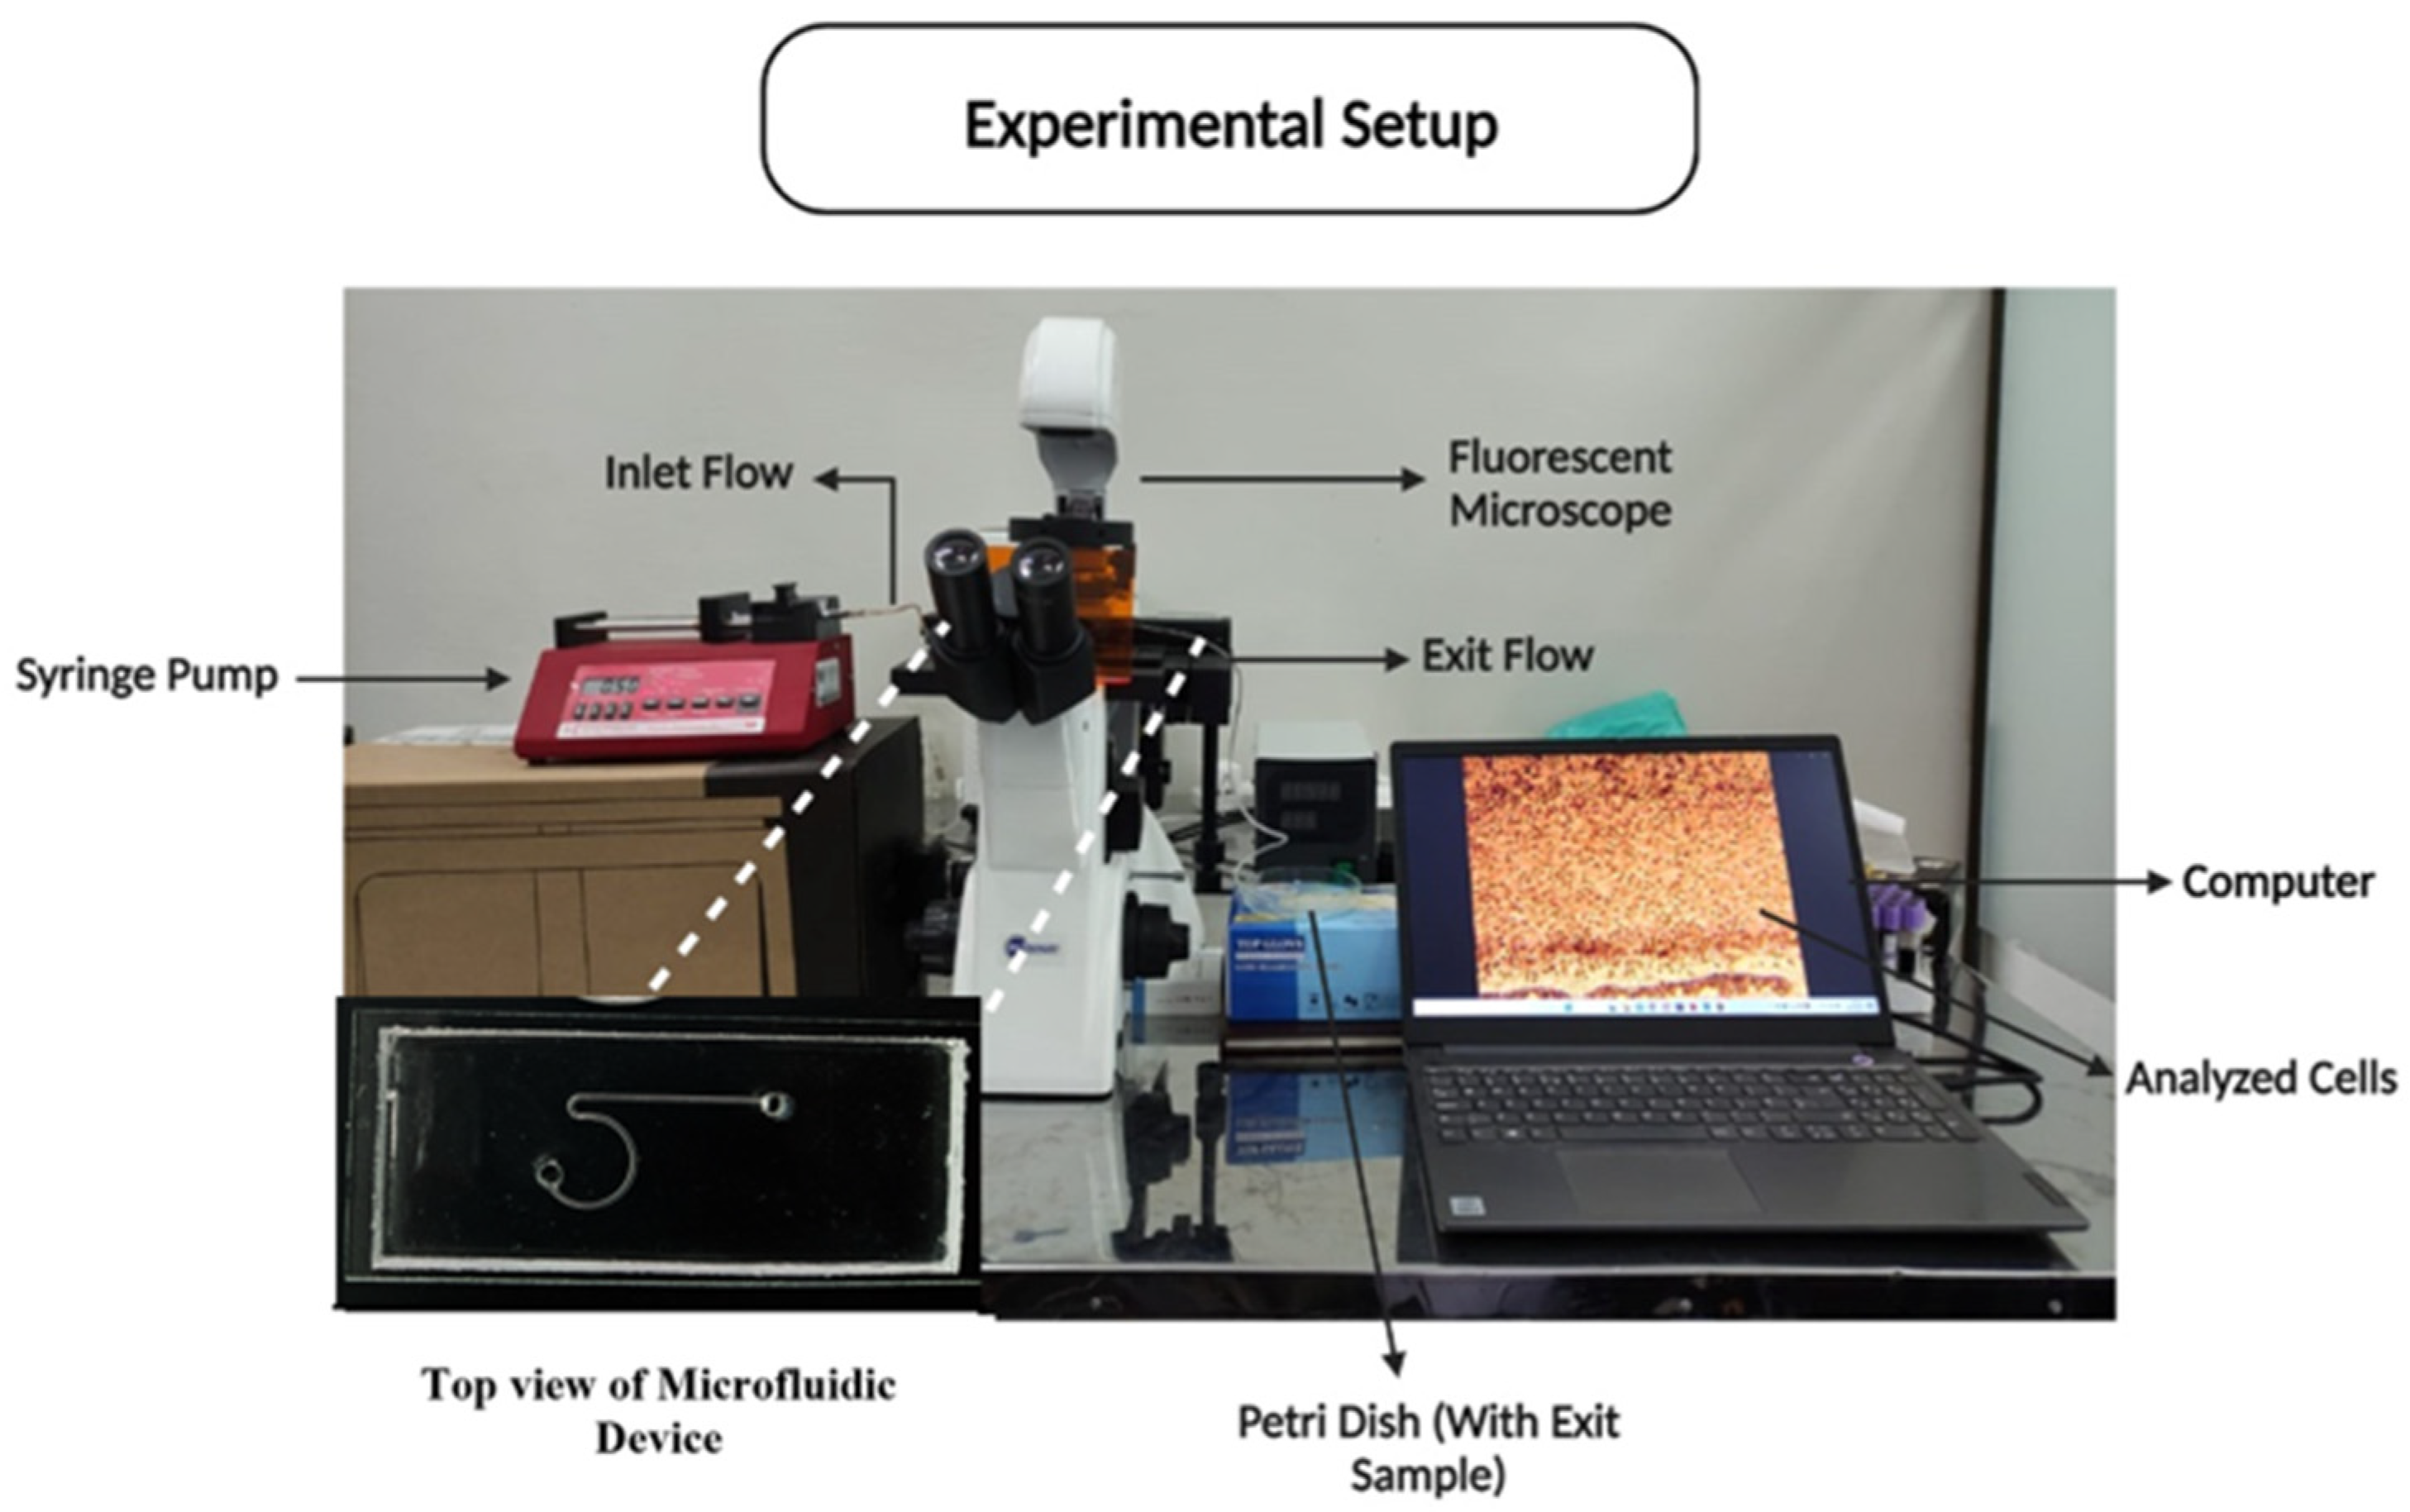
The experimental setup was carefully designed and positioned in a cleanroom environment to maintain a contamination-free setting, ensuring the integrity of the experimental results and adherence to strict safety protocols. As shown in Figure 3, the setup allowed for the controlled introduction and observation of the microparticle suspension within the microfluidic system. The experimental setup included a syringe pump for precise flow rate control, a microfluidic chip for sorting microparticles, and two imaging systems: an inverted microscope for real-time observation and a Bioimager fluorescent microscope for the enhanced visualization of particle behavior. Both microscopes were connected to a computer for image capture and analysis. During the experiments, the prepared microparticle suspension was introduced into the device using the syringe pump, and particle movement through the microchannels was recorded. The captured images were analyzed to quantify sorting efficiency and to examine how variations in flow rate affected the particle distribution and channel sizes.
Figure 3 provides a visual representation of the experimental setup, illustrating the arrangement of the syringe pump, microfluidic chip, microscopes, and data-recording mechanism. This setup was integral to observing the particle sorting process in real-time and collecting data for analysis.

Experimental Parameters

The experimental design in this study was meticulously crafted to assess the counting efficiency of microparticles within a microfluidic chip under various conditions. Key parameters, such as channel dimensions, flow rates, and particle concentrations, were systematically altered to investigate their effects on particle behavior and sorting efficiency. The design aimed to simulate physiological conditions and provide insights into the optimal configurations for particle separation.

2.5. Experimental Variables and Setup

To comprehensively analyze the sorting mechanism, the following parameters were varied, as shown in Table 2:
  • Microchannel dimensions: Square channels were designed with widths and depths of 150 µm, 200 µm, and 250 µm.
  • Particle ratios: Two particle ratios were used: 600:1 for normal conditions and 400:1 for diseased conditions, corresponding to the prevalence of RBC-sized and WBC-sized microparticles measuring 8 µm and 15 µm, respectively.
  • Flow rates: Flow rates of 1, 5, 10, and 15 µL/min were employed to assess the impact of flow velocity on particle focusing and counting.
  • Optical imaging: The sorting process and particle behavior were monitored using two microscopes: inverted and fluorescent.

2.5.1. Experimental Approach

  • Channel size variation: By systematically altering the channel sizes, the study aimed to determine how microchannel dimensions influence the fluidic behavior and sorting efficiency of particles. Smaller channels are expected to have more pronounced inertial effects, which may improve the focusing and sorting of particles.
  • Concentration effects: The different particle concentration ratios were selected to simulate both physiological and pathological conditions. This variation allowed for the examination of sorting efficiency under different biological conditions, offering insights into the device’s potential applications in clinical diagnostics.
  • Flow rate impact: Adjusting the flow rates provided an opportunity to study the balance between the inertial lift forces and viscous drag. Lower flow rates are anticipated to produce less pronounced inertial effects, whereas higher flow rates may enhance particle migration but risk increased shear forces that could affect the sorting accuracy.
  • Imaging and analysis: The use of both inverted and fluorescent microscopes enabled the capture of high-resolution images of particle movement. These data were crucial for quantifying the sorting efficiency and understanding the interaction between particles and the microchannel structure.

2.5.2. Hypothesis and Expected Outcomes

The experimental design was structured to test the hypothesis that variations in channel size, particle concentration, and flow rate would significantly affect the sorting efficiency of microparticles. As particles move through a microchannel at low Reynolds numbers, they experience inertial lift forces generated by velocity gradients and interactions with the channel walls. These forces drive particles across streamlines toward equilibrium positions. At lower flow rates, the inertial forces are weak, causing particles to either remain dispersed or exhibit inconsistent migration patterns. Increasing the flow rate enhances the lift forces, promoting lateral migration but also amplifying shear forces, which can lead to variability in particle alignment. Smaller channels intensify wall effects and shear gradients, resulting in stronger lift forces and more effective particle focusing. In contrast, larger channels reduce confinement, which can lead to less stable focusing and broader particle distributions. This led us to hypothesize that smaller channels and moderate flow rates would optimize particle alignment and improve the counting efficiency. By systematically exploring these variables, the study aimed to identify the optimal conditions for particle sorting in microfluidic devices, thereby contributing to the development of efficient cell sorting mechanisms for biomedical applications.

2.5.3. Counting Technique

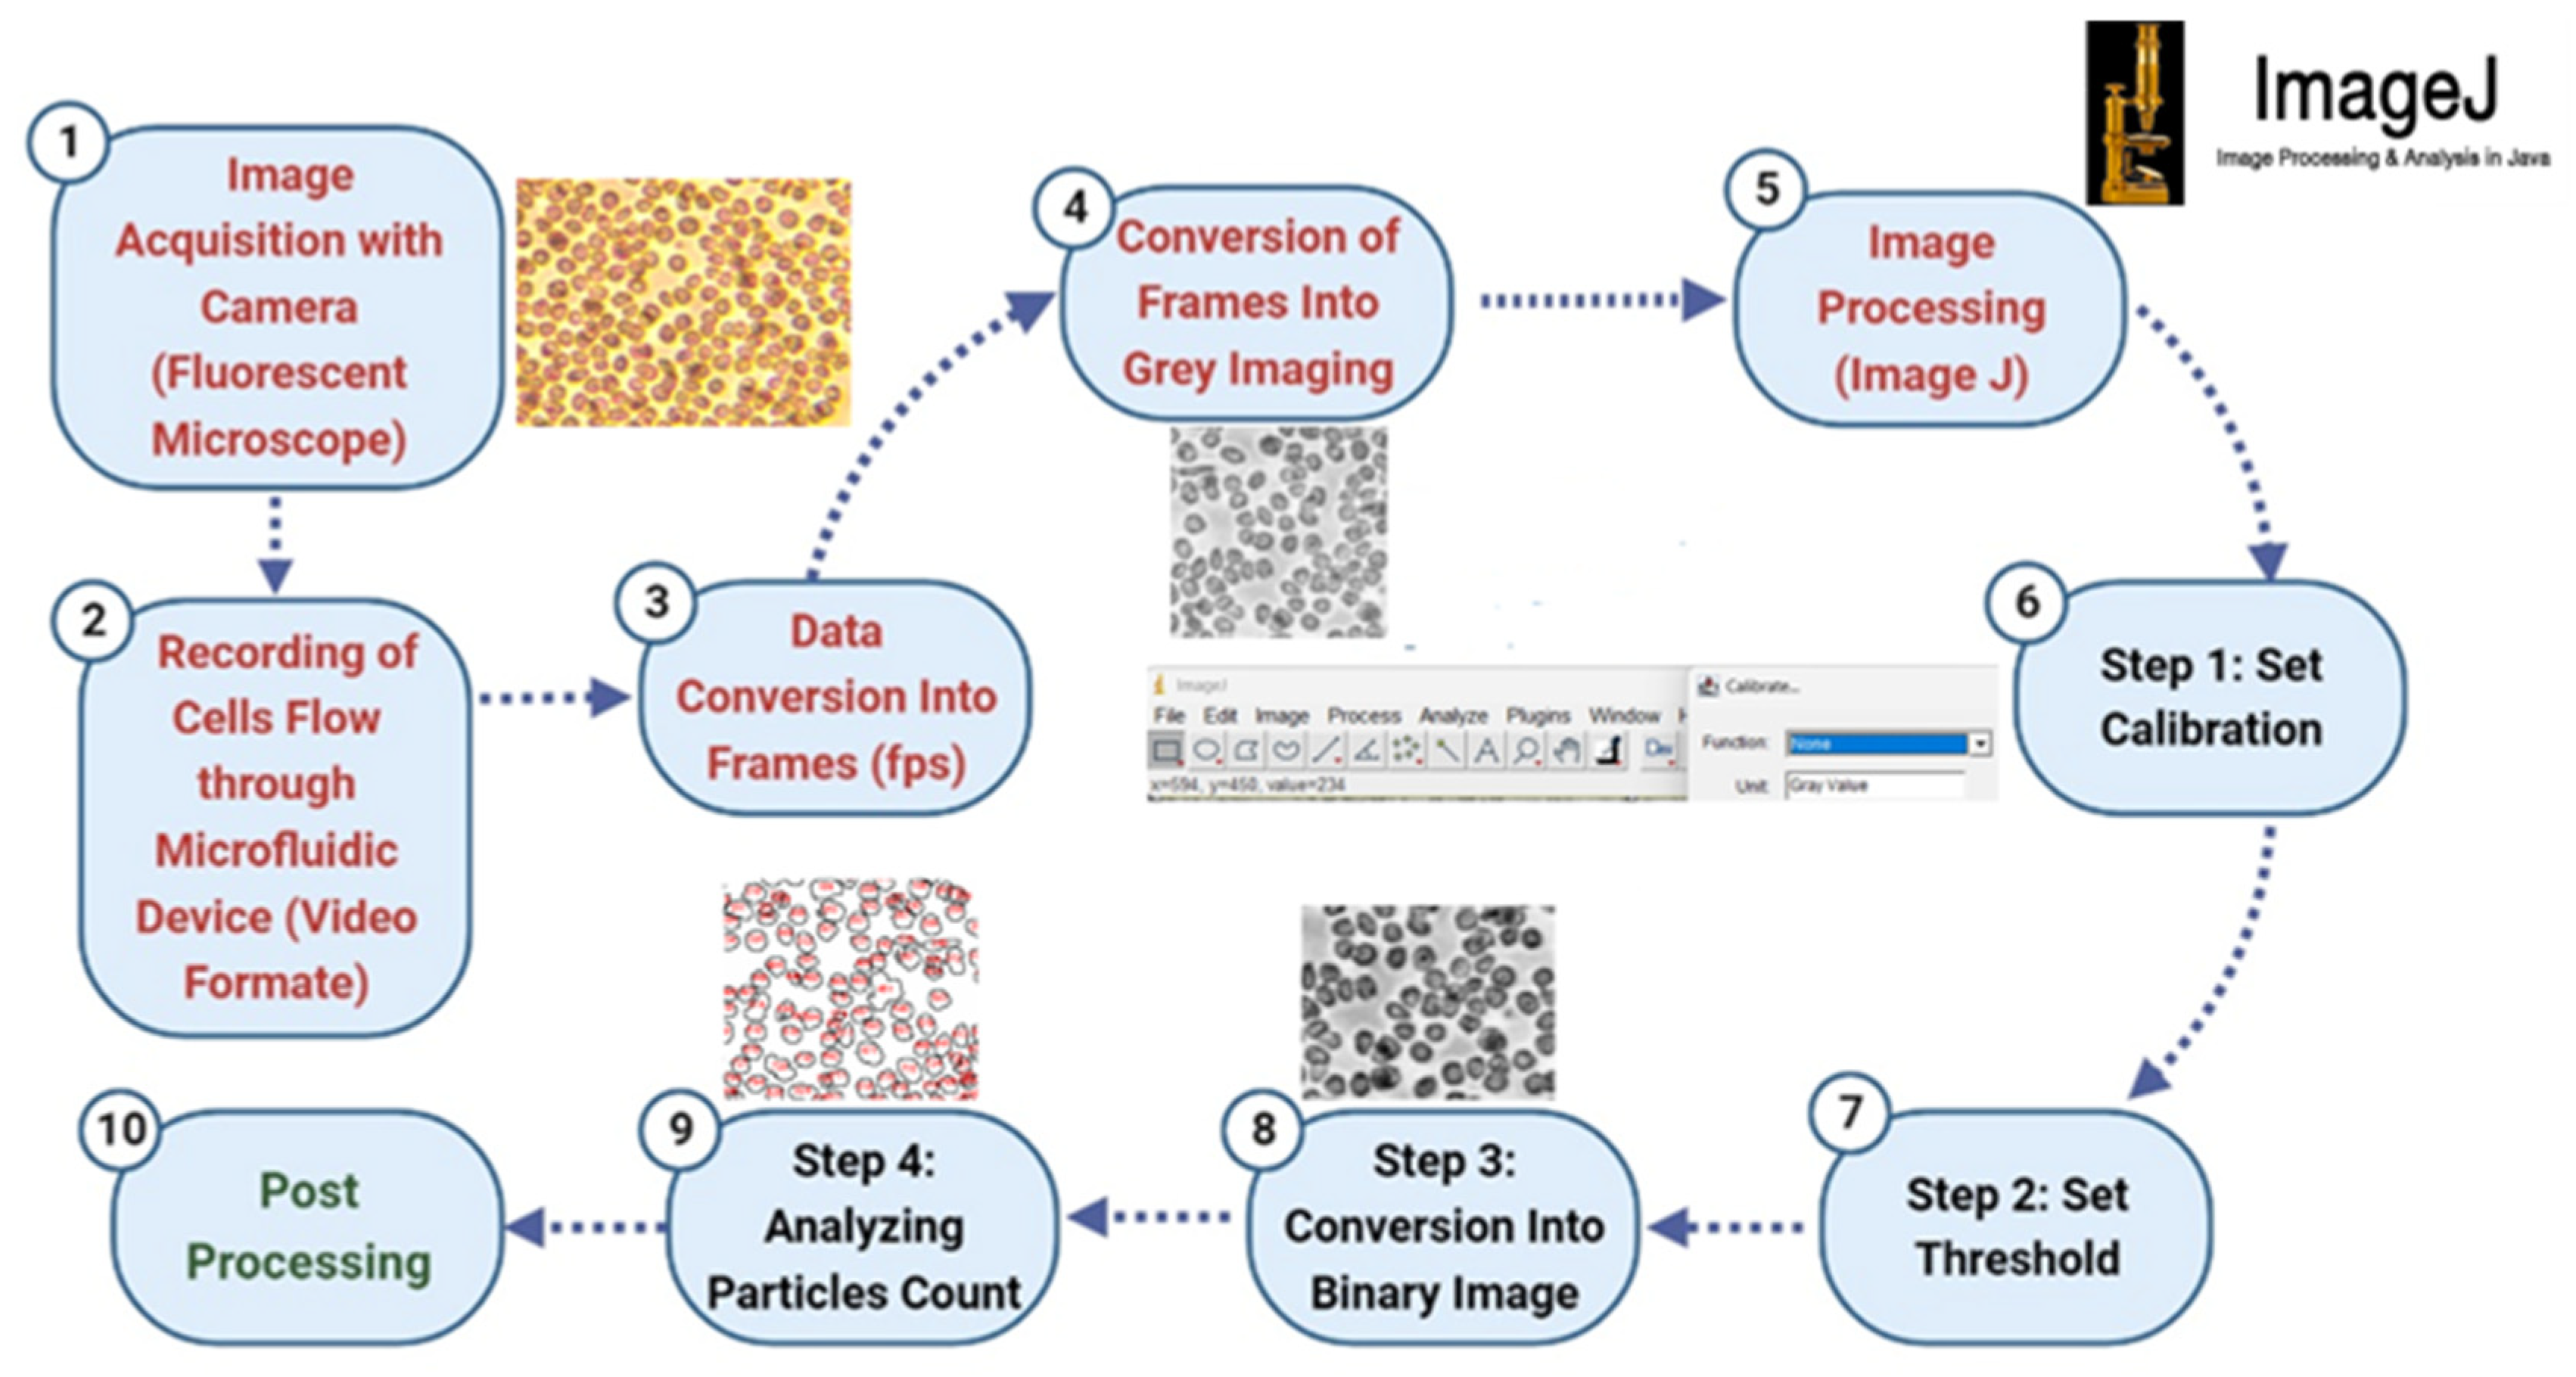
The particle counting process was carefully designed to ensure the accurate quantification of particles within the microfluidic chip. The procedure utilized advanced imaging and image processing techniques to monitor and analyze the behavior of particles as they traversed through the microchannel. The counting technique is illustrated in Figure 3 and involves a series of methodical steps to capture, process, and analyze the particle flow.
  • Step 1: Image Acquisition and Video Recording
A fluorescent microscope equipped with a camera was used to capture real-time video recordings of the microfluidic device in operation. The fluorescent microscope provided enhanced contrast for better visualization of the microparticles, allowing for clearer differentiation between the particles and the background. These recordings captured the dynamic flow of particles within the microchannel and were saved in video format for subsequent analysis.
  • Step 2: Data Conversion and Frame Extraction
The recorded videos were then converted into individual frames to facilitate a detailed analysis of particle movement. This conversion process was essential to capture the sequential flow of particles at different time points, providing a comprehensive dataset for analysis. The frames were extracted at a specific frame rate (fps) to ensure adequate temporal resolution for observing particle interactions and behavior within the channel.
  • Step 3: Image Preprocessing
Each extracted frame underwent preprocessing, where they were converted to grayscale using Python 3.11 coding (Figure 4) This conversion reduced the complexity of the images by eliminating color information, focusing solely on the intensity values that represent the particles. Grayscale conversion is crucial for enhancing the contrast between particles and the background, which aids in subsequent image processing steps.
  • Step 4: Image Processing and Calibration
Post-processing of the grayscale images was conducted using ImageJ 1.54p, a robust image analysis software. The first step in this process involved adjusting the brightness and contrast settings to further enhance the visibility of the particles, ensuring that even those with minimal contrast to the background were detected. Calibration was performed using a reference scale corresponding to the microscope’s magnification level, allowing for the accurate measurement of particle dimensions in real-world units. This calibration is critical for determining particle sizes and ensuring the accuracy of the counting process.
  • Step 5: Thresholding and Binary Conversion
To isolate the particles from the background, a thresholding technique was applied to each calibrated image (Figure 4). This technique involved setting a threshold level that differentiated particles from the background based on their intensity values. The images were then converted into binary format, where particles were represented as white (foreground) against a black (background) setting. This binary conversion effectively removed background noise and simplified the image, leaving only the particles for analysis.
  • Step 6: Automated Particle Counting
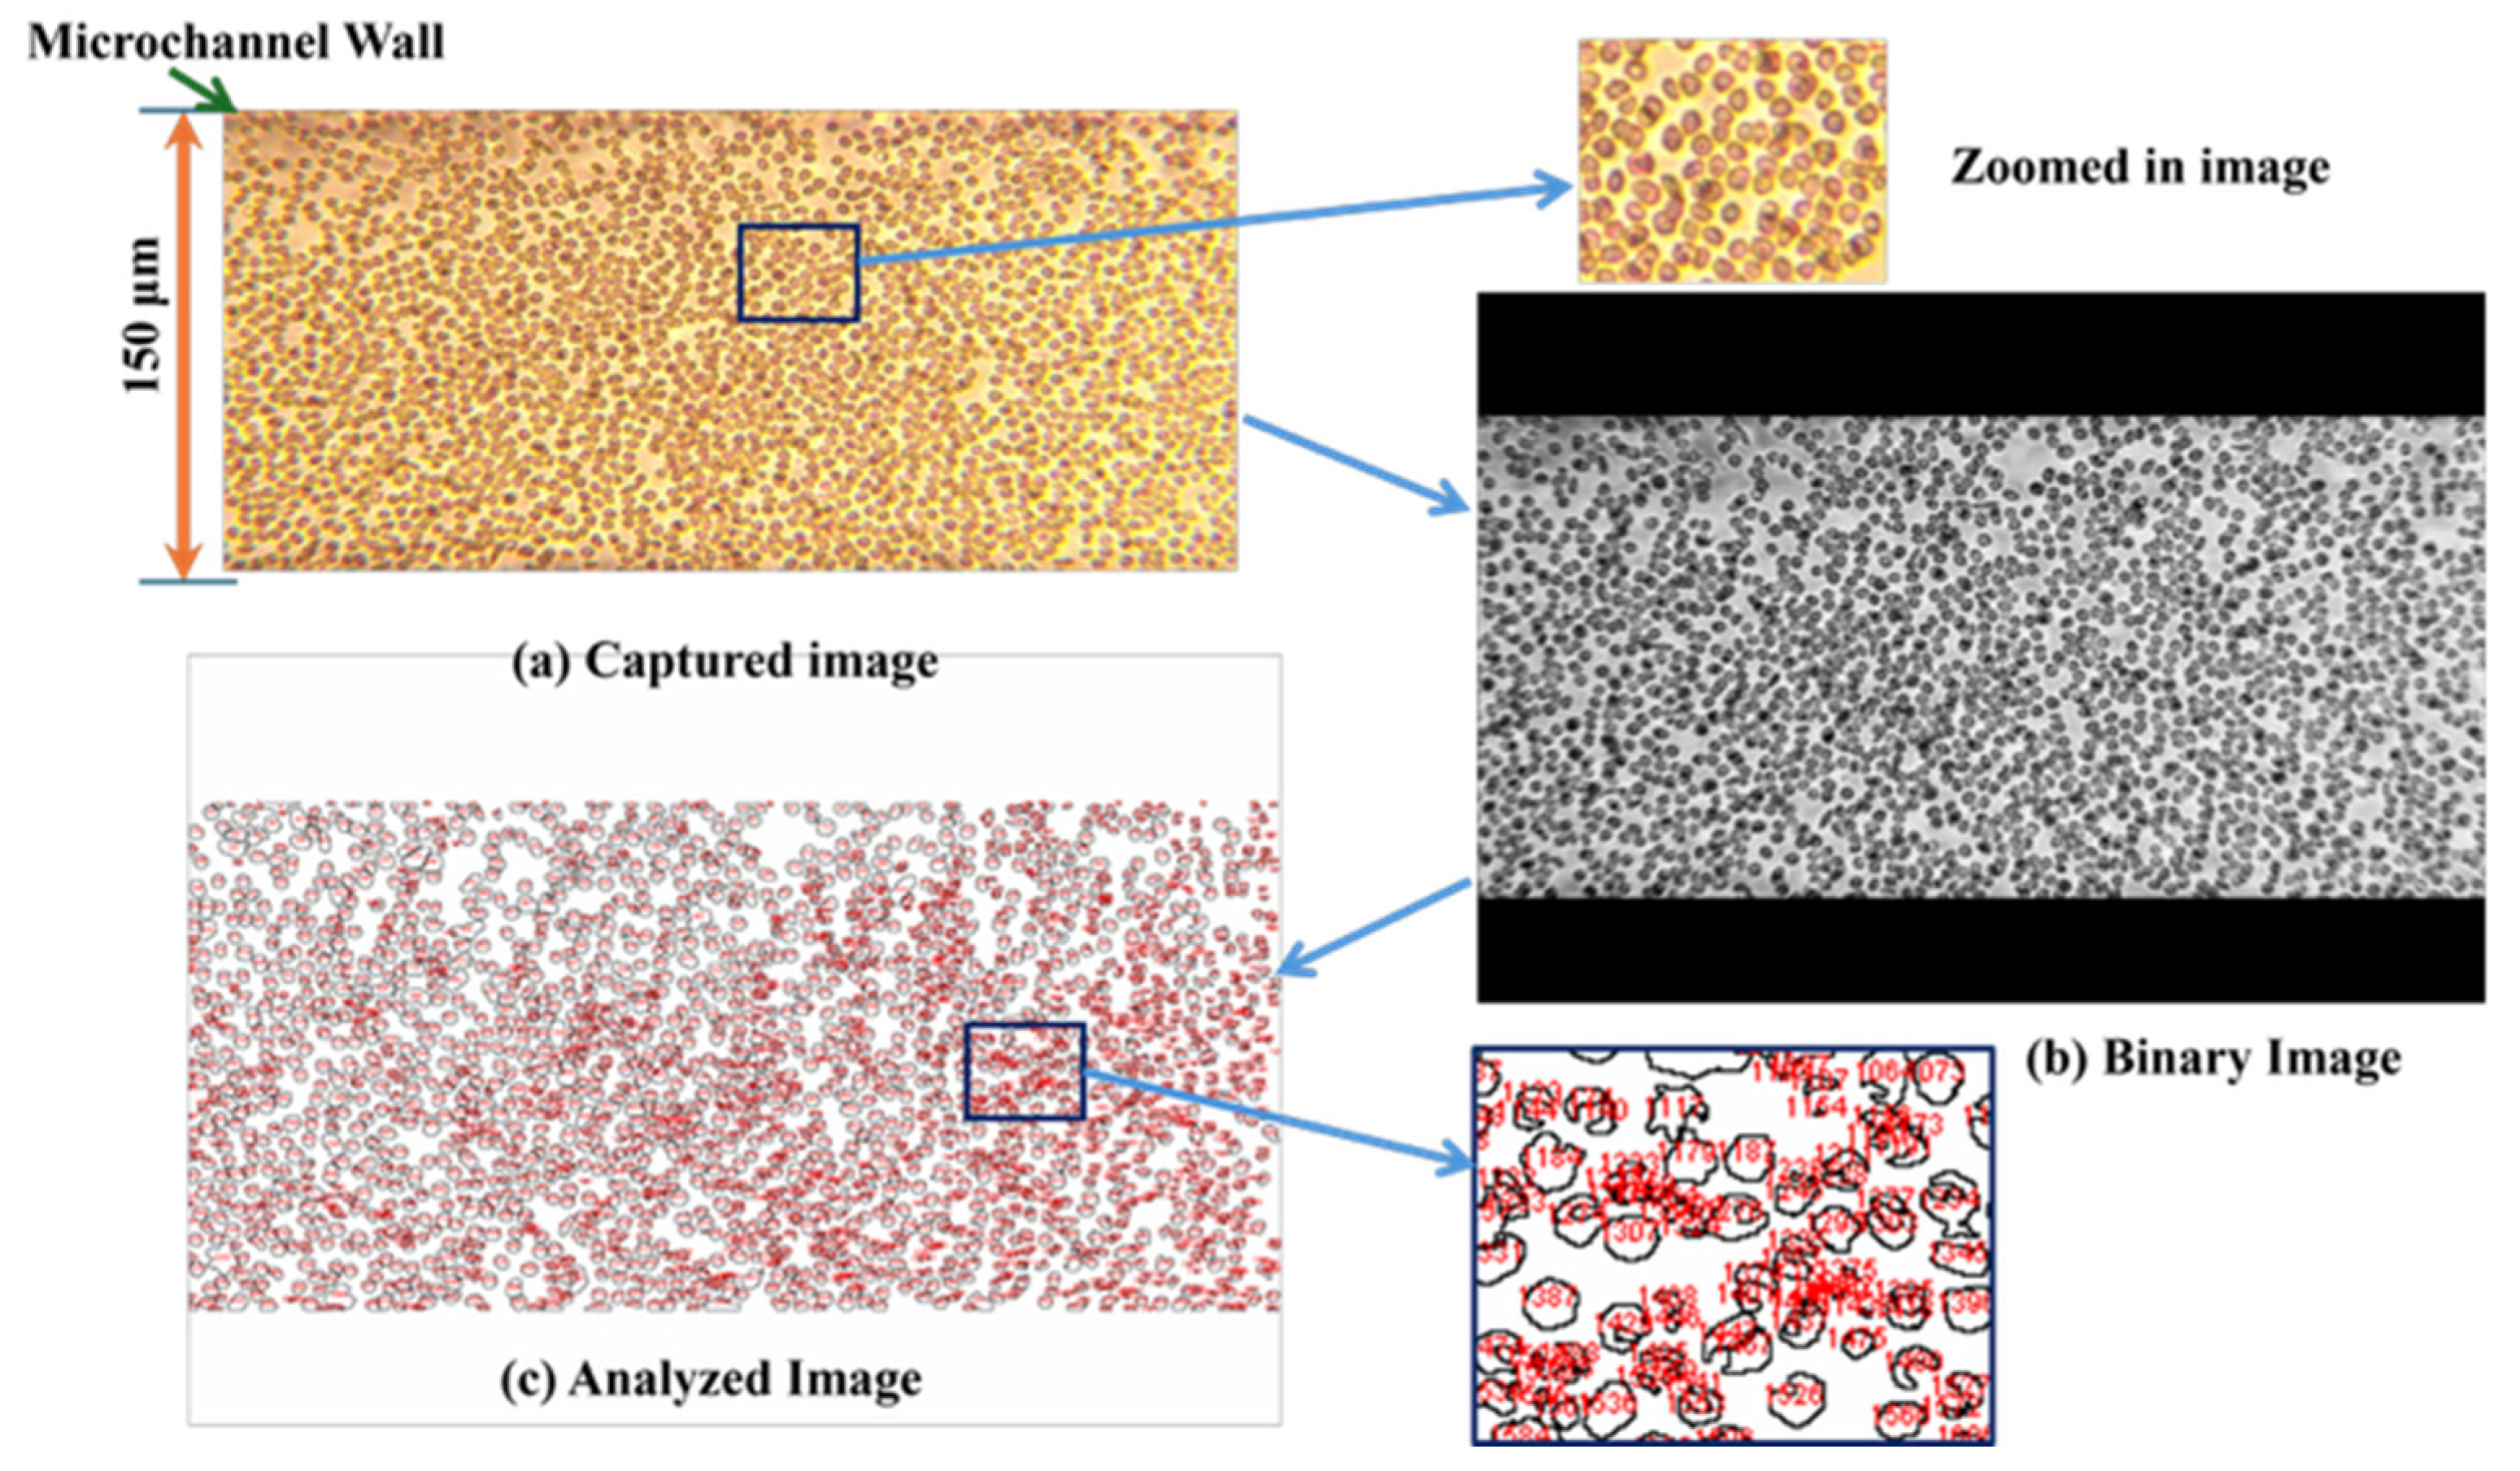
After obtaining the binary images, ImageJ’s automated particle counting feature was utilized to quantify the particles. The software analyzed the binary images to identify and count particles based on their size and area as shown in Figure 5. It provided a detailed count of the total number of particles as well as their distribution based on size categories. This automated counting process ensured a high level of accuracy and efficiency, minimizing the potential for human error in manual counting.
  • Step 7: Data Compilation and Analysis
The results from the automated counting were compiled to provide a detailed overview of the particle distribution within the microchannel. The data included the total particle count, size distribution, and any observed patterns in particle behavior. This quantitative analysis was essential for evaluating the performance of the microfluidic device and understanding the impact of flow dynamics on particle sorting.
  • Step 8: Validation and Post-Processing
Post-processing involved verifying the accuracy of the particle counting results. This included cross-referencing the counted particles with manual counts from a subset of frames to ensure the consistency and reliability of the automated process. Any discrepancies were addressed through further image refinement and analysis.

3. Results and Discussion

3.1. Validation of the Microfluidic Device

To assess the performance of the microfluidic device under normal (Ratio 1: 600:1) and diseased (Ratio 2: 400:1) conditions, we compared the particle counts with traditional hemocytometer readings. Tests were conducted at a flow rate of 1 µL/min in a 150 µm × 150 µm microchannel using the same samples. The results, presented in Table 3, demonstrated a strong comparison between the two methods. The smallest percentage errors observed were 1.8% for the 8 µm particles and 1.1% for the 15 µm particles in Ratio 1. For Ratio 2, the percentage errors remained within the acceptable 5% to 10% limits, measuring 2.2% for the 8 µm particles and 1.9% for the 15 µm particles, indicating reliable accuracy across different particle compositions.

3.2. Analysis of 8-µm Microparticle Counting at Normal Conditions (Ratio 1)

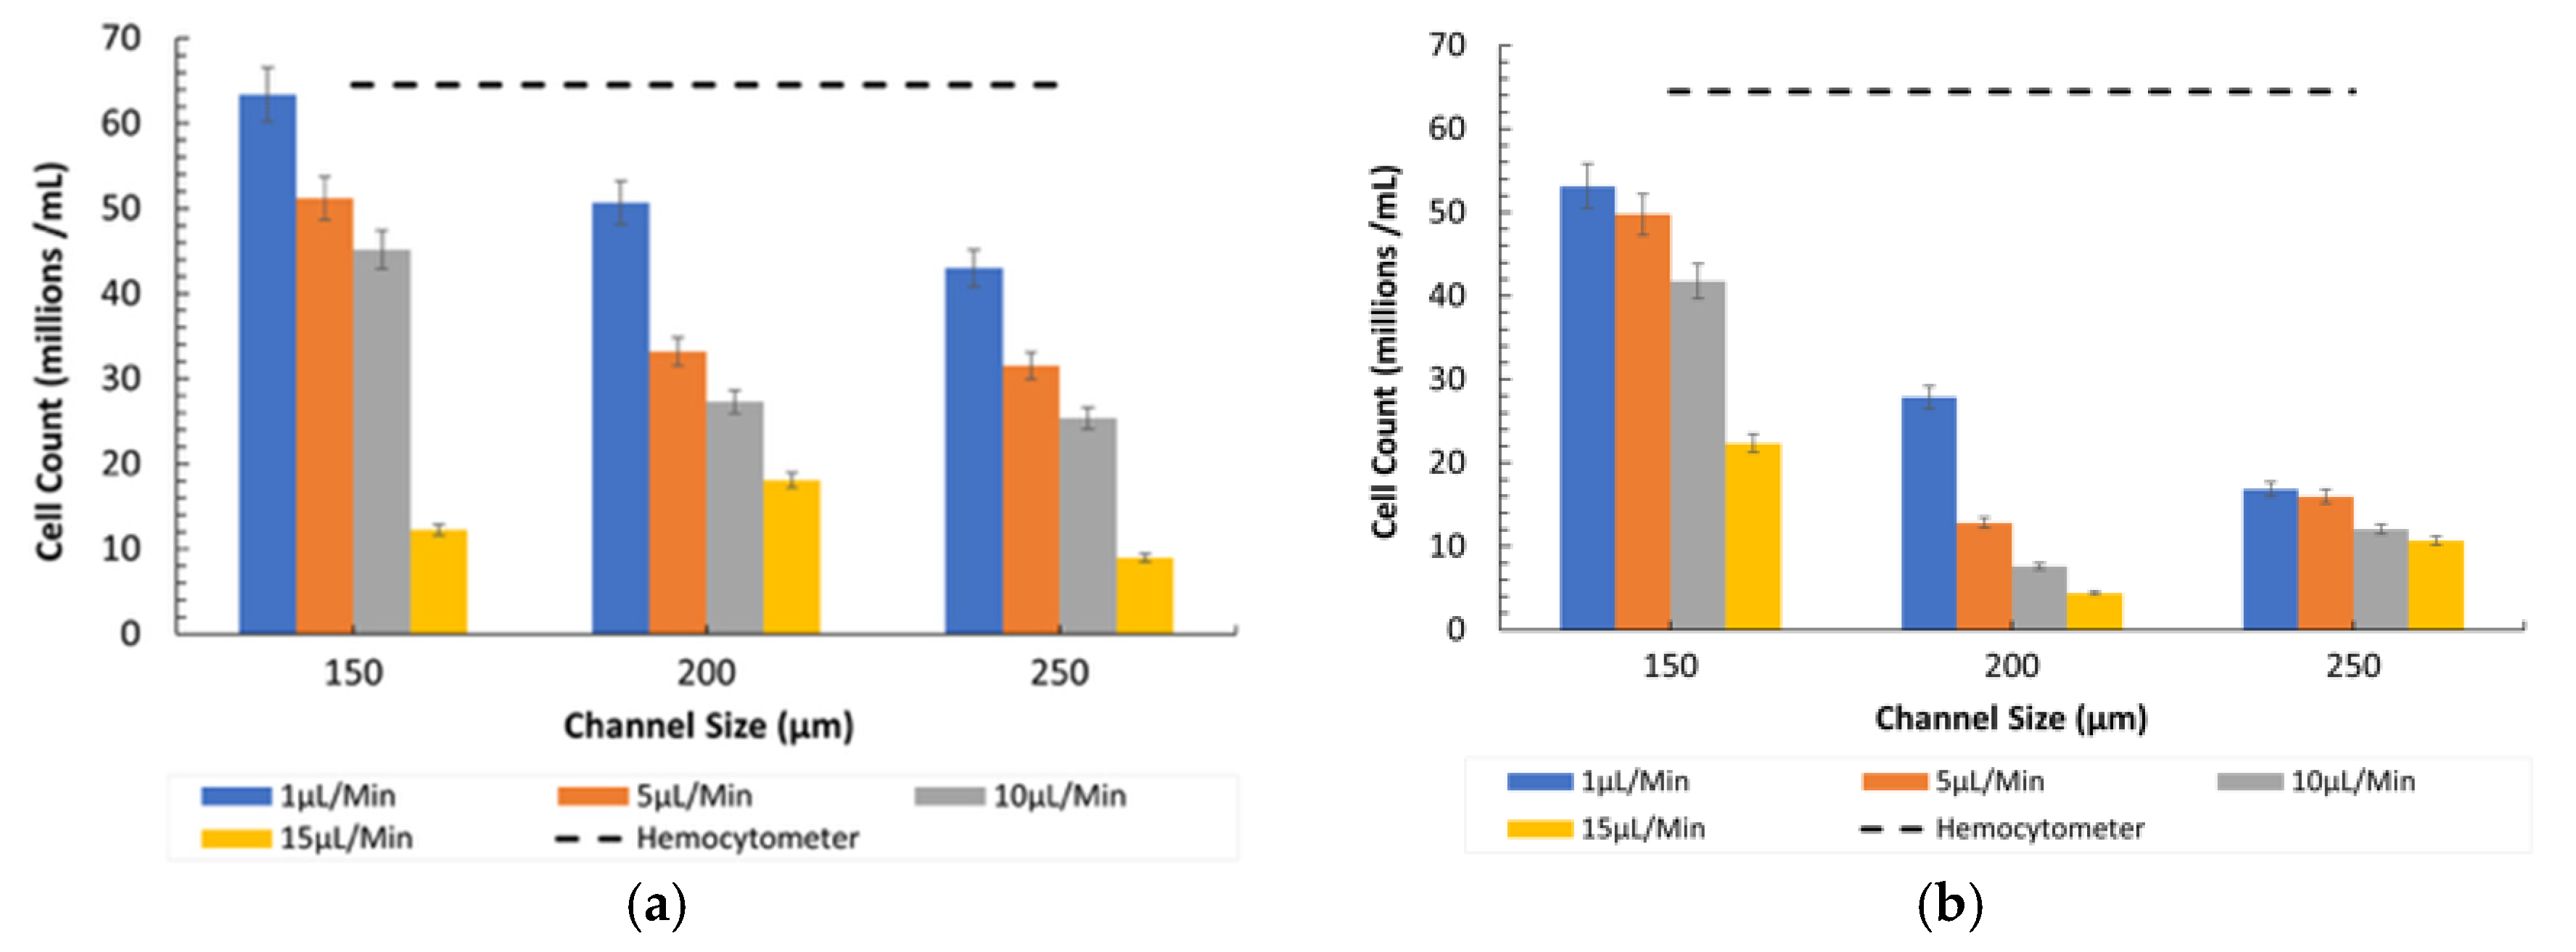
Figure 6 presents the results for counting 8-µm particles under normal conditions (ratio of 600:1) at various flow rates and channel sizes. The graph indicates that lower flow rates resulted in higher particle counts across all microchannel sizes. This suggests that at slower flow rates, particles have more time to interact with the detection mechanisms, enhancing counting efficiency. Additionally, narrower channels (150 µm) consistently yielded the highest particle counts, implying better control over particle flow and improved contact with detection zones in these conditions. At all channel sizes, the highest flow rate (15 µL/min) resulted in shear-gradient lift forces dominating over wall-induced lift forces, consistently leading to the lowest cell count. At a channel size of 200 µm and a flow rate of 15 µL/min, the combination of weakened inertial forces increased the dominance of shear gradients and reduced the residence time, creating conditions that reduced particle focusing.
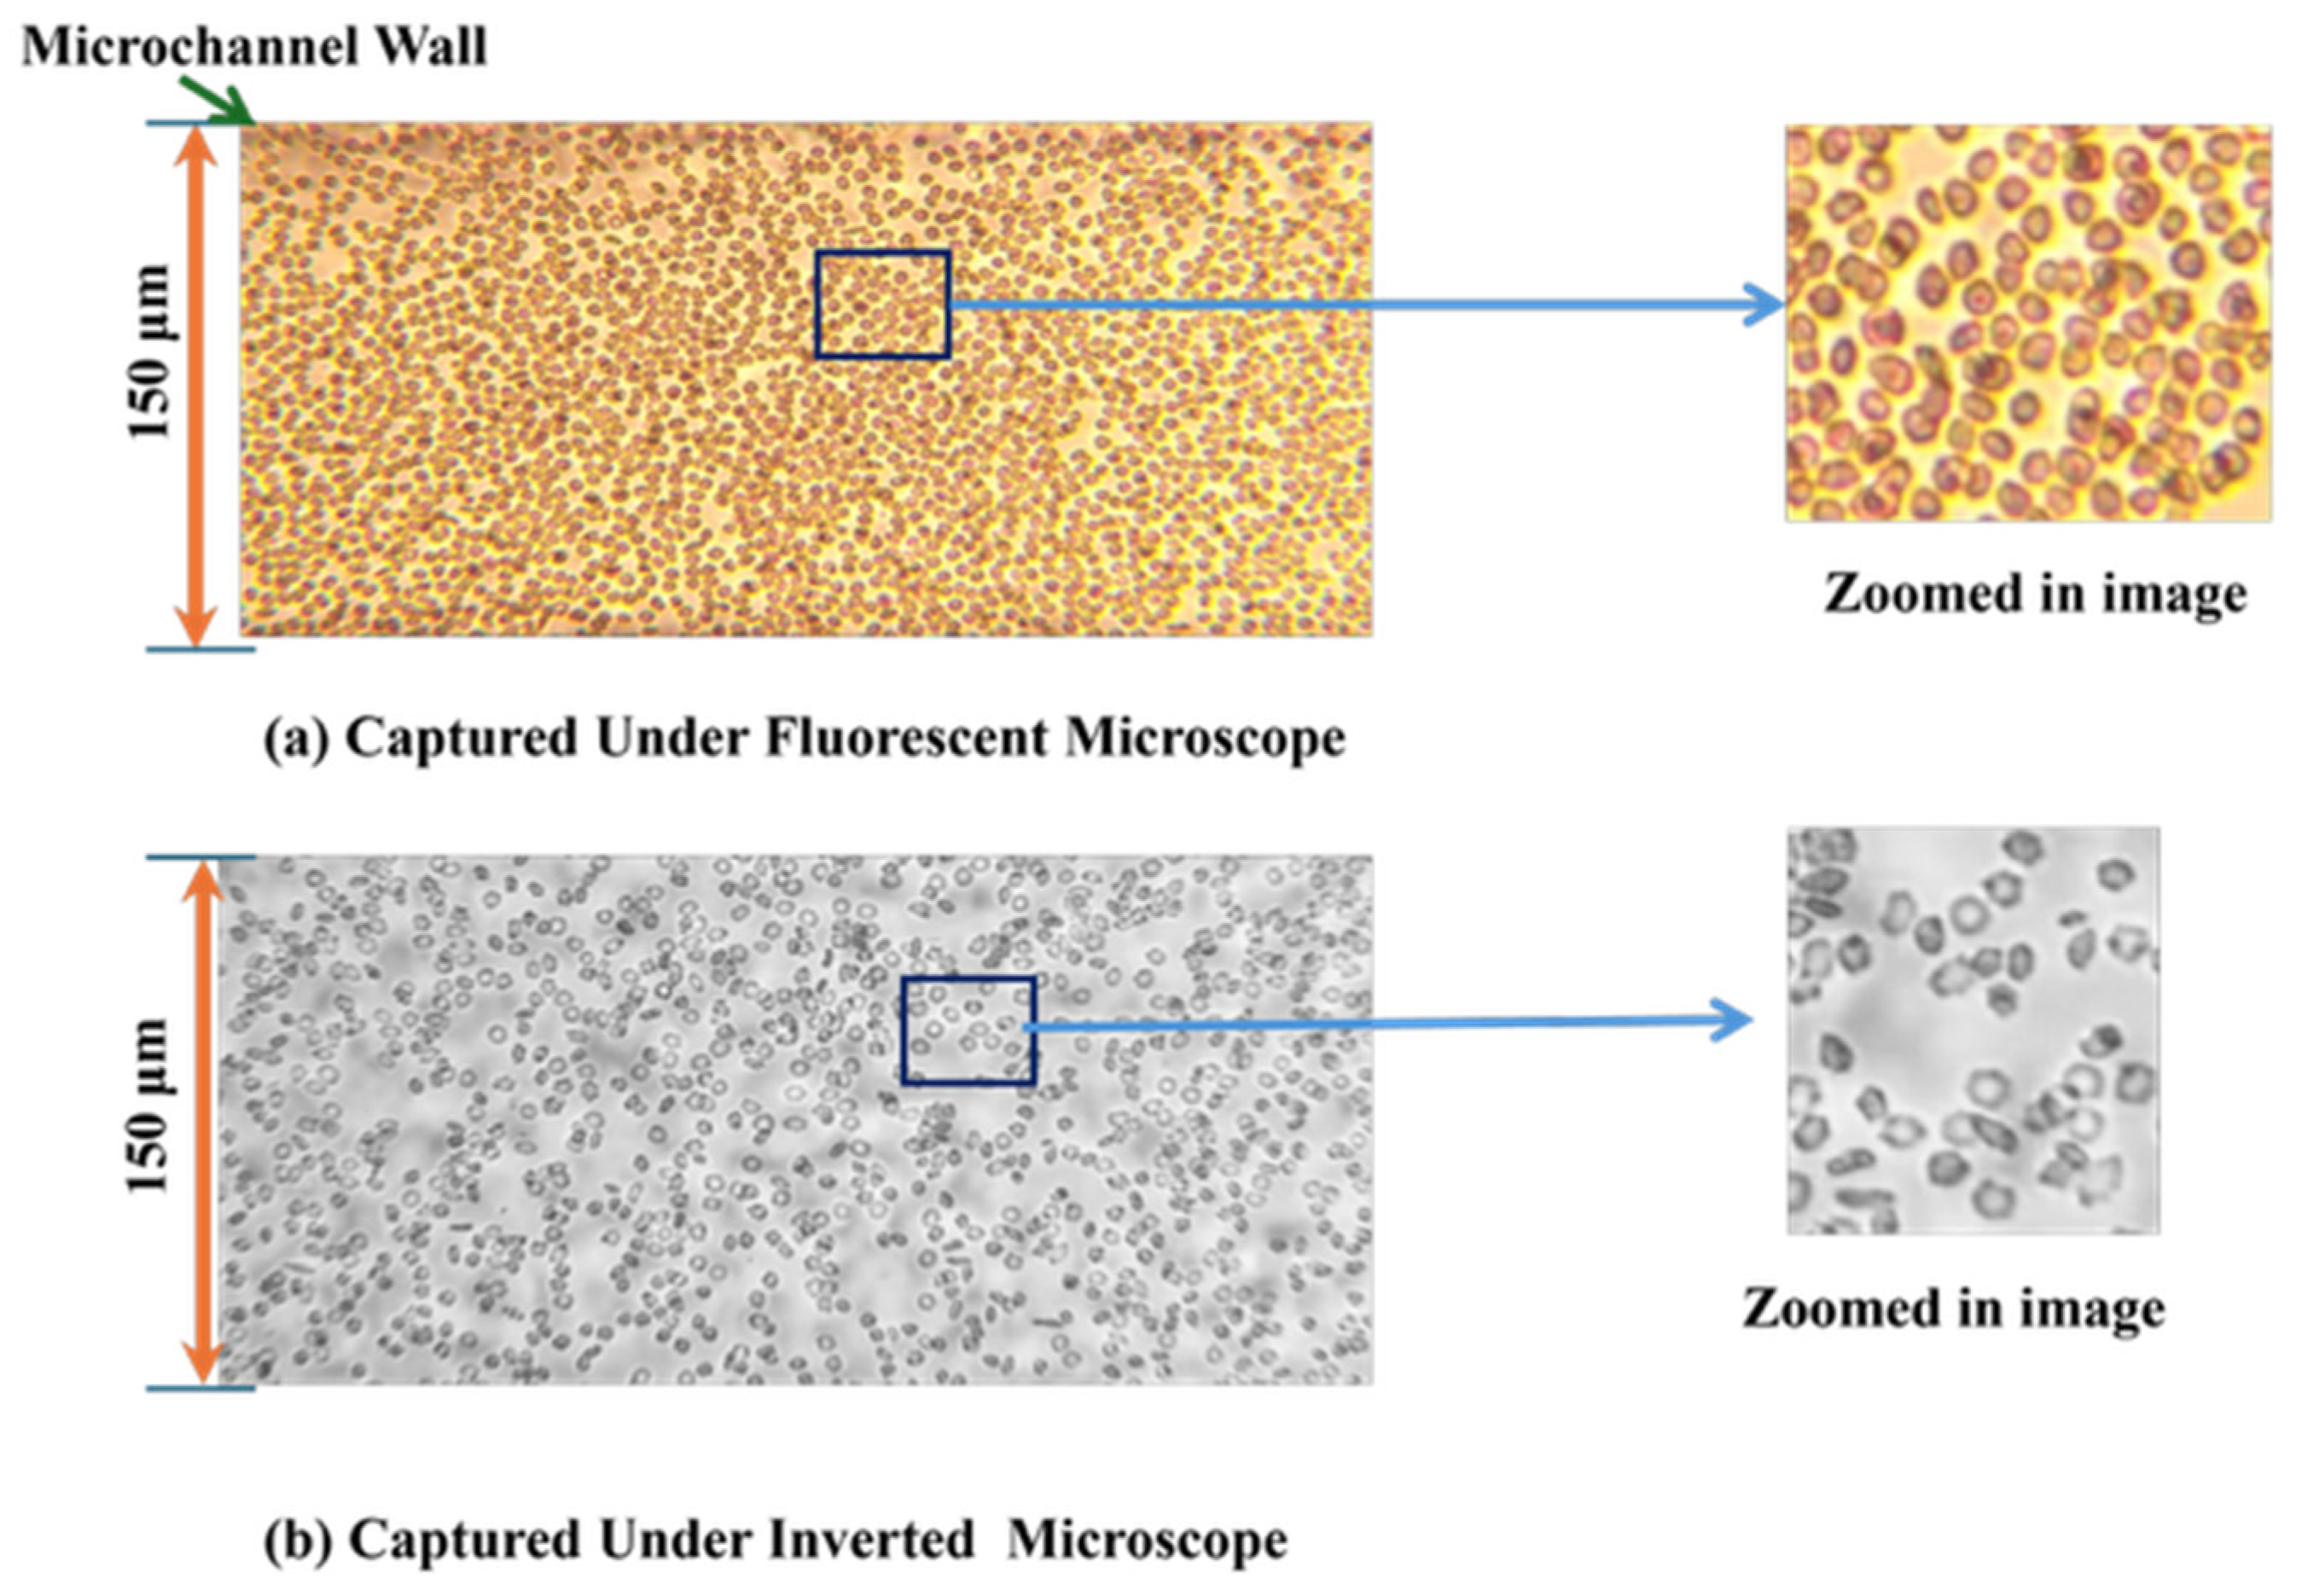
  • Fluorescent vs. Inverted Microscopy: Under the Bioimager fluorescent microscope, the particle counts were slightly higher compared with the inverted microscope, likely due to enhanced visibility and contrast provided by fluorescent imaging, as shown in Figure 7. Despite this difference, both imaging methods showed a decline in counting efficiency at higher flow rates. The optimal condition for counting 8-µm particles was observed at a 150 µm channel size and a 1 µL/min flow rate under the fluorescent microscope.

3.3. Counting of 15-µm Microparticles in Normal Conditions (Ratio 1)

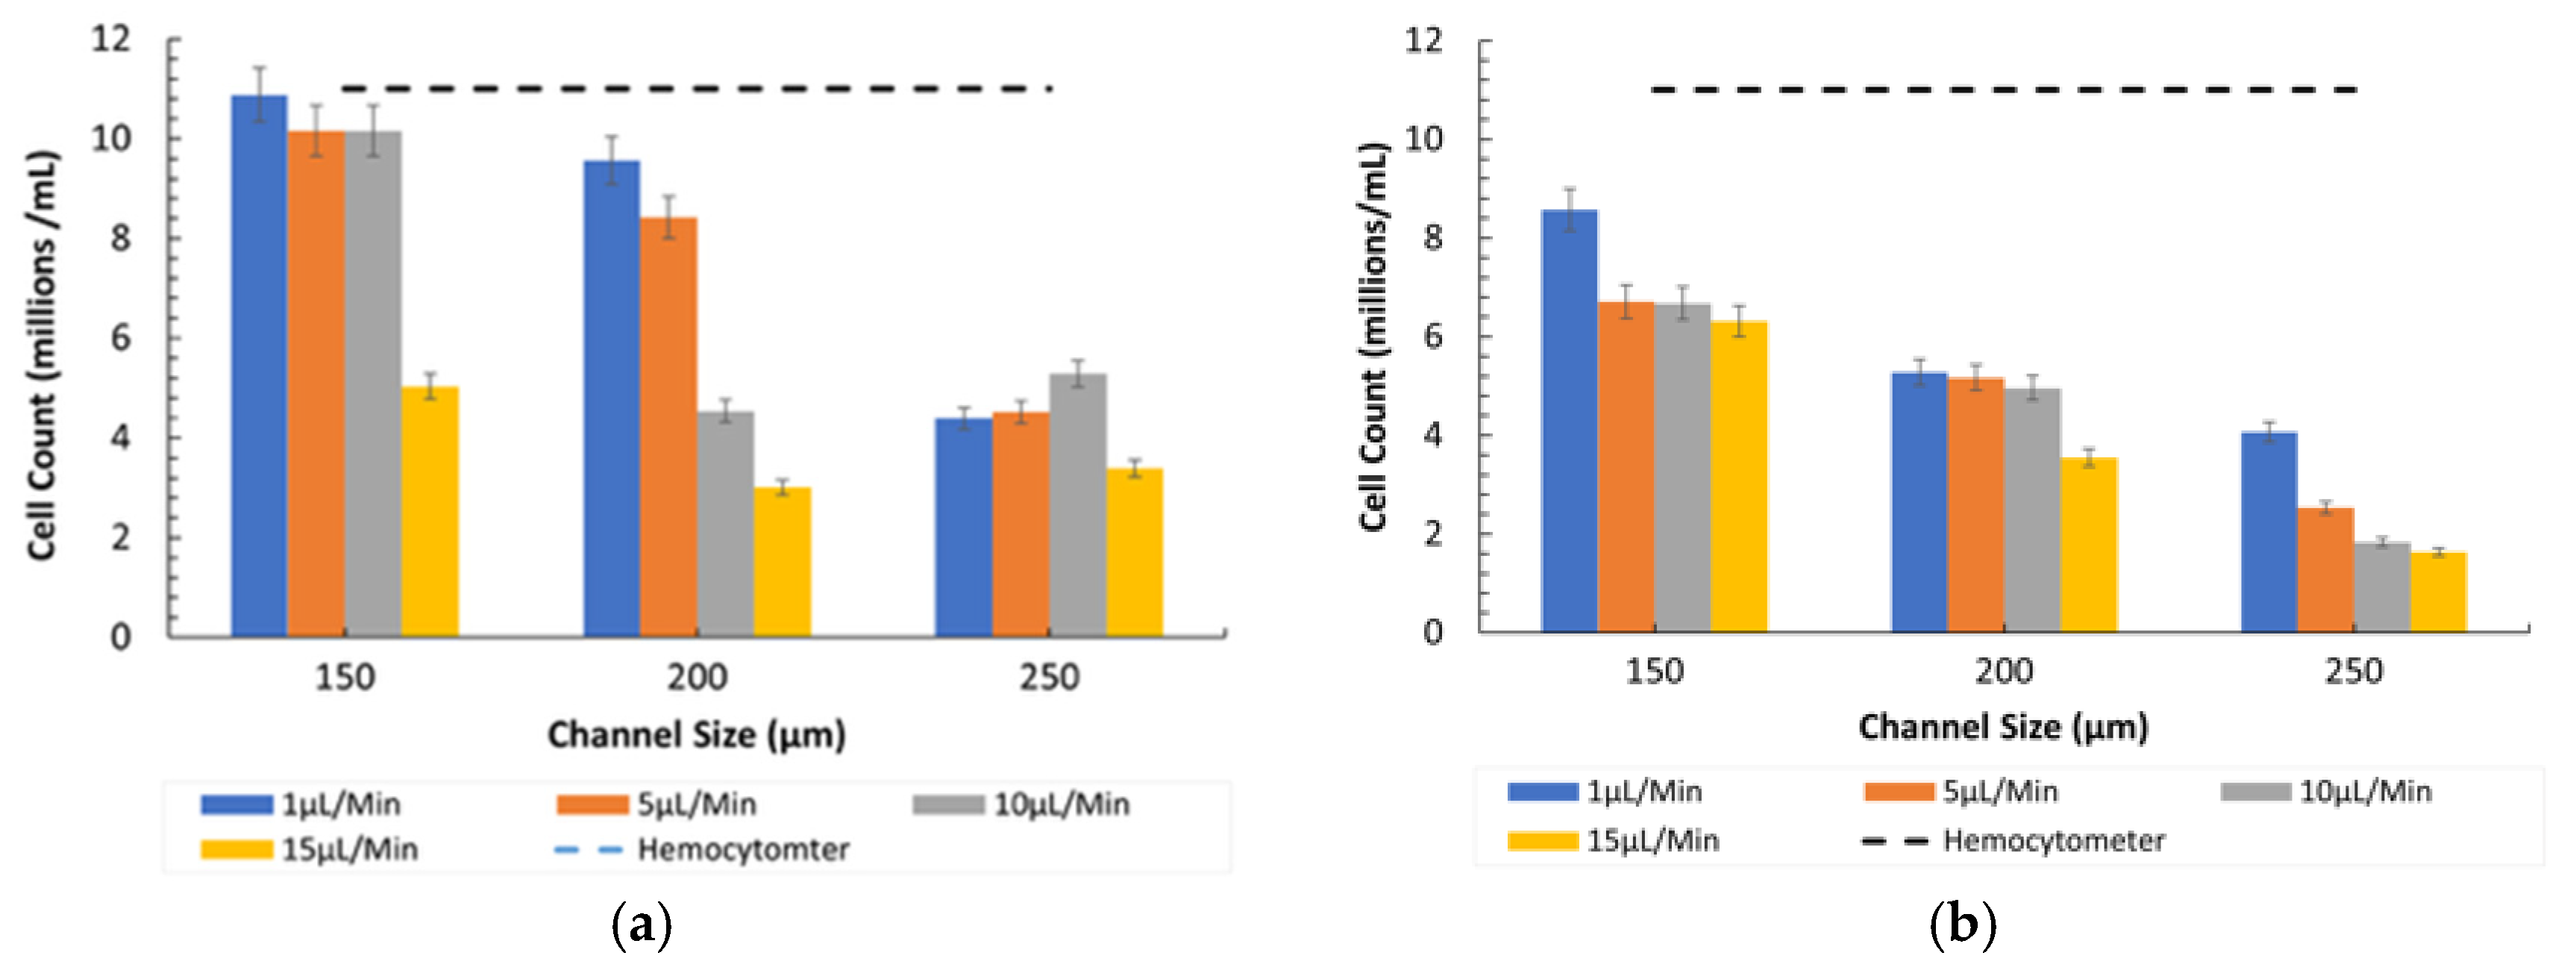
Figure 8 depicts the counting efficiency for 15-µm particles under the same normal conditions. A similar trend was observed where smaller channels and lower flow rates enhanced particle detection and counting efficiency.
  • Comparison between Microscopes: As in the case of the 8-µm particles, the fluorescent microscope provided slightly higher counts due to its superior imaging capabilities, as shown in Figure 7. The inverted microscope, although slightly less efficient, remained effective at lower flow rates. For both the 8 µm and 15 µm particles, the fluorescent microscope consistently yielded slightly higher particle counts. This was due to its superior contrast and sensitivity to particles, which improved edge detection during image processing. In contrast, the inverted microscope produced slightly lower count values, resulting in fewer detected particles.
At higher flow rates (15 µL/min), the performance difference between the two microscopes diminished, especially in larger channel sizes. This finding suggests that at high flow rates, expensive fluorescent microscopy may not be necessary, as standard inverted microscopy performed comparably.

3.4. Counting Under Diseased Conditions (Ratio 2)

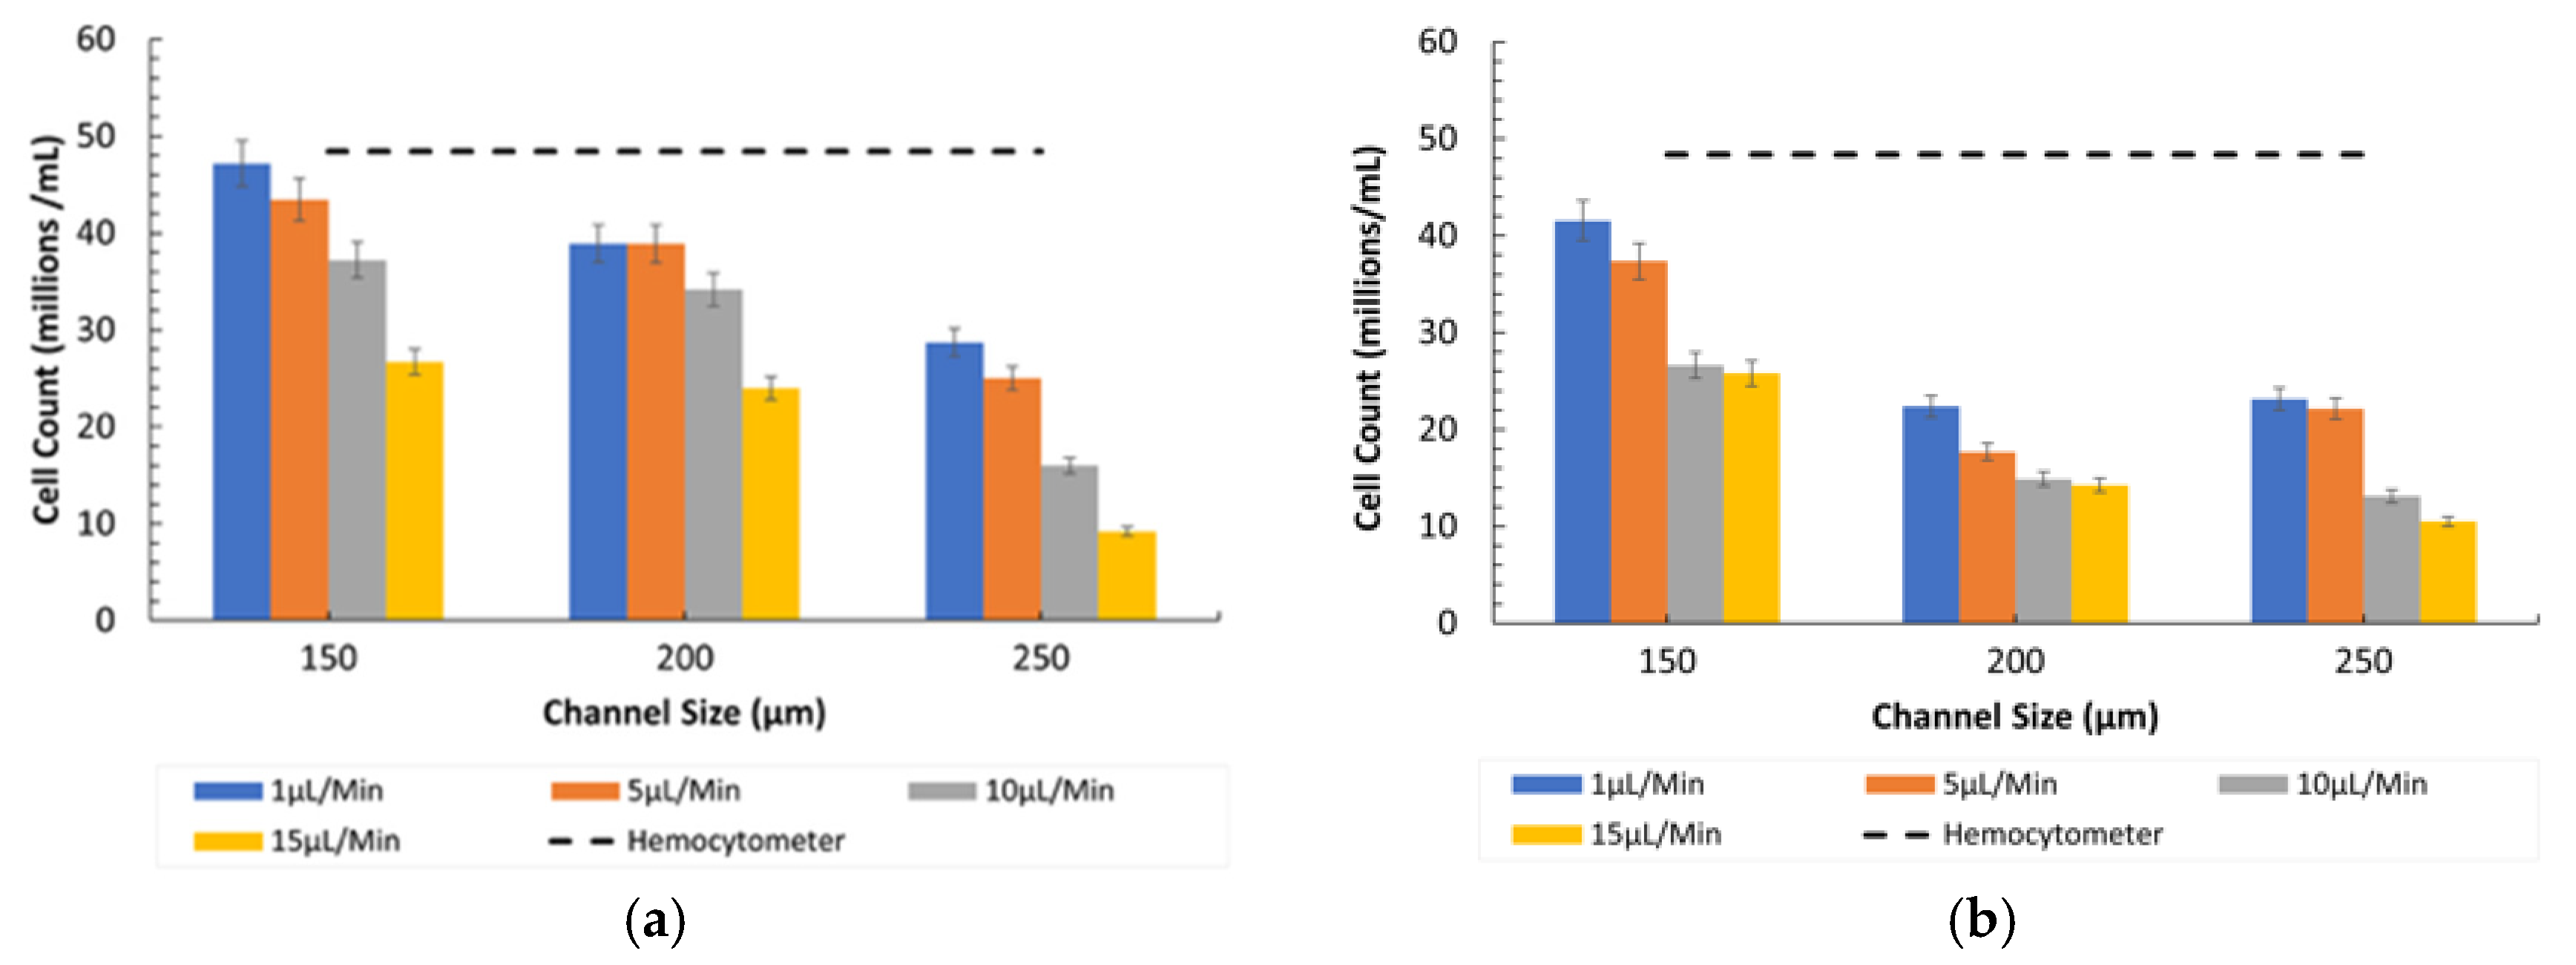
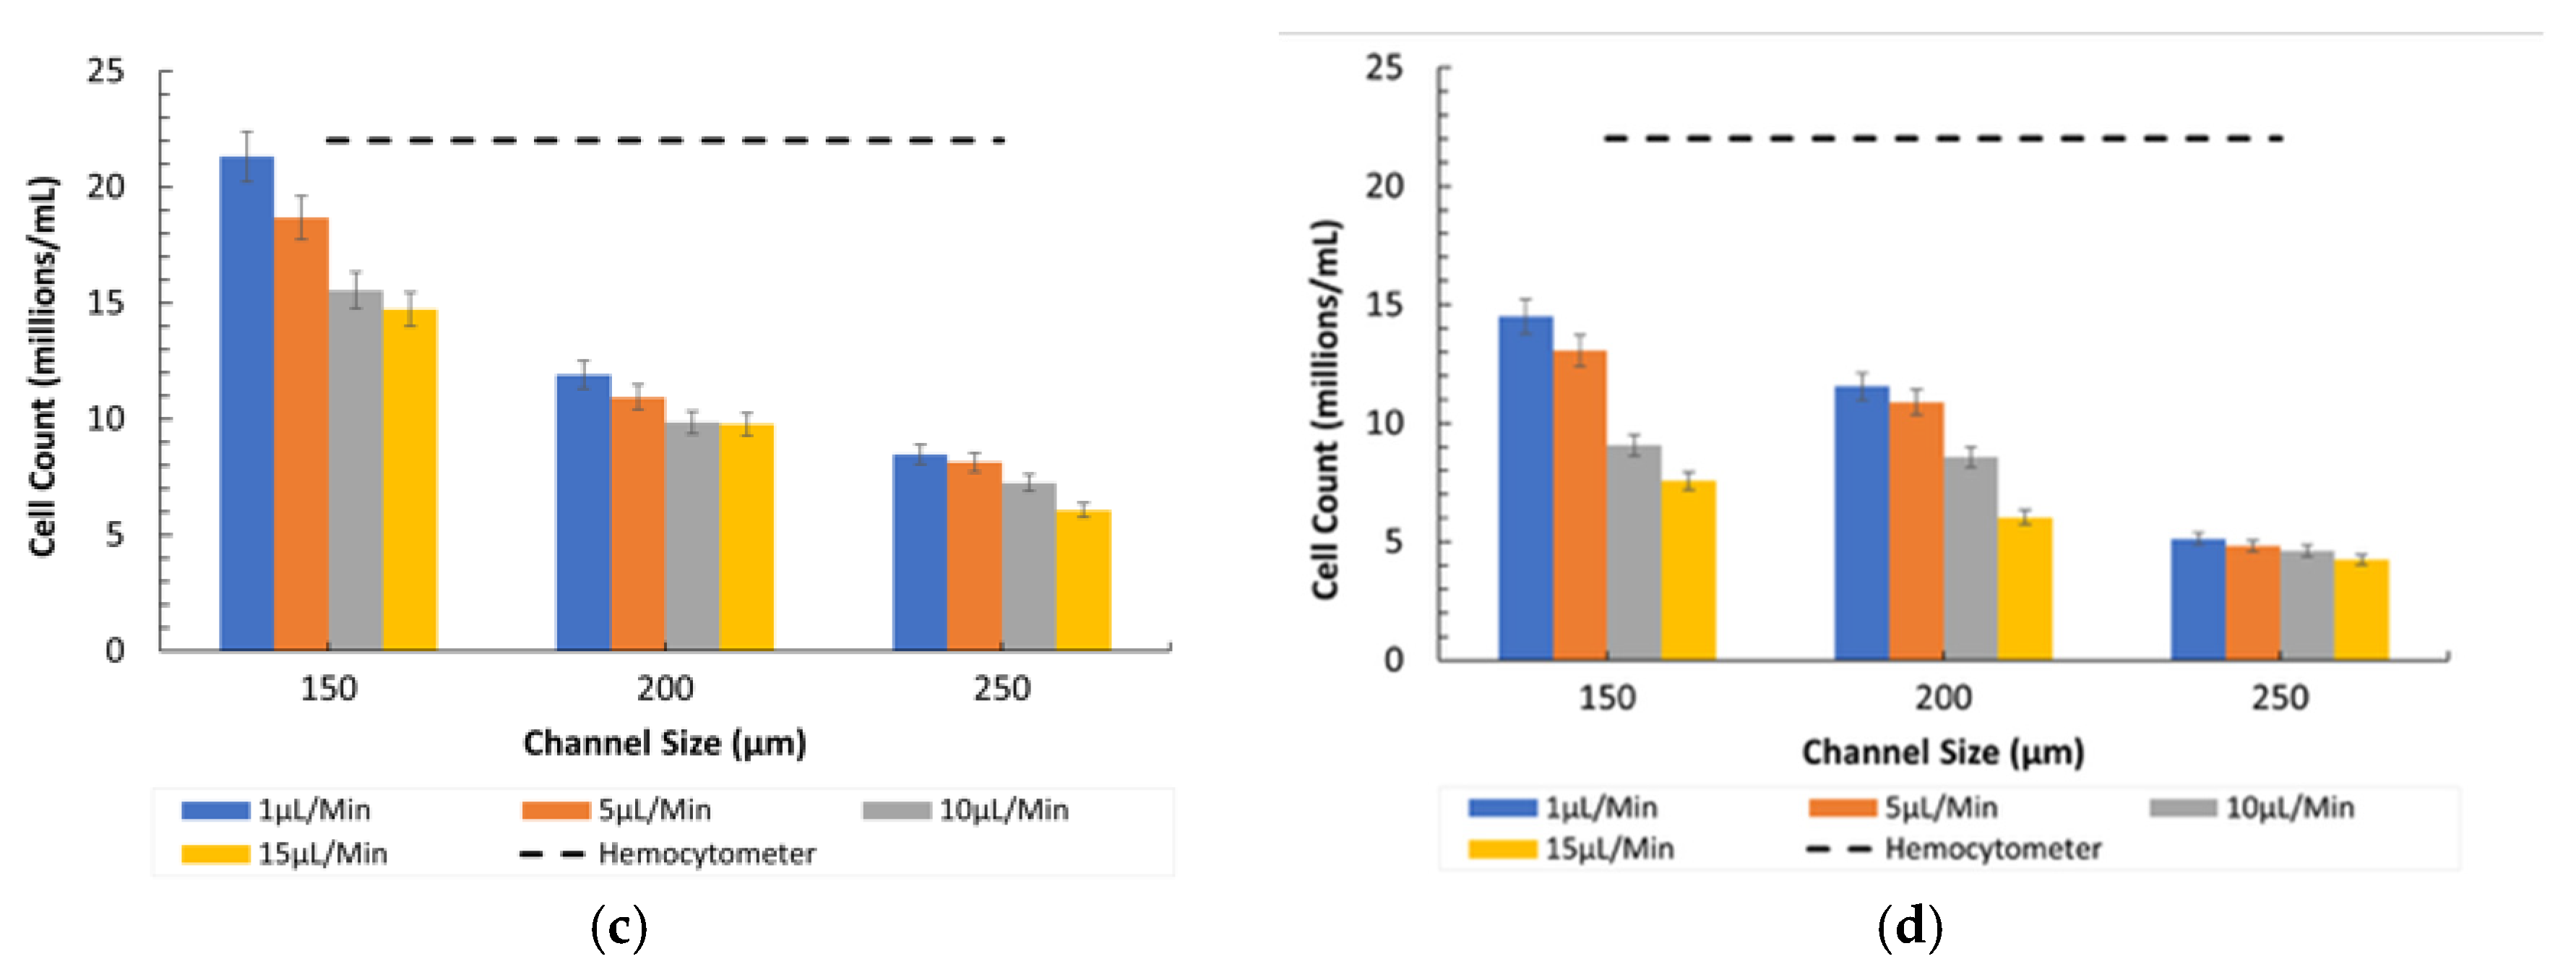
Figure 9a,b illustrates the particle counting for the 8-µm and Figure 9c,d for the 15-µm particles under diseased conditions (ratio of 400:1). The graphs indicate that the particle counts were significantly higher at lower flow rates in all channel sizes due to the prolonged interaction time with the detection mechanisms.
  • Influence of Channel Size and Flow Rates: The 150 µm channel size remained the most effective in maintaining high counting efficiency at low flow rates. However, as the flow rate increased, the particles misaligned and lost their equilibrium position, resulting in a disruption to the counting efficiency, especially in wider channels (250 µm).
The above results indicate a decrease in counting efficiency due to the channel design and imaging process, especially when dealing with wider channels and higher flow rates. The main issue is that the imaging system’s lens has limitations when used with wider channels, as it focuses more on the central region. The reference counts of particles in Figure 6 and Figure 7 by hemocytometer are shown by the dotted line for the 8 µm and 15 µm particles of 6.45 × 10⁷ cells/mL and 1.10 × 10⁷ cells/mL respectively.
The smallest percentage error of 1.8% for the 8 µm microparticles and 1.1% for the 15 µm ones indicates the optimal parameters for cell counting using the microfluidic device that presented the smallest channel, measuring 150 µm by 150 µm, and the lowest flow rate of 1 µL/min. These results were validated by counting the same suspension solution of both ratios through the commercially used hemocytometer microparticle counting device [23]. This configuration allowed for a more controlled flow and interaction of the particles within the detection zones, ensuring that the microparticles were adequately focused and accounted for during the imaging process. These findings highlight that the system’s reliability depends significantly on maintaining the optimal flow and channel conditions. Although the current setup is less integrated than commercial counters, it provides an efficient, flexible, and easily customizable platform for experimental cell counting applications. This is especially beneficial in resource-limited or research environments where adaptability and accuracy are prioritized.

3.5. Statistical Analysis of Percent Recovery

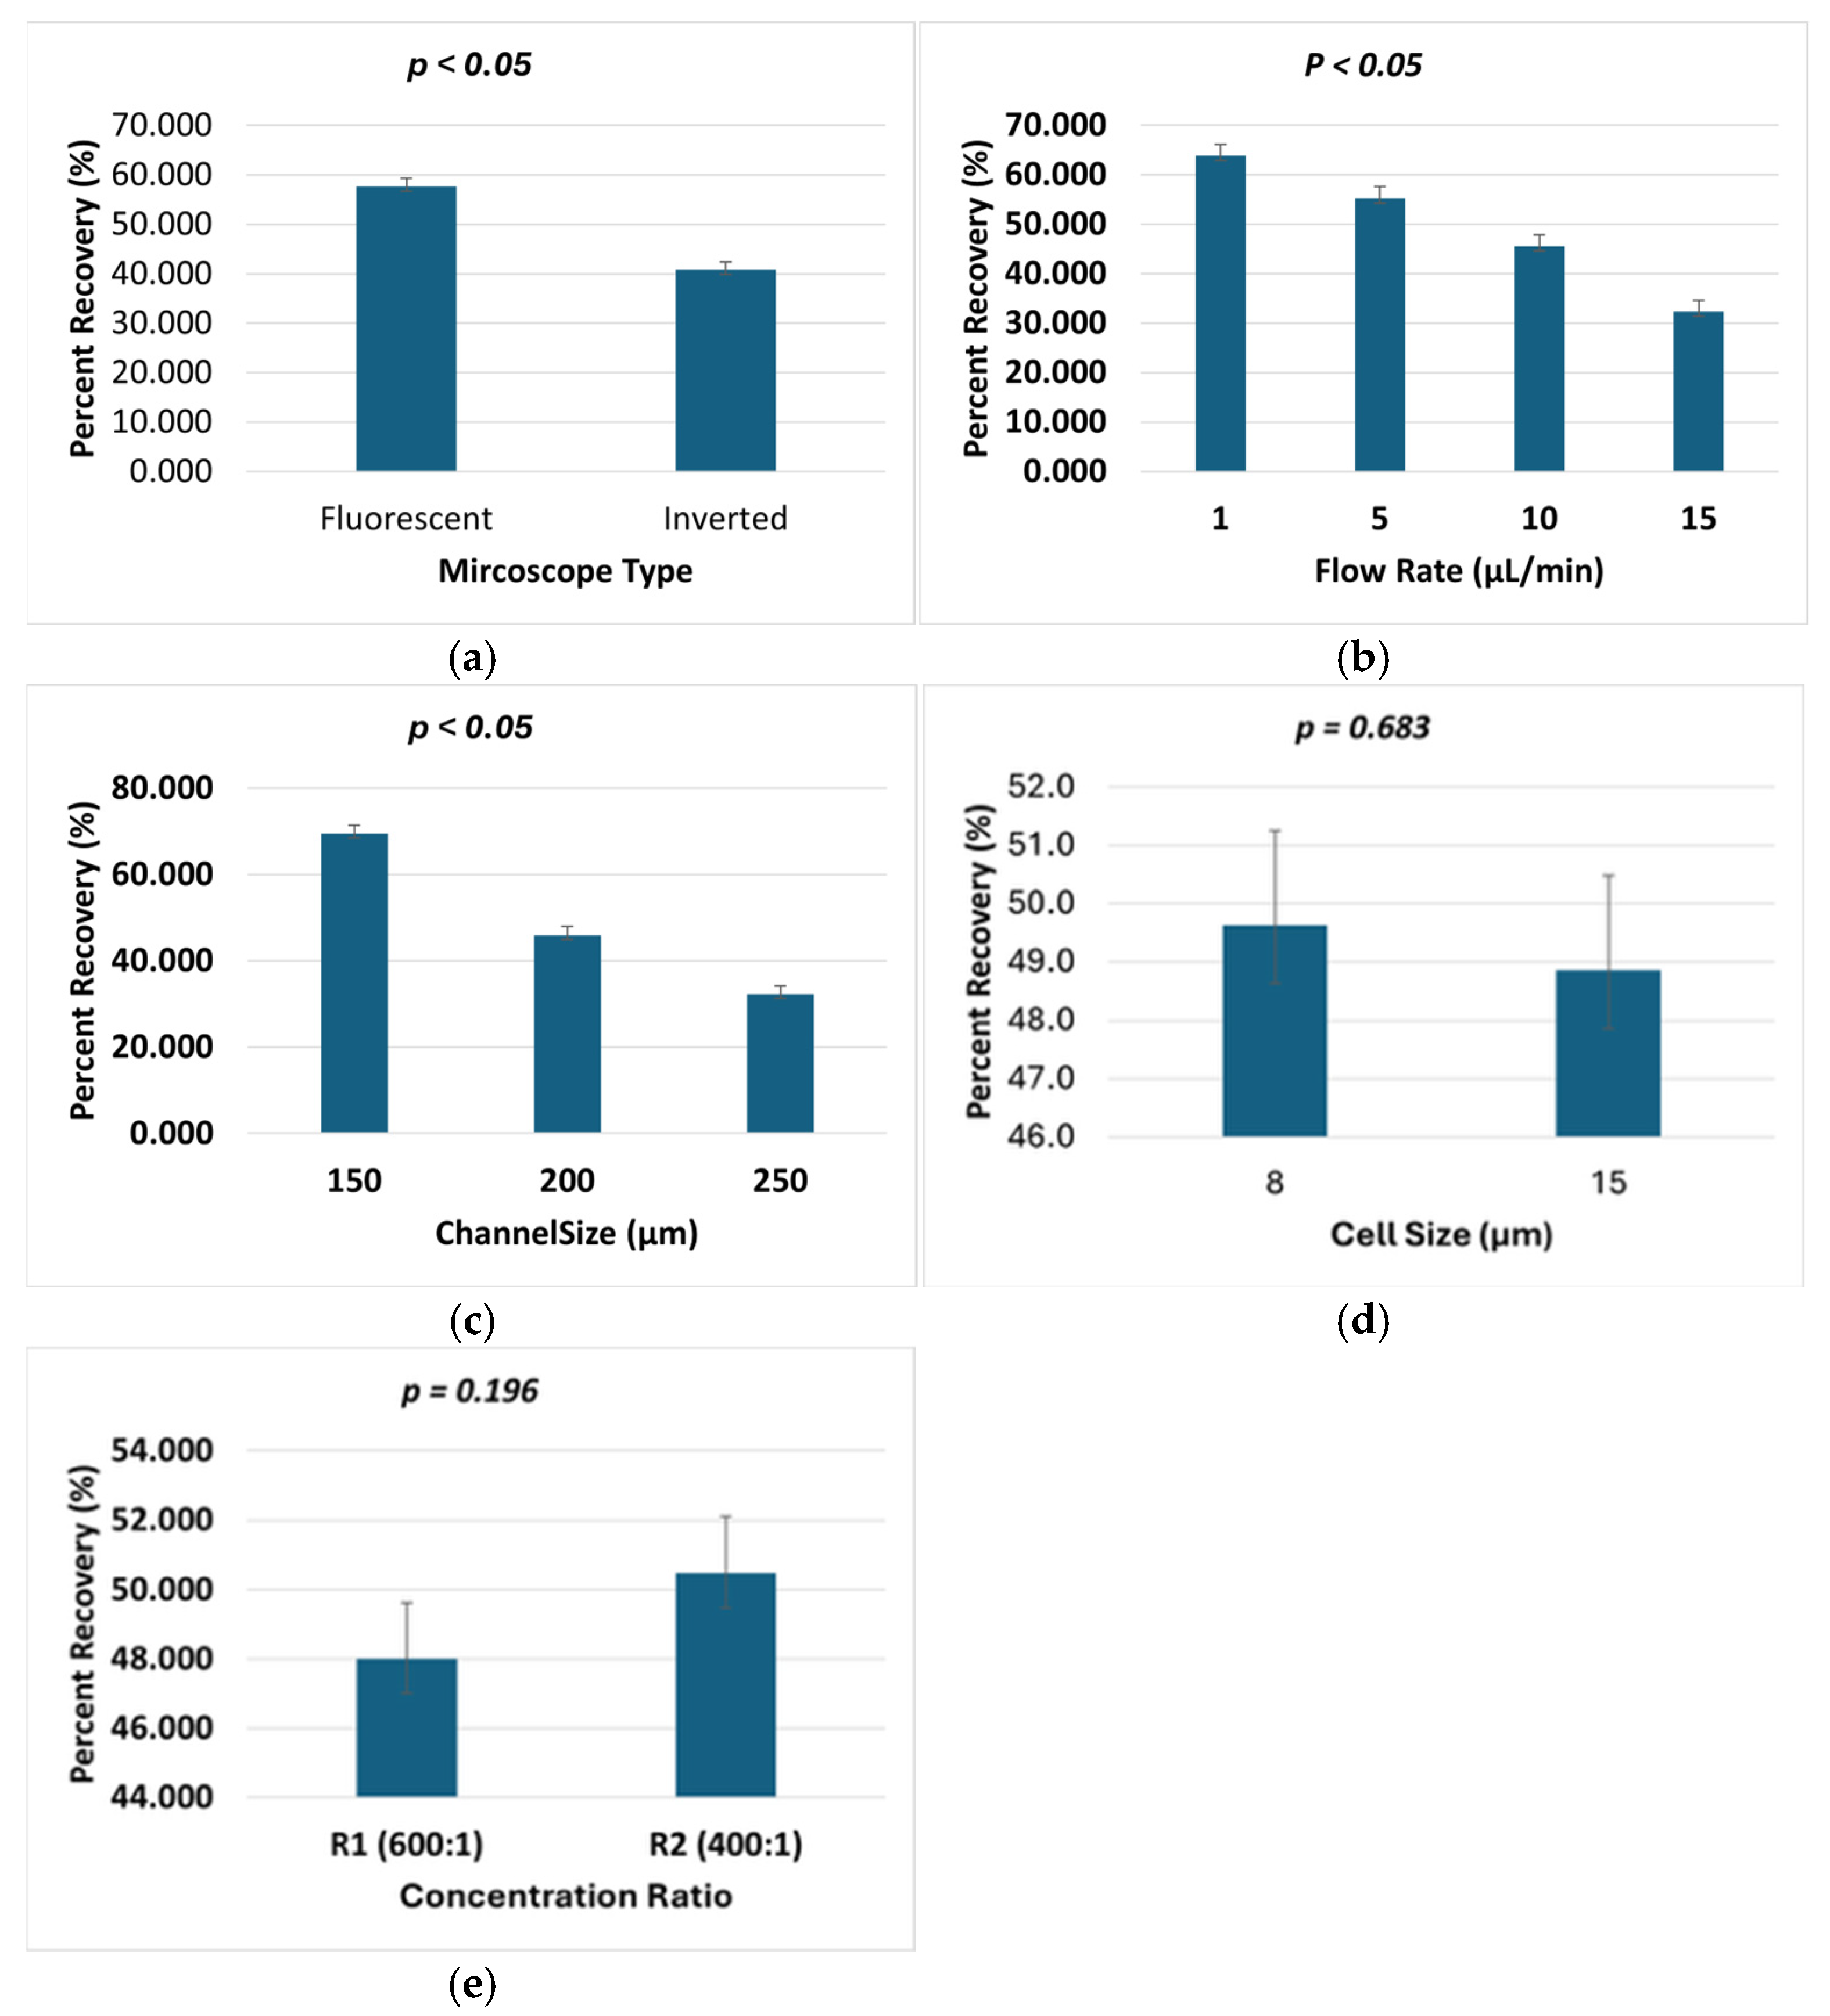
A multi-factorial ANOVA was conducted to assess the effect of experimental parameters such as the cell size, microscope type, flow rate, channel size, and concentration ratio on percent recovery. Table 4 shows the F-values and significance levels (p-values) for the main effects and interactions. The results indicate that several experimental parameters significantly influenced the recovery outcomes. Microscope type had a significant effect (F = 79.453, p < 0.001), confirming that the choice of imaging system (inverted vs. fluorescent microscope) meaningfully impacted the counting accuracy. This supports our observations in Figure 6, Figure 7 and Figure 8, where fluorescent imaging consistently yielded higher particle counts, likely due to improved contrast and visibility. Flow rate was also highly significant (F = 51.007, p < 0.001), validating that lower flow rates improve the counting efficiency. This aligns with our findings that a flow rate of 1 µL/min resulted in the maximum recovery across all channel sizes, as shown in the radar and bar plots. Channel size showed the most dominant effect (F = 131.357, p < 0.001), emphasizing that narrower microchannels (especially 150 µm) provide better focusing conditions and higher detection accuracy. Cell size alone was not statistically significant (F = 0.169, p = 0.683), indicating that the absolute particle diameter did not impact recovery when isolated from other factors. However, when interacted with the concentration ratio, this combination was significant (F = 19.010, p < 0.001), suggesting that the recovery varies when different particle sizes are combined under normal (600:1) or disease (400:1) conditions. The microscope × flow rate interaction was also significant (F = 3.322, p = 0.025), indicating that the imaging system’s effectiveness is dependent on the flow rate. This supports our conclusion that inverted microscopy is comparable to fluorescent microscopy at higher flow rates, while the latter excels under low flow conditions. Other interactions, including cell size × flow rate (F = 2.667, p = 0.055) and flow rate × channel size (F = 1.884, p = 0.097), showed marginal effects, suggesting a trend that warrants further exploration in future studies.
The ANOVA model yielded a high coefficient of determination (R2 = 0.899) and an adjusted R2 of 0.848, indicating that approximately 89.9% of the variability in percent recovery can be explained by the combination of experimental factors included in the model. This high R2 value confirms that the selected parameters—cell size, flow rate, microscope type, concentration ratio, and channel size—collectively provide a strong and predictive model of the recovery behavior observed. The adjusted R2 value accounts for model complexity, reinforcing the robustness of the analysis while controlling for overfitting due to multiple interactions.
The results of the ANOVA analysis are presented graphically to illustrate the effects of various experimental parameters on the cell recovery percentage, as shown in Figure 10. Each graph displays the mean percent recovery with error bars representing the standard errors and 95% confidence intervals. The data revealed several key trends: mean recovery percentages showed minimal variation between different cell sizes (8 µm: 49.63%; 15 µm: 48.86%), suggesting that this parameter had little influence on the outcome. In contrast, microscope type exhibited a substantial effect, with fluorescent microscopy yielding a significantly higher recovery (57.69%) compared with inverted microscopy (40.80%), likely due to improved cell detection and retention during imaging. Concentration ratio demonstrated only marginal differences between conditions (R1: 48.01%; R2: 50.48%), indicating this factor had limited impact. Flow rate showed a strong inverse relationship with recovery, where increasing flow rates from 1 µL/min (63.84%) to 15 µL/min (32.32%) resulted in progressively lower recovery, consistent with greater cell loss due to shear forces at higher flow velocities. Similarly, channel size significantly affected recovery, with narrower channels (150 µm) achieving substantially higher recovery (69.46%) than wider channels (250 µm: 32.28%), supporting the importance of physical confinement for optimal cell capture and retention. These graphical representations of the ANOVA results provide clear visualization of both the magnitude and statistical significance of each parameter’s effect on cell recovery, as shown in Figure 10. The ANOVA results revealed statistically significant differences in percent recovery for microscope type (p < 0.05), flow rate (p < 0.05), and channel size (p < 0.05), while cell size (p = 0.683) and concentration ratio (p = 0.196) showed no significant effects.

4. Conclusions

This study presented the successful development and validation of an inertial microfluidic device designed for accurate multi-cell counting, capable of simulating both normal and diseased physiological conditions. The device achieved counting accuracy at a microchannel size of 150 µm × 150 µm and a flow rate of 1 µL/min, yielding cell counts of 6.45 × 10⁷ cells/mL for 8 µm particles and 1.10 × 10⁷ cells/mL for 15 µm particles under normal conditions (600:1 ratio). Under diseased conditions (400:1 ratio), the counts were 4.5 × 10⁷ cells/mL and 2.16 × 10⁷ cells/mL, respectively.
The system demonstrated excellent agreement with standard hemocytometer results, achieving percentage errors as low as 1.8% for the 8 µm particles and 1.1% for the 15 µm particles. This represents a substantial improvement over the 5–10% variability typically reported with manual hemocytometer-based counting [43]. In contrast to earlier microfluidic studies that relied on complex multi-layer channel designs, sheath flows, or external actuation methods, the device developed in this study utilizes a single-layer microchannel and passive inertial focusing. This design simplifies the system by eliminating the need for external forces while maintaining high counting accuracy [44]. In this study, a simple single-layer PDMS chip was fabricated using accessible 3D printing and soft lithography. This makes the device highly scalable, reliable, and suitable for low-resource point-of-care diagnostics. The developed microfluidic system not only fulfills the initial objective of accuracy, simplicity, and validation, but also represents a practical advancement toward efficient, adoptable diagnostic devices capable of multi-size cell detection in various healthcare settings. Future directions will include expanding the detection capabilities to a wider range of particle sizes, integrating automated image analysis tools, and further optimizing flow control to enhance the throughput and robustness for real-world clinical deployment.

Author Contributions

Conceptualization, M.Z. and E.U.; Methodology, M.Z., E.U. and A.M.; Software, M.Z. and D.M.; Validation, M.Z., M.I. and Z.A.; Formal analysis and writing review, M.Z., E.U., M.I., S.U. and J.L. All authors have read and agreed to the published version of the manuscript.

Funding

This research received no external funding.

Institutional Review Board Statement

Not applicable.

Informed Consent Statement

Not applicable.

Data Availability Statement

Data will be made available on a reasonable request.

Acknowledgments

We extend our gratitude for the use of the Microfluidics Research Laboratory at the School of Mechanical and Manufacturing Engineering (SMME), National University and Sciences Technology (NUST), Islamabad.

Conflicts of Interest

The authors declare no conflicts of interest.

Nomenclature

aParticle diameter
DhHydraulic diameter of microchannel
vAverage fluid velocity in channel
ρFluid density
μDynamic viscosity of fluid
ReReynolds number (Re = ρvDh/μ)
CCell/microparticle concentration
RRBC to WBC ratio
ηViscosity of fluid medium
PDMSPolydimethylsiloxane
IPAIsopropyl alcohol
SLAStereolithography (3D printing technique)

References

  1. Yang, S.M.; Lv, S.; Zhang, W.; Cui, Y. Microfluidic Point-of-Care (POC) Devices in Early Diagnosis: A Review of Opportunities and Challenges. Sensors 2022, 22, 1620. [Google Scholar] [CrossRef]
  2. Amaral, A.J.R.; Pasparakis, G. Cell membrane engineering with synthetic materials: Applications in cell spheroids, cellular glues and microtissue formation. Acta Biomater. 2019, 90, 21–36. [Google Scholar] [CrossRef] [PubMed]
  3. Dockree, S.; Shine, B.; Pavord, S.; Impey, L.; Vatish, M. White blood cells in pregnancy: Reference intervals for before and after delivery. eBioMedicine 2021, 74, 103715. [Google Scholar] [CrossRef] [PubMed]
  4. Deliorman, M.; Ali, D.S.; Qasaimeh, M.A. Next-Generation Microfluidics for Biomedical Research and Healthcare Applications. Biomed. Eng. Comput. Biol. 2023, 14, 11795972231214387. [Google Scholar] [CrossRef]
  5. Pattanayak, P.; Singh, S.K.; Gulati, M.; Vishwas, S.; Kapoor, B.; Chellappan, D.K.; Anand, K.; Gupta, G.; Jha, N.K.; Gupta, P.K.; et al. Microfluidic chips: Recent advances, critical strategies in design, applications and future perspectives. Microfluid. Nanofluidics 2021, 25, 99. [Google Scholar] [CrossRef]
  6. Kumar, A.; Panda, U. Microfluidics-based devices and their role on point-of-care testing. In Biosensor Based Advanced Cancer Diagnostics: From Lab to Clinics; Academic Press: Cambridge, MA, USA, 2022; pp. 197–224. [Google Scholar] [CrossRef]
  7. Liberale, C.; Cojoc, G.; Bragheri, F.; Minzioni, P.; Perozziello, G.; La Rocca, R.; Ferrara, L.; Rajamanickam, V.; Di Fabrizio, E.; Cristiani, I. Integrated microfluidic device for single-cell trapping and spectroscopy. Sci. Rep. 2013, 3, 1258. [Google Scholar] [CrossRef]
  8. Renier, C.; Pao, E.; Che, J.; Liu, H.E.; Lemaire, C.A.; Matsumoto, M.; Triboulet, M.; Srivinas, S.; Jeffrey, S.S.; Rettig, M.; et al. Label-free isolation of prostate circulating tumor cells using Vortex microfluidic technology. npj Precis. Oncol. 2017, 1, 15. [Google Scholar] [CrossRef]
  9. Zhu, P.; Wang, L. Passive and active droplet generation with microfluidics: A review. Lab Chip 2016, 17, 34–75. [Google Scholar] [CrossRef] [PubMed]
  10. Kim, G.Y.; Han, J.I.; Park, J.K. Inertial Microfluidics-Based Cell Sorting. BioChip J. 2018, 12, 257–267. [Google Scholar] [CrossRef]
  11. Ashley, B.K.; Hassan, U. Time-domain signal averaging to improve microparticles detection and enumeration accuracy in a microfluidic impedance cytometer. Biotechnol. Bioeng. 2021, 118, 4428–4440. [Google Scholar] [CrossRef]
  12. Seto, H.; Saiki, A.; Matsushita, R.; Mitsukami, W.; Kamba, S.; Hasegawa, M.; Miura, Y.; Hirohashi, Y.; Shinto, H. Development of microparticle counting sensor based on structural and spectroscopic properties of metal mesh device. Adv. Powder Technol. 2021, 32, 1920–1926. [Google Scholar] [CrossRef]
  13. Seto, H.; Kamba, S.; Kondo, T.; Ogawa, Y.; Hoshino, Y.; Miura, Y. Novel Detection Technique for Particulate Matter in Air Using Metal Mesh Device Sensors. Chem. Lett. 2014, 43, 408–410. [Google Scholar] [CrossRef]
  14. Huo, D.Q.; Liu, Z.; Hou, C.-J.; Yang, J.; Luo, X.-G.; Fa, H.-B.; Dong, J.-L.; Zhang, Y.-C.; Zhang, G.-P.; Li, J.-J. Recent Advances on Optical Detection Methods and Techniques for Cell-based Microfluidic Systems. Chin. J. Anal. Chem. 2010, 38, 1357–1365. [Google Scholar] [CrossRef]
  15. Liu, X.; Zheng, X. Microfluidic-Based Electrical Operation and Measurement Methods in Single-Cell Analysis. Sensors 2024, 24, 6359. [Google Scholar] [CrossRef] [PubMed]
  16. Mitchell, K.R.; Esene, J.E.; Woolley, A.T. Advances in multiplex electrical and optical detection of biomarkers using microfluidic devices. Anal. Bioanal. Chem. 2022, 414, 167–180. [Google Scholar] [CrossRef]
  17. Strohm, E.M.; Gnyawali, V.; Sebastian, J.A.; Ngunjiri, R.; Moore, M.J.; Tsai, S.S.H.; Kolios, M.C. Sizing biological cells using a microfluidic acoustic flow cytometer. Sci. Rep. 2019, 9, 4775. [Google Scholar] [CrossRef]
  18. Shrirao, A.B.; Fritz, Z.; Novik, E.M.; Yarmush, G.M.; Schloss, R.S.; Zahn, J.D.; Yarmush, M.L. Microfluidic flow cytometry: The role of microfabrication methodologies, performance and functional specification. Technology 2018, 6, 1–23. [Google Scholar] [CrossRef]
  19. Storti, F.; Bonfadini, S.; Criante, L. Simplified 3D hydrodynamic flow focusing for lab-on-chip single particle study. Sci. Rep. 2023, 13, 14671. [Google Scholar] [CrossRef]
  20. Ikram, K.; Hasan, S.M.; Abdullah, C.; Zulfiqar, M.; Uddin, E.; Ali, Z.; Sajid, M. Experimental Investigation of Particle Sorting in Y-Channels with Variable Bifurcation Angles for Microfluidic Applications. J. Appl. Sci. Eng. 2025, 28, 1679–1687. [Google Scholar] [CrossRef]
  21. Scott, S.M.; Ali, Z. Fabrication methods for microfluidic devices: An overview. Micromachines 2021, 12, 319. [Google Scholar] [CrossRef]
  22. Leuthner, M.; Helou, M.; Reisbeck, M.; Hayden, O. Quantitative Magnetic Flow Cytometry in High Hematocrit Conditions for Point-of-Care Testing. bioRxiv 2024. [Google Scholar] [CrossRef]
  23. Chen, Y.W.; Chiang, P.J. An automated approach for hemocytometer cell counting based on image-processing method. Measurement 2024, 234, 114894. [Google Scholar] [CrossRef]
  24. Ashkani, A.; Jafari, A.; Ghomsheh, M.J.; Dumas, N.; Funfschilling, D. Enhancing particle focusing: A comparative experimental study of modified square wave and square wave microchannels in lift and Dean vortex regimes. Dent. Sci. Rep. 2024, 14, 2679. [Google Scholar] [CrossRef]
  25. Tanriverdi, S.; Cruz, J.; Habibi, S.; Amini, K.; Costa, M.; Lundell, F.; Mårtensson, G.; Brandt, L.; Tammisola, O.; Russom, A. Elasto-inertial focusing and particle migration in high aspect ratio microchannels for high-throughput separation. Microsyst. Nanoeng. 2024, 10, 87. [Google Scholar] [CrossRef] [PubMed]
  26. Zhao, Q.; Yuan, D.; Zhang, J.; Li, W. A Review of Secondary Flow in Inertial Microfluidics. Micromachines 2020, 11, 461. [Google Scholar] [CrossRef]
  27. Ramachandraiah, H.; Ardabili, S.; Faridi, A.M.; Gantelius, J.; Kowalewski, J.M.; Mårtensson, G.; Russom, A. Dean flow-coupled inertial focusing in curved channels. Biomicrofluidics 2014, 8, 034117. [Google Scholar] [CrossRef] [PubMed]
  28. Waheed, S.; Cabot, J.M.; Macdonald, N.P.; Lewis, T.; Guijt, R.M.; Paull, B.; Breadmore, M.C. 3D printed microfluidic devices: Enablers and barriers. Lab Chip 2016, 16, 1993–2013. [Google Scholar] [CrossRef] [PubMed]
  29. Yue, H.; Liu, X.; Hou, K.; Vyas, C.; Bartolo, P. Stereolithography 3D printing of microgroove master moulds for topography-induced nerve guidance conduits. Int. J. Bioprint. 2024, 10, 489–507. [Google Scholar] [CrossRef]
  30. Lai, A.; Altemose, N.; White, J.A.; Streets, A.M. On-ratio PDMS bonding for multilayer microfluidic device fabrication. J. Micromech. Microeng. 2019, 29, 107001. [Google Scholar] [CrossRef]
  31. Sun, D. Micro-Channel Surface Treatment Method. 2020. Available online: https://typeset.io/papers/micro-channel-surface-treatment-method-2h0vsv4eaa (accessed on 21 January 2025).
  32. Hassan, U.; Watkins, N.N.; Reddy, B.; Damhorst, G.; Bashir, R. Microfluidic differential immunocapture biochip for specific leukocyte counting. Nat. Protoc. 2016, 11, 714. [Google Scholar] [CrossRef]
  33. Zeniou, A.; Kefallinou, D.; Dimitrakellis, P.; Xenogiannopoulou, E.; Grigoriou, M.; Dimoulas, A.; Boumpas, D.T.; Tserepi, A.; Gogolides, E. Atmospheric Pressure Plasma Functionalization of Sealed PDMS Microfluidics: Application to Capillary Pumping and Enhanced Cell Growth. Chempluschem 2024, 89, e202400290. [Google Scholar] [CrossRef] [PubMed]
  34. Perrira, N.; Shuib, A.S.; Phang, S.W.; Muda, A.S. Experimental Investigation of Blood Mimicking Fluid Viscosity for Application in 3D-Printed Medical Simulator. J. Phys. Conf. Ser. 2022, 2222, 012016. [Google Scholar] [CrossRef]
  35. Diez-Silva, M.; Dao, M.; Han, J.; Lim, C.T.; Suresh, S. Shape and Biomechanical Characteristics of Human Red Blood Cells in Health and Disease. MRS Bull./Mater. Res. Soc. 2010, 35, 382. [Google Scholar] [CrossRef] [PubMed]
  36. Components of Blood—Blood Disorders—Merck Manual Consumer Version. Available online: https://www.merckmanuals.com/home/blood-disorders/biology-of-blood/components-of-blood (accessed on 24 September 2024).
  37. Complete Blood Count—Health Encyclopedia—University of Rochester Medical Center. Available online: https://www.urmc.rochester.edu/encyclopedia/content.aspx?contenttypeid=167&contentid=complete_blood_count (accessed on 24 September 2024).
  38. Pahwa, R.; Goyal, A.; Jialal, I. Chronic Inflammation. In Pathobiology of Human Disease: A Dynamic Encyclopedia of Disease Mechanisms; Elsevier Inc.: Amsterdam, The Netherlands, 2023; pp. 300–314. [Google Scholar] [CrossRef]
  39. Hansen, J.T.; Netter, F.H.; Machado, C.A.G.; Craig, J.A.; Perkins, J.A.; Marzejon, K.W.; DaVanzo, T.S. Netter’s Clinical Anatomy. 2022, p. 554. Available online: https://geekymedics.com/blood-components/ (accessed on 24 September 2024).
  40. Zhang, N.; Wu, J.; Wang, Q.; Liang, Y.; Li, X.; Chen, G.; Ma, L.; Liu, X.; Zhou, F. Global burden of hematologic malignancies and evolution patterns over the past 30 years. Blood Cancer J. 2023, 13, 82. [Google Scholar] [CrossRef]
  41. Sanganwar, G.P.; Gupta, R.B. Nano-mixing of dipyridamole drug and excipient nanoparticles by sonication in liquid CO2. Powder Technol. 2009, 196, 36–49. [Google Scholar] [CrossRef]
  42. Optimizing Sorting of Micro-Sized Bio-Cells in Symmetric Serpentine Microchannel using Machine Learning. arXiv 2023, arXiv:2308.01701. [CrossRef]
  43. Stone, L.R.; Gray, D.R.; Remple, K.; Beaudet, M.P. Accuracy and precision comparison of the hemocytometer and automated cell counting methods. FASEB J. 2009, 23, 827.2. [Google Scholar] [CrossRef]
  44. Teng, J.; Chu, J.-C.; Liu, C.; Xu, T.; Lien, Y.-F.; Cheng, J.-H.; Huang, S.; Jin, S.; Dang, T.; Zhang, C.; et al. Fluid Dynamics in Microchannels. In Fluid Dynamics, Computational Modeling and Applications; InTech Open: Rijeka, Croatia, 2012. [Google Scholar] [CrossRef]
Figure 1. Geometry of the 150 µm microchannel and fabricated device; all dimensions in mm.
Applsci 15 05701 g001
Figure 2. (a) Mold fabrication by SLA Form 3, (b) PDMS base with curing agent mixing preparation process, and (c) microchannel fabrication.
Applsci 15 05701 g002
Figure 3. Experimental setup consisting of the syringe pump, microfluidics chip, microscope, and recording mechanism.
Applsci 15 05701 g003
Figure 4. Cell counting technique.
Applsci 15 05701 g004
Figure 5. (a) Captured image frame. (b) Binary image. (c) Analyzed cells.
Applsci 15 05701 g005
Figure 6. Channel size vs. 8 µm count (cells/mL) at different flow rates in Ratio 1. (a) Under observation of Bioimager fluorescent microscope. (b) Inverted microscope.
Applsci 15 05701 g006
Figure 7. Comparative microscopic images of microparticles observed under the two imaging techniques.
Applsci 15 05701 g007
Figure 8. Channel size vs. 15-µm count (cells/mL) at different flow rates in Ratio 1. (a) Under observation of Bioimager fluorescent microscope. (b) Inverted microscope.
Applsci 15 05701 g008
Figure 9. Channel size vs. 8-µm and 15-µm count (cells/mL) at different flow rates in Ratio 2. (a) Under observation of Bioimager fluorescent microscope. (b) Inverted microscope. (c) Under observation of Bioimager fluorescent microscope. (d) Inverted microscope.
Applsci 15 05701 g009aApplsci 15 05701 g009b
Figure 10. Effects of various experimental parameters on the cell recovery percentage. (a) Microscope type, (b) flow rate, (c) channel size, (d) cell size, and (e) concentration ratio.
Applsci 15 05701 g010
Table 1. Cell ratio vs. diseases.
RBC RatioCondition/DiseaseExplanation
600:1Normal [36]This is the typical ratio in healthy human blood, reflecting a normal immune response.
400:1Inflammatory disease, infection [37]A decrease in the RBC ratio due to an increase in WBCs indicates the body is fighting an infection or dealing with inflammation.
250–300:1Severe inflammation, chronic infection [38]A significantly lower ratio may indicate severe infections or chronic inflammatory diseases.
100–200:1Leukemia, severe sepsis [39]A very low ratio suggests serious conditions like leukemia, where WBC production is abnormally high, or severe sepsis.
50–100:1Acute leukemia [36]In cases of acute leukemia, the WBC count can become so high that it drastically reduces the RBC ratio.
<50:1Advanced leukemia, other hematologic malignancies [40]In very advanced cases, the WBCs can almost outnumber RBCs, indicative of severe hematologic malignancies.
Table 2. Experimental Parameters.
Sr No.Test ParametersDescription
1Squared channel size (µm)150, 200, 250
2Particle concentration (8 and 15 µm, respectively)R1 = 600:1, R2 = 400:1
3Flow rates (μL/min)1, 5, 10, 15
4Optical equipmentInverted microscope, Bioimager fluorescent microscope
Table 3. Validation comparison between the microfluidic device and hemocytometer (both ratios).
RatioParticle SizeMicrofluidic Device Count (cells/mL)Hemocytometer Count (cells/mL)Percentage Error (%)
600:18 µm6.45 × 1076.57 × 1071.8%
600:115 µm1.10 × 1071.11 × 1071.1%
400:18 µm4.50 × 1074.60 × 1072.2%
400:115 µm2.16 × 1072.20 × 1071.9%
Table 4. Summary of the ANOVA results.
FactorFSig. (p-Value)
Microscope type79.4530.000
Flow rate51.0070.000
Channel size131.3570.000
Cell size0.1690.683
Concentration ratio1.7120.196
Cell size × concentration ratio19.0100.000
Microscope × flow rate3.3220.025
Cell size × flow rate2.6670.055
Flow rate × channel size1.8840.097
Disclaimer/Publisher’s Note: The statements, opinions and data contained in all publications are solely those of the individual author(s) and contributor(s) and not of MDPI and/or the editor(s). MDPI and/or the editor(s) disclaim responsibility for any injury to people or property resulting from any ideas, methods, instructions or products referred to in the content.