Article

Shoulder–Elbow Joint Angle Prediction Using COANN with Multi-Source Information Integration

1
Key Laboratory of Intelligent Rehabilitation and Barrier-Free for the Disabled, Ministry of Education, Changchun University, Changchun 130000, China
2
School of Mechanical and Vehicle Engineering, Changchun University, Changchun 130000, China
3
College of Computer Science and Technology, Changchun University, Changchun 130000, China
4
Shandong Jite Industrial Technology Co., Ltd., Rizhao 262300, China
*
Author to whom correspondence should be addressed.
Appl. Sci. 2025, 15(10), 5671; https://doi.org/10.3390/app15105671
Submission received: 31 March 2025 / Revised: 11 May 2025 / Accepted: 14 May 2025 / Published: 19 May 2025

Abstract

:
To address the precision challenges in upper-limb joint motion prediction, this study proposes a novel artificial neural network (COANN) enhanced by the Cheetah Optimization Algorithm (COA). The model integrates surface electromyography (sEMG) signals with joint angle data through multi-source information fusion, effectively resolving the local optima issue in neural network training and improving the accuracy limitations of single sEMG predictions. Experimental results demonstrate that the COANN achieves significant performance improvements: compared with RBF neural networks, it reduces the root mean square error (RMSE) by 24.32% (ΔR2 + 18.75%) with a 22.6% shorter system runtime; relative to conventional ANNs, it decreases the RMSE by 31.59% (ΔR2 + 12.15%) while reducing computational time by 35.1%; compared with CNN neural networks, it reduces the root mean square error (RMSE) by 14.9% (ΔR2 + 3.84%); and relative to conventional LSTM, it decreases the RMSE by 15.31% (ΔR2 + 4.86%). Multi-source integration enhanced elbow joint prediction accuracy by 5.7% and shoulder joint accuracy by 6.9% compared with single sEMG approaches. This methodology provides theoretical foundations for human–robot interaction systems in upper-limb rehabilitation robotics and motion-assistive devices.

1. Introduction

In recent years, China’s rehabilitation medicine field has witnessed continuous deepening development. According to the 2023 Annual Report by the China Disabled Persons’ Federation, 12,463 rehabilitation institutions have been established nationwide, with increasing demand for upper-limb rehabilitation robots and motion-assistive devices. The conflict between rapid response and prediction accuracy in motion intent recognition has become increasingly prominent [1,2,3,4,5], making research on high-precision, fast-response human–robot interaction models for these devices a major focus.
Domestic and international researchers have actively explored solutions. In China: Kong Dezhi et al. implemented the least squares support vector machine (LSSVM) method for upper-limb joint angle prediction, addressing issues of suboptimal accuracy and slow prediction speeds in motion control models [1]. Zhao Zihui et al. developed a long short-term memory network with attention mechanisms and residual blocks (AR-LSTM) to continuously estimate elbow joint angles [2]. Liu Keping et al. proposed a generalized regression neural network (GRNN) to predict subjects’ upper-limb joint angles, evaluated using the root mean square error (RMSE) [3]. Bai Zhonghang et al. introduced a rapid upper-limb assessment (RULA) method based on adaptive neuro-fuzzy inference systems [4]. Wang Wenmiao designed a VMD-ELMAN angle-fitting algorithm to enhance real-time prediction [5]. Han Yonglin et al. proposed a method for lower-limb multi-joint continuous motion prediction using surface electromyography (sEMG) signals, demonstrating higher accuracy with sparrow search algorithm-optimized Elman neural networks [6]. Internationally: Kaitlin G. Rabe et al. applied Gaussian process regression models to lower-limb muscle modeling [7]. Charikleia Angelidou et al. combined K-nearest neighbors (KNNs) with artificial neural networks (ANNs) for real-time prediction [8]. Christian Morbidoni et al. developed a machine learning method for sEMG signal binary classification [9]. Riccardo Fratti et al. proposed a multi-scale convolutional neural network (MSCNN) with gradient reversal layers for domain adaptation, significantly improving prediction capabilities [10].
The Cheetah Optimizer Algorithm (COA) has demonstrated significant optimization potential across multiple domains in recent years, though its application in neural network training remains underexplored. In a comprehensive evaluation conducted by Mohammad Amin Akbari et al., the COA exhibited superior convergence accuracy and stability compared with 12 established algorithms, including the Grey Wolf Optimizer (GWO) and Particle Swarm Optimization (PSO), across 14 CEC-2005 benchmark functions. When applied to engineering problems, the COA achieved performance enhancements of 3.57–56.52% over Genetic Algorithms (GAs) [11], with its open-source implementation accessible via the Optim-App platform. Zulfiqar Ali Memon et al. proposed a novel methodology that maximizes network coverage through biomimetic simulations of cheetah hunting behavior. However, this research focused exclusively on static optimization scenarios, lacking investigations into dynamic weight adaptation or high-dimensional (d-dimensional) parameter spaces [12].
In this paper, the Cheetah Optimization Algorithm (COA) is introduced into ANN weight optimization for the first time to simulate the dynamics of cheetah hunting in a three-phase strategy—the first phase of the fast-tracking strategy (the first 30% iteration), the second phase of the ambush strategy (the middle 40% iteration), and the third phase of the attack strategy (the second 30% iteration)—in order to avoid falling into the local optimum leading to a long prediction response time [11]; at the same time, it combines the sEMG with the joint angle for multi-information fusion prediction to make up for the limitation of a single signal, improve the robustness of the prediction model (which is able to capture the sEMG signals in a timely manner when the muscle state changes) and to provide a good solution for upper-limb rehabilitation robots. The COA can provide a theoretical basis for the human–machine interaction of upper-limb rehabilitation robots, upper-limb exercise-assistive machines, and other devices.

2. COANN Network Optimization Algorithm Architecture

The Cheetah Optimization Algorithm (COA) is inspired by the dynamic nature of cheetah hunting behavior and achieves a balance between global search and local exploitation by simulating the cheetah’s fast tracking, ambush, and attack strategies. The Cheetah Optimization Algorithm (COA) simulates the fast reaction and flexible adjustment of cheetahs to capture prey in the shortest possible time.
As an emerging metaheuristic algorithm, the Cheetah Optimizer Algorithm (COA) has demonstrated remarkable performance in engineering optimization applications. For instance, when applied to the economical optimization design of plate-fin heat exchangers, the COA achieved a 12.7% reduction in total cost compared with Genetic Algorithms (GAs) while satisfying thermal constraints, evidencing its superior global search capabilities [13]. In addressing challenges such as delayed motor response caused by suboptimal parameter selection in traditional PI controllers, the COA exhibited accelerated convergence rates over conventional gradient descent methods [14]. However, the application of the COA to neural network parameter optimization remains unexplored. This study pioneers the implementation of the COA for ANN weight optimization, innovatively overcoming local optima limitations inherent in gradient-based approaches through a biologically inspired three-phase strategy (global search→localized ambush→convergence attack). The proposed framework enhances prediction accuracy in upper-limb joint motion estimation via multi-modal signal integration (sEMG + joint angles), thereby addressing human–machine interaction latency issues in rehabilitation robotics and motion-assistive devices.

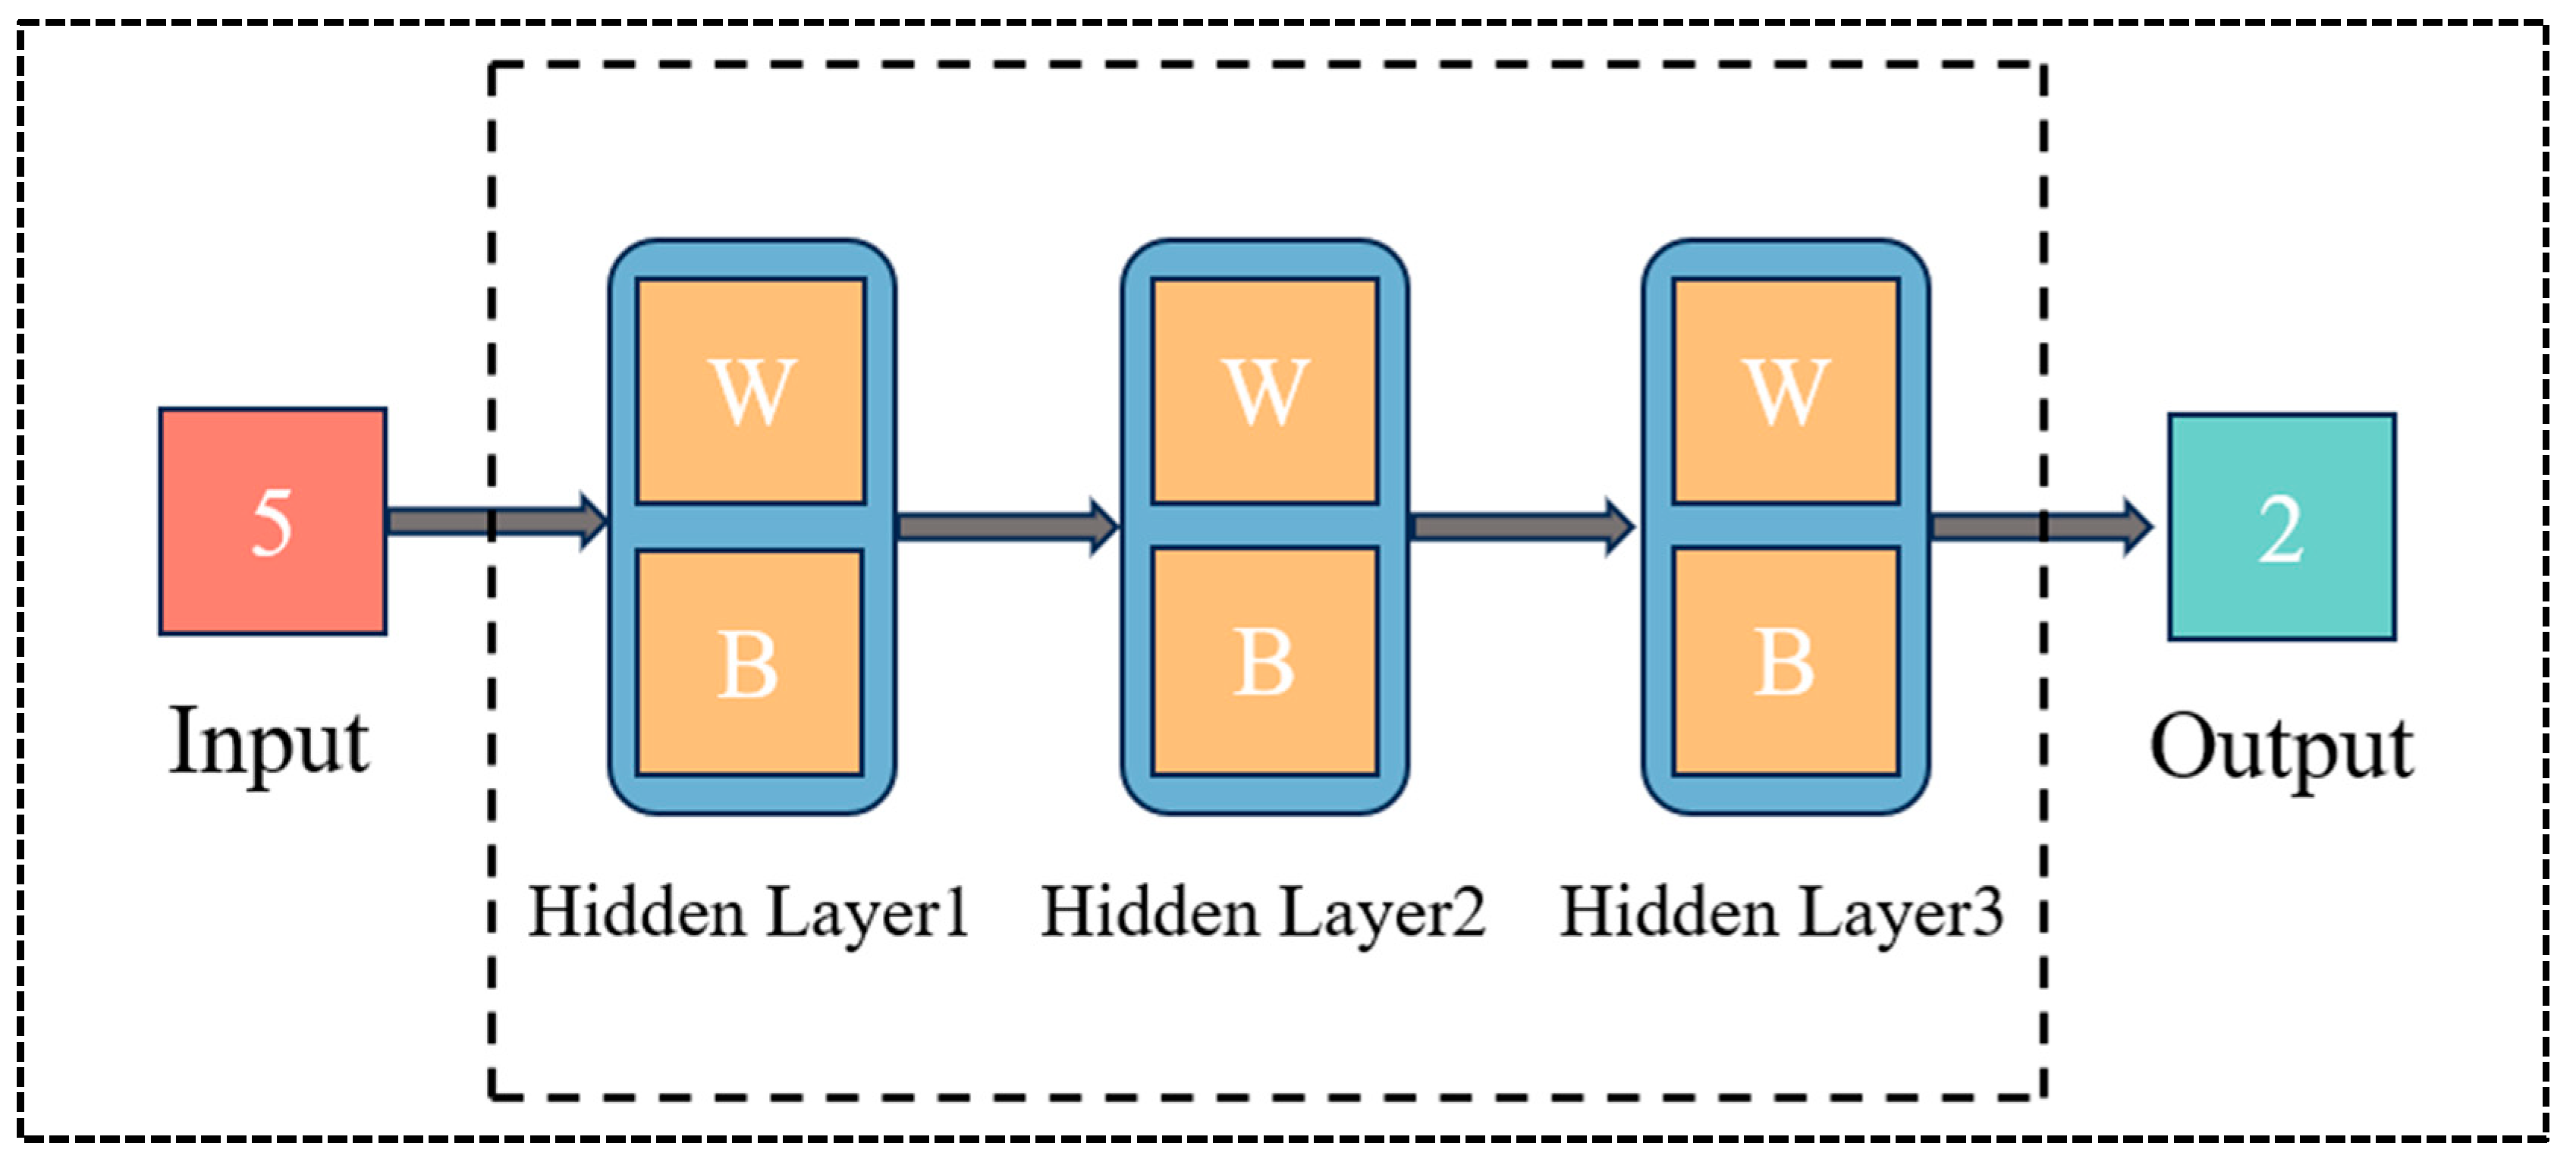
2.1. Basic Neural Network Model

Artificial Neural Networks (ANNs) consist of multiple layers of neurons, where the output of each neuron is obtained by weighted summation with a nonlinear activation function computation. For the neuron, the weighted sum Aj of input data X = [x1, x2, , xn] with weight vector W = [w1j, w2j, , wnj] is computed as follows:
A j x ¯ , w ¯ = i = 1 n x i w j i
where xi is the input value and wji is the weight of each input with respect to the neuron.
Next, the activation function is applied to the weighted sum Aj(x,w) and outputs the value Oj(x,w) for the j neuron.
O j x ¯ , w ¯ = 1 1 + e A j x ¯ , w ¯
Here the Sigmoid activation function is used to map the weighted sum to the range (0, 1).

2.2. Cheetah Optimization Algorithm (COA)

The ANN-based algorithm uninterruptedly updates the location of the cheetah based on its fitness (error function). The cheetah gradually approaches the global optimal solution through fitness evaluation and position update.
Initialization population: Located in the d-dimensional search space, the cheetah initialization position is described as:
X i , j = L B j + r a n d ( U B j L B j )
i = 1, 2, …, n; j = 1, 2, …, d;
where X i , j is the j dimensional location of the i cheetah; U B j and L B j are the upper and lower bounds of the j dimensional search space, respectively; rand dimensions are random numbers between 0 and 1; n dimensions are cheetah population sizes; and d is the problem dimension.
Search strategy: Cheetahs conduct full range scans or active searches in their search space or surrounding area to find prey. The strategy is mathematically described as:
X i , j t + 1 = X i , j t + r ¯ i , j 1 · α i , j t
t = 1, 2, …, T;
where X i , j t + 1 is the j dimensional position of the t + 1st iteration of the i cheetah; X i , j t is the j dimensional position of the t iteration of the i cheetah; r ¯ i , j is the j dimension of the i cheetah with a normally distributed random number; α i , j t is the search step size of the j dimension of the t iteration of the i cheetah; and T is the maximum number of iterations of the algorithm.
Sit-and-wait strategy: In order to avoid the prey fleeing due to frequent movement, the COA adopts the ambush strategy in the localized development phase with the position update formula:
X i , j t + 1 = X i , j t exp t T ,
The significance of each parameter in Equation (5) is the same as above. This strategy not only improves the hunting success rate (obtaining the optimal solution) but also avoids premature convergence of the COA.
Attack strategy: During the convergence phase, the cheetah updates its position based on the current optimal solution (prey position X best t ) and the population interaction factor β i , j t :
X i , j t + 1 = X B , j t + r ¯ i . j · β i , j t ,
where X B , j t is the j dimensional prey position of the t iteration, i.e., the current best position; r ¯ i , j is the j dimensional steering factor of the i cheetah; β i , j t is the j dimensional interaction factor of the t iteration of the i cheetah, reflecting the interaction between cheetahs or between cheetahs and the lead cheetah. The significance of the other parameters is the same as previously mentioned.

2.3. COANN Network Optimization Algorithm

In this study, the COA dynamically optimizes the network weights by minimizing the prediction error of the ANN with the updated formula in Equation (7). COANN Pseudo-Code is shown in Algorithm 1:
W t + 1 = W t + S X best t W t ,
where S is a population aggregation factor used to balance global exploration with localized exploitation.
Algorithm 1 COANN Pseudo-Code (Python)
n, T = 30, 50# population size 30, 50 iterations
d, hidden, out = 5, [8,6,4], 2 # Input 5 nodes, Hidden layer 864, Output 2 nodes
LB, UB = −1.0, 1.0 # Weighting range [−1, 1]
# Initialize the population
population = [
        [np.random.uniform(LB, UB, (d, hidden[0])),
          np.random.uniform(LB, UB, (hidden[0], hidden[1])),
          np.random.uniform(LB, UB, (hidden[1], hidden[2])),
          np.random.uniform(LB, UB, (hidden[2], out))]
        for _ in range(n)
]
W_best, best_fitness = None, float(‘inf’)
for t in range(T):
        for i in range(n):
# Forward propagation to compute RMSE
                h1 = sigmoid(input_data @ population[i][0])
                h2 = sigmoid(h1 @ population[i][1])
                predict = sigmoid(h2 @ population[i][2]) @ population[i][3]
                RMSE = np.sqrt(mean((true_angles − predict)**2))
                fitness = 1/(1 + RMSE)
# Updating the global optimum
                if fitness > best_fitness:
                      W_best, best_fitness = population[i], fitness
# Updating weights in stages
       for i in range(n):
              if t < 0.3*T:                   # global search
                    α = 0.1*(UB − LB)*(1 − t/T)
                    new_weights = [W + α*np.random.randn(*W.shape) for W in population[i]]
        elif t < 0.7*T: # local ambush
                    decay = np.exp(−t/T)
                   new_weights = [W*decay + 0.1*(W_best_l − W) for W, W_best_l in zip(population[i], W_best)]
         else:                   # convergence attack
                    β = 0.05*(UB − LB)
                    new_weights = [W_best_l + β*np.random.randn(*W_best_l.shape) for W_best_l in W_best]
       population[i] = [np.clip(W, LB, UB) for W in new_weights]
# Final projections
final_predict = sigmoid(sigmoid(sigmoid(new_input@W_best[0])@W_best[1])@W_best[2])@W_best[3]

3. Experimental Program Flow Design

3.1. Pre-Experiment Preparation

Before the experiment, the skin surface of the target muscle region of the subjects was cleaned with 75% medical alcohol cotton balls, followed by the removal of localized hair with a disposable razor to reduce the epidermal impedance and minimize the interference of movement artifacts to ensure the quality of surface electromyography (sEMG) signal acquisition. According to the international standard for bioelectric signal acquisition (SENIAM guidelines), disposable Ag/AgCl electrode sheets (10 mm in diameter, pre-coated with conductive paste) were attached along the muscle belly of the target muscle to ensure that the electrodes were spaced at a distance of 20 mm and were in close contact with the skin, and then the sEMG acquisition system was activated. A six-channel sEMG acquisition device (EMG_06, Wuxi Porunin Technology Co., Ltd., Wuxi, China, sampling rate 2000 Hz, bandwidth 20–500 Hz) was used to synchronously record the EMG activities of the biceps, brachioradialis, and triceps brachii muscles and display the signal waveforms in real time through the software of the upper computer. When the acquisition was completed, the EMG signal data were transmitted to the upper computer through the transmission line in real time without loss and then stored and processed in depth with the help of MATLAB software version 2021a for subsequent research and analysis. The Experimental program flow design is shown in Figure 1.

3.2. Subject (Of an Experiment)

Three male and two female volunteers were carefully selected for this experiment, all of whom had a body mass index (BMI) in the normal range (see Table 1 for details) and were of similar age between 23 and 26 years old. All volunteers were in good physical condition, had not suffered any injuries, did not suffer from any muscle-related diseases or disorders, and had not engaged in strenuous exercise during the week before the start of the experiment to ensure that the experimental data could be controlled at the level of individual differences to the greatest extent possible.
Before the start of the experiment, each volunteer signed an informed consent form and understood the whole experimental procedure in detail. It should be emphasized that this experiment was designed with safety in mind and would not cause any adverse effects on the volunteers, who also knew the purpose of the experiment and all the contents clearly.
The experiment was carried out in a shielded laboratory (area 49 m2, temperature 23 ± 1 °C, humidity 50 ± 5%), which was tested for electromagnetic compatibility (based on the GB/T 17626.3-2016 standard [15]) with an ambient noise intensity of ≤40 dB and an IF interference of ≤0.1 mV, in order to ensure that the sEMG signal acquisition was free from external interference.

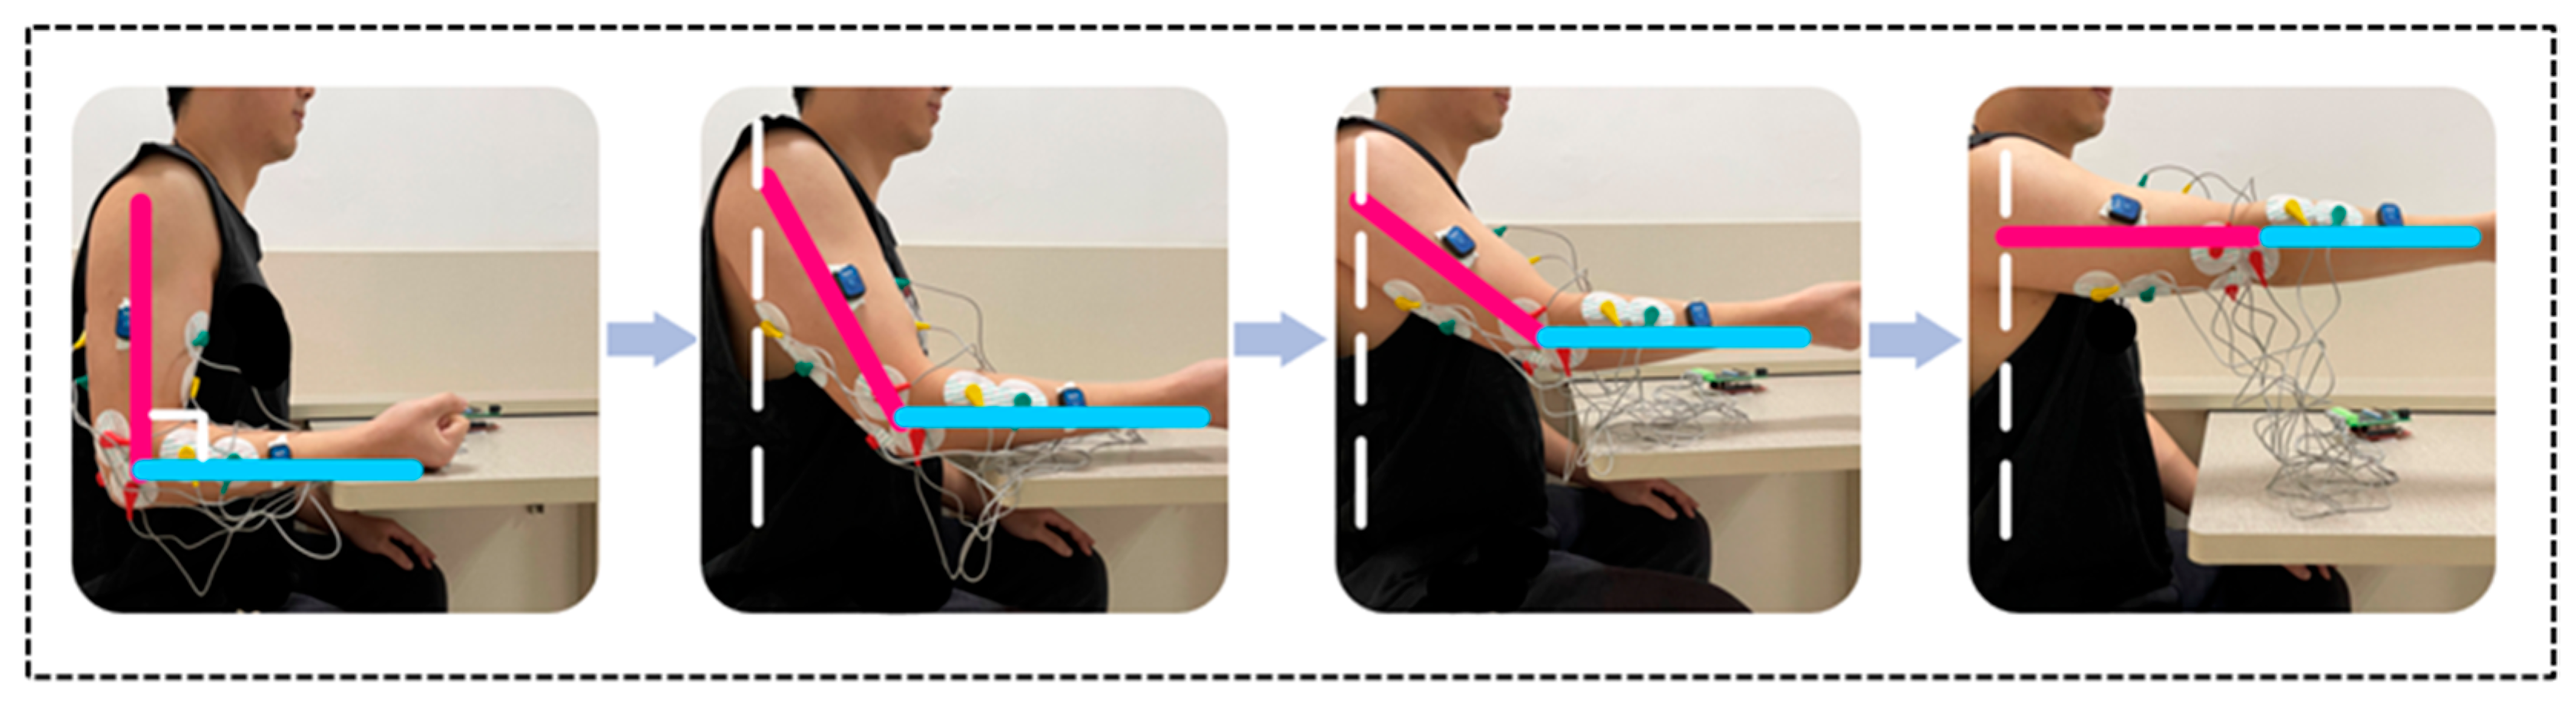
3.3. Data Acquisition

The laboratory conducted extensive market research and comparative analysis on the selection of surface EMG signal acquisition equipment. Finally, the EMG_06 six-channel sEMG acquisition system (Wuxi Porunin Technology Co., Ltd., Wuxi, China) was selected—with the following technical parameters: input impedance >100 MΩ, common mode rejection ratio ≥110 dB, built-in high-pass filter (cutoff frequency 20 Hz) and 50 Hz trap, and signal quantization accuracy of 16 bit—which meets the experimental requirements. This system is equipped with a six-lead EMG module and is combined with the STM32 development kit as shown in the figure below.
Each wire of the device is equipped with three key acquisition points distinguished by color: red is the reference electrode to stabilize the potential reference; green is the ground electrode to construct the ground loop; and yellow is the working electrode to pick up the core signal.
In this study, the 12-axis inertial measurement unit (IMU) model WT9011DCL-BT50 of Shenzhen Witte Intelligent Technology Co., Ltd., Shenzhen, China. is used as the joint angle acquisition device. This device was selected through comprehensive screening and market comparison to ensure a sampling frequency of 200 Hz and support for Bluetooth 5.0 wireless transmission protocols. The WT9011DCL-BT50 acquisition system demonstrates exceptional cost-effectiveness compared with high-end devices such as Xsens, MTw, and Awinda, with a purchase price equivalent to 16% and a physical footprint reduced to 60% of premium alternatives. Notably, it exhibits superior technical performance and enhanced development compatibility, fulfilling the operational requirements of this study. This system has been successfully implemented in multiple biomechanical investigations [16,17], validating its reliability in dynamic motion capture through rigorous experimental verification protocols.
During data acquisition, subjects were placed in an upright position (body perpendicular to the ground ±5°) with arms naturally hanging down and forearms fixed on a stand Figure 2) to minimize the effects of motion artifacts and positional changes on the sEMG signal. The three muscles that were selected for study were muscles with more pronounced force generation in upper-limb movements: biceps, brachialis, and triceps brachii (Figure 3).

4. Acquisition and Processing of Multi-Information Fusion Signals

The multi-modal fusion strategy (sEMG + joint angles) proposed in this study implements complementary capture of muscular activation states and kinematic information through non-invasive acquisition modalities employing surface electrode patches and inertial measurement units (IMUs). Surface electromyography (sEMG) is widely adopted in joint motion prediction research due to its preemptive detection capability, enabling signal acquisition prior to actual muscle contraction. While sEMG signals are susceptible to noise interference yet effectively reflect neuromuscular intent, angular measurements provide stable kinematic data but lack granularity in force exertion details. Their synergistic integration allows noise filtration in sEMG through kinematic constraints, while compensating for missing activation dynamics in angular signals via muscular activation profiles, thereby enhancing data reliability. (Note: Experimental data in this phase have been derived from healthy participants; the model’s performance under pathological conditions requires independent clinical validation).

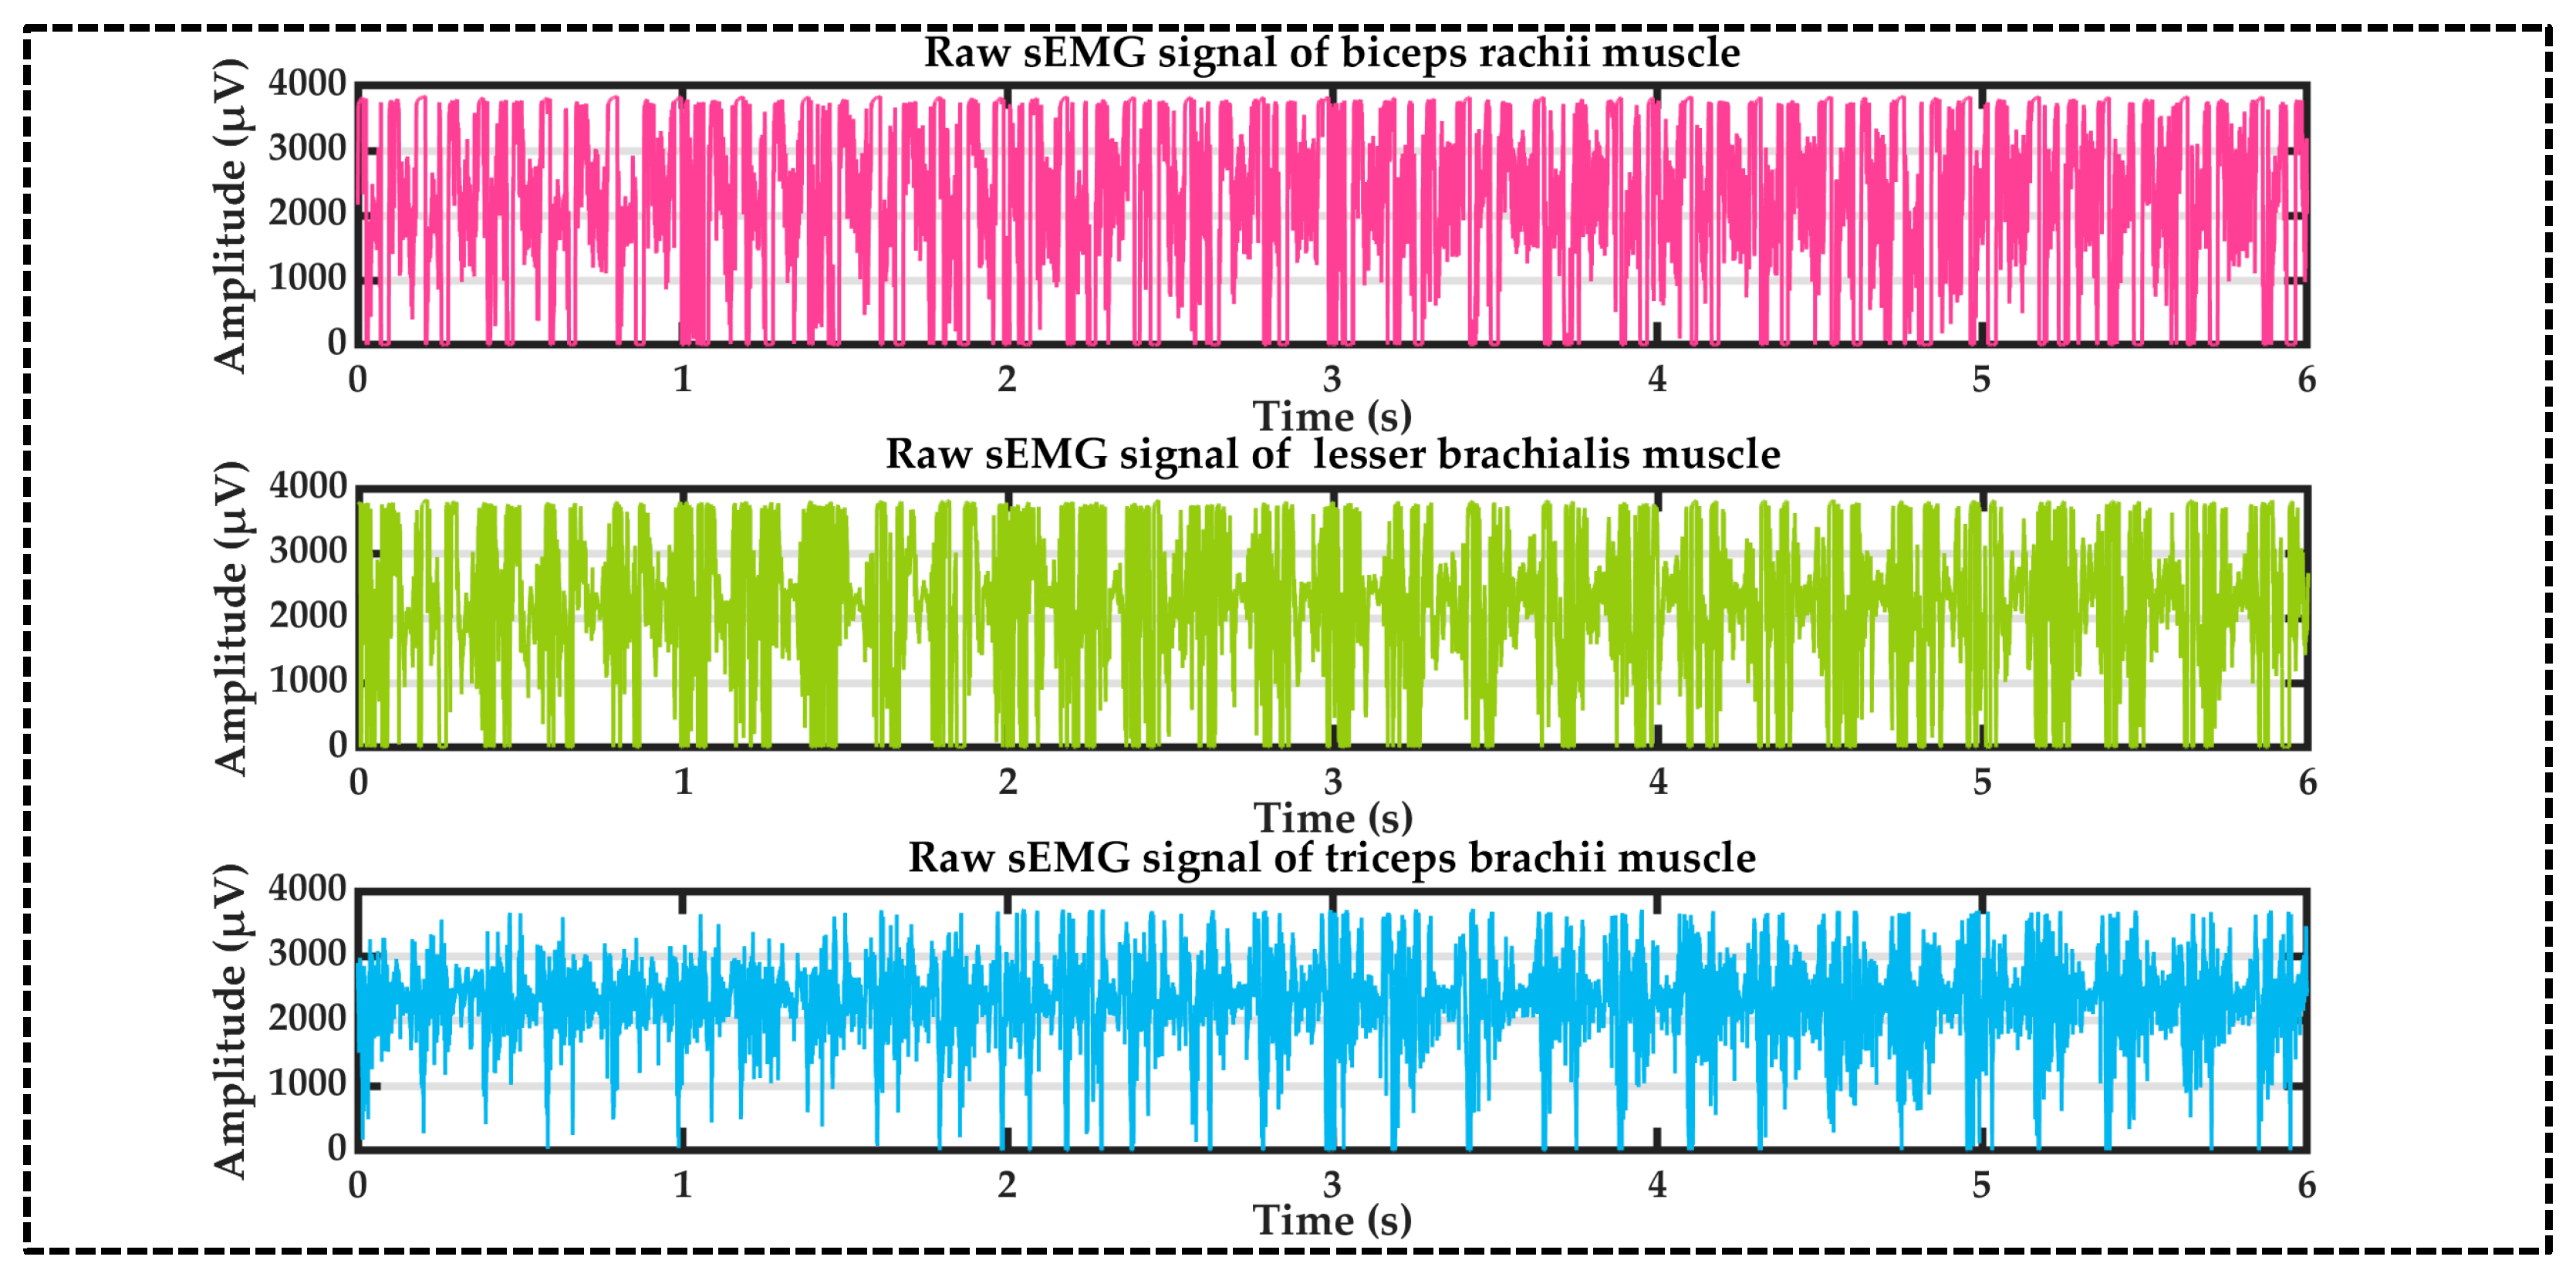
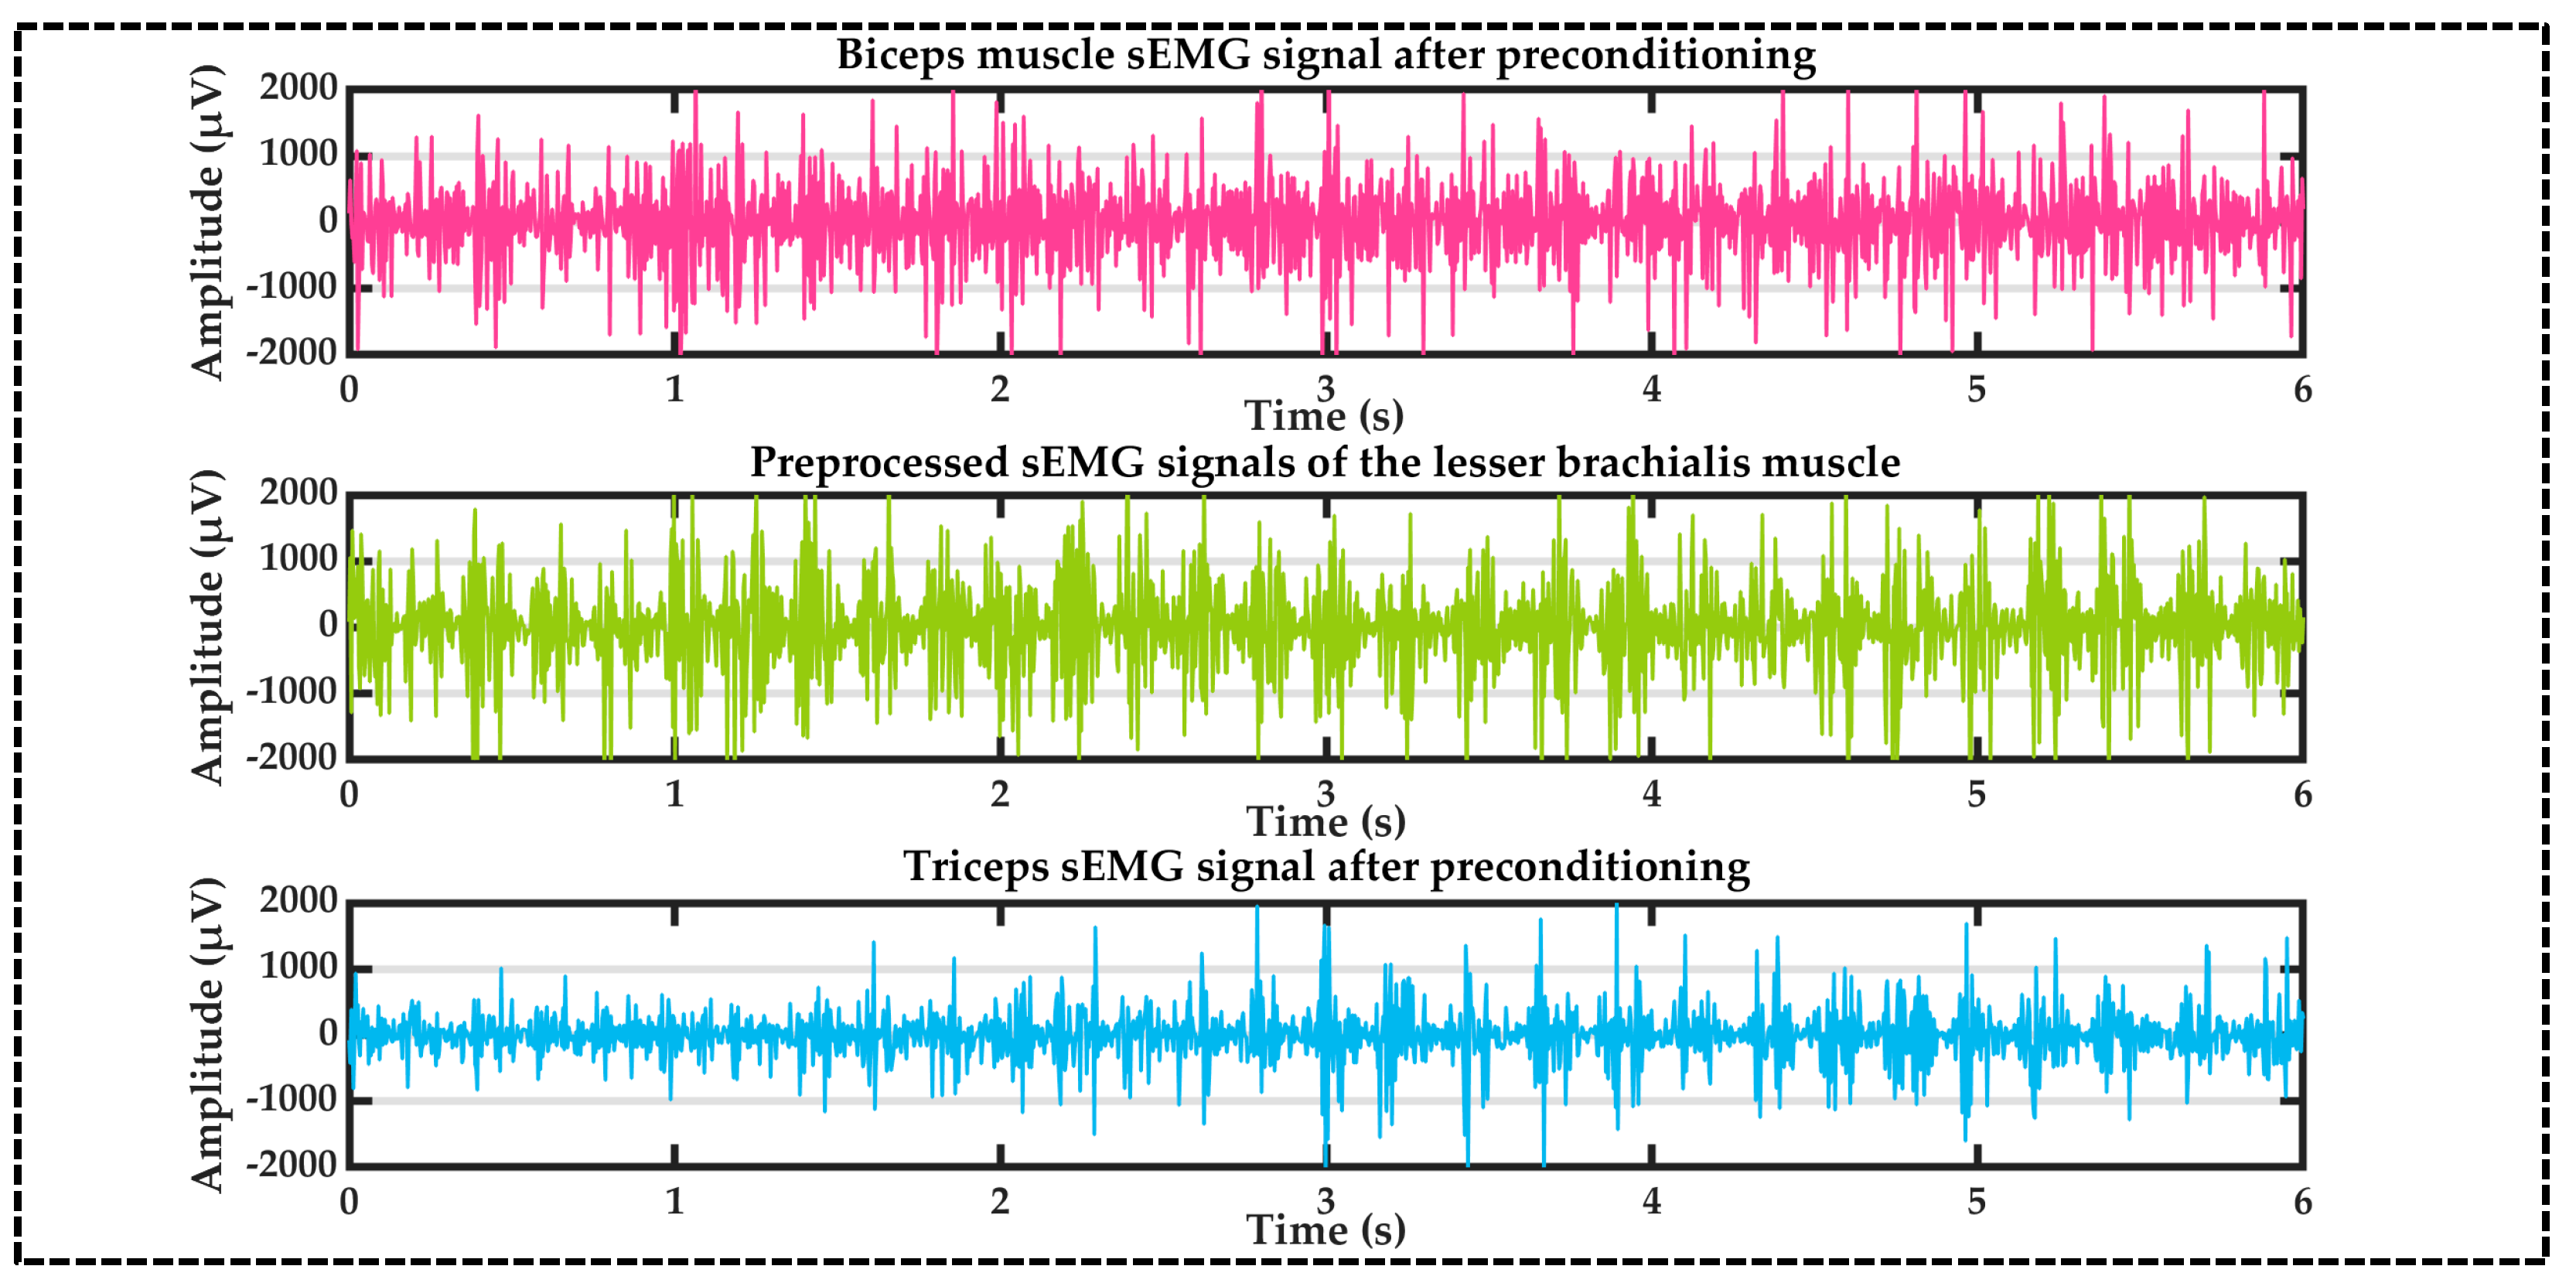
4.1. Surface EMG Signal Acquisition and Processing

The effective frequency range of surface EMG signals is typically 50–200 Hz [18], but they are susceptible to low-frequency motion artifacts (0–20 Hz) and 50 Hz power line noise during acquisition, resulting in signal baseline drift and periodic noise. A fourth-order Butterworth high-pass filter (cutoff frequency 20 Hz, attenuation slope −24 dB/octave) was used to filter out the 0–20 Hz low-frequency motion artifacts and the filter amplitude–frequency response curve. The IIR digital trap (center frequency 50 Hz, bandwidth 4 Hz, Q value 12.5) is further designed with the transfer function:
H z = 1 2 cos ω 0 z 1 + z 2 1 2 r cos ω 0 z 1 + r 2 z 2 ,
where ω 0 = 2 π × 50 / 2000 , the damping factor r = 0.95, and the sampling rate is 2000 Hz.
Following high-pass filtering and notch processing, the signal-to-noise ratio (SNR) was enhanced from 15.2 dB to 28.6 dB, representing an 88.2% improvement. This preprocessing pipeline effectively suppressed power line interference and motion artifacts, establishing a robust data foundation for subsequent analytical procedures.
After preliminary filtering, the sEMG signal still had amplitude fluctuations (the standard deviation decreased from 0.32 mV to 0.18 mV of the original signal), which required further smoothing. The full-wave rectification technique was used to nonlinearly transform the filtered signal to eliminate the negative signal component and preserve the muscle activation features. The mathematical expression is:
x r e c t t = x f i l t e r e d t ,
A first-order Butterworth low-pass filter (cutoff frequency 5 Hz, attenuation slope −6 dB/octave) was applied to the rectified signal to further smooth the signal, and the standard deviation of its amplitude fluctuation of the output signal was reduced to 0.08 mV.
s E M G r a c n = s E M G n ,
where is the original EMG signal and is the EMG signal after full-wave rectification. In order to obtain a smoother surface EMG signal, a first-order low-pass Butterworth filter is used for further processing.
H ω 2 = 1 1 + ω ω c 2 n ,
where n is the number of filter orders and ω c is the cutoff frequency; here the cutoff frequency is set to 5 Hz.
The normalization is performed in MATLAB using the map minmax function, and the min-max normalization method is used to linearly map each channel of the sEMG signal to the interval [−1, 1], Equation (12).:
x n o r m = 2 × x x min x max x min 1 ,
In the above equation, xmin and xmin are the maximum and minimum values of x(i), respectively.
Figure 4 shows the raw signals acquired from the biceps brachii (rosy red), brachialis (ginger green), and triceps brachii (sky blue) muscles:
The sEMG signals of biceps brachii (rosy red), brachialis (ginger green), and triceps brachii (sky blue) muscles after preprocessing by the above process are shown in Figure 5 below.

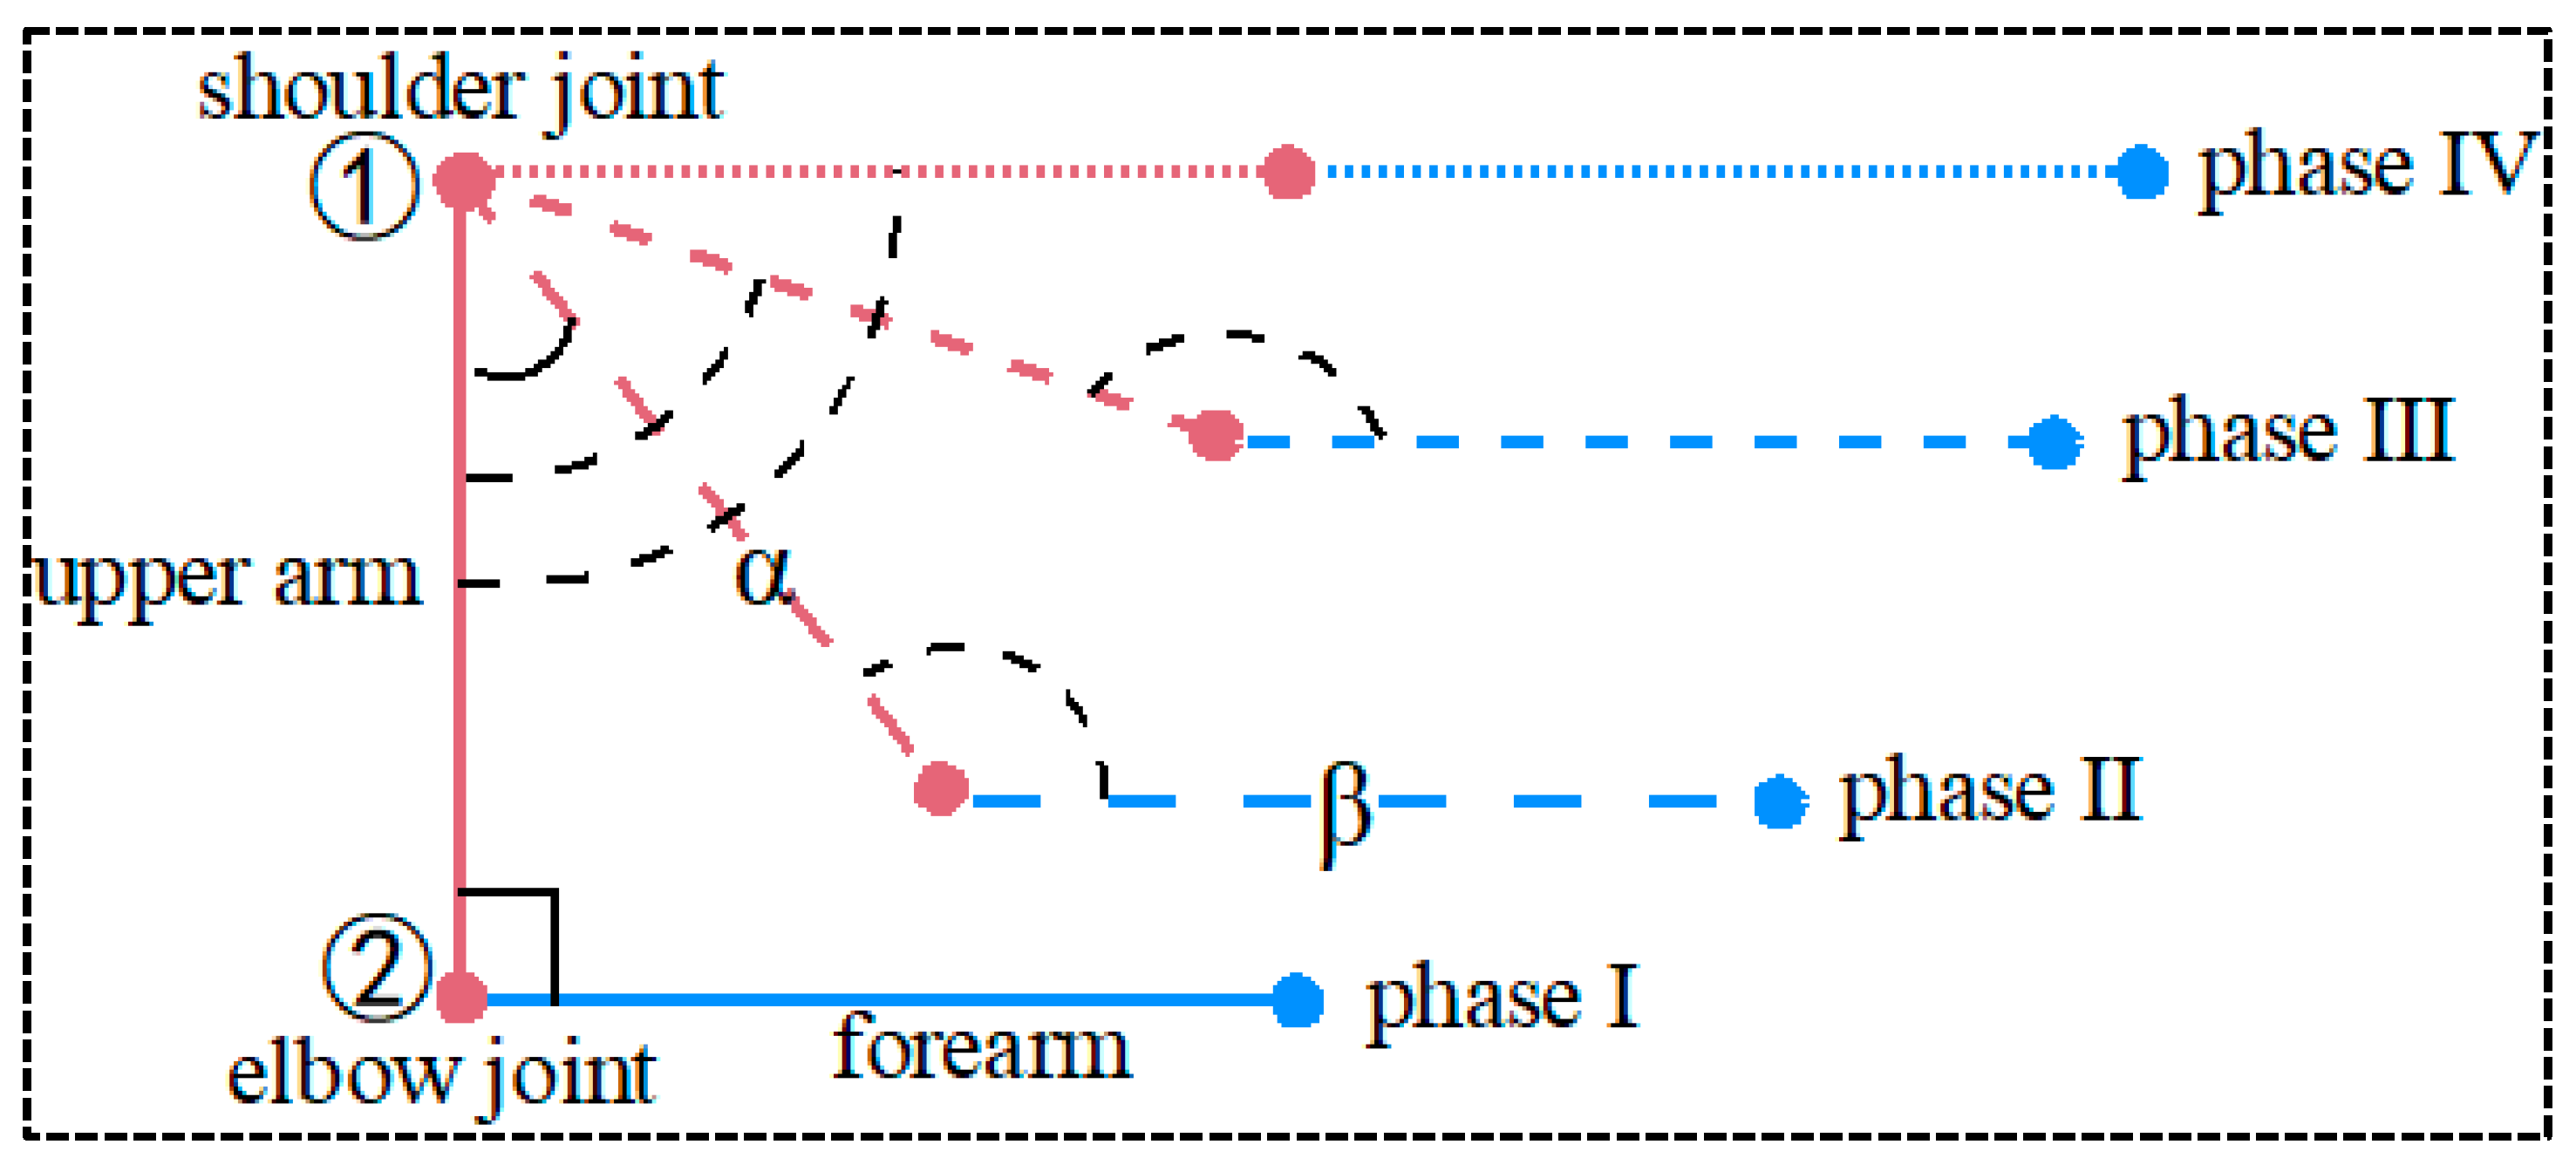
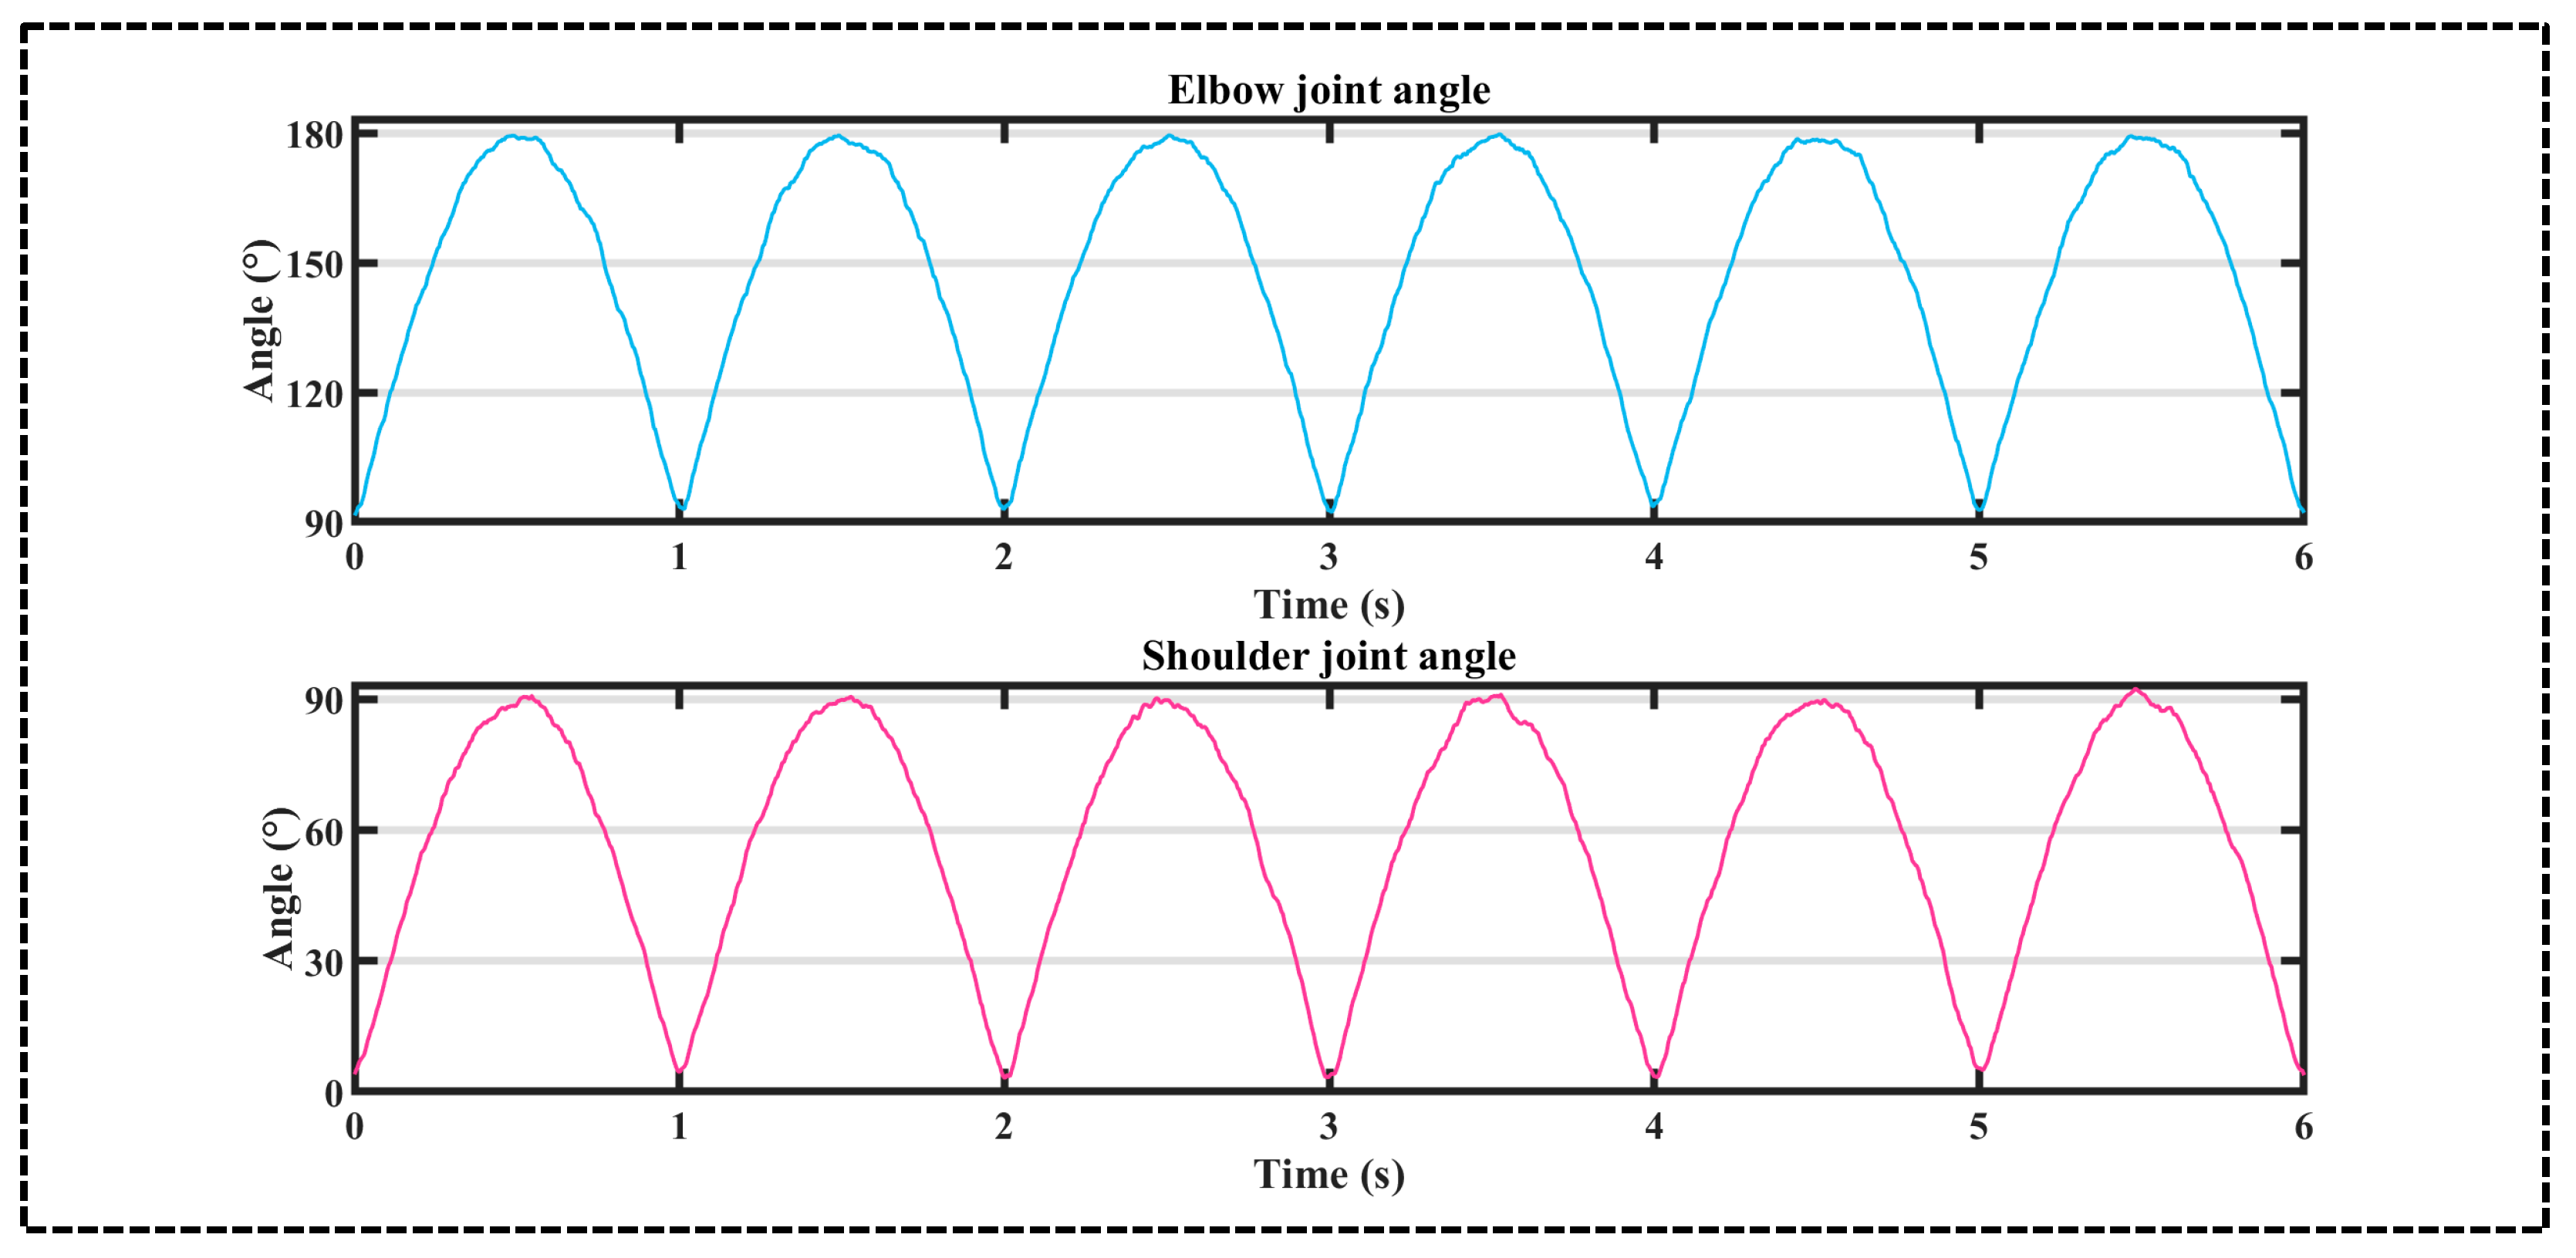
4.2. Acquisition and Processing of Shoulder and Elbow Joint Angle Signals

Stretching is a common form of upper body exercise, and this paper is a study of stretching. The position of the shoulder and elbow joint extension movement is shown in Figure 6.
In Figure 6, ① is the shoulder joint and ② is the elbow joint; the angle captured by the large arm sensor is α, and the angle captured by the small arm sensor is β; the rose-red sketch is for the large arm, and the blue sketch is for the small arm; and the angle of the shoulder joint is set to be A, and the angle of the elbow joint is set to be B. (Note: The initial angle of the shoulder joint is set to be 0°, and the initial angle of the elbow joint is set to be 90°.)
A = α ,
B = 90 ° + α + β
The angular measurements of upper arm and forearm motion acquired by the positional sensors were computationally transformed into shoulder and elbow joint angles through Equations (11) and (12). Following data smoothing procedures, the actual kinematic profiles of shoulder and elbow joints during extension movements are demonstrated in Figure 7, which fulfilled the data quality requirements for upper-limb trajectory prediction with statistical verification (p < 0.01, n = 15).

5. Test Procedure and Analysis

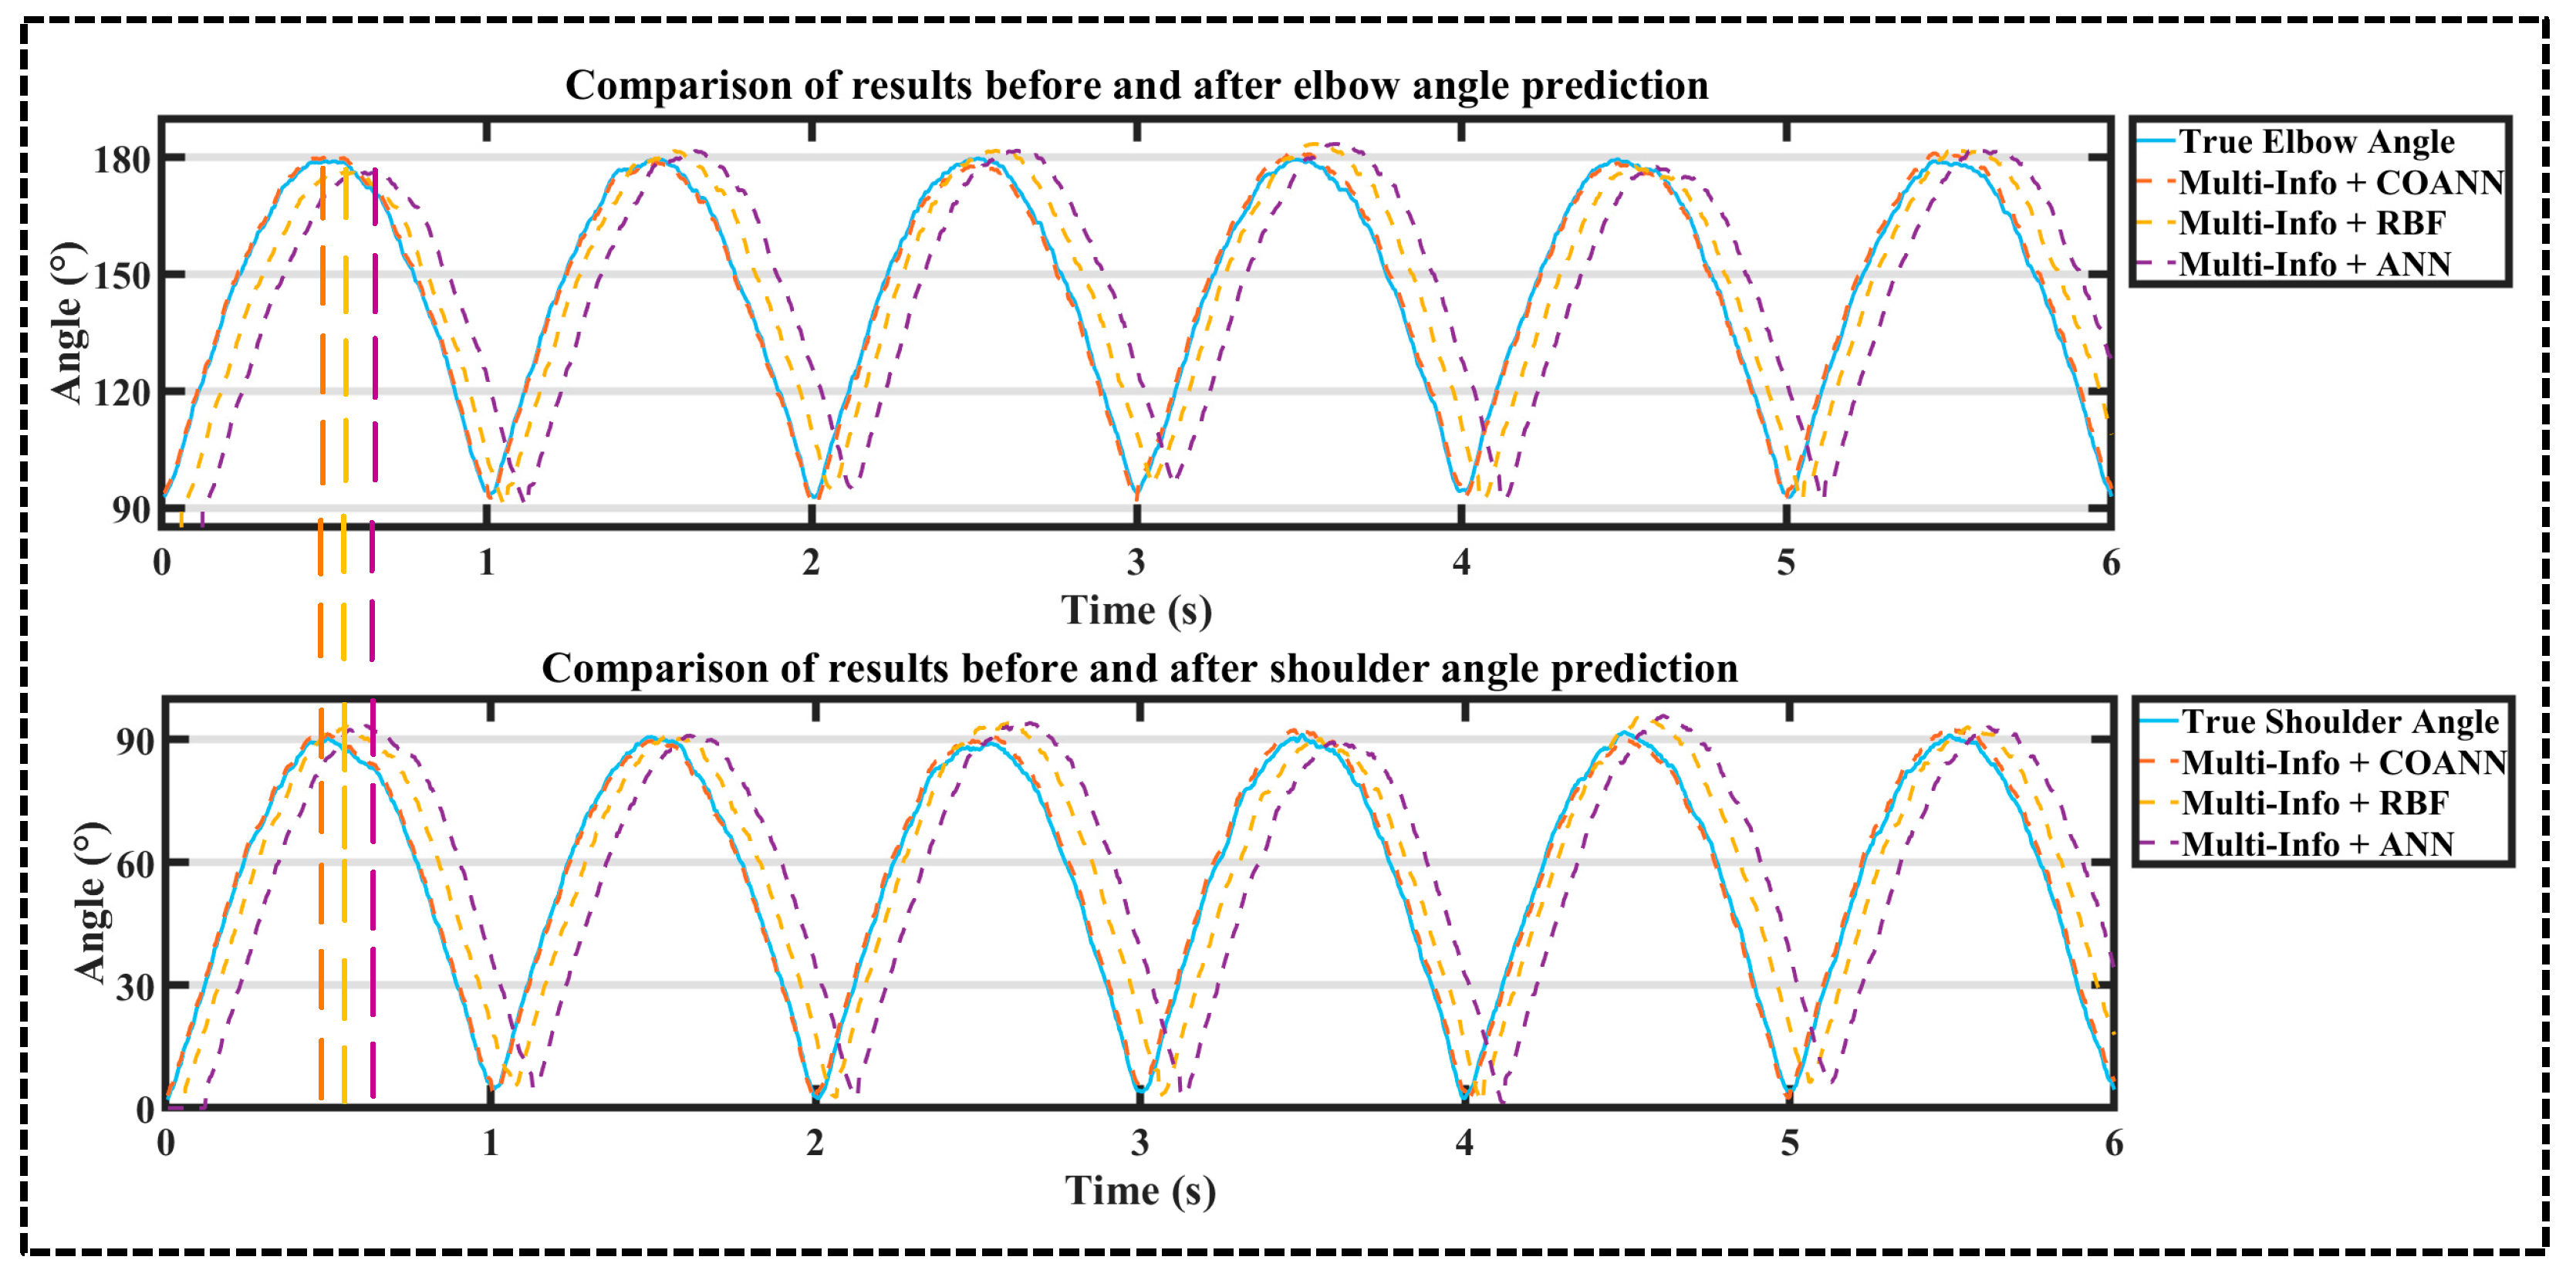
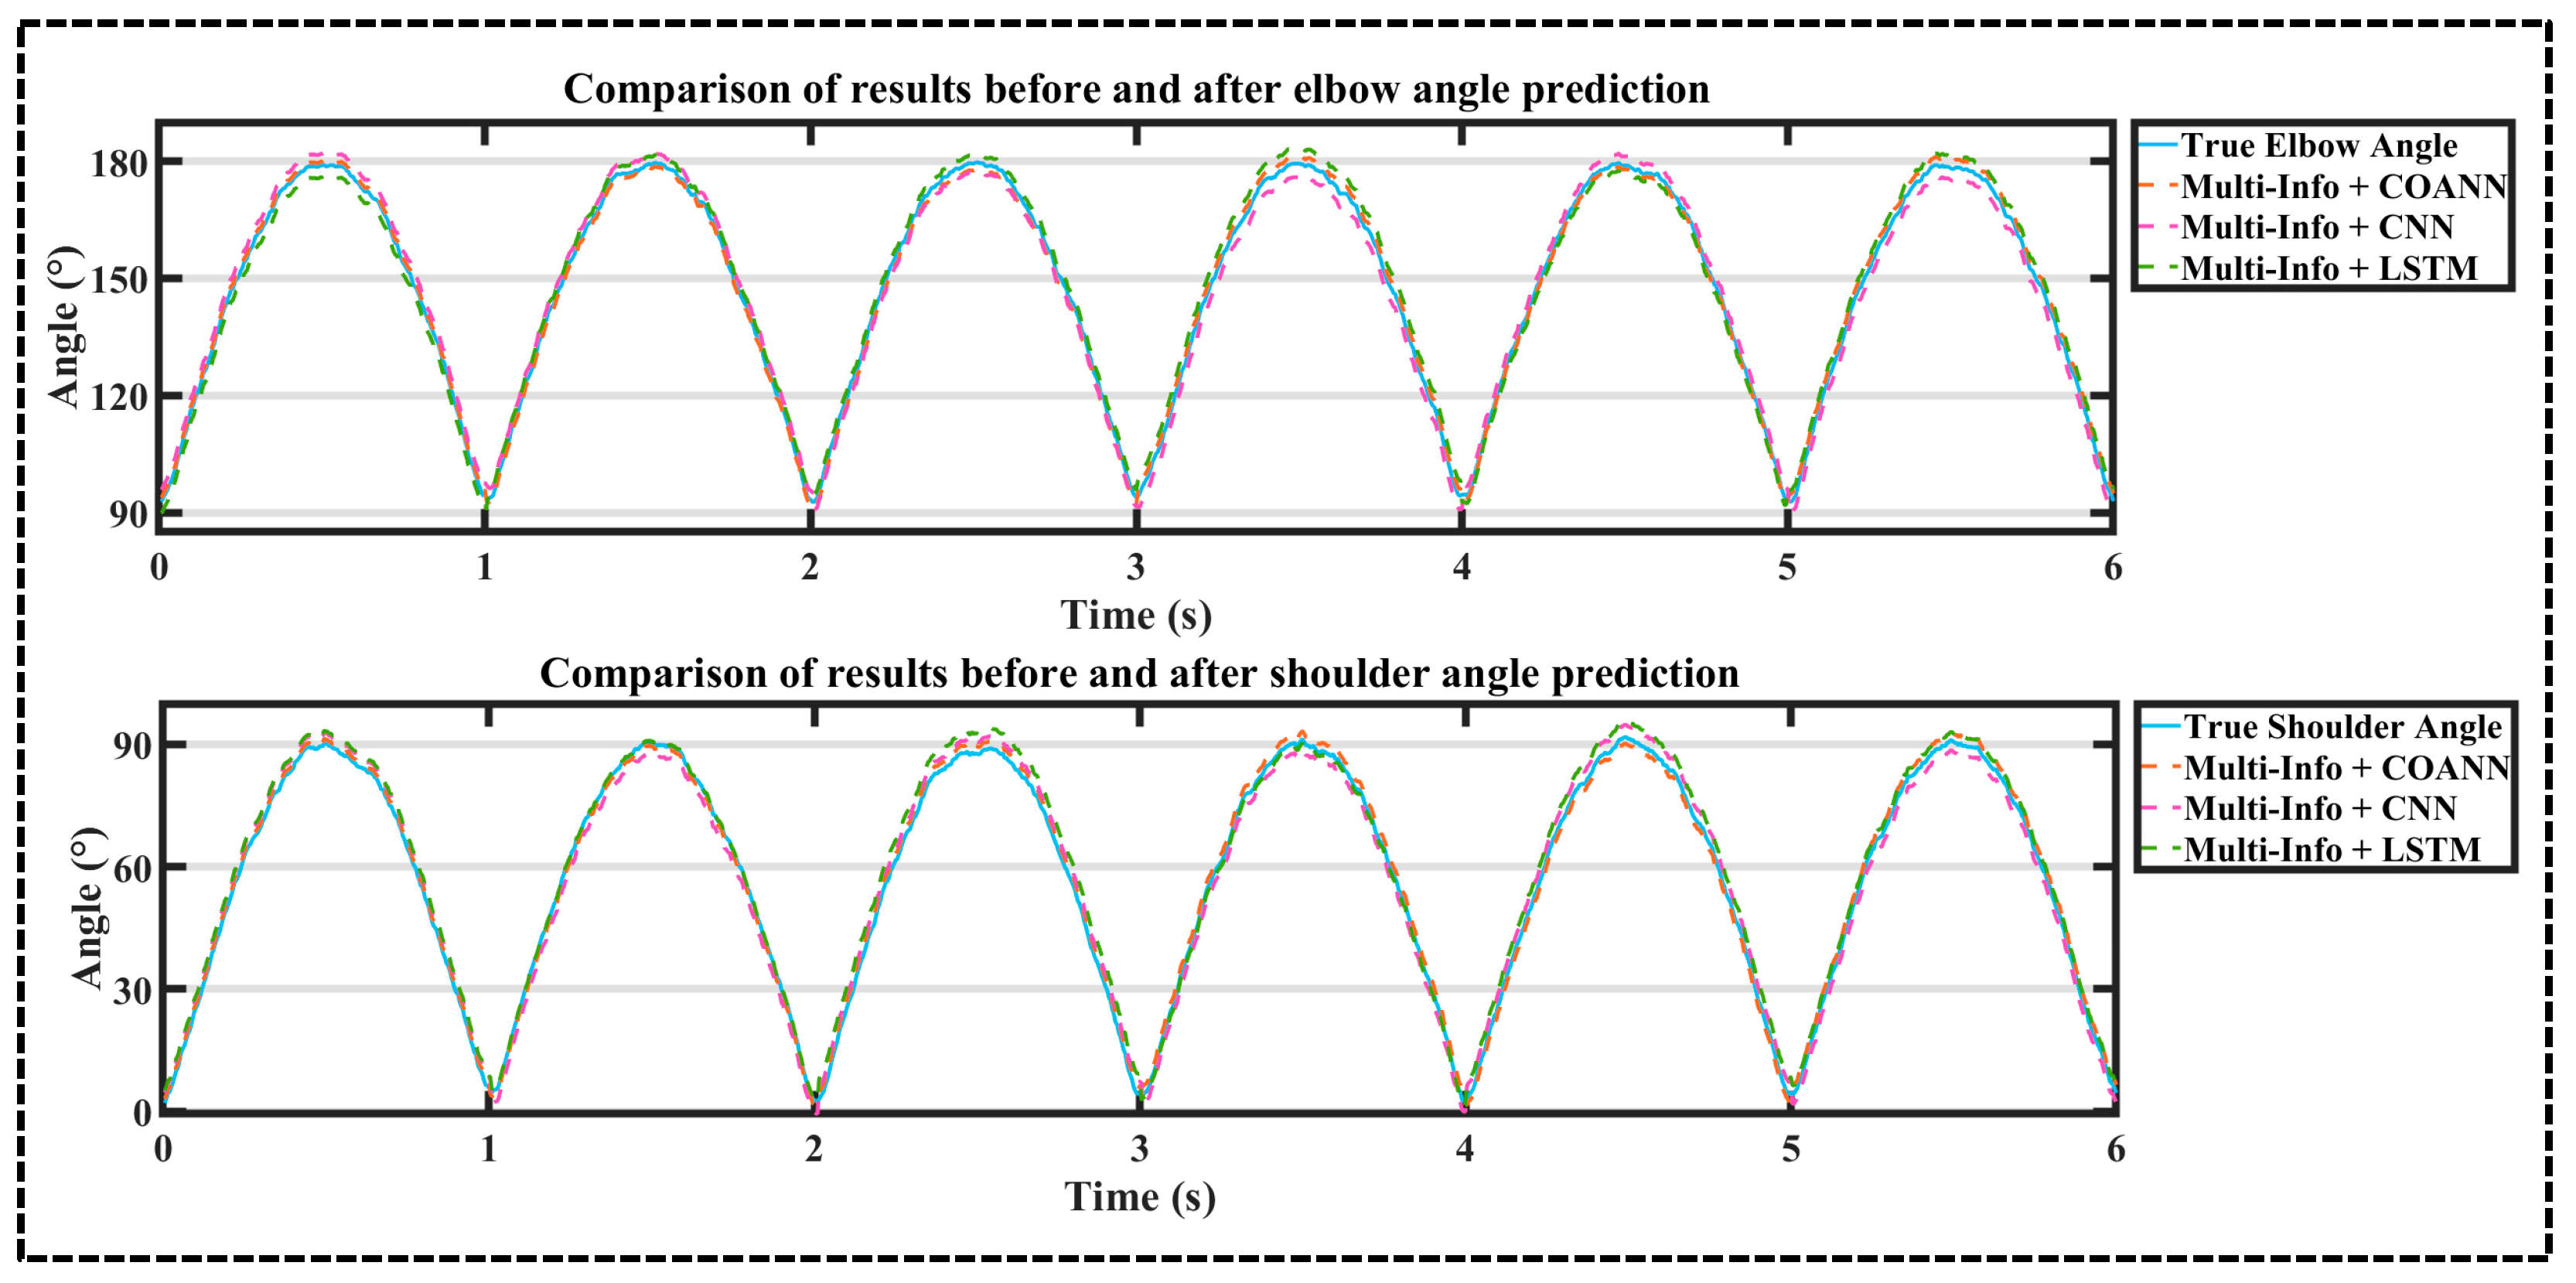
5.1. Comparison of Prediction Effectiveness of Algorithms Under Multi-Information Fusion Inputs

This study proposes a novel COANN algorithm integrating the Cheetah Optimizer Algorithm (COA) with the Artificial Neural Network (ANN), where the COA dynamically adjusts ANN weights to replace conventional gradient descent methods, effectively addressing issues of local optima stagnation and computational latency. The COA-driven optimization framework implements phase-specific weight updates through biomimetic strategies: Rapid Tracking (Equation (4)) for global exploration, Ambush (Equation (5)) for adaptive step-size control, and Attack (Equation (6)) for precision refinement. The COANN architecture features an input layer comprising five nodes corresponding to three-channel surface electromyography (sEMG) signals (biceps brachii, brachialis, triceps brachii) and biaxial joint angles (shoulder, elbow), with the output layer generating real-time joint angle predictions.
The ANN structure diagram that was used for the data analysis of upper-limb joint angle prediction is shown in Figure 8. This paper focuses on the prediction of multi-dimensional input and single-dimensional output. The artificial neural network input layer in the structure is 5 neurons, corresponding to three channels of 3 surface EMG signals and 2 joint angles; the hidden layer is 3 layers; the output layer is 1 layer, corresponding to 2 neurons, corresponding to the predicted 2 joint angles [19,20]. (Note: each layer has a bias node, except for the output layer).
In order to verify the recognition effect of the COANN, four networks—the ANN, RBF, CNN, and LSTM—are selected to compare the results obtained through multi-information sources as input [21,22,23,24,25,26,27,28,29].
Artificial Neural Network (ANN): The Artificial Neural Network (ANN) imitates biological neural structure and realizes nonlinear mapping through neuron connection and activation function (e.g., ReLU/Sigmoid). Because ANN serves as the original framework for the COANN, it can visually compare the prediction effect of the COANN.
Radial Basis Function (RBF) Network: This is a three-layer feed-forward neural network that realizes nonlinear mapping through radial basis functions (e.g., Gaussian function) in the hidden layer, which is good at solving the function approximation nonlinear problem and has a fast training speed and a simple structure. In terms of regression prediction and as the most representative algorithm, the RBF is chosen to compare the prediction effect of the COANN.
Convolutional Neural Network (CNN): The CNN lends local awareness and weight sharing to efficiently extract spatial level features and reduce the number of parameters; pooling enhances robustness, and end-to-end learning adapts to high-dimensional data.
Long Short-Term Memory (LSTM): LSTM solves gradient vanishing by a gating mechanism, models long-distance dependency, dynamically integrates context, and is good at dealing with temporal sequences.
Taking the subject A3 data as an example, the multi-information combination model is trained and predicted by the COANN, ANN, and RBF, and the training effect and comparison are as follows [30,31,32,33,34,35,36].
According to Figure 9, the COANN takes the shortest time when the COANN, RBF, and ANN all reach the wave peak in 0.48, 0.62, and 0.74 s, respectively, for the same input. The experimental results show that the COANN obtained after COA optimization has the shortest system runtime.
In this paper, the RMSE and R2 are used as evaluation indexes to analyze the multi-information combination and the COANN in order to predict the upper-limb joint recognition angle signal. The more the RMSE value tends to 0 and the more the R2 value tends to 1 is proof that the prediction method of the COANN is better.
According to Table 2, Table 3 and Table 4, it can be seen that the arithmetic mean values of the RMSE and R2 of shoulder and elbow joints obtained by the three algorithms—the COANN, RBF, and ANN—were compared using the multi-information combination approach: the arithmetic mean values of shoulder and elbow joints’ RMSE of the COANN were higher than those of the RBF by 20.05% and 27.39%, respectively, and the arithmetic mean values of R2 were higher than those of the RBF by 9.95% and 12.61%, respectively. The arithmetic mean values of shoulder and elbow joints’ RMSE of the COANN were 34.33% and 34.01% higher than those of the ANN, and the arithmetic mean values for R2 were 11.97% and 18.61% higher, respectively.
Taking the subject A3 data as an example, the multi-information combination model is trained and predicted by the COANN, CNN, and LSTM, and the training effect and comparison are as follows.
According to Figure 10, under the condition of the same input, when the COANN, CNN, and LSTM all reached the crest, the curve of the COANN combined with multi-source information was closer to the real value and had a smaller error. The experimental results show that the prediction accuracy of the COANN obtained after COA optimization was high.
According to Table 2, Table 5 and Table 6, it can be seen that the arithmetic mean values of the RMSE and R2 of shoulder and elbow joints obtained by three algorithms—the COANN, CNN, and LSTM—were compared using the multi-information combination approach: the arithmetic mean values of shoulder and elbow joints’ RMSE of the COANN were higher than those of the CNN by 13.02% and 16.78%, respectively, and the arithmetic mean values of R2 were higher than those of the CNN by 4.52% and 3.16%, respectively. The arithmetic mean values of shoulder and elbow joints’ RMSE of the COANN was 12.81% and 17.81% higher than that of LSTM, and the arithmetic mean values of R2 were 4.42% and 4.94% higher, respectively.

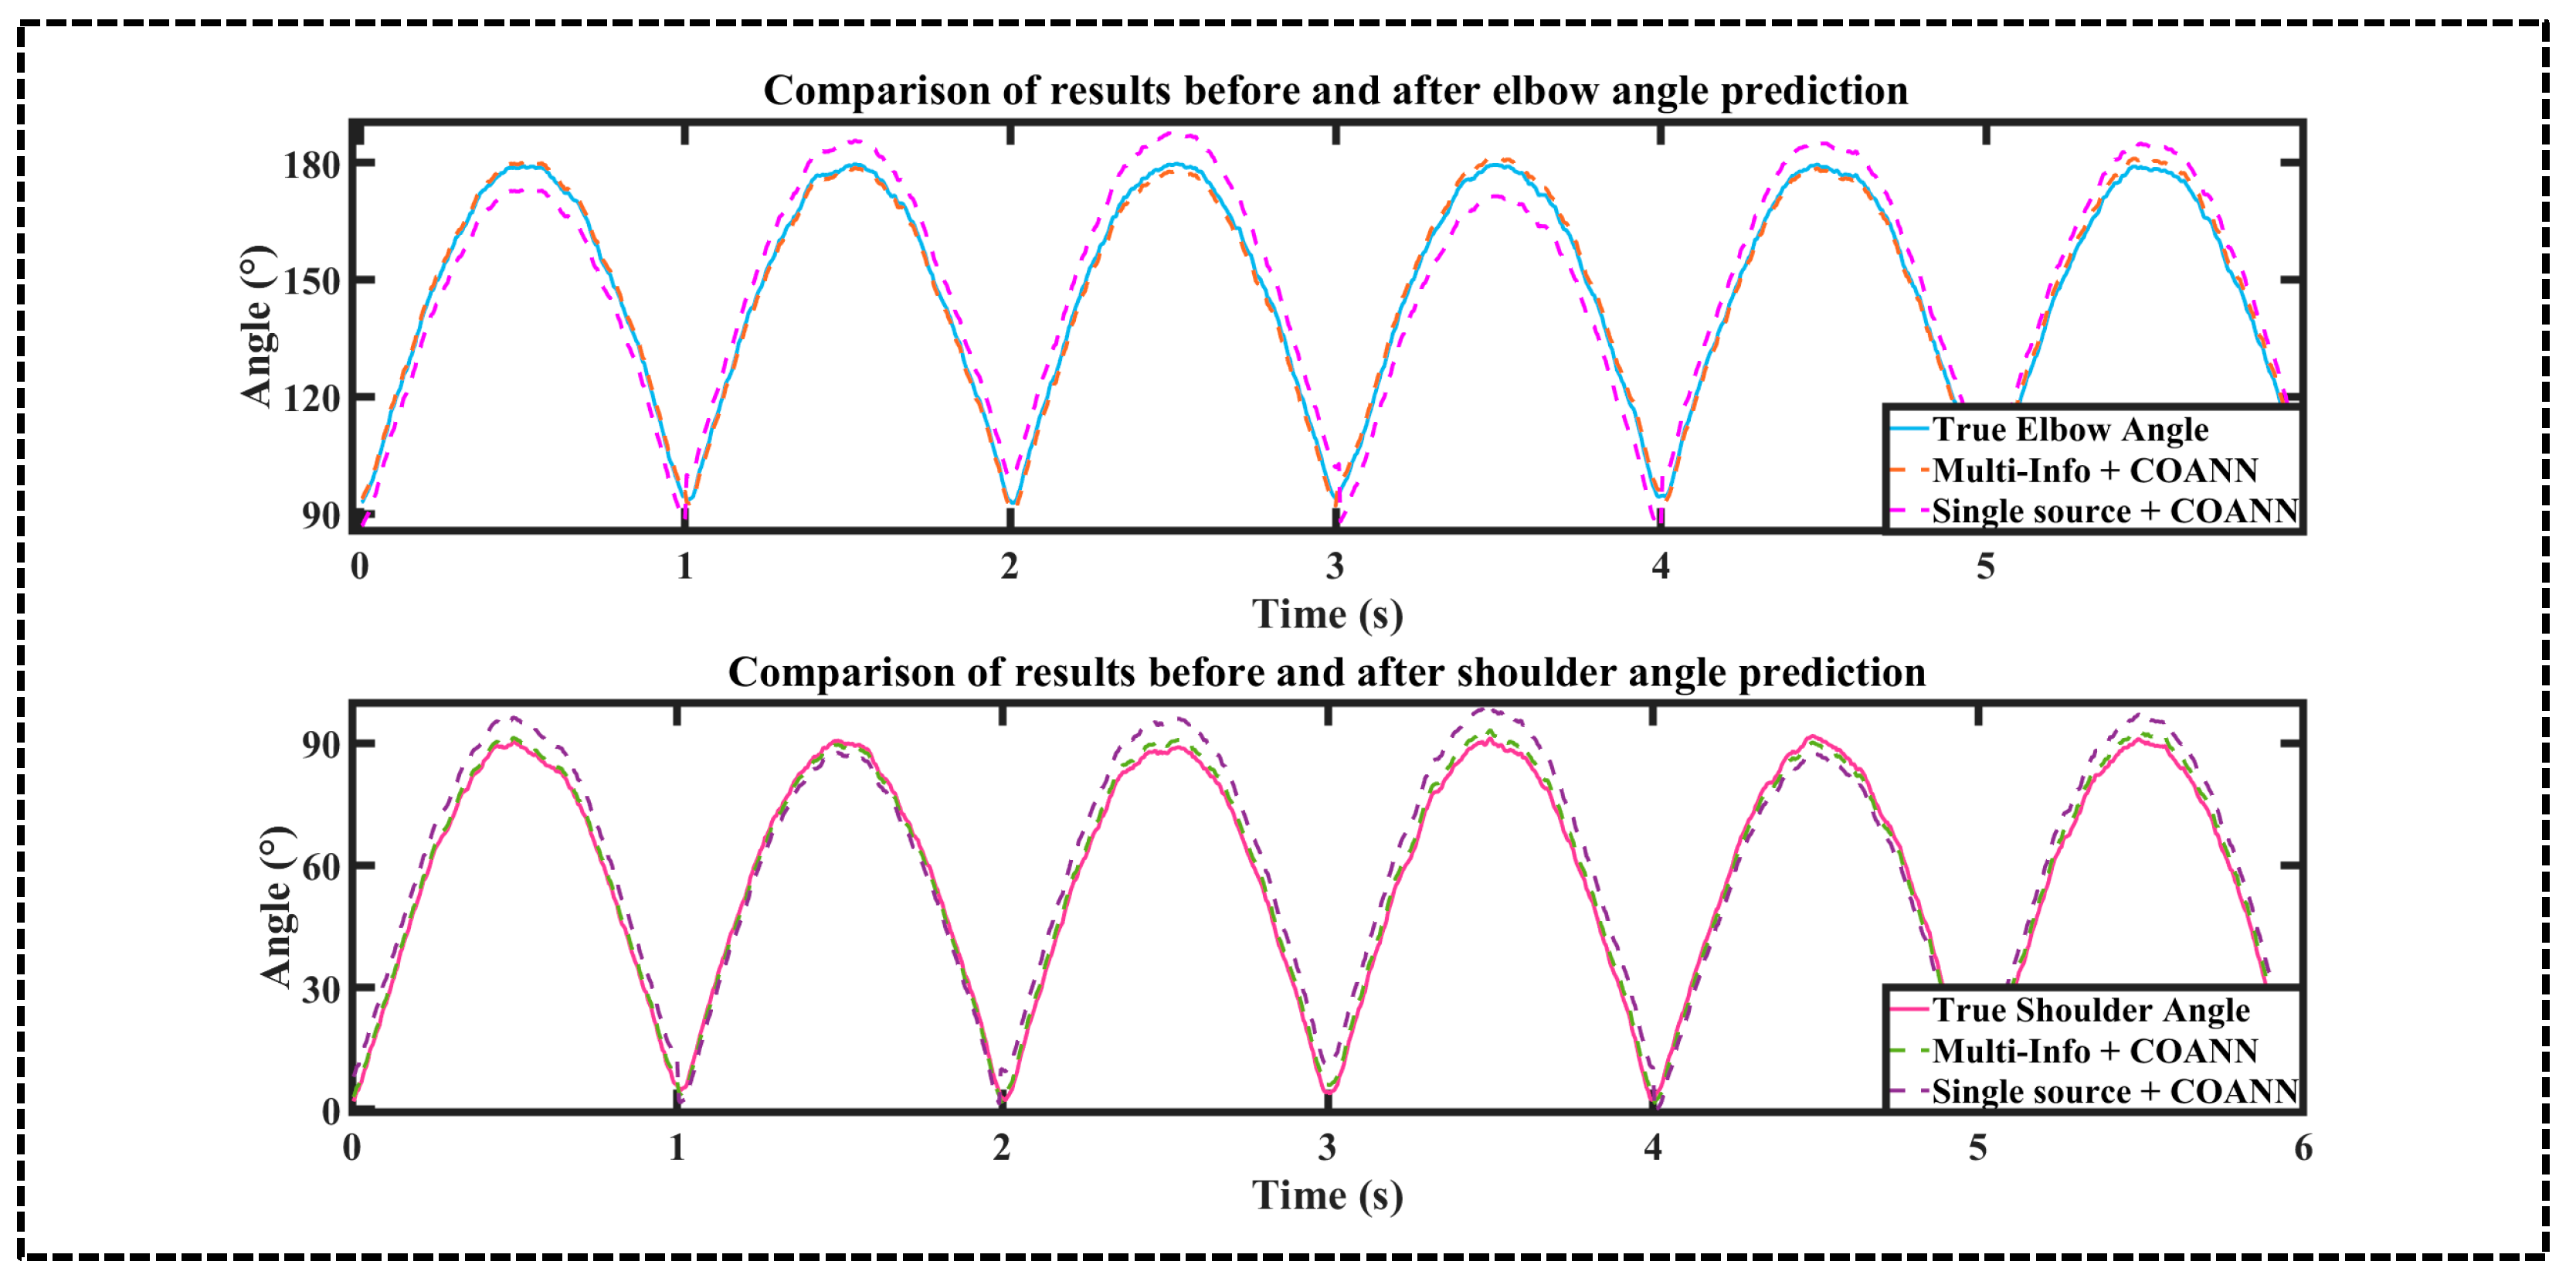
5.2. Comparison of Recognition Effect of Multi-Information Sources and Single Information Sources Under COANN Algorithm

In order to verify the influence of multi-information on the effect of system prediction accuracy, the shoulder and elbow joint motion angle prediction results were obtained for comparison based on the COANN using multi-modal information and single sEMG as inputs, respectively.
Taking the data of subject A3 as an example, the combination of multi-information and single sEMG as input data were predicted separately by the COANN, and the comparison of the prediction results is shown in Figure 11.
According to Figure 11, under the same algorithm conditions, when both the multi-information combination and the single sEMG information reached the wave peak, the curve of the multi-information combination was closer to the real value and had a smaller error; therefore, obviously the multi-information prediction accuracy is higher. The curve of the single sEMG information source had a larger error; therefore, obviously the single sEMG information source has a lower prediction accuracy.
According to Table 2 and Table 7, when utilizing the same COANN algorithm, the arithmetic mean values of the RMSE and R2 of the shoulder and elbow joints obtained by comparing the multi-information and single sEMG are as follows: the arithmetic mean values of the shoulder and elbow joints’ RMSE of the multi-information were higher than those of the single sEMG by 12.38% and 16.19%, respectively, and the arithmetic mean values of the R2 were higher by 2.94% and 2.68%, respectively.

6. Summary

In this paper, for the problem of accuracy of upper-limb shoulder and elbow joint motion prediction, an artificial neural network (COANN) based on the Cheetah Optimization Algorithm (COA) is proposed to carry out the research of upper-limb shoulder and elbow joint motion angle prediction by taking stretching exercise as an example. The results show that:
(1) When combining multi-information sources for prediction using the COANN, RBF, and ANN, respectively, the prediction response time of the COANN is 22.6% shorter than that of the RBF and 35.1% shorter than that of ANN. Combining sEMG and shoulder and elbow joint angles as system inputs, using the RMSE and R2 as evaluation indexes, and utilizing a multi-information combination approach, we compared the arithmetic mean values of the RMSE and R2 of shoulder and elbow joints obtained by the three algorithms—the COANN, RBF, and ANN: the arithmetic mean values of shoulder and elbow joints’ RMSE of the COANN were 20.05% and 27.39% higher than those of the RBF, respectively, and the arithmetic mean values of R2 were 9.95% and 12.61% higher, respectively. The arithmetic mean values of the RMSE of shoulder and elbow joints of the COANN were 34.33% and 34.01% higher than that of ANN, respectively, and the arithmetic mean values of R2 were 11.97% and 18.61% higher, respectively.
By incorporating the COANN, CNN, and LSTM, with sEMG (surface electromyography) and shoulder/elbow joint angles as input to the system, and through data estimation using the RMSE and R2, the arithmetic means of the RMSE values for the shoulder and elbow joints of the COANN were 13.02% and 16.78% lower than those of the RBF, respectively, and the arithmetic means of the R2 values were 4.52% and 3.16% higher, respectively. Compared with the ANN, the arithmetic means of the RMSE values for the shoulder and elbow joints of the COANN were 12.81% and 17.81% lower, respectively, and the arithmetic means of the R2 values were 4.42% and 4.94% higher, respectively.
(2) When utilizing the COANN algorithm with inputs of multi-information and single sEMG, respectively, the combination of multi-information improves the prediction accuracy of the elbow joint by 5.7% and the shoulder joint by 6.9% over the single sEMG. Using the RMSE and R2 as evaluation indexes, the arithmetic mean values of the RMSE and R2 for shoulder and elbow joints obtained from multi-information and single sEMG were compared when utilizing the same COANN algorithm: the arithmetic mean values of the RMSE for shoulder and elbow joints with multi-information were higher than that of single sEMG by 12.38% and 16.19%, respectively, and the arithmetic mean values of R2 were higher than that of single sEMG by 2.94% and 2.68%, respectively.
Experiments show that the COANN achieves high-precision prediction of shoulder and elbow joint angles (RMSE < 0.01°, R2 > 0.99) through multi-information fusion and global optimization of the COA, which provides a reliable basis for the problem of upper-limb movement disorders brought about by upper-limb hemiplegia, frozen shoulder, and other diseases.

7. Future Work

While the present findings demonstrate significant advances, this study contains inherent limitations requiring methodological refinement:
(1) Subject Pool Limitations: The experimental cohort, comprising only five healthy participants (aged 23–26 years), provides representative data for specific demographics but lacks inclusion of geriatric or clinical populations, potentially constraining the model’s generalizability to pathological conditions.
(2) Task Specificity Constraint: Validation procedures were exclusively validated on periodic extension movements, without targeted evaluation of complex aperiodic motions in individual muscle groups (e.g., brachioradialis activation patterns), necessitating multi-task dataset construction for comprehensive robustness assessment.
Future research will focus on extending the COANN framework to encompass complex aperiodic rehabilitation exercises targeting multi-muscle coordination (e.g., biceps/triceps brachii synergies), while implementing cross-domain adaptation for activities of daily living (ADLs) and functional lower-limb movements. Through collaborative efforts with medical institutions, we will expand sample diversity (targeting *n* ≥ 50 with pathological case integration) and conduct multi-center validation to test model adaptability using clinical neuromotor data, thereby rigorously validating the COANN’s robustness in complex neuromotor dysfunction scenarios.

Author Contributions

Conceptualization, S.Z. and Z.J.; methodology, W.L. and S.Z.; software, Z.J.; validation, W.L., Z.Y. and D.S.; formal analysis, W.L., Z.Y. and D.S.; investigation, Z.J.; resources, W.L., Z.Y. and D.S.; writing—original draft preparation, S.Z.; writing—review and editing, S.Z.; visualization, W.L. and D.S.; supervision, W.L. and D.S.; project administration, W.L. and Z.Y. All authors have read and agreed to the published version of the manuscript.

Funding

This research was funded by Jilin Province Development and Reform Commission 2024 Budgeted Capital Funding, grant number 2024C009-6.

Institutional Review Board Statement

The study was conducted in accordance with the Declaration of Helsinki and approved by the Institutional Review Board of Changchun University scientific and technological ethical committee.

Informed Consent Statement

Informed consent was obtained from all subjects involved in the study.

Data Availability Statement

All data used in this experiment were collected and recorded by high-precision equipment.

Acknowledgments

We would like to express our gratitude to Shandong Jite Industrial Technology Co., Ltd., Rizhao. They not only provided the high-performance PC equipment for this experiment but also actively carried out the manufacturing of the prototype for the subsequent experiments. Shandong Jite Industrial Technology Co., Ltd., Rizhao. showed high professionalism and strong technical capability throughout the project, ensuring smooth experiments and high-quality results. In addition, their team demonstrated an extremely high sense of responsibility and dedication in working with us, providing all-round support and assistance for the experiment. This close cooperation not only accelerated the experimental process but also laid a solid foundation for the smooth development of the subsequent projects. We would like to thank Shandong Jite Industrial Technology Co., Ltd., Rizhao. for their generous funding and technical support for this experiment and look forward to continued cooperation in the future to promote scientific research and technological innovation.

Conflicts of Interest

Author Zhengwei Yue is affiliated with the company Shandong Jite Industrial Technology Co., Ltd. The remaining authors declare that the research was conducted in the absence of any commercial or financial relationships that could be construed as a potential conflict of interest.

References

  1. Kong, D.Z.; Wang, W.D.; Guo, D.; Shi, Y.K. Research on the prediction method of upper extremity joint angle based on sEMG. J. Northwest. Polytech. Univ. 2022, 40, 764–770. [Google Scholar] [CrossRef]
  2. Zhao, Z.H.; Zhang, X.S.; Guo, Y.; Xu, Z.K.; Cao, R.H. Joint angle prediction model based on surface EMG signals. J. Taiyuan Univ. Technol. 2025, 1–9. [Google Scholar] [CrossRef]
  3. Liu, K.P.; Sun, R.L.; Chai, Y.Y.; Sun, Z.B. Upper extremity joint angle prediction based on generalized regression neural network. Sci. Technol. Eng. 2021, 21, 7187–7192. [Google Scholar]
  4. Bai, Z.H.; Xiang, Z.; Tan, Z.Y.; Pei, H.N. Adaptive neuro-fuzzy inference system optimized for rapid upper limb assessment. Comput. Integr. Manuf. Syst. 2024, 30, 1643–1656. [Google Scholar] [CrossRef]
  5. Wang, W.M. Prediction of lower limb joint angles by electromyographic signals based on VMD-ELMAN. Comput. Sci. 2024, 51, 257–264. [Google Scholar]
  6. Han, Y.L.; Tao, Q.; Zhang, X.D.; Chen, Q.Z. An electromyographic prediction method for human lower limb multi-joint continuous motion. Mach. Tools Hydraul. 2023, 51, 112–119. [Google Scholar]
  7. Rabe, K.G.; Lenzi, T.; Fey, N.P. Performance of Sonomyographic and Electromyographic Sensing for Continuous Estimation of Joint Torque During Ambulation on Multiple Terrains. IEEE Trans. Neural Syst. Rehabil. Eng. 2021, 29, 2635–2644. [Google Scholar] [CrossRef]
  8. Angelidou, C.; Artemiadis, P. On Predicting Transitions to Compliant Surfaces in Human Gait via Neural and Kinematic Signals. IEEE Trans. Neural Syst. Rehabil. Eng. 2023, 31, 2214–2223. [Google Scholar] [CrossRef]
  9. Morbidoni, C.; Cucchiarelli, A.; Agostini, V.; Knaflitz, M.; Fioretti, S.; Di Nardo, F. Machine-Learning-Based Prediction of Gait Events From EMG in Cerebral Palsy Children. IEEE Trans. Neural Syst. Rehabil. Eng. 2021, 29, 819–830. [Google Scholar] [CrossRef]
  10. Khorram, A.; Lin, H.; Peng, W. A Novel SFDN+DNN Approach for Efficient Hand Movement Recognition Using Surface Electromyography Signals. Eng. Proc. 2024, 76, 52. [Google Scholar] [CrossRef]
  11. Akbari, M.A.; Zare, M.; Azizipanah-abarghooee, R.; Mirjalili, S.; Deriche, M. The cheetah optimizer: A nature-inspired metaheuristic algorithm for large-scale optimization problems. Sci. Rep. 2022, 12, 10953. [Google Scholar] [CrossRef] [PubMed]
  12. Memon, Z.A.; Akbari, M.A.; Zare, M. An Improved Cheetah Optimizer for Accurate and Reliable Estimation of Unknown Parameters in Photovoltaic Cell and Module Models. Appl. Sci. 2023, 13, 9997. [Google Scholar] [CrossRef]
  13. Sait, S.M.; Mehta, P.; Gürses, D.; Yildiz, A.R. Cheetah optimization algorithm for optimum design of heat exchangers. Mater. Test. 2023, 65, 1230–1236. [Google Scholar] [CrossRef]
  14. Qiao, Y.Y.; Wang, J.Y.; Li, H.; Wang, Z. Research on vehicle PMSM control strategy optimized by cheetah algorithm. J. Chongqing Univ. Technol. (Nat. Sci.) 2024, 38, 48–54. [Google Scholar]
  15. GB/T 17626.3-2016; Electromagnetic Compatibility—Testing and Measurement Techniques—Radiated, Radio-Frequency, Electromagnetic Field Immunity Test. Standards Administration of China: Beijing, China, 2016.
  16. Wit Motion Shenzhen Co., Ltd. WT9011DCL-BT5.0 Bluetooth 5.0 Accelerometer Inclinometer Datasheet (v23-0608). 2023. Available online: https://www.wit-motion.com/BLE/17.html (accessed on 9 May 2025).
  17. Zong, S.Y.; Li, W.; Wei, X.J.; Chen, J.J.; Yue, Z.W. A Study on Lower Limb Movement Intention Recognition Based on Multi-Source Information Fusion. IEEE Access 2025, 13, 5032–5041. [Google Scholar] [CrossRef]
  18. Elouaham, S.; Dilou, A.; Nassiri, B.; Zougagh, H. Combination method for denoising EMG signals using EWT and EMD techniques. In Proceedings of the 2023 IEEE International Conference on Advances in Data-Driven Analytics and Intelligent Systems (ADACIS), Marrakesh, Morocco, 23–25 November 2023; pp. 1–6. [Google Scholar] [CrossRef]
  19. Fratti, R.; Marini, N.; Atzori, M.; Müller, H.; Tiengo, C.; Bassetto, F. A Multi-Scale CNN for Transfer Learning in sEMG-Based Hand Gesture Recognition for Prosthetic Devices. Sensors 2024, 24, 7147. [Google Scholar] [CrossRef] [PubMed]
  20. Deng, F.l. Neural network based on sEMG multi-eigenvalue fusion for lower limb joint Angle prediction. Technol. Appl. 2023, 37, 16–20. [Google Scholar]
  21. Haufe, S.; Isaias, I.U.; Pellegrini, F.; Palmisano, C. Gait Event Prediction Using Surface Electromyography in Parkinsonian Patients. Bioengineering 2023, 10, 212. [Google Scholar] [CrossRef]
  22. Cai, S.B.; Chen, D.P.; Fan, B.F.; Du, M.Y.; Bao, G.J.; Li, G. Gait phases recognition based on lower limb sEMG signals using LDA-PSO-LSTM algorithm Biomed. Signal Process. Control. 2023, 80 Pt 1, 104272. [Google Scholar] [CrossRef]
  23. Di Nardo, F.; Morbidoni, C.; Cucchiarelli, A.; Fioretti, S. Influence of EMG-signal processing and experimental set-up on prediction of gait events by neural network Biomed. Signal Process. Control. 2021, 63, 102232. [Google Scholar] [CrossRef]
  24. Sampath Dakshina Murthy, A.; Karthikeyan, T.; Vinoth Kanna, R. Gait-based person fall prediction using deep learning approach. Soft Comput. 2022, 26, 12933–12941. [Google Scholar] [CrossRef]
  25. Wei, P.N.; Zhang, J.H.; Wang, B.Z.; Hong, J. Surface Electromyography and Electroencephalogram-Based Gait Phase Recognition and Correlations Between Cortical and Locomotor Muscle in the Seven Gait Phases. Front. Neurosci. 2021, 15, 607905. [Google Scholar] [CrossRef] [PubMed]
  26. Di Nardo, F.; Morbidoni, C.; Mascia, G.; Verdini, F.; Fioretti, S. Intra-subject approach for gait-event prediction by neural network interpretation of EMG signals. Biomed. Med. Eng. Online 2020, 19, 58. [Google Scholar] [CrossRef] [PubMed]
  27. Arshad, M.Z.; Jamsrandorj, A.; Kim, J.; Mun, K.-R. Gait Events Prediction Using Hybrid CNN-RNN-Based Deep Learning Models through a Single Waist-Worn Wearable Sensor. Sensors 2022, 22, 8226. [Google Scholar] [CrossRef]
  28. Wang, S.; Nguyen, T.K.; Bhatt, T. Trip-Related Fall Risk Prediction Based on Gait Pattern in Healthy Older Adults: A Machine-Learning Approach. Sensors 2023, 23, 5536. [Google Scholar] [CrossRef] [PubMed]
  29. Di Nardo, F.; Basili, T.; Meletani, S.; Scaradozzi, D. Wavelet-Based Assessment of the Muscle-Activation Frequency Range by EMG Analysis. IEEE Access. 2022, 10, 9793–9805. [Google Scholar] [CrossRef]
  30. Sharma, A.K.; Liu, S.-H.; Zhu, X.; Chen, W. Predicting Gait Parameters of Leg Movement with sEMG and Accelerometer Using Cat Boost Machine Learning. Electronics 2024, 13, 1791. [Google Scholar] [CrossRef]
  31. Kim, J.-K.; Bae, M.-N.; Lee, K.B.; Hong, S.G. Identification of Patients with Sarcopenia Using Gait Parameters Based on Inertial Sensors. Sensors 2021, 21, 1786. [Google Scholar] [CrossRef]
  32. Di Nardo, F.; Cucchiarelli, A.; Morbidoni, C.; Fioretti, S. Prediction of stride duration by neural-network interpretation of surface EMG signals. In Proceedings of the 2021 IEEE International Symposium on Medical Measurements and Applications, Lausanne, Switzerland, 23–25 June 2021; pp. 1–5. [Google Scholar] [CrossRef]
  33. Chowdary, Y.S.S.M.V.; Tokala, J.R.; Sharma, A.; Sharma, S.; Sharma, V. Artificial Intelligence-based Approach for Gait Pattern Identification Using Surface Electromyography (SEMG). In Proceedings of the 2020 IEEE International Conference on Advanced Networks and Telecommunications Systems (ANTS), New Delhi, India, 14–17 December 2020; pp. 1–6. [Google Scholar] [CrossRef]
  34. Liu, J.; Wang, C.; He, B.; Li, P.; Wu, X. Metric Learning for Robust Gait Phase Recognition for a Lower Limb Exoskeleton Robot Based on sEMG. IEEE Trans. Med. Robot. Bionics 2022, 4, 472–479. [Google Scholar] [CrossRef]
  35. Arunganesh, K.; Nagarajan, G.; Sivakumaran, N.; Karthick, P.A. Recognition of Lower Limb Movements Using Machine Learning Methods and Bispectral Maps of Wireless SEMG Measurements. IEEE Sens. Lett. 2023, 7, 7004604. [Google Scholar]
  36. Wu, X.; Wang, P.; Wang, J.; Zhang, J.; Chen, W.; Wang, X. Prediction of Lower Limb Action Intention Based on Surface EMG Signal. In Proceedings of the 2021 IEEE 16th Conference on Industrial Electronics and Applications (ICIEA), Chengdu, China, 1–4 August 2021; pp. 1679–1684. [Google Scholar]
Figure 1. Experimental program flow design.
Applsci 15 05671 g001
Figure 2. Surface EMG signal acquisition equipment.
Applsci 15 05671 g002
Figure 3. Measurement of surface electromyography signals and joint angles during A3 extension exercise in subjects. (Rose is the large arm, sky blue is the small arm, and the white dotted line is the datum line perpendicular to the floor).
Applsci 15 05671 g003
Figure 4. Raw electromyography signals.
Applsci 15 05671 g004
Figure 5. Preprocessed sEMG signals.
Applsci 15 05671 g005
Figure 6. Shoulder and elbow joint movement position change diagrams.
Applsci 15 05671 g006
Figure 7. Actual angle of the shoulder and elbow joints during stretching exercises.
Applsci 15 05671 g007
Figure 8. ANN structure diagram.
Applsci 15 05671 g008
Figure 9. Comparison of upper extremity joint angle prediction results based on COANN, RBF, and ANN under multi-information.
Applsci 15 05671 g009
Figure 10. Comparison of upper extremity joint angle prediction results based on COANN, CNN, and LSTM under multi-information.
Applsci 15 05671 g010
Figure 11. Comparison of upper extremity joint angle prediction results between COANN-based multi-information combination and single sEMG as inputs.
Applsci 15 05671 g011
Table 1. Volunteer basic information sheet (n = 5).
Experiment No.GenderHeightWeightAgeBMI
A1female164.357.82621.4
A2female168.462.72522.1
A3male178.768.22521.4
A4male175.273.12523.8
A5male183.876.72622.7
Note: BMI classification is based on the Chinese health industry standard WS/T 428-2013: thin (BMI: ≤18.4); normal (BMI: 18.5~23.9); heavy (BMI: 24.0~27.9); obese (BMI: ≥28.0).
Table 2. Evaluation metrics for predicting upper extremity joint recognition angle signals by multi-information combination and COANN.
Elbow JointShoulder Joint
RMSER2RMSER2
A10.0039810.99590.0082610.9978
A20.0046280.98960.0120820.9895
A30.0037010.99980.0043260.9921
A40.0048340.99280.0093260.9822
A50.0065320.99930.0035910.9899
Table 3. Evaluation metrics for predicting upper extremity joint recognition angle signals by multi-information combination and RBF.
Elbow JointShoulder Joint
RMSER2RMSER2
A10.0170710.91690.0198250.9892
A20.0127380.90920.0422620.9075
A30.0999330.93120.0806880.9121
A40.0532220.91580.0574790.9531
A50.0549870.97360.0979540.9131
Table 4. Evaluation metrics for predicting upper extremity joint recognition angle signals by multi-information combination and ANN.
Elbow JointShoulder Joint
RMSER2RMSER2
A10.0932810.89370.1309810.8996
A20.1174740.88180.1905030.9108
A30.0184230.87640.1098610.9213
A40.1013050.91770.1236090.8956
A50.0873910.91160.0728560.8981
Table 5. Evaluation metrics for predicting upper extremity joint recognition angle signals by multi-information combination and CNN.
Elbow JointShoulder Joint
RMSER2RMSER2
A10.0170710.91690.0198250.9892
A20.0127380.90920.0422620.9075
A30.0999330.93120.0806880.9121
A40.0532220.91580.0574790.9531
A50.0549870.97360.0979540.9131
Table 6. Evaluation metrics for predicting upper extremity joint recognition angle signals by multi-information combination and LSTM.
Elbow JointShoulder Joint
RMSER2RMSER2
A10.0932810.89370.1309810.8996
A20.1174740.88180.1905030.9108
A30.0184230.87640.1098610.9213
A40.1013050.91770.1236090.8956
A50.0873910.91160.0728560.8981
Table 7. Evaluation metrics for predicting upper extremity joint recognition angle signals by single sEMG information and COANN.
Elbow JointShoulder Joint
RMSER2RMSER2
A10.0052890.99370.0130980.9961
A20.0107470.98180.0050390.9308
A30.0180420.97640.0198680.9213
A40.0071300.93770.0136090.9725
A50.0173910.99160.0072850.9981
Disclaimer/Publisher’s Note: The statements, opinions and data contained in all publications are solely those of the individual author(s) and contributor(s) and not of MDPI and/or the editor(s). MDPI and/or the editor(s) disclaim responsibility for any injury to people or property resulting from any ideas, methods, instructions or products referred to in the content.

