Article

An Investigation of the Promotion of the Aerodynamic Performance of a Supersonic Compressor Cascade Using a Local Negative-Curvature Ramp

1
School of Mechanical Engineering, Chaohu University, Hefei 238024, China
2
School of Aeronautics and Astronautics, Beihang University, Beijing 100191, China
3
College of Energy Storage Technology, Shandong University of Science and Technology, Qingdao 256601, China
4
Institute of Engineering Thermophysics, Chinese Academy of Sciences, Beijing 100190, China
*
Author to whom correspondence should be addressed.
Appl. Sci. 2025, 15(10), 5664; https://doi.org/10.3390/app15105664
Submission received: 8 April 2025 / Revised: 8 May 2025 / Accepted: 13 May 2025 / Published: 19 May 2025

Abstract

:
Shockwaves induce considerable flow separation loss; it is essential to reduce this using the flow control method. In this manuscript, a method for suppressing flow separation in turbomachinery through a constant adverse-pressure gradient was investigated. The first-passage shock was split into a compression wave system of the vane suction surface. The aim of this was to reduce loss from shockwave/boundary layer interactions (SWBLIs). This method promotes the performance parameters of the supersonic compressor cascade. The investigation targets were a baseline cascade and the improved system. Both cascades were numerically studied with the aid of the Reynolds-averaged Navier–Stokes (RANS) method. The simulation results of the baseline cascade were also validated through experimentation, and a further physical flow analysis of the two cascades was conducted. The results show that the first-passage shockwave was a foot above the initial suction surface, with a weaker incident shock along with a clustering of the compression wave corresponding to the modified cascade. It was also concluded that the first-passage shockwave foot of the baseline cascade was replaced with a weak incident shock, and a series of compression waves emanated from the adopted negative-curvature profile. The shock-induced boundary layer separation bubble disappeared, and much smaller boundary layer shape factors over the SWBLI region were obtained for the improved cascade compared to the baseline cascade. This improvement led to a high level of stability in the boundary layer state. Sensitivity analyses were performed through different simulations on both cascades, unveiling that the loss in total pressure was lower in the case of the updated cascade as compared to the baseline.

1. Introduction

Aero-propulsion systems emphasize a higher thrust-to-weight ratio along with durability. The key parts are the compressor and fan. The higher thrust emphasizes the change in flow from subsonic to transonic and then to supersonic. The increment in relative speed archives the aerodynamic penalties along with the generation of shockwaves. The main separation is induced by the strong shockwave/boundary layer interaction (SWBLI) inside the vane passages [1,2]. It has been confirmed that about 30% of the total pressure loss comes directly from SWBLId [3,4] since the aerodynamic performance of high-payload compressor vanes is dependent on the flow around the vanes and the overall configuration of the shock system. Thus, the supersonic cascade passage has a significant influence on aerodynamic performance. This influence is regarded as the viscous loss of the SWBLI. Therefore, it is necessary to suppress the boundary layer separation induced by the shock foot along with the pressurization of the strong shock system in the supersonic compressor cascade [5,6].
The loss of a shock-induced flow separation depends on the Mach number of the inflow and the local curvature of the vane surface [7,8,9]. The concave–convex curvature is closely related to the boundary layer structure [10,11]. The change in wall curvature can alter the growth and rupture of flow vortices within the boundary layer, affecting the stability of the boundary layer [12,13,14]. Suppressing shock-induced boundary layer separation losses through local blade curvature changes is the most suitable method. The curvature variation of a body surface is important in the interaction of a shockwave and a boundary layer along with the alteration in the streamwise pressure profile. It has been observed that variation in a local surface curvature close to the shock impingement position provides potential revenues for the reduction in shock-induced flow separations. A type of structure called a shock control bump (SCB) has been found to obtain global aerodynamic gains from local vane surface curvature modifications, which first emerged in the late 1970s as a local humped profile of a transonic wing aerofoil to mitigate high-shock strength and wing drag [15]. In general, there exist three groups of SCB in its applications. The first one mainly focuses on transonic and supercritical wings with a beneficial smearing effect on the near-normal shockwave close to the wing surface. A suitable SCB structure would be employed to transform an original single stronger shock on the baseline suction surface to a set of weaker (oblique) shocks or compression wave systems on the modified suction surface. This would subsequently lead to a lower loss of stagnation pressure gained for a greater decrease in wave drag [16,17]. In previous studies, a series of optimization design techniques have been adopted to provide 2D and 3D SCB profiles to improve their performances [18,19,20]. Furthermore, researchers have balanced the comprehensive performance of design points and variable operating conditions through adjoint optimization and numerical optimization methods [21,22,23]. The second group of SCB applications, first reported in 2005, are concentrated on a supersonic/hypersonic mixed intake. The last single normal shock can be transitioned to a λ-shock structure with local flow deflection by a 3D SCB structure. The concept of a deformable 2D bump was introduced in the design of a hypersonic inlet with the formation of an adaptive curvature of a local passage wall to suppress the area of shock-induced flow separations and widen the range of the Mach number. A comparison of experiments and computations showed that shock-induced flow separation was suppressed with a precompression effect on the windward section of a bump with a height 0.33 times that of the local boundary layer thickness [24,25]. The third group of SCB applications, first reported in 2015, concerns transonic compressors in turbomachinery. The suction side of a modified linear cascade with a 2D SCB geometry was designed via the Hicks–Henne function to promote both design and off-design aerodynamic performance [26,27]. The baseline came from a NASA Rotor 67 vane aerofoil at the given radial position (mid-span). A kind of S-shaped vane was optimized with a suitable 3D SCB structure in the transonic compressor/fan rotor design to control the shock-induced separations. It was proven in a numeral simulation that the position of a flow separation on the vane suction surface is pushed downstream along with the decrement in radial flow in vane rows [28,29,30,31].
The reduction in the flow loss of SCBs can be attributed to a reduction in both Mach numbers and adverse-pressure gradients before the shock foot via a precompression effect on the local negative-curvature profile. This can be marked as a criterion with relatively small modifications to the baseline, achieving global gains. The advantage of optimization in the design of a local profile has been widely explored and utilized within the supersonic regions. However, some investigators have turned their attention to the negative issues in the optimization of the local negative-curvature profile in turbomachinery with an increase in inlet Mach numbers. In reference to flow physics, the local negative-curvature profile would be important to the distribution of the adverse-pressure gradient before the shock impingement point, implying the least loss from the shock-induced separation.
In this work, the Mach number for the supersonic compressor cascade is studied up to a value of 1.75. A detailed design approach to obtain an optimized negative-curvature profile with a constant adverse pressure before the first-passage shock incident position is proposed in this paper. The mechanisms for the control loss of SWBLIs with the negative-curvature profile are investigated in detail. The characteristics of the flow field inside the vane rows are obtained from numerical simulation through comparison and analyses of both results of the baseline and improved supersonic compressor cascades.

2. Geometric Model

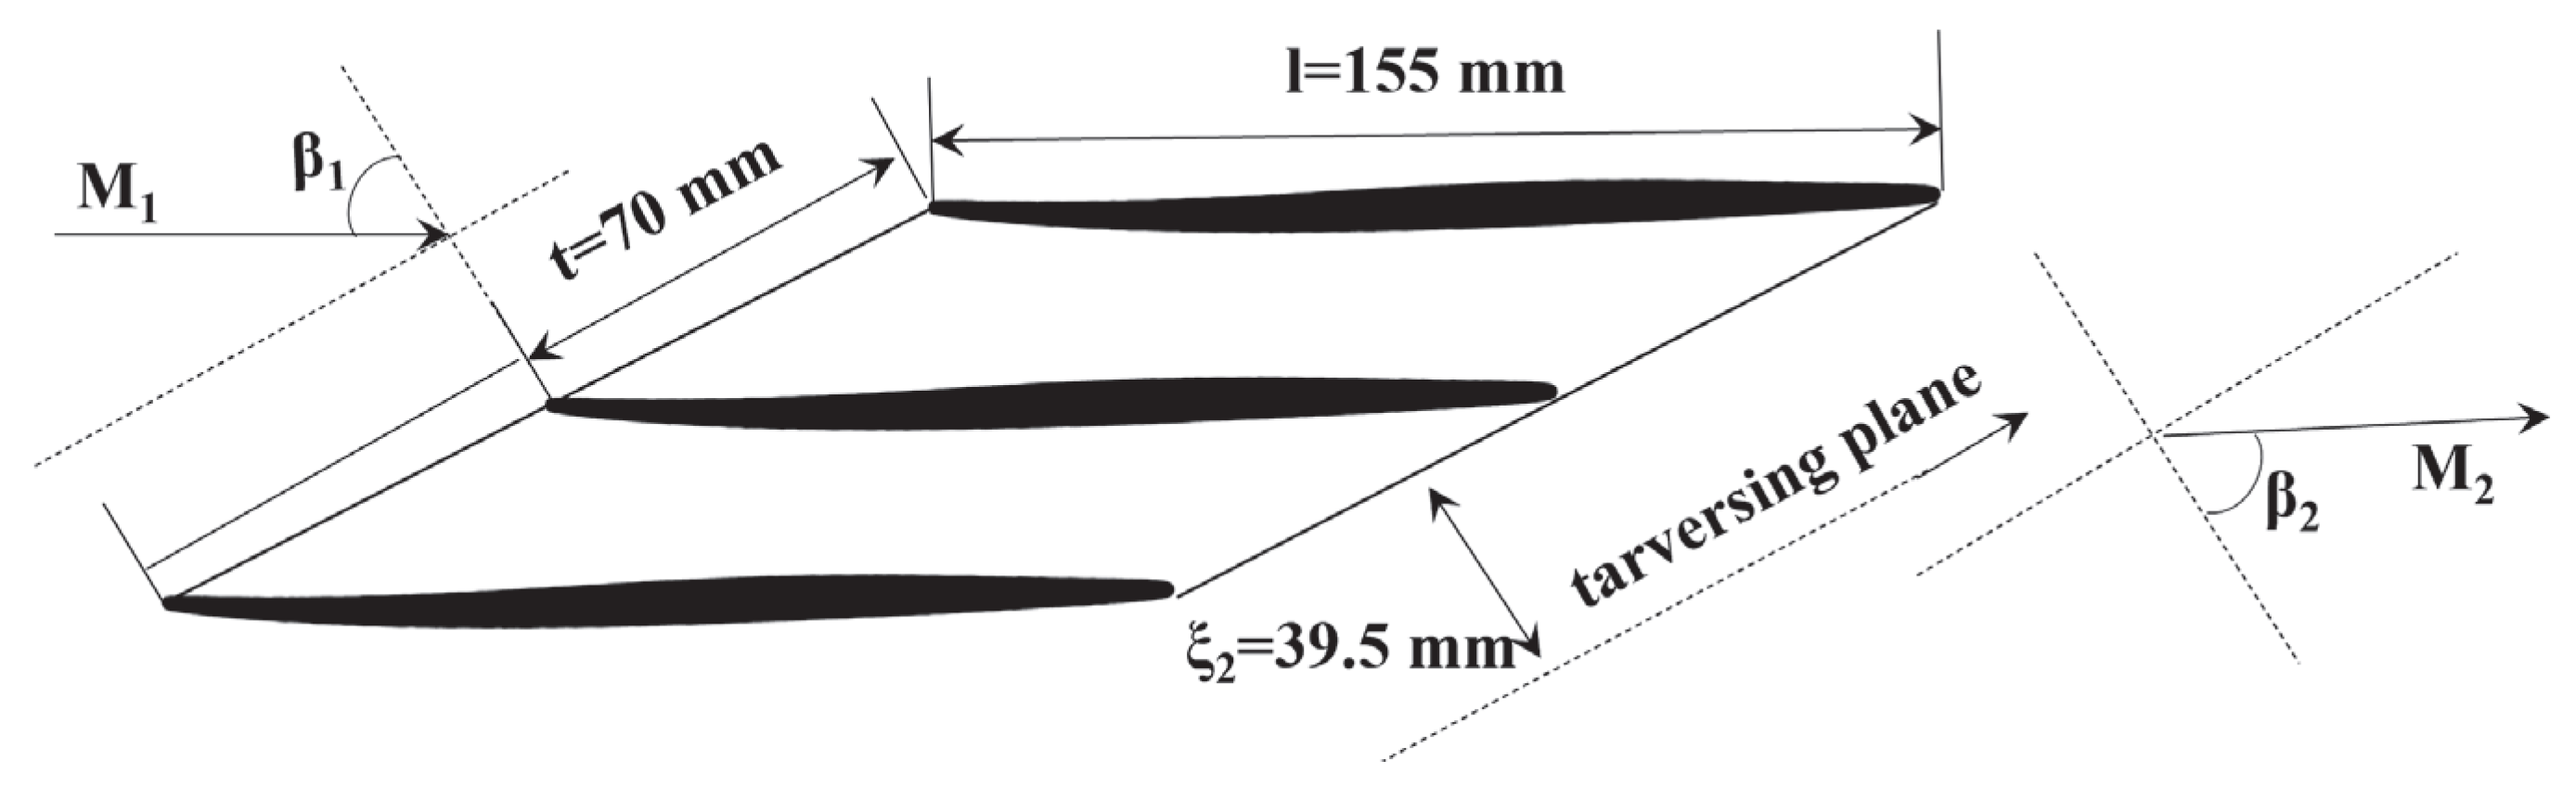
2.1. Baseline Supersonic Compressor Cascade

The baseline supersonic compressor cascade was designed for an inlet Mach number of 1.75 with a subsonic axial flow component and a smaller flow turning angle. The design and maximum static pressure ratios were 2.75 and 2.93, respectively. To obtain a cascade with lower aerodynamic loss, the negative camber angle is employed at the leading edge to reduce the Mach numbers of the main flow region at the passage entrance through the precompression effect. In addition, a flow with negative deflection between the inlet and outlet planes of supersonic compressor cascades was also generated to suppress the turbulent boundary layer separations caused by the last normal passage shock. The key cascade geometric parameters are listed in Table 1, and the cascade geometry is shown in Figure 1.

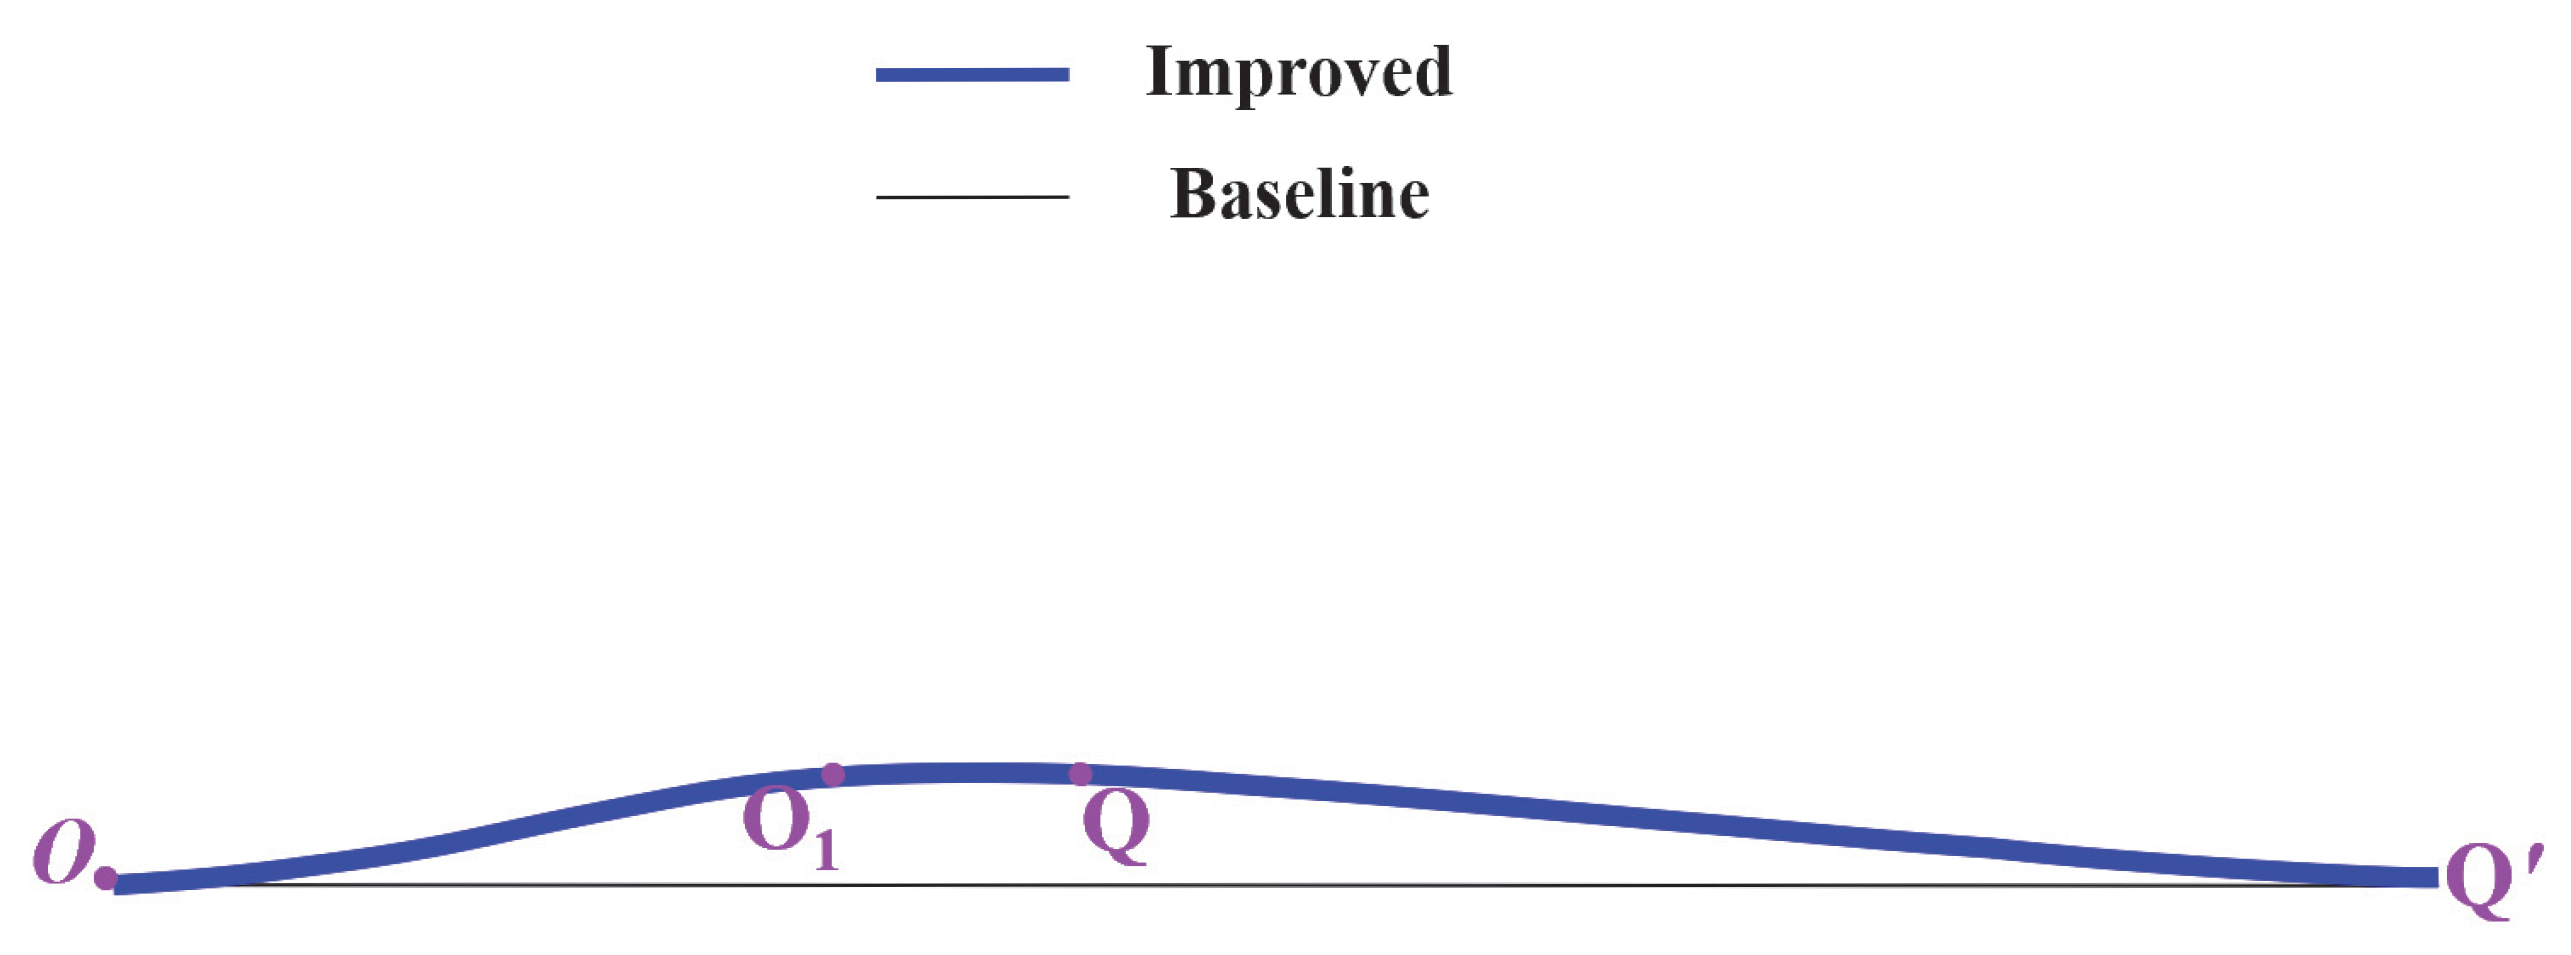
2.2. Modified Supersonic Compressor Cascade

The modified profile of supersonic compressor cascades was obtained by small revisions of the vane suction surface on the baseline profile. The position and area of the geometric throat remained the same during modifications to the vane suction surface. A schematic diagram of the interference between shockwave and boundary layer is shown in Figure 2. Due to the strong shockwave in the first channel, the separation bubble and Mach stem structure are generated at the incident position. Part a is the windward side of the bulge of the boundary layer, which induces the generation of compression waves. Part b is the convex part, generating expansion waves. The aerodynamic profile of Part c is concave, which produces recompression waves. According to the change in boundary layer curve, the wall curve in this region is locally improved, as shown in Figure 3. The starting position of the negative-curvature slope of the improved blade cascade is the position where the shockwave induces an increase in wall pressure, namely, point O. The length is the upstream influence range of shockwave and boundary layer interference, as shown in OO1. O1Q is the plateau zone, and QQ′ is the leeward zone. The positions of these four points, O, O1, Q, and Q′, are marked in purple in Figure 3. Moreover, the joint connections with the regions OO1, O1Q, and QQ′ should be smoother. In supersonic operation, it was observed that a series of compression waves extended from the negative-curvature concave surface in the cascade channels, which considerably weakened the shock foot through a decrement in the pre-shock Mach number. It was observed that the air velocity at the plateau region O1Q accelerated through expansion waves and then recompressed at the leeward region QQ′. The boundary layer separation can be ascribed to the fact that the flow momentum inside the boundary layer does not suffer from the adverse-pressure gradient induced by the shockwaves [31]. Thus, a negative-curvature profile with a moderate adverse-pressure gradient was designed to mitigate flow separation at the designed inlet condition. The details of the design can be seen in Figure 4.
The length of the negative-curvature profile is a and acts as the upstream influence length (the distance between the starting point of pressure rise and the shock foot in the inviscid flow model); the height at point O′ is 35% of the boundary layer displacement thickness at point O. Without considering the viscous effect, the pressure distribution of the negative-curvature profile is assumed to have a constant adverse-pressure gradient. Equation (1) is the constant adverse-pressure gradient distribution equation:
p = k x x 0 + p x 0
where parameter k stands for the constant adverse-pressure gradient. Based on the pressure at the initial position, the pressure distribution of the wall curve is obtained using the linear equation of the constant adverse-pressure gradient. According to the pressure distribution with an isentropic flow relationship, the Mach number distributions along the negative-curvature profile can be obtained as
p p x 0 = 1 + γ 1 2 M x 0 2 1 + γ 1 2 M 2 γ γ 1 ,
M 2 = 1 + γ 1 2 M x 0 2 k x x 0 + p x 0 p x 0 γ 1 γ 1 2 γ 1 .
Combined with shockwave theory and Prandtl–Meyer functions, the relationship between Mach number and flow deflection angle can be described as follows:
θ = θ x 0 + ν M x 0 ν M ,
ν M = γ + 1 γ 1 arctan γ 1 γ + 1 M 2 1 arctan M 2 1 .
where ν is the expansion angle. Furthermore, using trigonometric relations and integral relations, the negative-curvature profile can be obtained as
tan θ = f x θ = tan 1 f x ,
f x = f x .
Equation (7) is an integral equation which obtains the curve distribution by integrating the slope of the wall curve.
Finally, on the concave curved compression surface, the correction on the boundary layer displacement thickness is adopted as
δ x = A x + B x e x ,
where the parameters A and B are boundary layer displacement and thickness coefficients, respectively. The boundary correction is taken at the inlet of the cascade, and the simulation results show a good agreement with the experimental results [32]. The negative-curvature wall profile with a constant adverse pressure gradient is achieved through the iterative method, as shown in Figure 5. In this figure, quantity k is the objective to be computed iteratively and its initial value is set to 1. The geometric distribution of the wall is obtained from shock theory and Prandtl–Meyer functions. Finally, the profile equation for the ramp is derived through integration. Since point O′ belongs to the tail of the ramp section, quantity k′ is calculated according to the coordinates. Iterative calculation continues until the deviation between k and k′ is less than 10−6, and then quantity k is output. The negative-curvature design parameters are listed in Table 2. In addition, the plateau section and leeward region are described as being constructed linearly [23], and three sections are smoothed with the fourth-order spline curve.

3. Experimental Facility and Numerical Validation

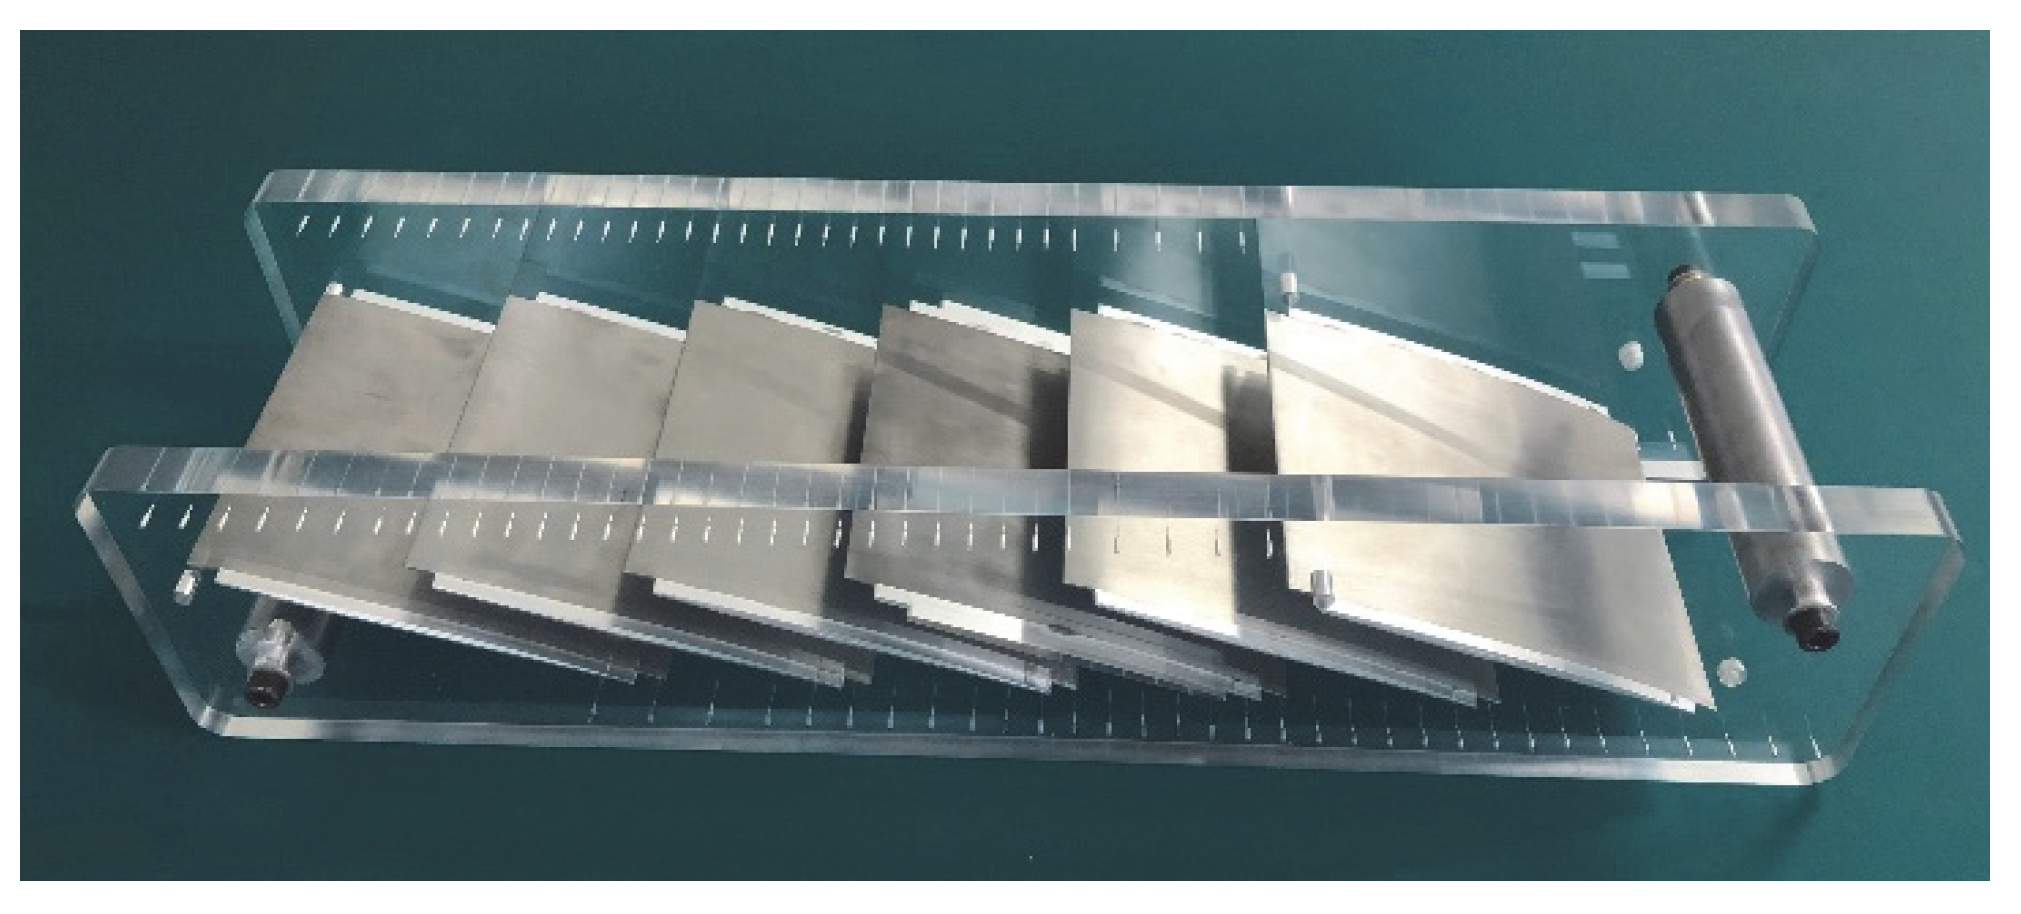
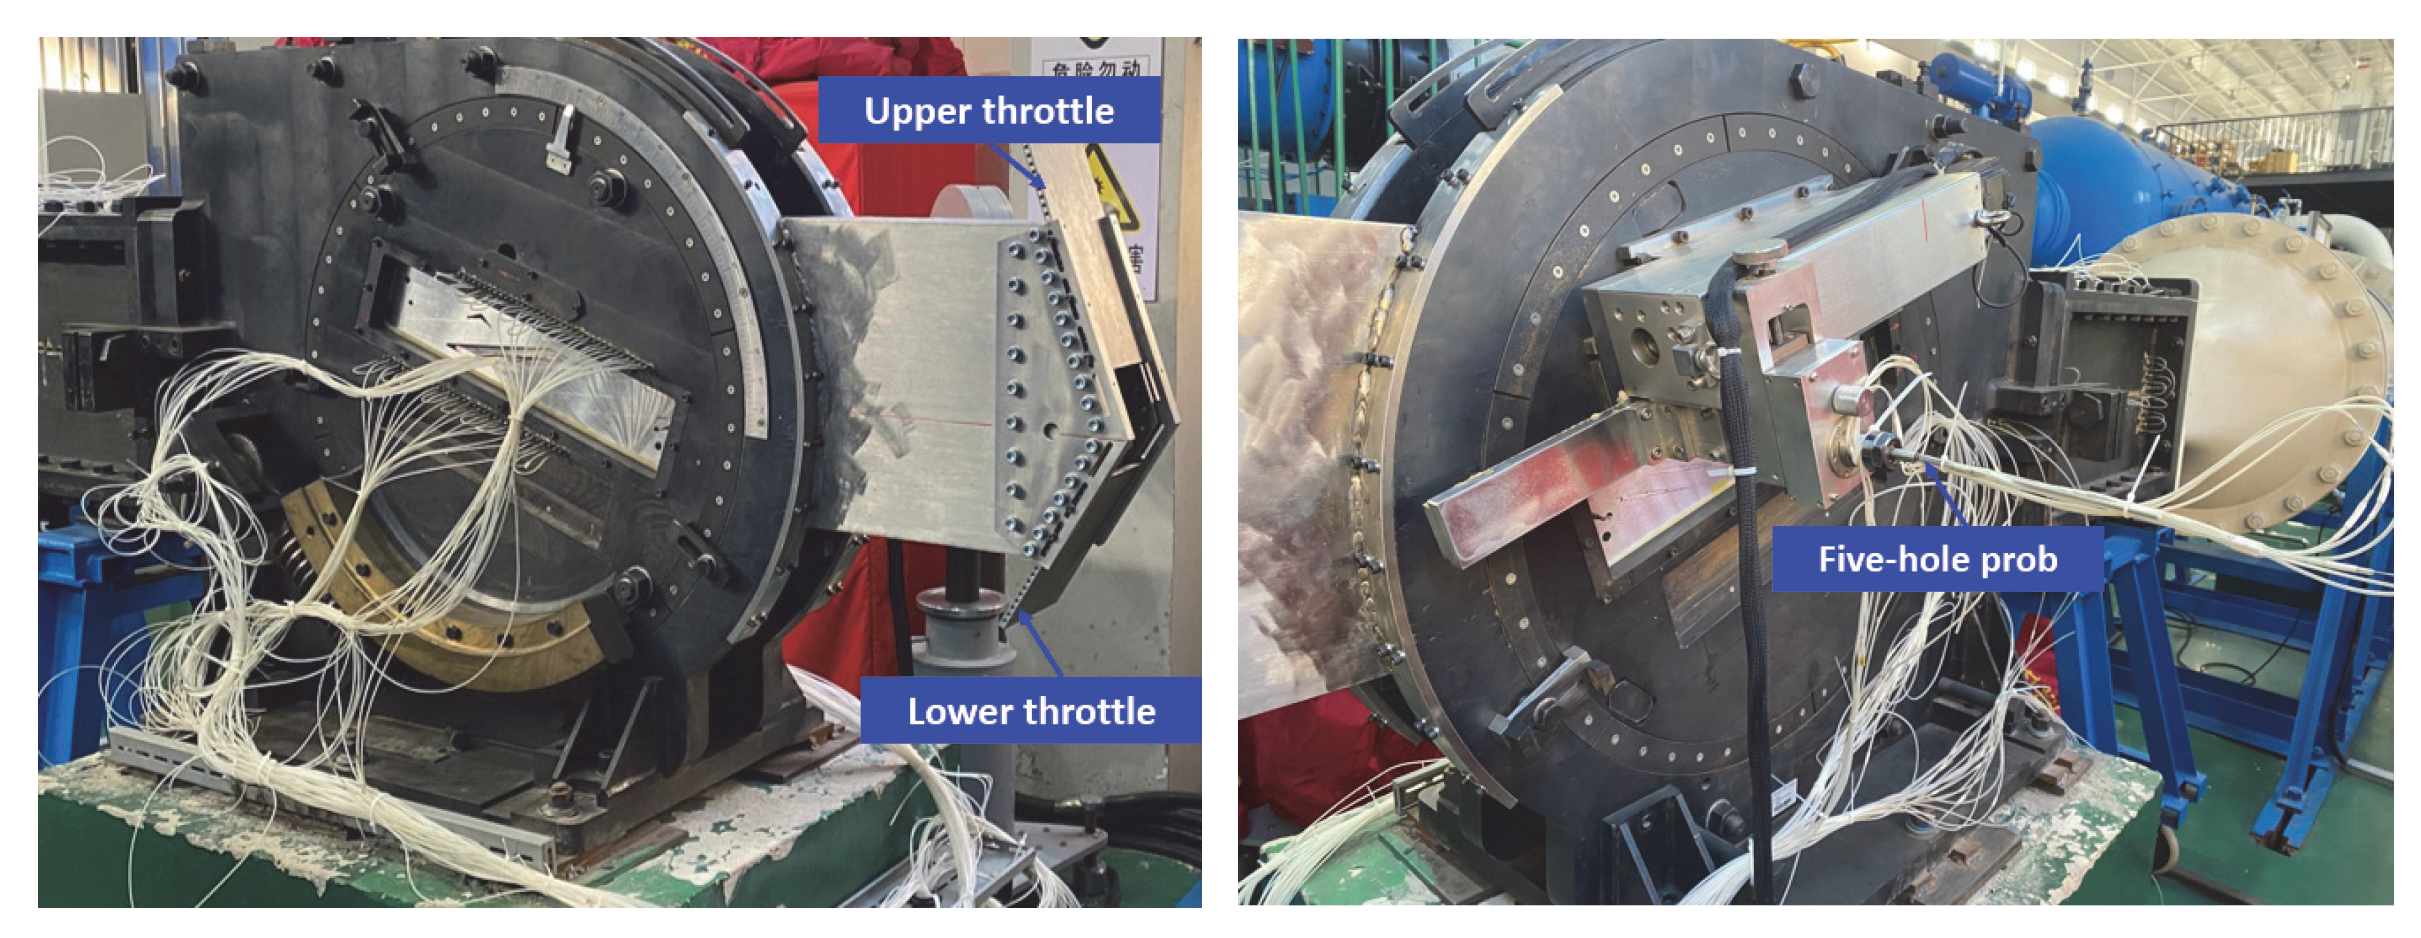
3.1. Experimental Facility

The supersonic cascade wind tunnel is an intermittent facility at the Innovation Academy for Light-Duty Gas Turbines of the Institute of Engineering Thermophysics, Chinese Academy of Sciences (IET), with traditional schlieren apparatus and pressure systems incorporated (PSI). This tunnel is driven by dry air from three tanks with a total of 120 m3 storage through a series of solid converging–diverging nozzles, which provides supersonic flow at 1.5 Mach to 2.5 Mach with an interval of 0.25 Mach. At inlet Mach number 1.75, the tunnel has a stable operating time of more than 50 s for aerodynamic measurements. Four pressure taps and several temperature sensors are installed at the inlet of the nozzle to achieve total pressure and total temperature. Wall static-pressure probes are installed at the nozzle outlet region, cascade inlet region, and outlet region. The maximum measured error of the inlet deviation angle, total pressure, static pressure, and total temperature is less than ±0.5°, 0.3%, 0.2%, and 1%, respectively. A five-hole probe for the supersonic range is placed downstream from the cascade trailing edge traversing along the outlet plane. This five-hole probe is driven by a stepping motor and is controlled by LabVIEW data acquisition procedures. The error range for the five-hole probe is about ±1%, and the accuracy of the stepping motor is ±0.01 mm. The data from the pressure probes are collected by PSI electronic pressure scanners (This PSI electronic pressure scanner was purchased from Mexico, USA, and produced by Pressure Systems International, San Antonio, TX, USA). The employed model is PSI9816, with a sensor measurement accuracy of 0.05%. This tunnel is equipped with a set of CQW300 schlieren apparatus (The CQW300 was purchased from Sichuan, China and produced by Sichuan Wuke Optical Precision Machinery Co., Ltd., Mianyang, China), which is composed of a spherical primary mirror system, a light-source slit system, a knife-edge camera system, and a plane mirror system. It can be employed to visualize the shockwave structure inside the internal channels of the tested cascade. For a supersonic compressor cascade with an inlet Mach number of 1.75, the tunnel operates at a total pressure of 270 kPa and a total temperature of 320 K. The Reynolds number based on the vane chord is about 7.54 × 10⁶ at a Mach number of 1.75. The height and width of the flow channel inside its test section are 200 mm and 130 mm, respectively.
The baseline cascade test modules are composed of two sets for different test purposes, each of which consists of six vanes with a 150 mm chord. One of the sets has a pair of transparent plexiglass plates for schlieren visualization, as shown in Figure 6. Another set has steel plates to fix one or two drilled vanes with taps on both suction and pressure surfaces and other vanes for the static pressure values on both surfaces, as shown in Figure 7. A pair of adjustable straight plates are hinged at the end of the upper and lower plenum chamber for the adjustment of the upper and lower spillage passage flow, which are at 5 deg and 3 deg, respectively, in design conditions. The upper and lower tailboards are installed at the trailing edges of the uppermost and lowest vanes with cylindrical pins, which are fitted to provide back-pressure adjustment for the cascade exit flow by regulating the passage area between the two tailboards. To obtain the inlet flow conditions, static pressure taps are located along a line at a distance of 26.5 mm (50% of the axial chord length) axially upstream of the inlet plane. The downstream aerodynamic parameters of static pressure, total pressure, exit Mach number, and lag angle are obtained at the midspan by traversing a combination probe located at 39.5 mm (ξ2/lax = 0.75) downstream from the cascade exit plane. The adjacent vanes of the third vane (the second and fourth) constitute two vane passages used to capture the pressure distribution on the vane surface.

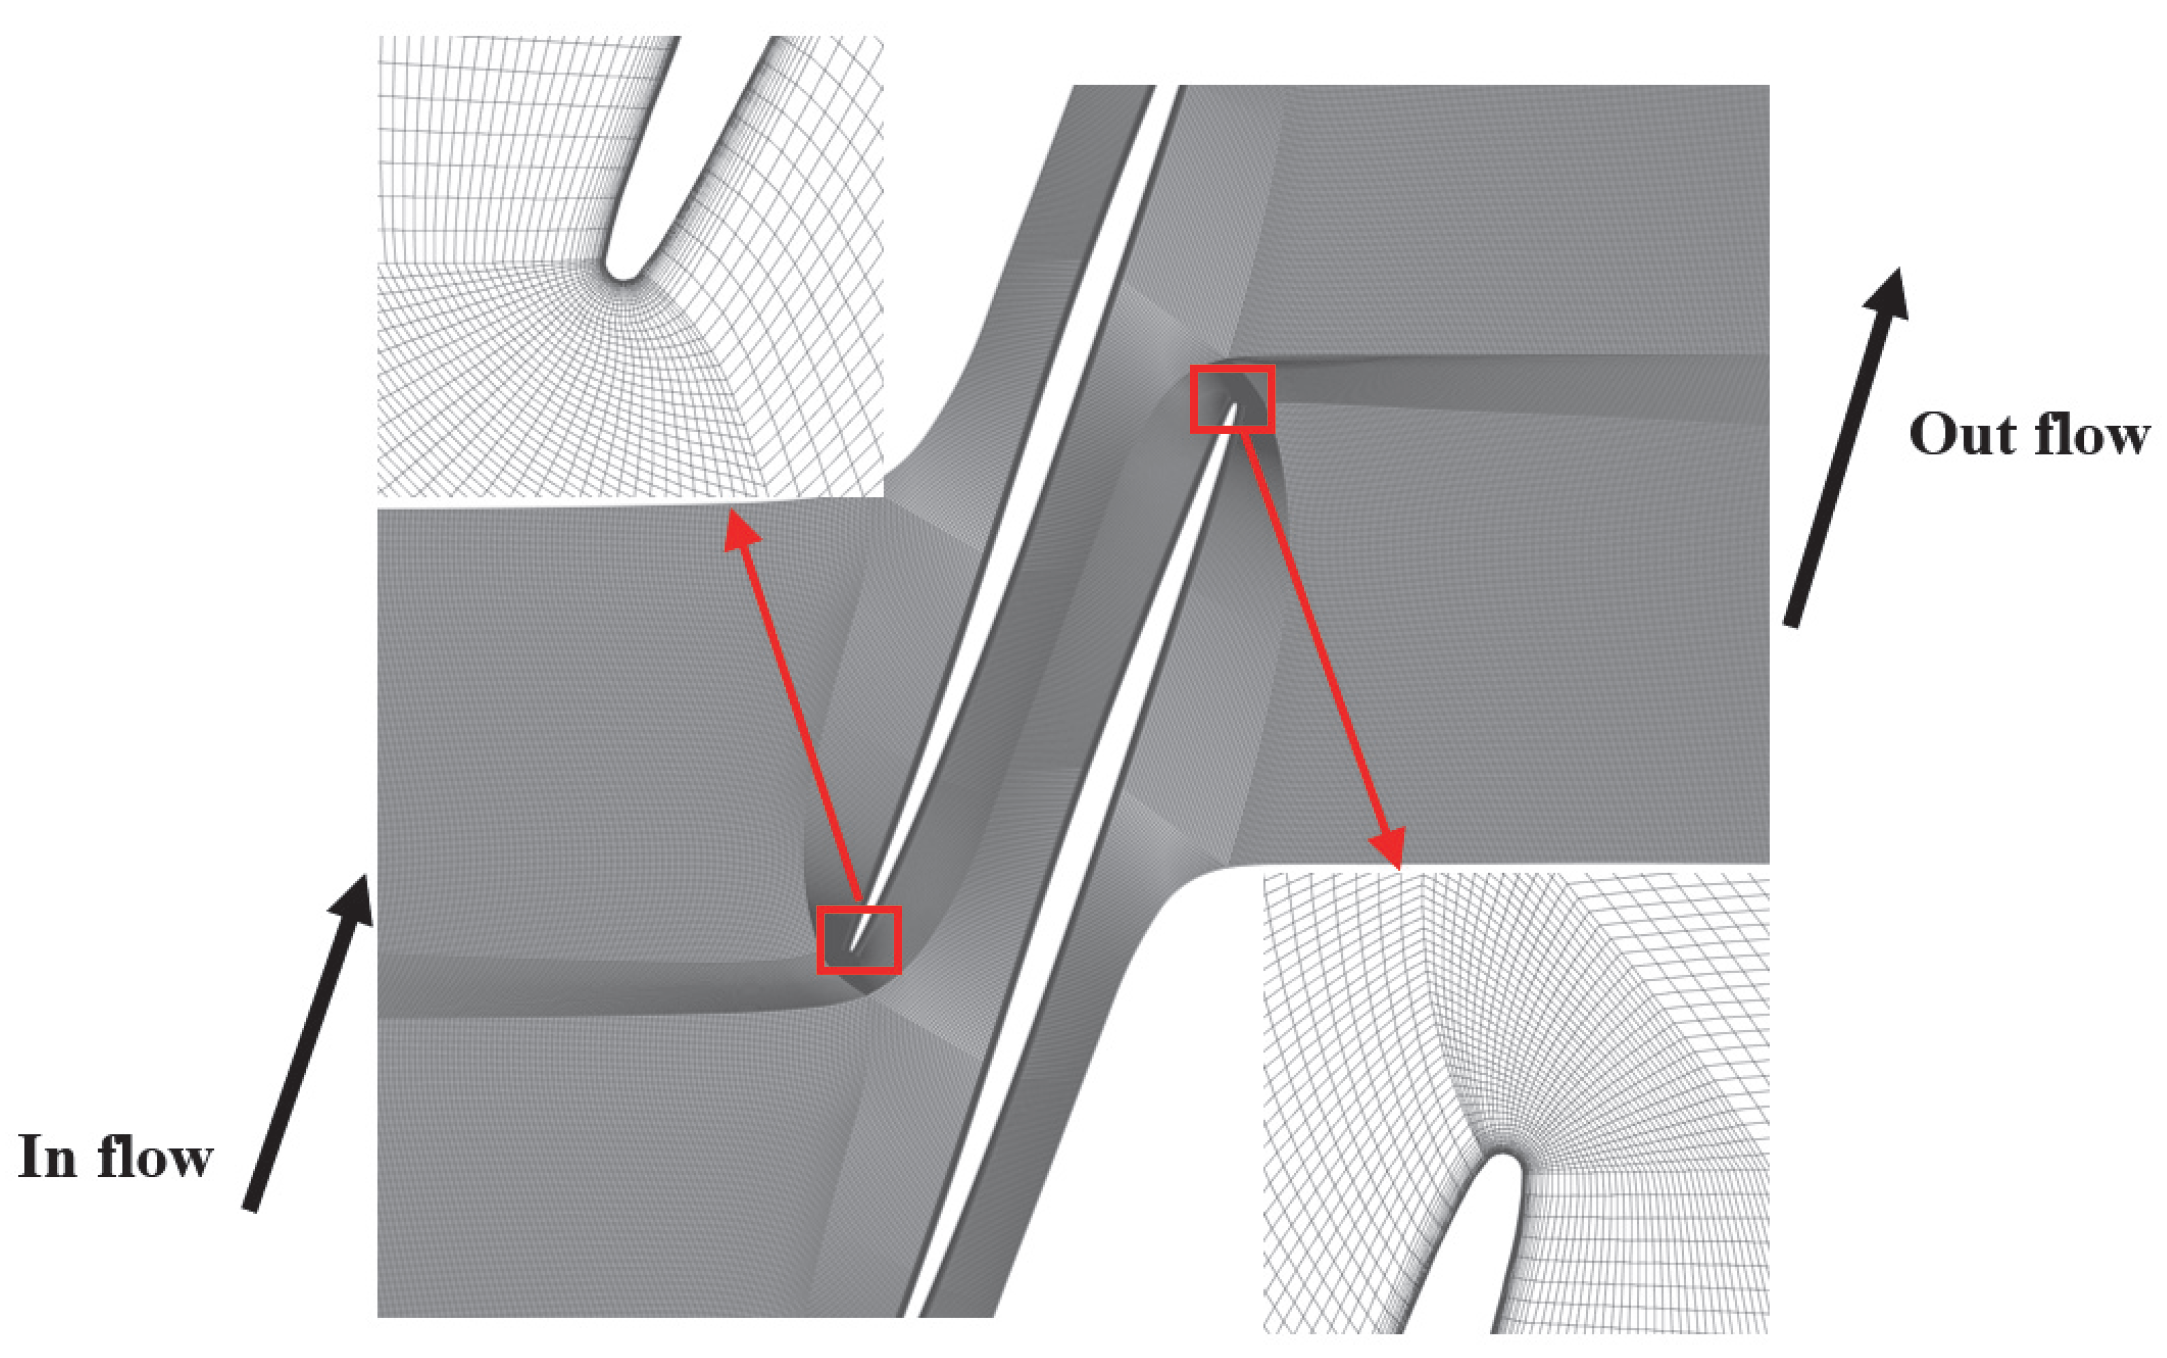
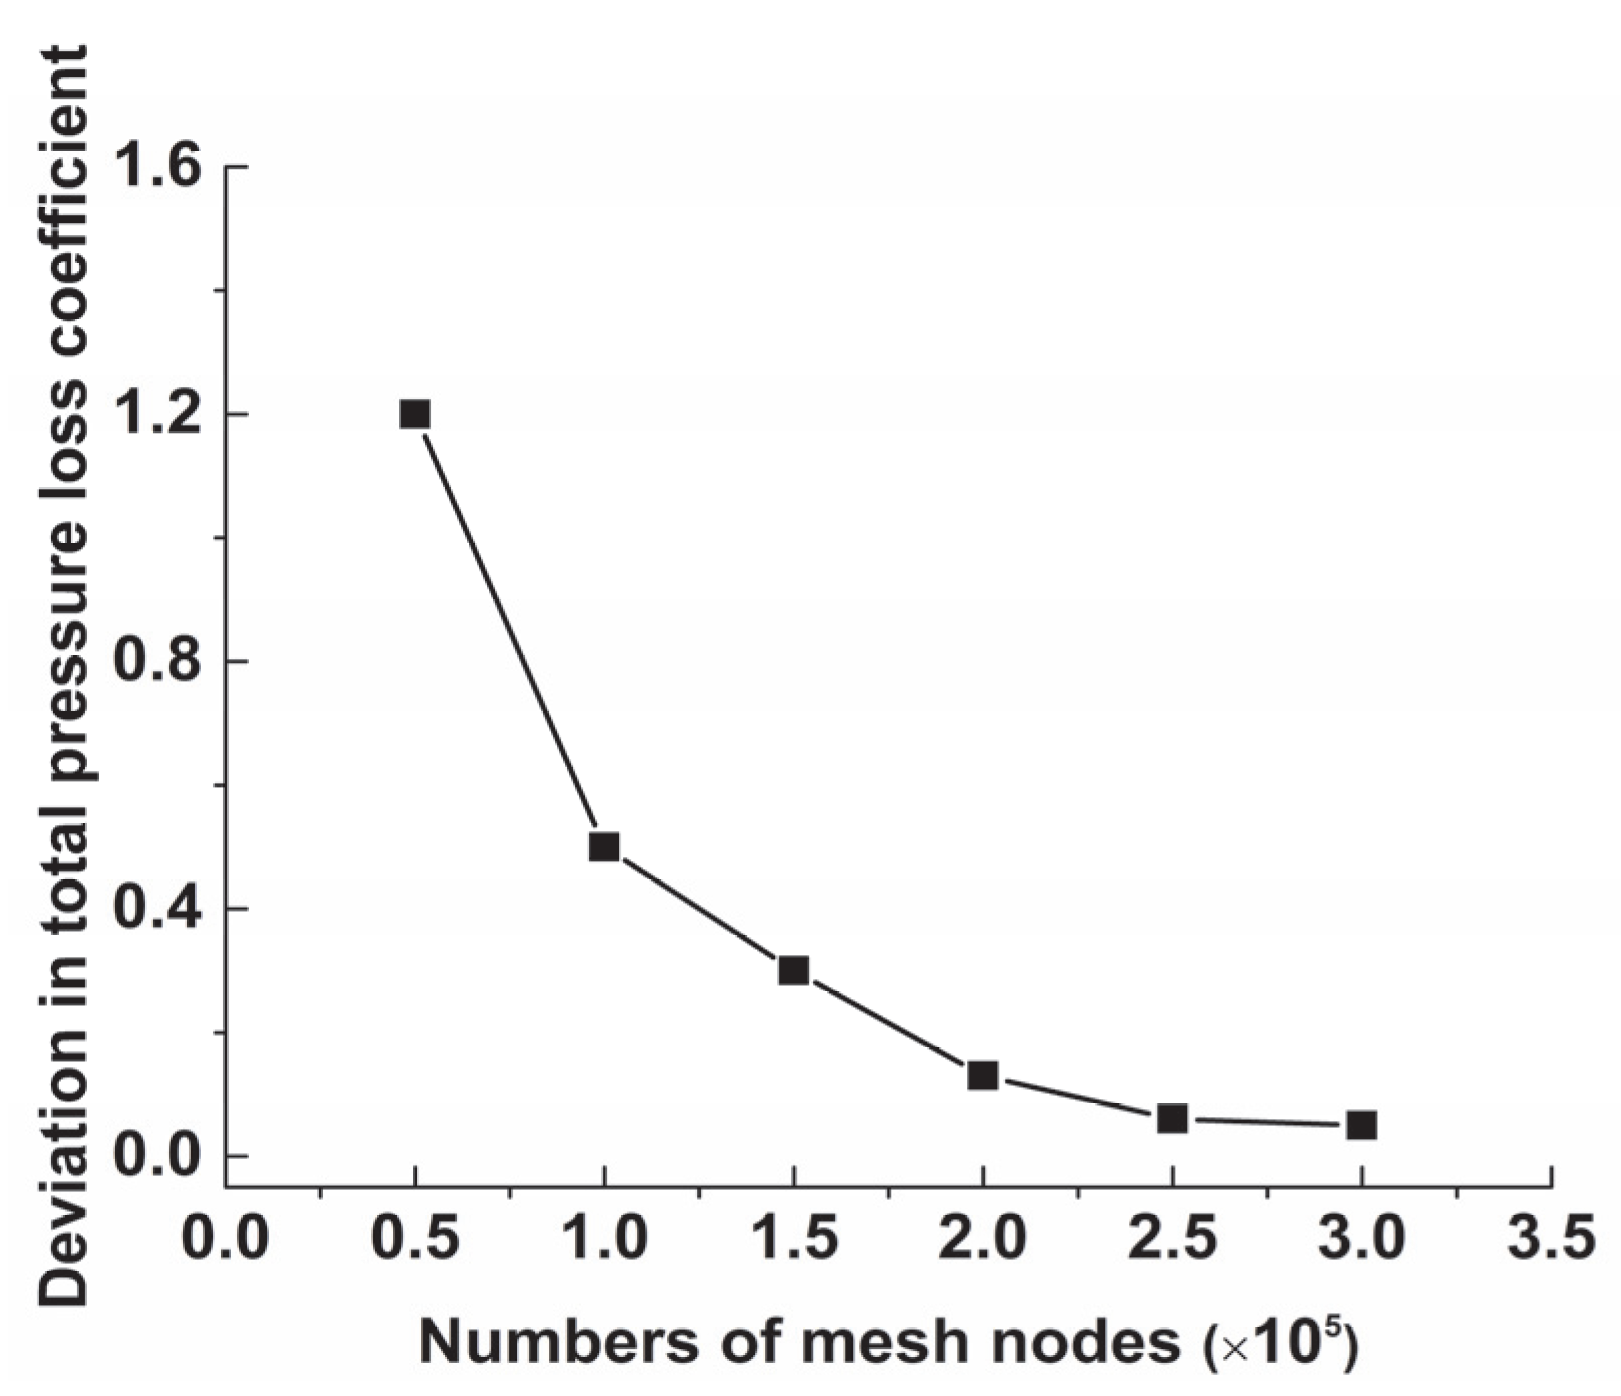
3.2. Numerical Calculation Method

Two-dimensional steady numerical simulations are performed on the supersonic compressor cascade with the commercial CFD software ANSYS FLUENT 2020 R1. The fluid is set as an ideal gas, and steady-state numerical simulations of the internal flow field of the supersonic compressor were carried out. The software employs the finite volume method to solve the compressible Reynolds-averaged Navier–Stokes (CRANS) equations. A fully implicit simulation solution strategy with an upwind difference scheme is adopted to set the solver, which can be accurately obtained through the boundary layer separation induced by the shock for transonic and supersonic flow [33,34,35]. Before the shockwave interacts with the boundary layer, it is believed that the boundary layer has transformed into a turbulent boundary layer. Acquaye and Kumar [36,37,38] evaluated and verified different turbulence models in ANSYS FLUENT. The SST(k–ω) turbulence model is more accurate in predicting the SWBLI flow field and is in good agreement with the experimental data. Hence, the SST(kω) model is adopted here for numerical simulation investigations. In order to improve the accuracy of the calculation results, the inlet and outlet positions of the calculation domain are 1.5 times the chord length from the leading edge and trailing edge of the cascade, respectively. The cascaded computational domain model consists of multiple blocks. The computed grid nodes generated by the commercial software ANSYS ICEM are shown in Figure 8. The O-block mesh topology type is employed around the vane with 30 grid nodes in the boundary layer, and H-blocks are adopted at the cascade leading edge and cascade trailing edge to guarantee the best grid quality. The first cell width close to the solid wall is less than 1 × 10⁻⁶ m to ensure that its value y+ < 1. The size and topology have been verified in the grid resolution study and valued to be sufficient. The boundary conditions are set as shown in Table 3. Total pressure, total temperature, and flow vector are given at the inlet in boundary conditions, which are consistent with the cascade experiment conditions. Static pressure is specified at the outlet. Nonslip and adiabatic conditions are defined for all solid walls.
The overall aerodynamic performance of supersonic compressor cascade is obtained by adjusting the back pressure at the exit plane. The convergence of the calculation result is judged by the residual of the control equation. Some residuals of key parameters such as the inlet and outlet flow, velocity, and pressure of the cascade are monitored. A convergent numerical calculation result can be considered to be obtained when the residual of these key parameters is less than 10−6. A laboratory server was used for numerical calculation; each workstation had 32 nodes and a 32 G memory. The calculation time for each example was about 12 h, and a converged result was obtained. In agreement with the most common methods for predicting the stall boundary of compressor cascades in numerical calculation, the stalling point of the compressor cascade was taken as the divergence point under a certain higher back pressure. Calculation convergence, which may take thousands of time steps, becomes more difficult with an increase in static pressure at the exit. The pressure increase is only 0.1% of the inlet pressure, near to the stalling point.
The verification of numerical methods is the key to evaluating the reliability and feasibility of numerical results. The validation of mesh independence is conducted via variations in the mesh nodes in the computational domain. According to Smirnov [39], computational errors accumulate faster for coarse grids. Therefore, the reliability of numerical results increases with an increase in grid resolution. The height of the first-layer mesh from the vane surface remains 1 × 10⁻⁶ m with mesh quantity variation. The relationship of global node quantities with the deviations in total pressure loss coefficient is described in Figure 9. It is found that the total pressure loss coefficient at the design point gradually decreases with the increase in grid node numbers. When the number of grids in the calculation domain reaches 2.5 × 10⁵, the numerical simulation results are essentially unchanged with the increase in the number of grids. For 2.0 × 10⁵ and 2.5 × 10⁵ nodes, the deviation in total pressure loss coefficient is 0.06%, which is less than 0.1%. It is concluded that 2.5 × 10⁵ grid nodes are capable for predicting the aerodynamic performance of supersonic compressor cascades.

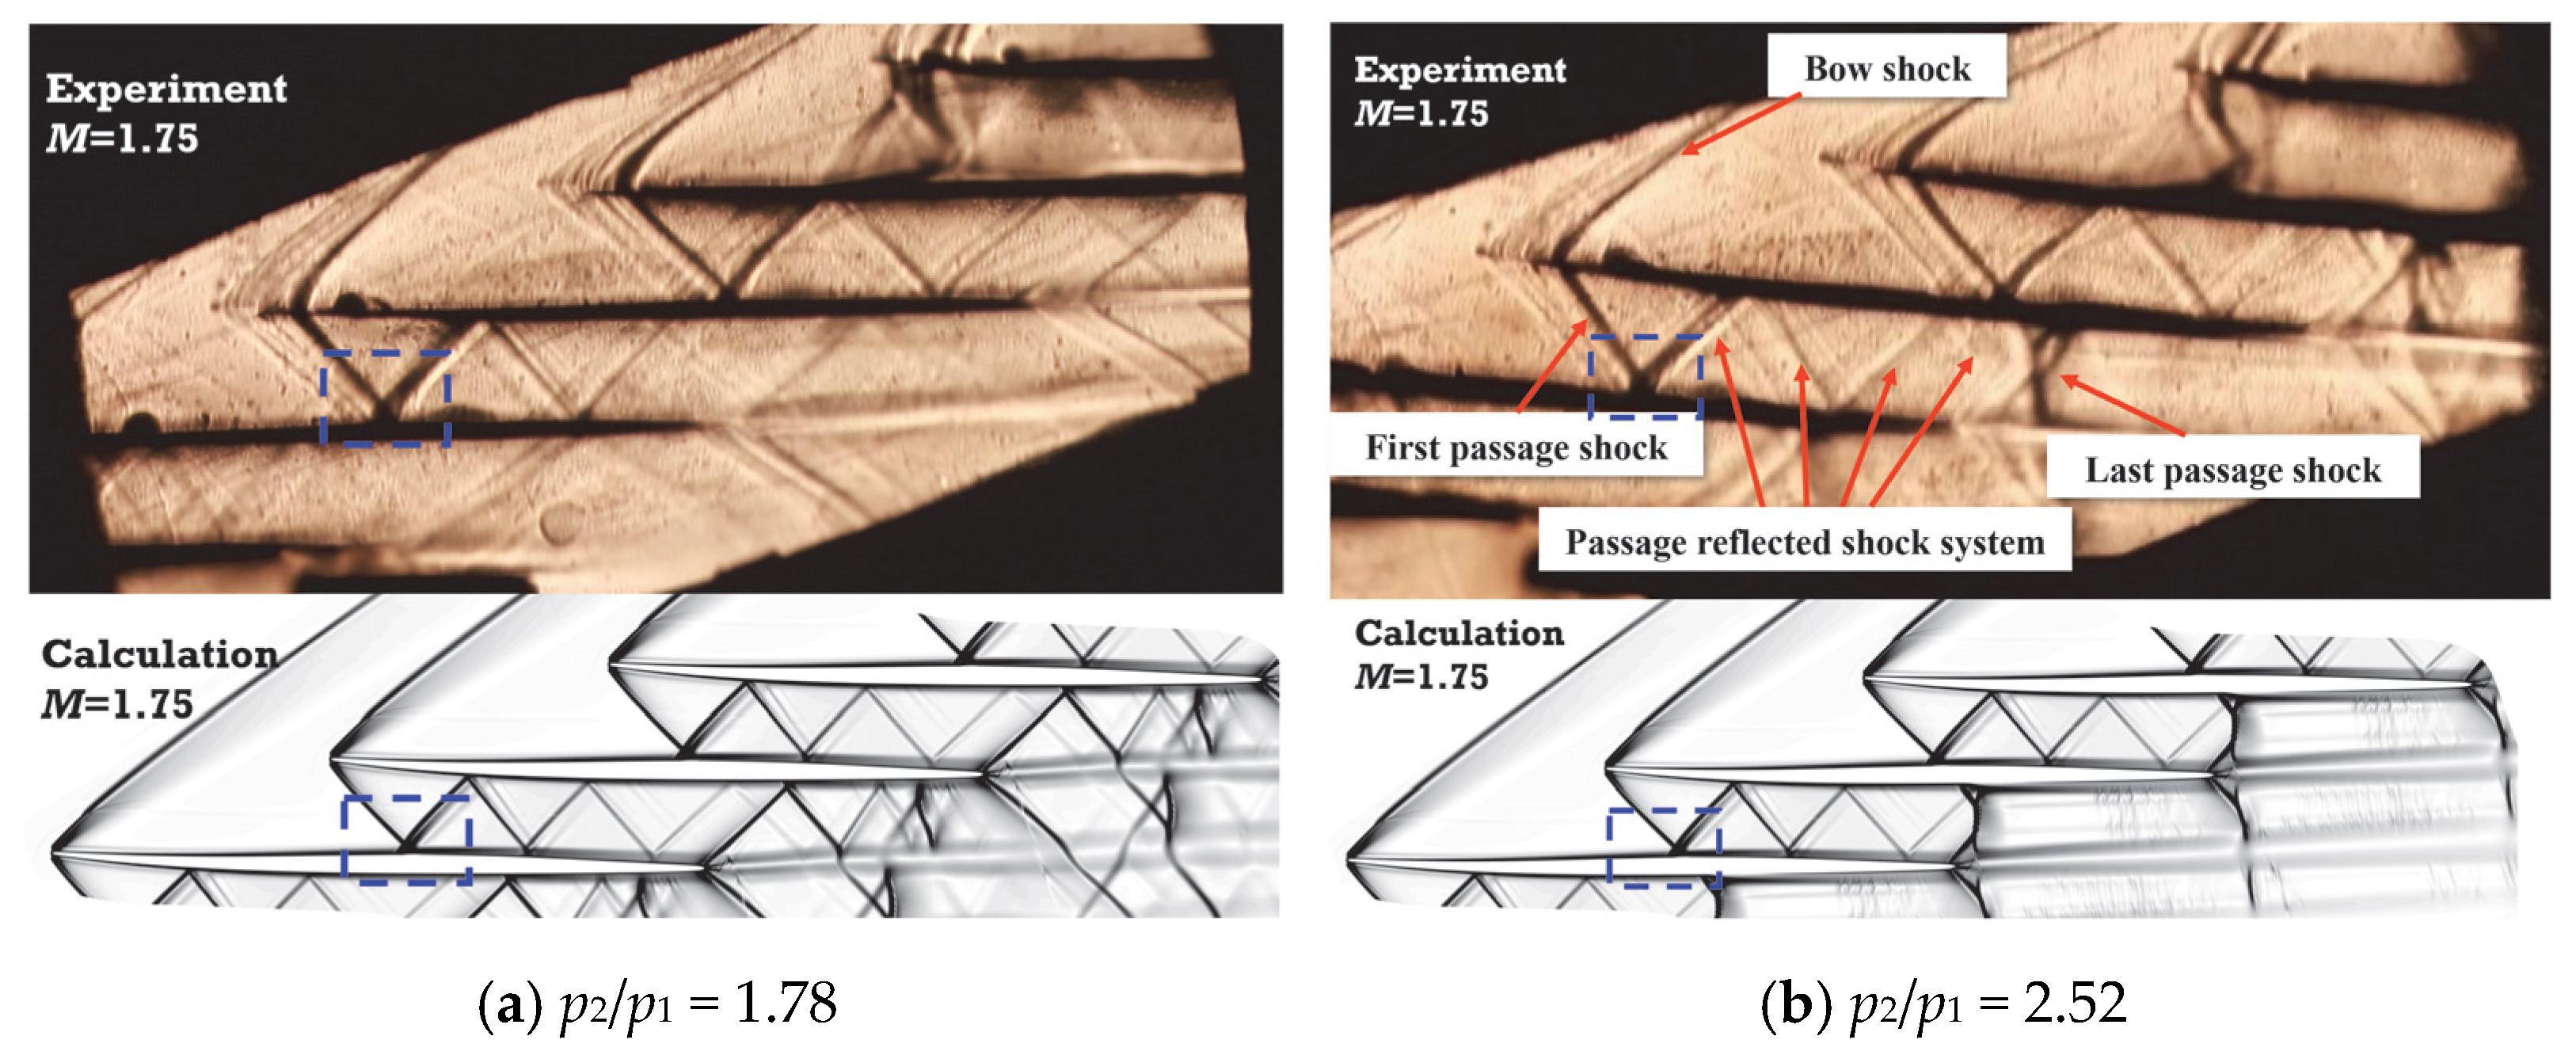
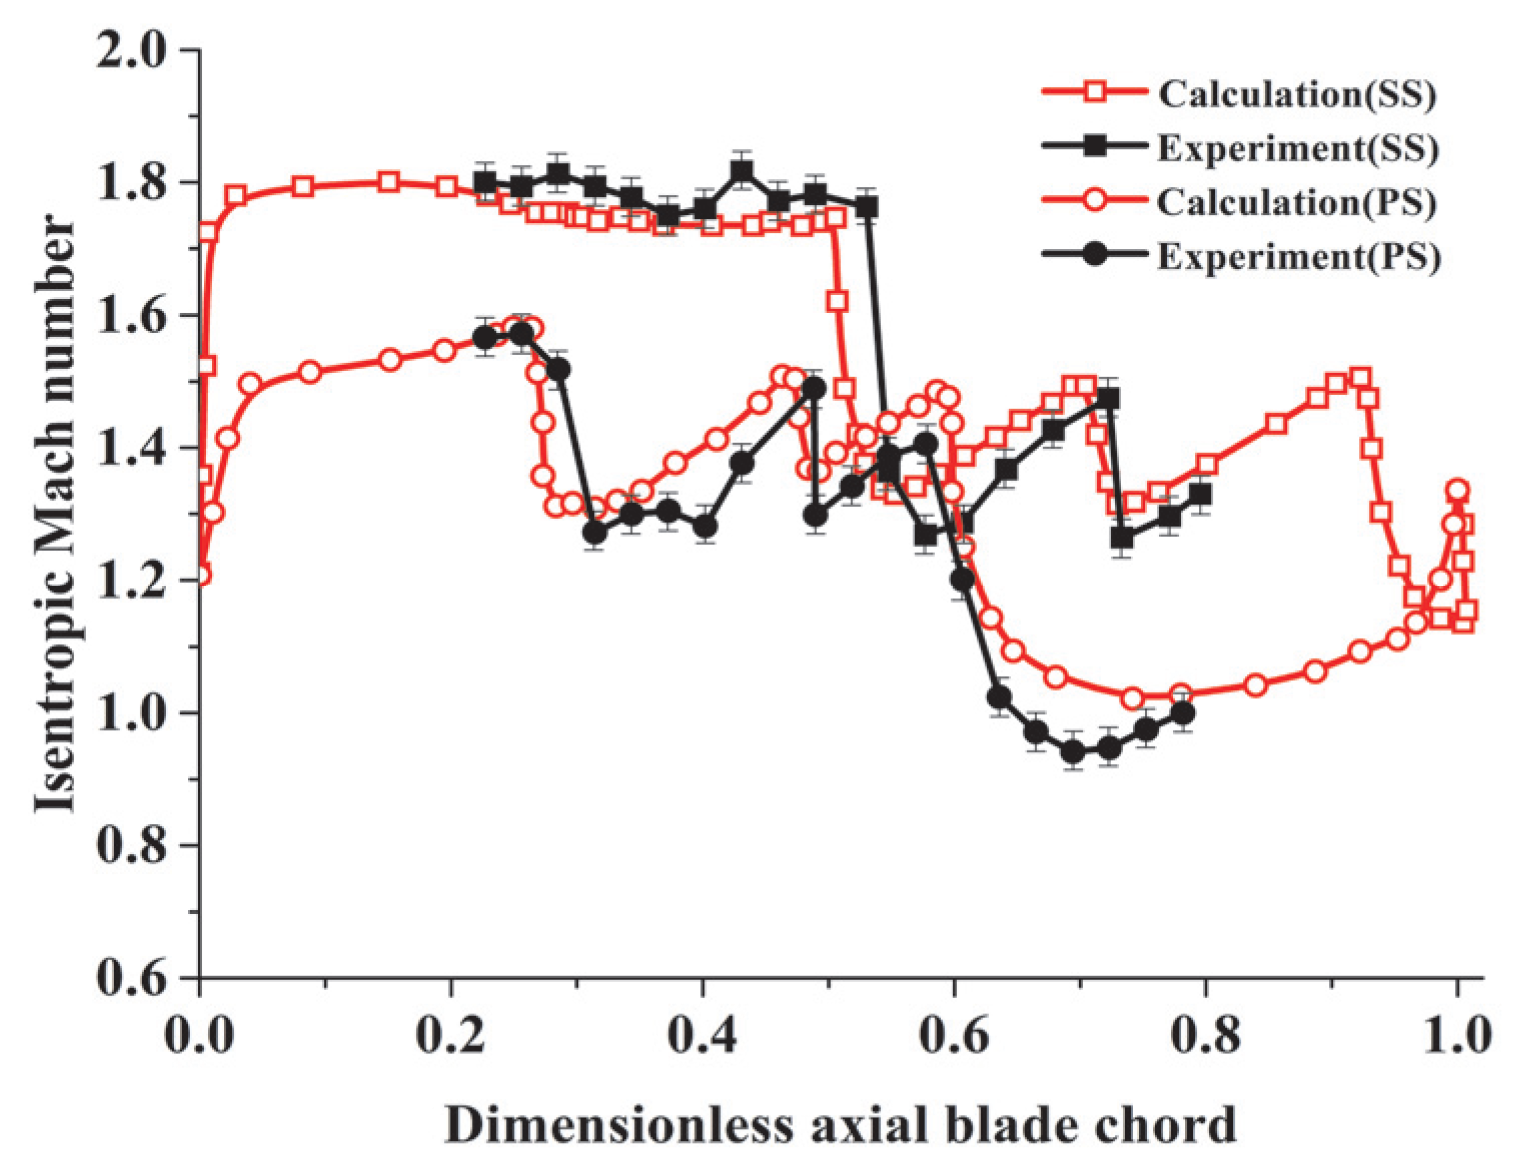
3.3. General Flow Characteristics and Numerical Validation

The pressure distribution and shock configuration at different static pressure ratios (p2/p1) of 1.78 and 2.52 were analyzed at an inlet Mach number of 1.75. Both the simulation results and schlieren photographs during experiments are shown in Figure 10. Due to a lack of suction devices on the side walls of the wind tunnel, the boundary layer effect of the side walls should have a certain impact on the experimental results. In order to reduce this part of the impact, we increased the height of the blade in the process of modeling in the experimental and numerical domain. The blade height was 220 mm to minimize the side-wall boundary layer effect. It was found that shock configuration inside the vane passages of the supersonic compressor cascade is composed of four sections involving bow shock, first-passage shock, passage reflected shock system, and last normal-passage shock. Under design conditions, the experimental results indicate that the first-passage shockwave impacts the suction surface of the adjacent vane at 55.3% of the chord from the leading edge. With the gradual increase in back pressure, the last normal shockwave approaches upstream from far downstream to the outlet plane of the baseline cascade and then marches into the vane passages, as shown in Figure 10b. In the light of the unique incidence requirement for supersonic compressor vane passages with axial subsonic components, the inlet flow does not change with the outlet flow of the supersonic compressor cascade. Hence, the inlet flow of the cascade remains unchanged, to some extent, with the outlet static pressure variations. Moreover, the position of the first-passage shock foot on the suction surface of the adjacent vane is almost the same as that of the experimental schlieren photographs, as shown with a blue dotted box in Figure 10. Therefore, the numerical method adopted in this manuscript can meet the accuracy requirements of the subsequent research.
Due to the projection of schlieren images from one side of the blade to the other, 3D effects can cause shockwave thickening, which has a certain impact on testing accuracy. In this article, the numerical results and experimental results of the blade surface isentropic Mach number distribution are compared and analyzed to further evaluate the accuracy of the numerical method. Figure 10 shows the comparative analysis of isentropic Mach number distribution on the vane surface based on the CFD numerical results and experimental data under the conditions of an inlet Mach number of 1.75 and a static pressure ratio of 2.52. There are forty pressure holes across the region of SWBLI on both the suction and pressure surfaces of the vane; the first starts at 22.7% of the vane chord from the leading edge and the last ends at 78.2% of the chord. In processing the test results, it is necessary to analyze their measurement error. According to the uncertainty analysis and error analysis principle of the test instrument, the standard deviation and standard error of the test data are calculated, and the error bar is drawn, as shown in Figure 11. Compared with the experimental data, for most simulation results, the deviations of the isentropic Mach number and shock location on the vane surface are in the range of 2.1~4.3%, i.e., less than 5%. For less than 4% of the data are such deviations greater than 5%. Therefore, the simulation method can meet the precision requirements of the numerical study. The numerical prediction method employed here is capable of predicting the flow characteristics of the SWBLI within a supersonic compressor cascade.

4. Analyses of Numerical Simulation Results

4.1. Flow Physics on Aerodynamic Performance Under Design Conditions

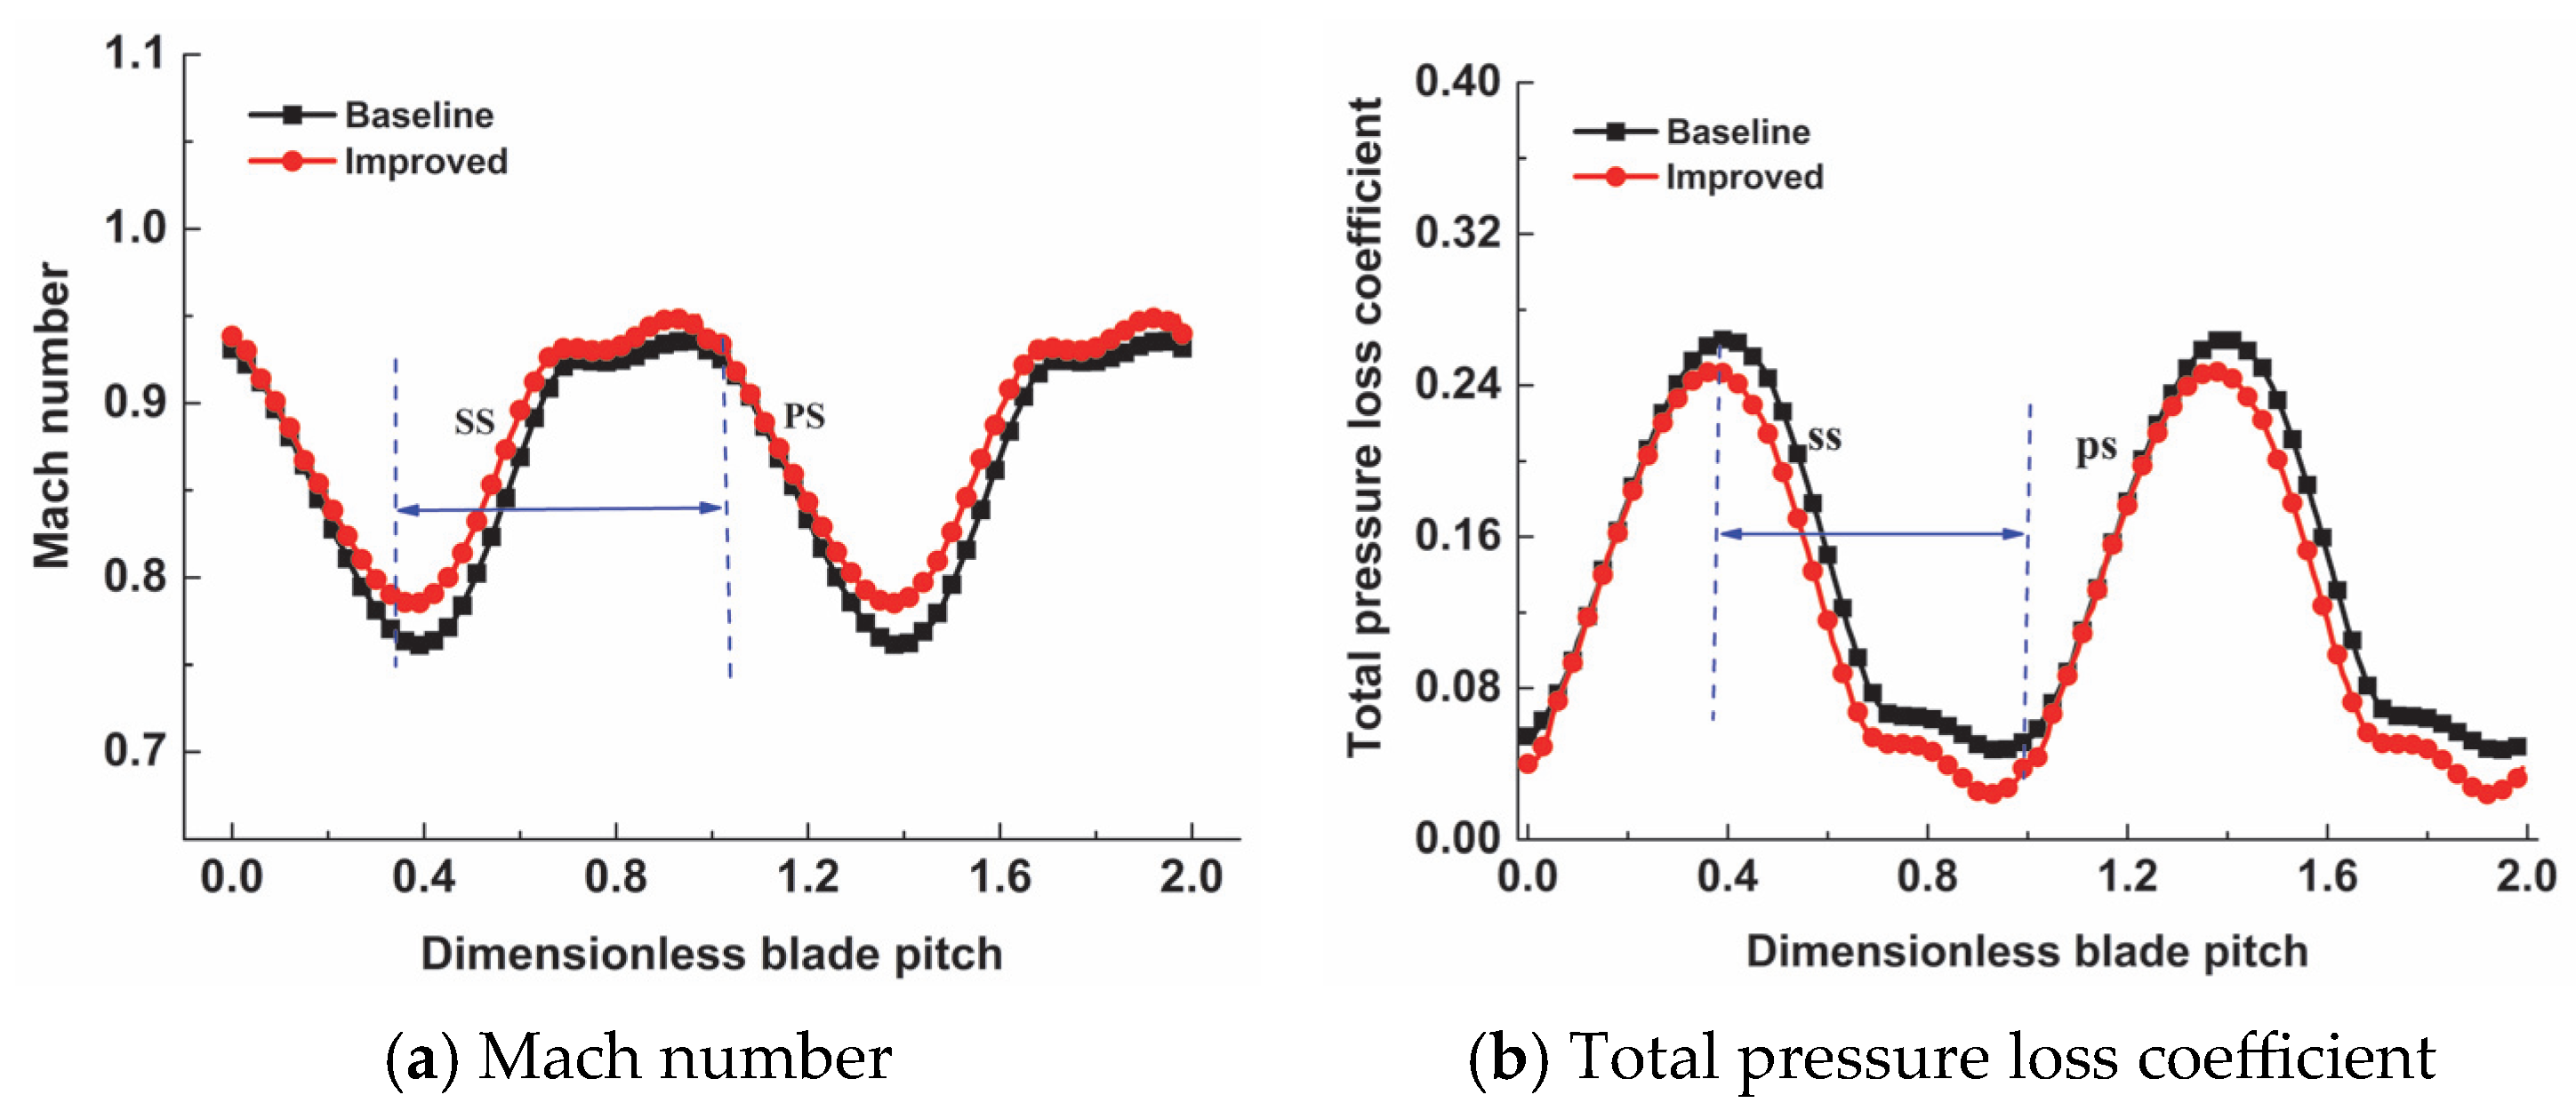
4.1.1. Aerodynamic Performance

The unique incidence curves and mass average aerodynamic performance parameters at the outlet plane (under design conditions) of the baseline and improved cascades are shown in Figure 12 and Table 4, respectively. The parameter extraction position of the numerical results is consistent with that of the experimental results, that is, 50% of the vane chord upstream from the leading edge and 75% of the chord downstream from the trailing edge. Both curves of unique incidence for the baseline and improved cascades show that the unique relationship between inlet Mach number and inlet flow angle is consistent. This indicates that the negative-curvature ramp would just change the local flow field and could not affect the aerodynamic parameters at the cascade inlet. In addition, the decrease in outlet flow angle β2 shows more attached fluids around the improved cascade with the decrease in flow loss. The total pressure loss coefficient of the improved cascade declines by 4.6% under design conditions, as shown in Table 4. The total pressure loss coefficient is defined as
ω = P in * P out * P in * p in
To show the difference between the baseline and the improved cascade aerodynamic parameters in detail, the distributions of Mach number and total pressure loss coefficient normalized by the vane pitch under design conditions are shown in Figure 13. It is noteworthy that the increase in Mach number at the outlet plane of the improved cascade occurs in the wake and main flow near the vane suction side surface (the blue arrow in Figure 13). The corresponding total pressure loss is reduced in this regard, which may result from the profile modification on the suction surface of the cascade. The minor modifications to the baseline cascade near the first-passage shock impingement position on the suction surface achieve great improvements in aerodynamic performance.

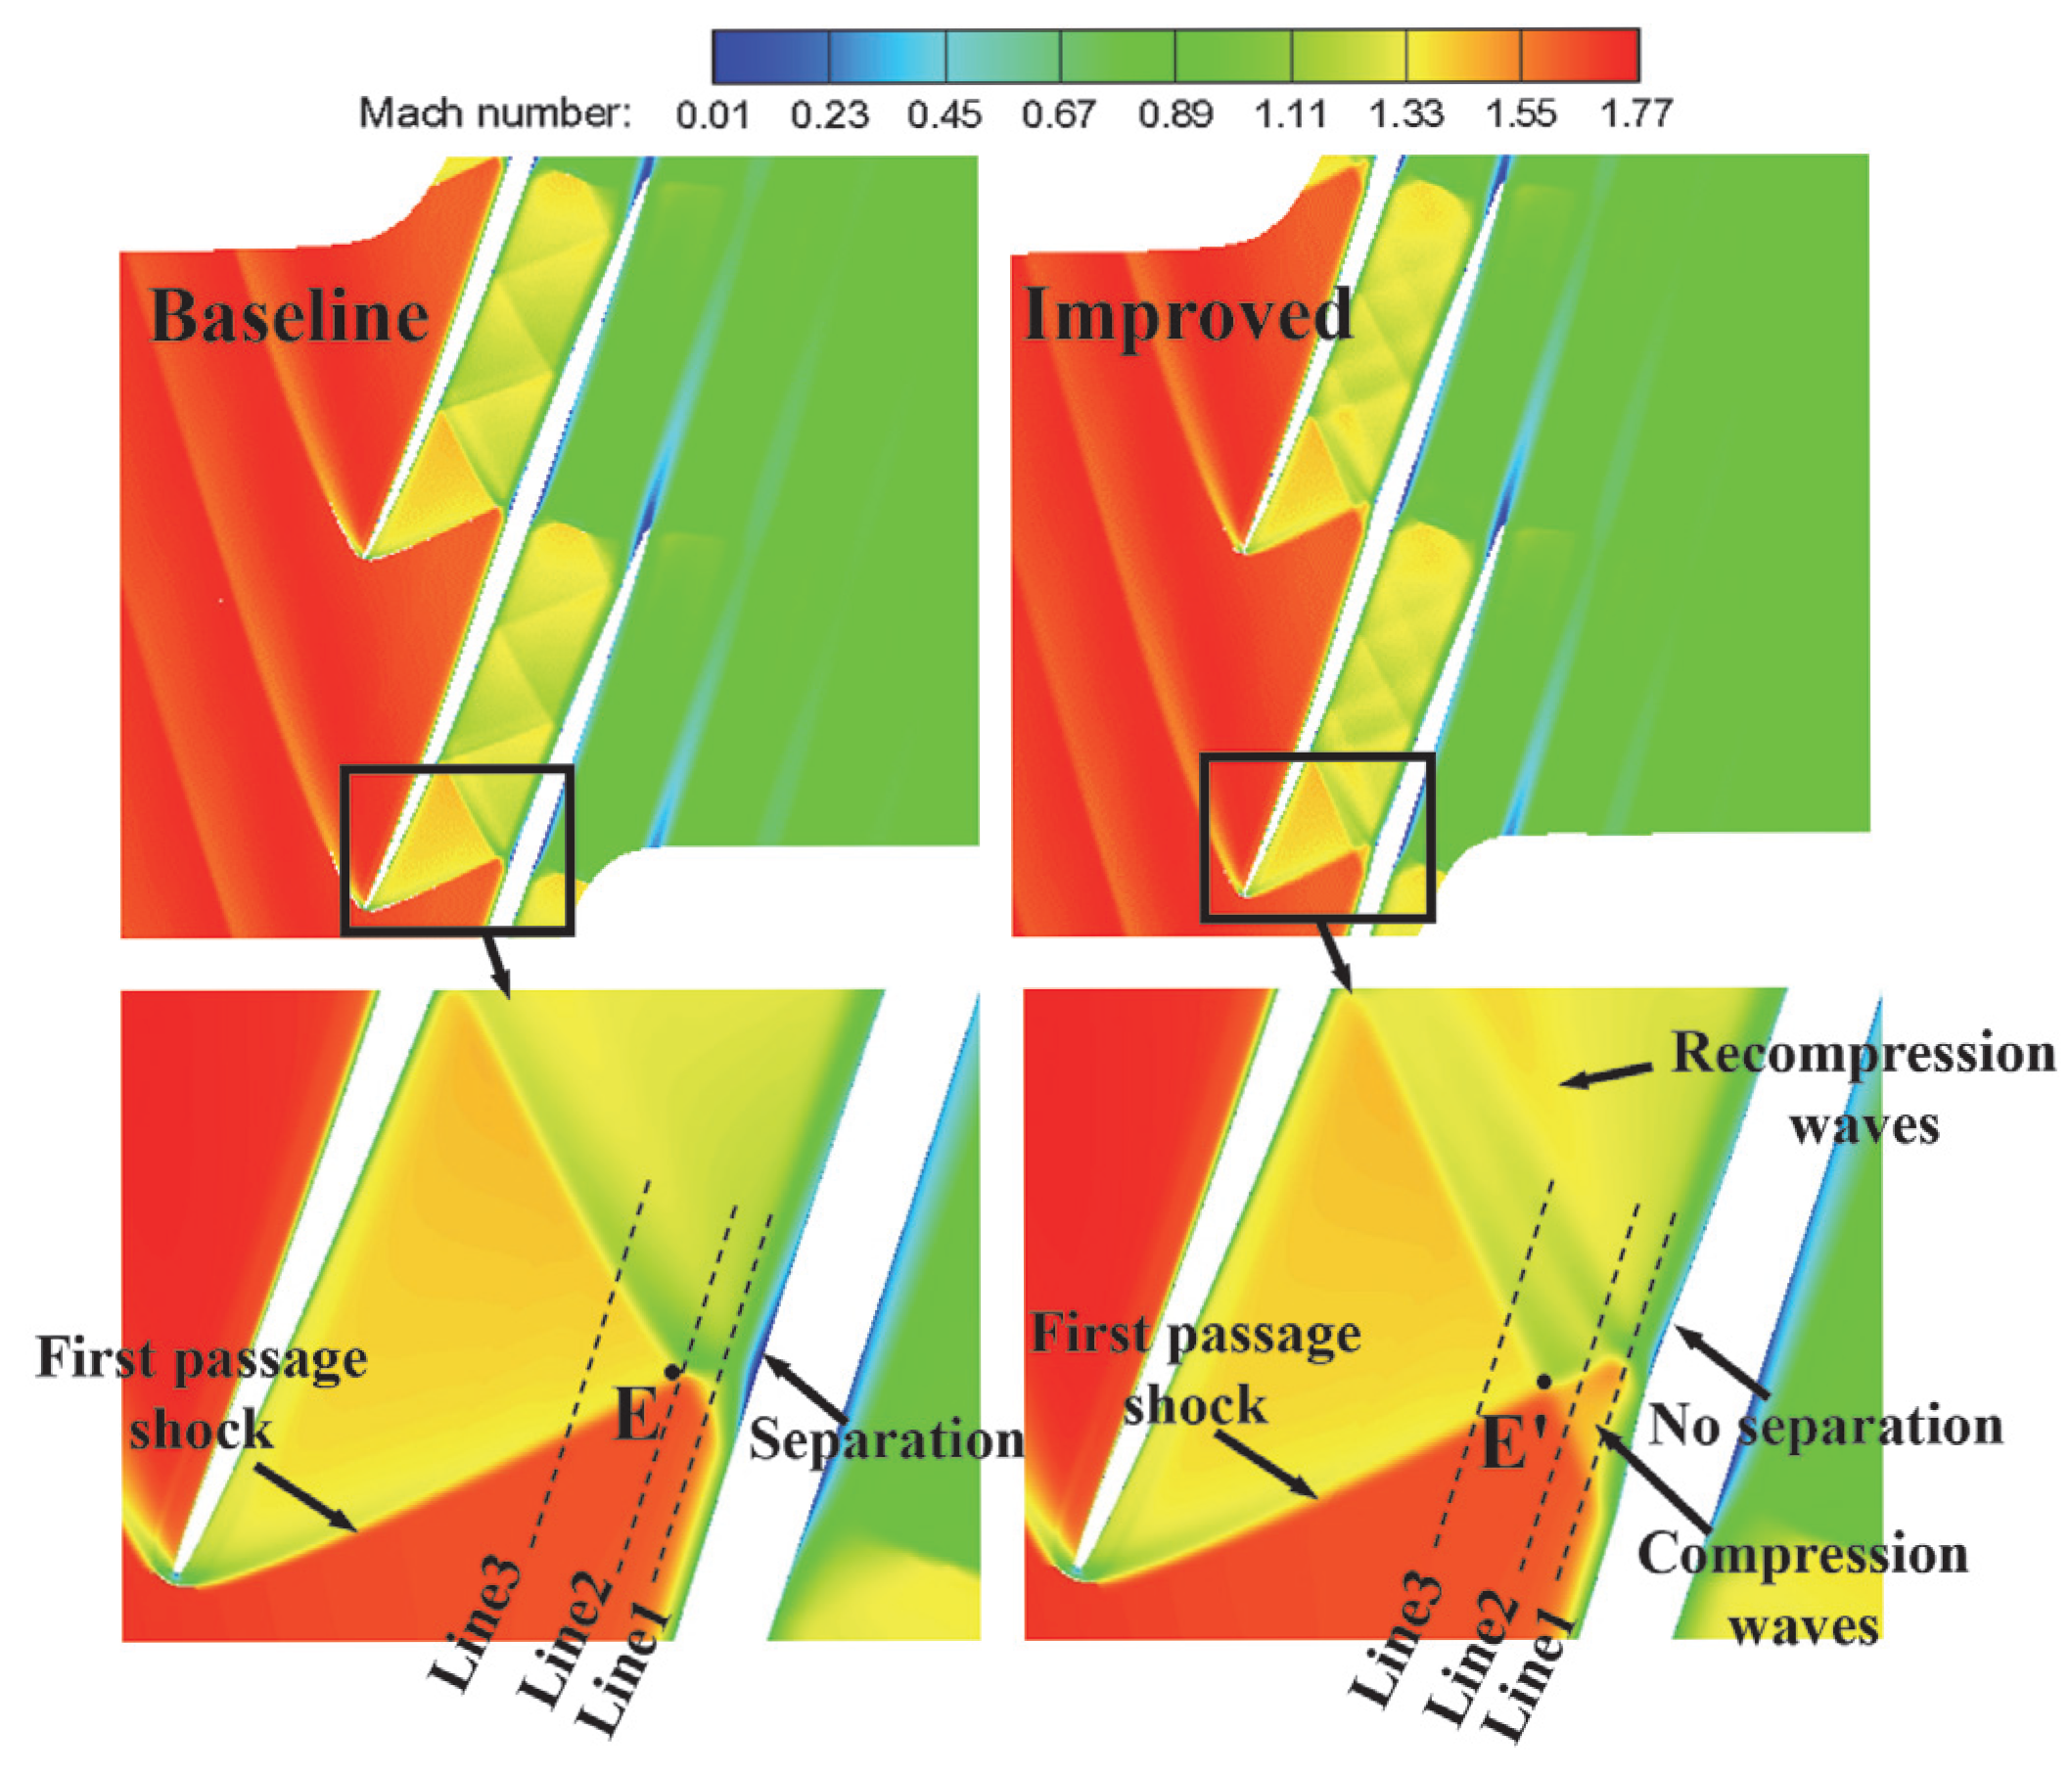
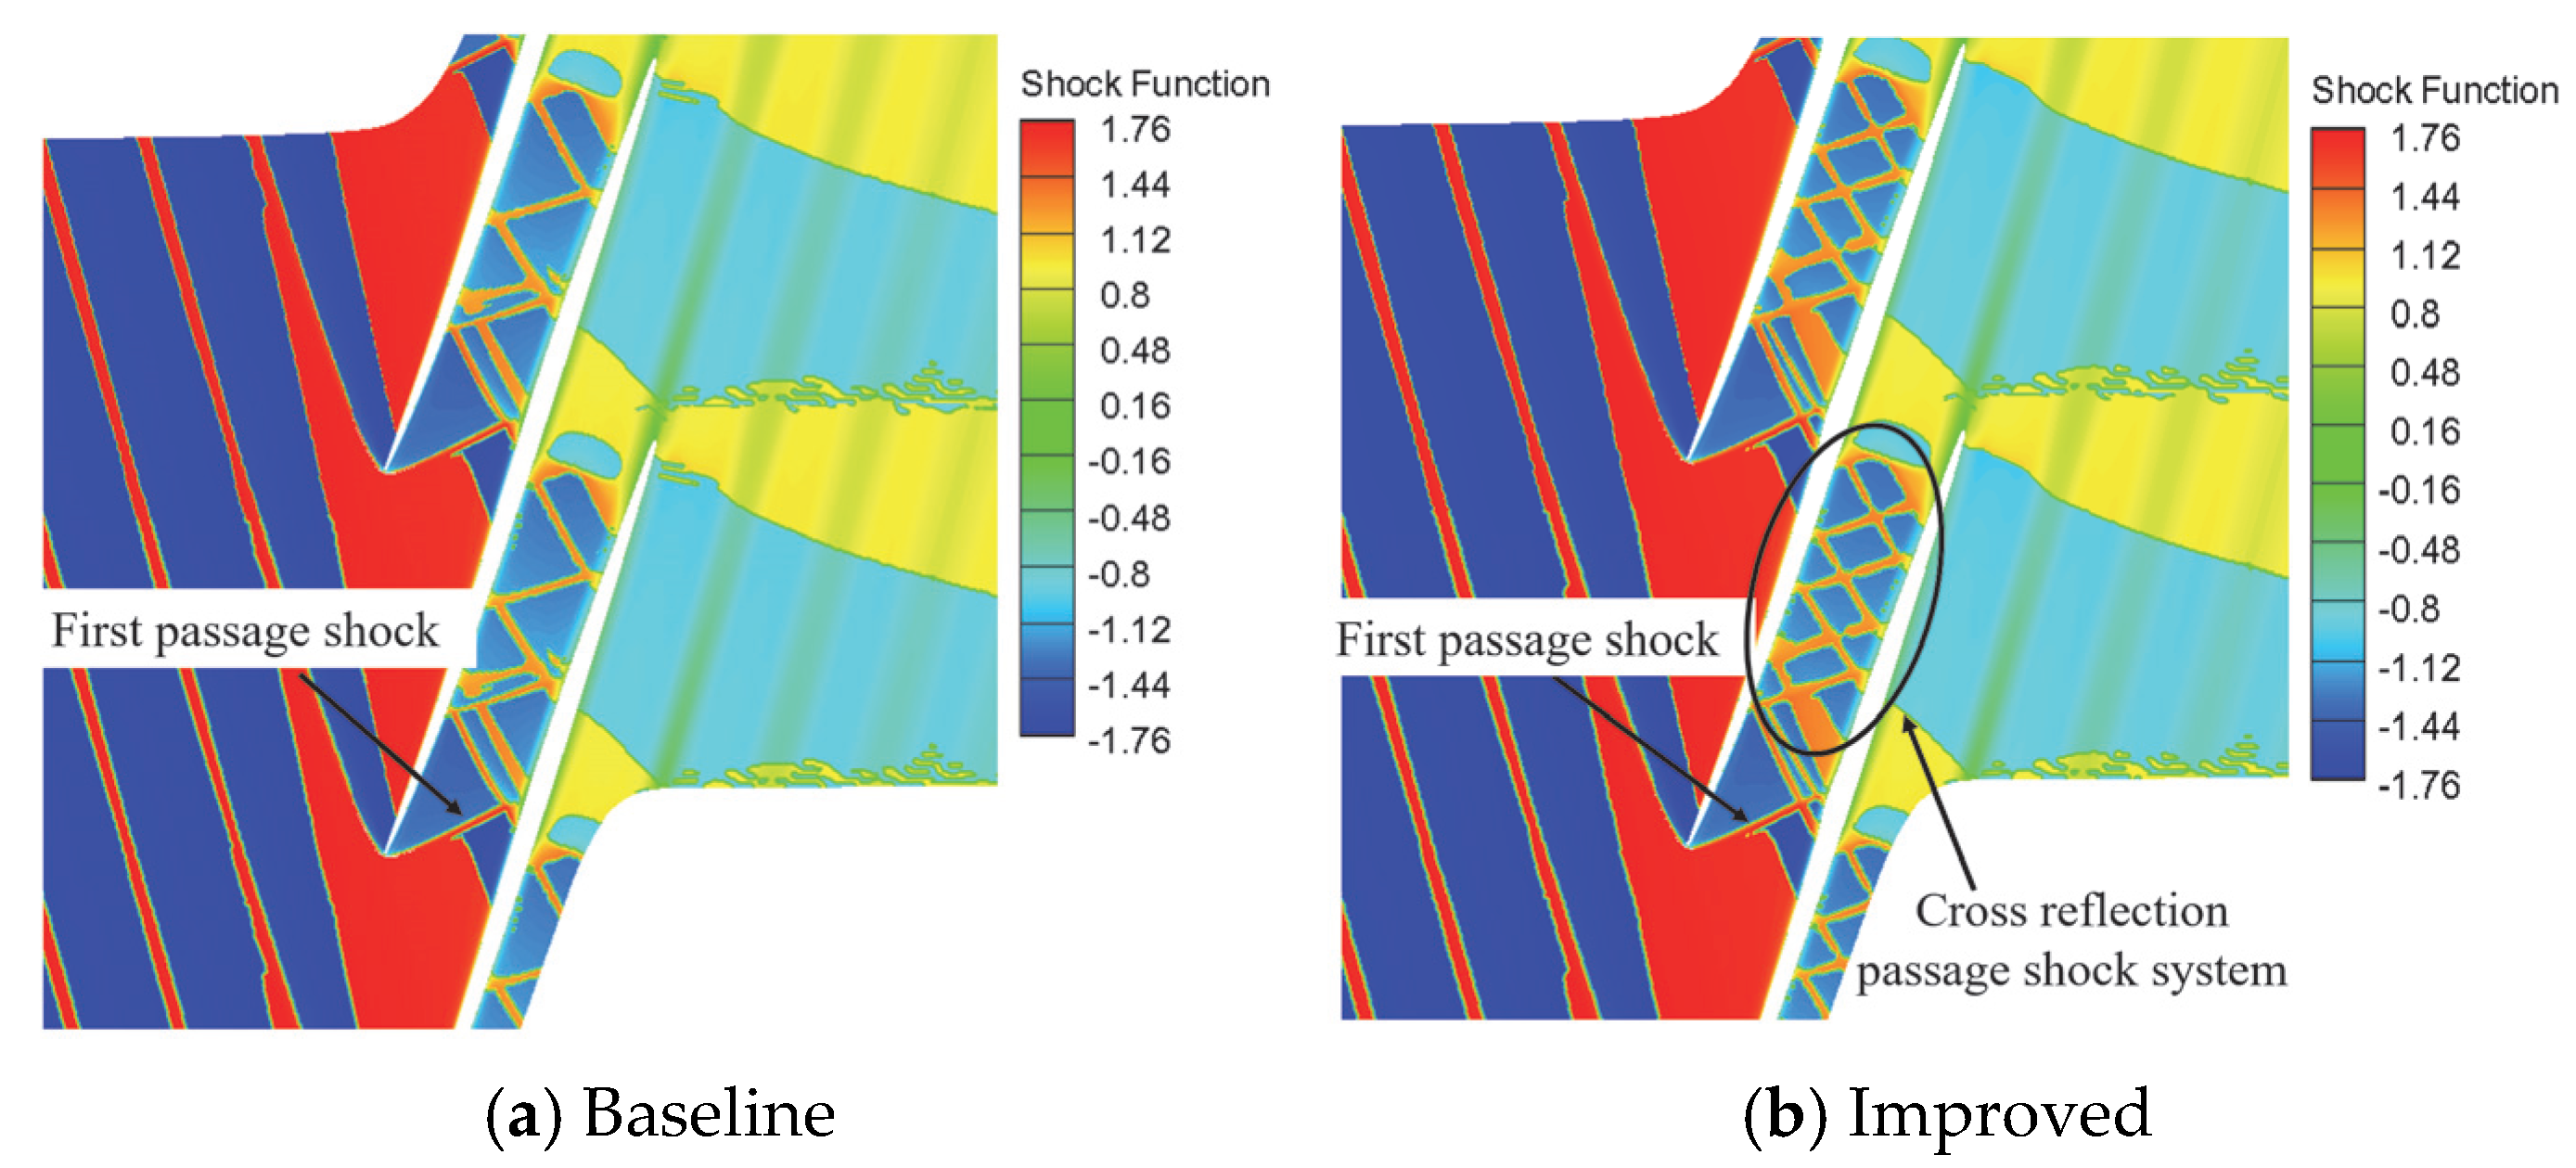
4.1.2. Flow Field Analysis

In order to reveal the effects of the flow field characteristics of the improved cascade on SWBLIs, Mach number contours under design conditions are adopted to sketch the shock configuration for both cascades, as shown as Figure 14. For the baseline cascade, due to the increase in the boundary layer thickness near the first-passage shockwave, the deflection angle of the flow near the shock impingement point on the suction side increases. Mach reflection occurs when the passage flow is over-deflected, generating a quasi-normal shockwave (Mach stem) near the shock foot. There exists a separation bubble within the boundary layer, and its bifurcation point E is located above the suction surface. Compared to the baseline cascade, a series of compression waves are generated from the negative-curvature profile ahead of the first-passage shock of the improved cascade, which weakens the strength of the shock foot. The boundary layer separation bubble evidently disappears, and the impingement position of the shockwave moves downstream (about 1.23% of the axial chord length). Furthermore, the compressive wave and reflected shockwave converge at point E′, and this point, corresponding to the bifurcation point E, is far away from the suction side of the improved vane profile as it has moved up 6.2% of the local vane channel width. This phenomenon can be attributed to the interaction between the compression waves and the first passage shock foot, which changes the reflected shock position. In addition, recompression waves are generated on the leeward region behind the plateau section on the vane suction surface, and a new shockwave system structure is displayed in the cascade passage. The structure of the shockwave system can be reflected by the shock function, defined as
shock = V p a p
where V is the velocity vector, p is the pressure gradient, and a is the local speed of sound. The shockwave function contours of both cascades under design conditions are shown in Figure 15. The reflected shockwave system formed by the first-passage shock is split into two parts. The two reflected shockwave systems cross-propagate in the cascade passage and end up with the last-passage normal shock. According to flow physics, the strong shock system is decomposed into multiple weak shock systems, which can reduce the flow separation loss. In this way, the potential of shockwave pressurization can be maximized.
In order to reveal the flow physics of the negative-curvature profile ahead of the shock foot, the aerodynamic parameters across the SWBLI region of the two cascades are analyzed in detail. Three cuts through the first-passage shock are marked by the parallel dashed lines, as plotted in Figure 14. They correspond to several characteristic heights near the first passage shock foot from the vane suction surface. Line 1 and line 2 intersect with the Mach stem of the baseline cascade and the compression waves of the modified cascade. Line 3 intersects with the first-passage shock of both cascades and their reflected shock. In order to more clearly compare the changes in flow field between the baseline and improved cascades, the positions of lines 1, 2, and 3 presented for the baseline remain the same in the improved case. Figure 16 depicts the flow angle and Mach number distributions of the baseline cascade and the improved cascade along the three cuts across the first-passage shock foot. Compared to the baseline cascade, the pre-shock Mach numbers of the improved cascade are reduced by the compression waves. The Mach numbers of lines 1 and 2 are reduced from 1.55 and 1.63 to 1.32 and 1.45, respectively. For line 3, the reduction in Mach number caused by the first-passage shock of both cascades is consistent, mainly because the aerodynamic parameters ahead of the shock are not affected by the compression wave. In addition, the position of reflected shock moves at 2.62% of the axial chord length upstream along line 3, indicating that the angle of reflected shock increases and its intensity decreases.
The flow angle distributions along line 1 and line 2 near the impingement position of the first passage shock indicate that earlier and more moderate flow deflection takes place on the improved cascade suction surface. The angle distribution curves of the SWBLI region in both cascades tend to rise at first and then decrease. The difference is that the variation in flow angle for the baseline cascade is due to the separation and reattachment of the boundary layer, while the change in flow angle of the improved cascade can be attributed to the variation in vane profile curvature on the suction surface. As for the flow angle distribution along line 3, the flow direction of both vanes after the first-passage shockwave is the same.
As the boundary layer separation is diminished, the flow angle behind the shock of the improved cascade is lower than that of the baseline cascade, as shown with a blue dotted box in Figure 16. That is, the flow deflection angle of the improved cascade exceeds that of the baseline cascade across the SWBLI region. This shows that a larger vane loading level is obtained.
The static pressure coefficient can quantify the aerodynamic load distribution of the vane surface, which is defined as
C p = p p in P in * p in
where P*in and pin are the total pressure and the static pressure at the cascade inlet, respectively, and p is the local static pressure on the vane surface. The surface static pressure coefficient distribution curves across the SWBLI region on the vane suction surface of both cascades are shown in Figure 17. A large adverse-pressure gradient emerges, which is generated by the first-passage shock for the baseline. However, for the improved cascade, the corresponding adverse-pressure gradient vanishes and is replaced by a three-stage moderate pressure rise. In the first stage, the vane surface static pressure coefficient curve indicates a continuously increasing tendency with a constant pressure gradient, which is induced by compression waves on the negative-curvature vane profile. The result is essentially in accordance with the initial desired design, demonstrating the feasibility of the design method with a constant adverse-pressure gradient. Then, the second stage of pressure gain can be attributed to the weaker first-passage shock. Finally, the third stage involves recompression shockwaves at the end of the negative-curvature vane profile, which drives the surface pressure to rise again. Compared with the static pressure rise induced by the first passage shock of the baseline cascade, the adverse pressure gradient generated by the three-stage moderate pressure rise in the improved cascade is reduced by about 30%. Thus, with the precompression effect ahead of the incident shock foot, the adverse-pressure gradient induced by the shock can be significantly reduced.
Analyses of the amount of loss due to the first-passage shock foot and the shock-induced separation of the two cascades are performed by integrating the entropy production rate. Specifically, the integration is conducted over the region corresponding to each flow phenomenon, and the amount of each flow loss is evaluated. The entropy production rate S ˙ gen of internal flow is defined as
S ˙ gen = 1 T τ i j u i x j + γ T 2 T x j 2
The entropy production rate can be a useful tool to calculate various loss-generation amounts [40]. Figure 18 shows the entropy generation rate contours within the vane passage of a supersonic compressor cascade, where the region of the first-passage shock root and its interaction with the boundary layer are marked with black dotted lines. The loss of the SWBLI region can be obtained by integrating the contour of the entropy production rate. The areas of the SWBLI region, the first-passage shock foot region, and the reflected shock region should be extracted separately from the entropy production rate contour. Then, the corresponding loss can be obtained by integrating the areas of each part. The variations in the loss breakdown in the interaction region (normalized by the baseline cascade loss) are depicted in detail in Table 5. The boundary layer loss accounts for a large proportion of the total loss of the cascade, which is estimated to be more than 90%. Compared with the baseline cascade, the first-passage shock foot loss and reflected shock loss in the interaction region of the improved cascade are reduced to 9.1% and 33.3%, respectively. This means that a weaker incident shockwave and a lower stagnation pressure loss are present.
The incompressible shape factor curves of the two cascades near the shockwave impact position reflect the behavior of the boundary layer, as illustrated in Figure 19. The general distribution tendency of incompressible shape factors H rises initially and then reduces across the interaction region. The maximum value occurs at the impingement position of the first passage shock. Compression waves originating from the negative-curvature vane profile of the improved cascade also lead to a slight increase in the boundary layer shape factor, but the effect is much weaker than that of the shockwaves.
Compared to the baseline cascade, the shape factor of the SWBLI region of the improved vane suction surface is generally smaller. The maximum value of the shape factor at the first-passage shock incident position is reduced by 21.9%. Smaller boundary layer shape factors imply a fuller velocity distribution and a more stable boundary layer.

4.2. Compatibility of Negative-Curvature Ramp Under Off-Design Conditions

The off-design operation conditions of a supersonic compressor cascade mainly include variations in the aerodynamic parameters, such as Mach number and flow angle at the inlet plane and pressure at the exit plane. There is a unique incidence relationship between the relative velocity of the supersonic inlet and the axial component of the subsonic compressor cascade. The flow angle varies with the inlet Mach number. Therefore, under off-design conditions, it is only necessary to study the variations in the inlet Mach number and outlet pressure of both cascades.

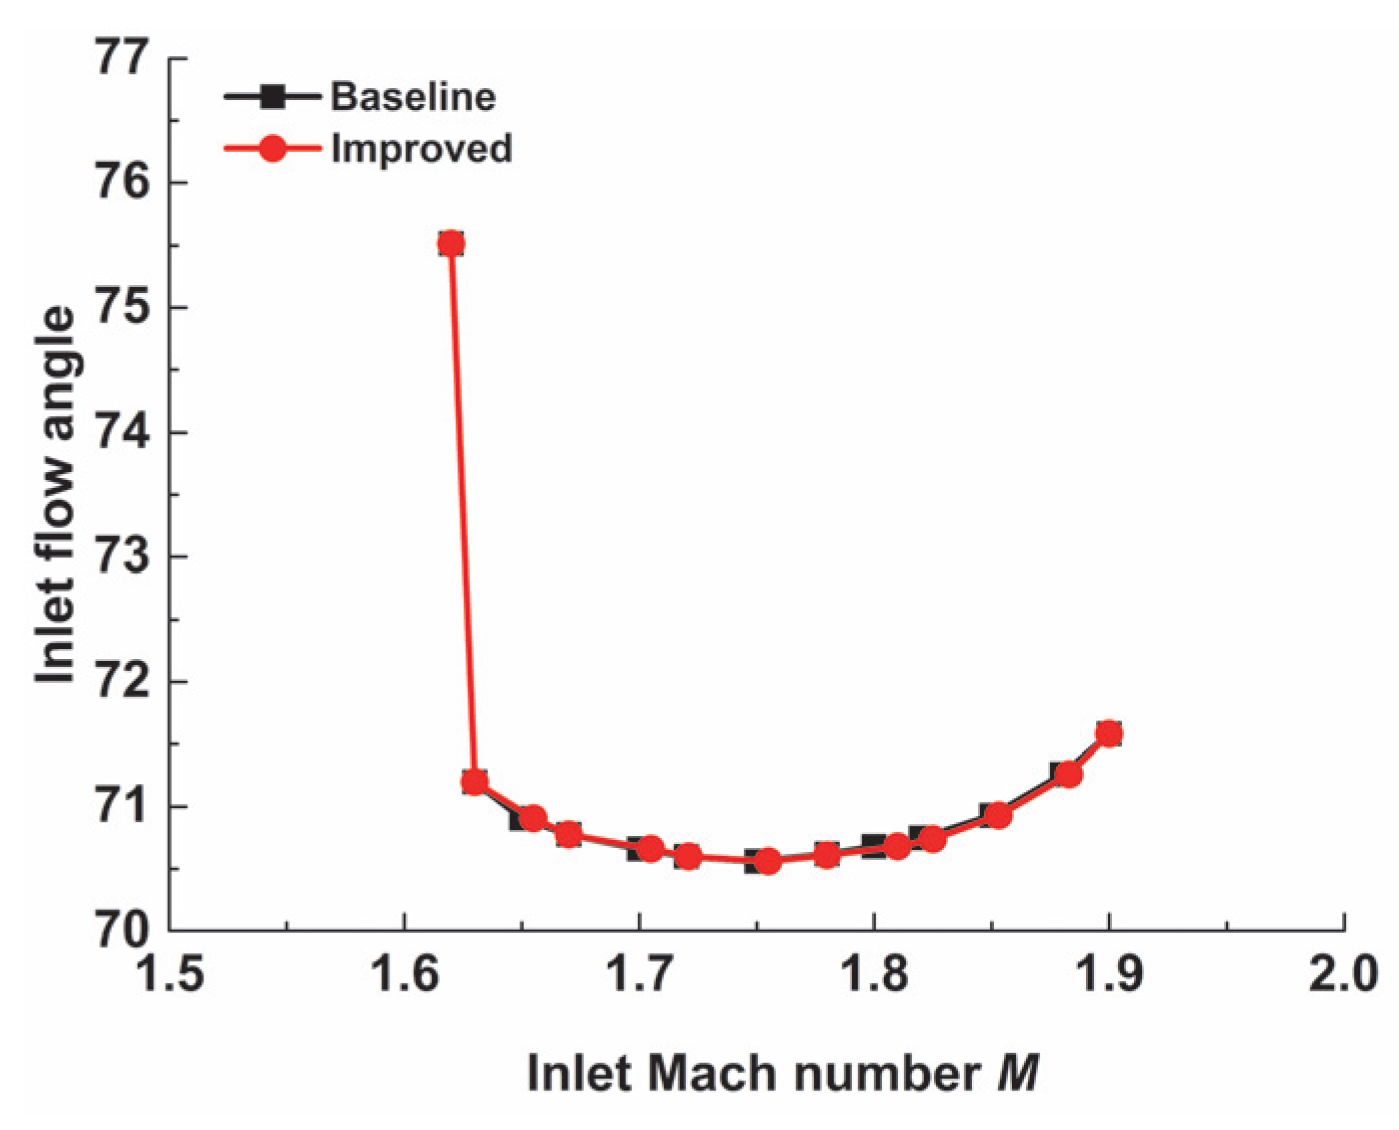
4.2.1. Variation in Inlet Mach Number

The total pressure loss coefficient distribution for the two cascades at a design static pressure ratio of 2.75 and different inlet Mach numbers is shown in Figure 20. It is clear that the overall aerodynamic performance of the improved cascade is superior to that of the baseline cascade at inlet Mach numbers ranging from 1.62 to 1.80, except for the range from 1.64 to 1.66. The analysis of the flow field characteristics of the two cascades based on the Mach number contours is shown in Figure 21. The shock impingement position at a designed inlet Mach number of 1.75 moves upstream or downstream with an increase or decrease in inlet flow velocity. At inlet M = 1.64, the first-passage shock impingement position moves to the smooth ramp profile, and the boundary layer separation of the improved cascade appears clearly. This can be attributed to the coupling between the compression wave generated by the ramp profile and the incident shockwave [24]. With a further decrease in inlet velocity, both cascades have an inlet Mach number of 1.62. The boundary layer separation caused by the normal shockwaves is as follows. The ramp section obstructs the evolution of separation fluids downstream within the boundary layer and reduces the flow loss in the improved cascade. On the contrary, the shock impingement position moves downstream to the plateau section at an inlet Mach number of 1.80. The local acceleration effect is formed on the plateau profile behind the compression waves, and the reflected shockwave is stronger, resulting in more shock loss.

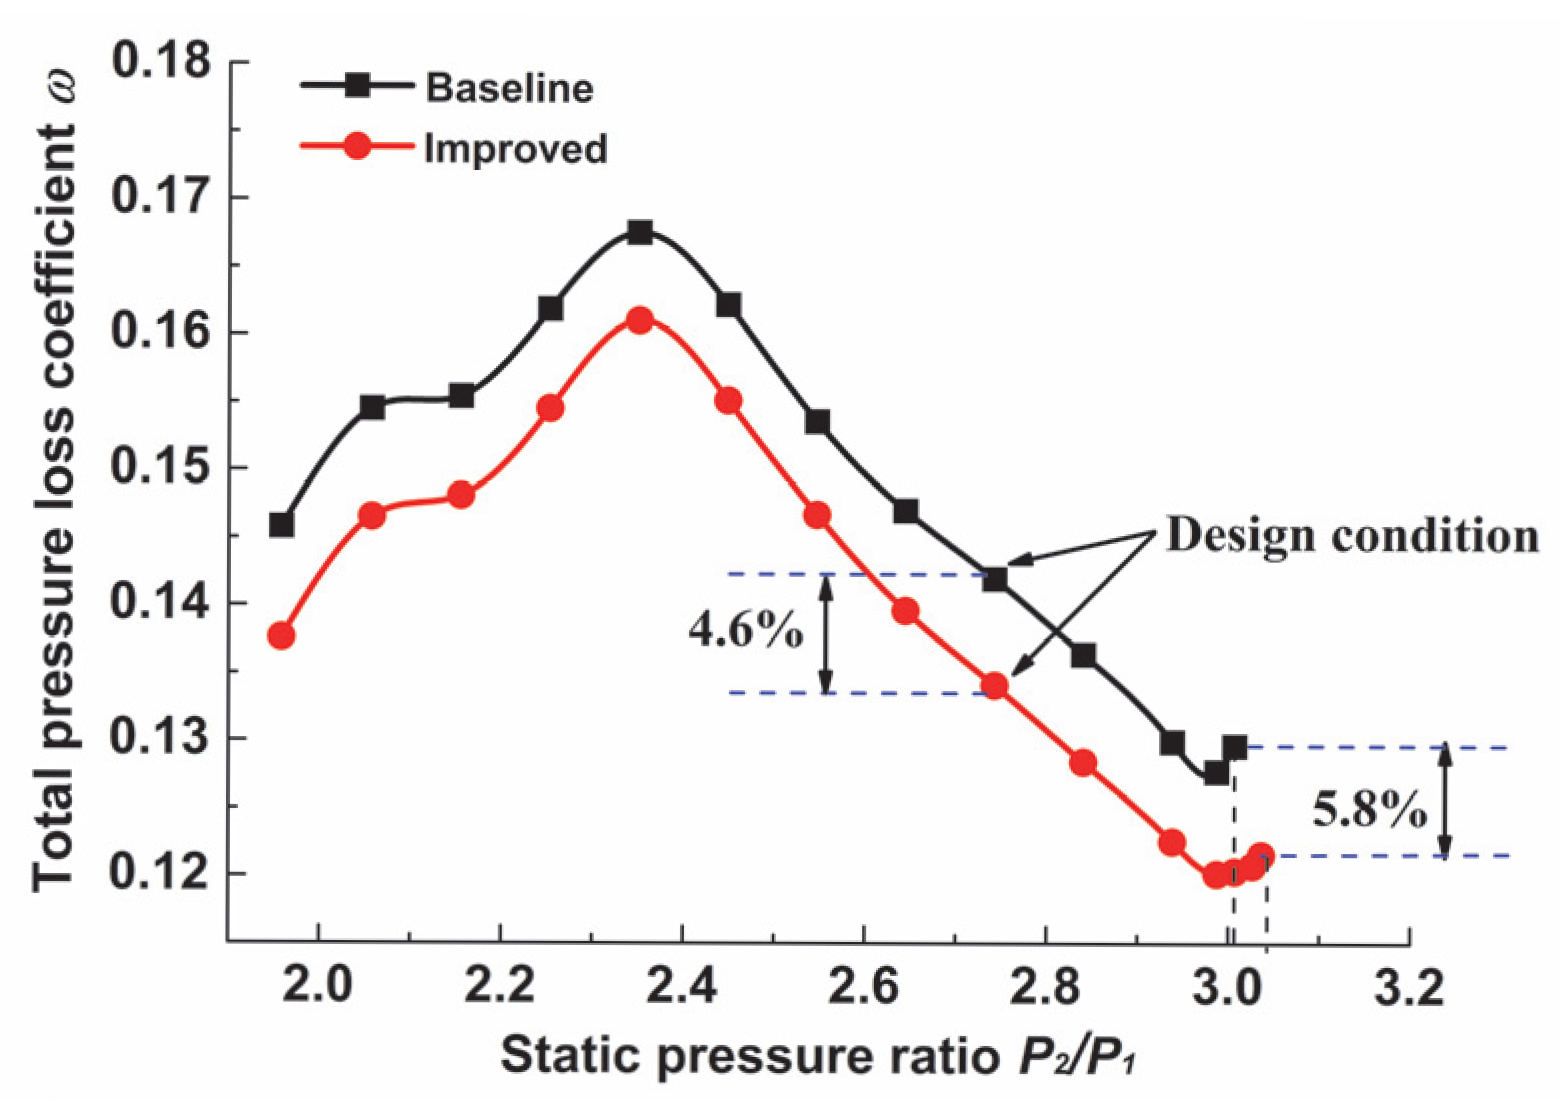
4.2.2. Variation in Outlet Pressure

The relationship between the total pressure loss coefficients and the static pressure ratio under design inlet conditions is shown in Figure 22. The total pressure loss coefficient curves of both cascades indicate that the flow losses of the improved supersonic compressor cascade are lower than those of the baseline cascade for the whole range of back exit pressures. The total pressure loss coefficient is reduced by 4.6% under the design conditions and 5.2% at the maximum static pressure ratio. This can be attributed to the fact that the intensity and position of the first-passage shock are not dependent on the increase in back exit pressure until the last-passage normal shock reaches the throat of the cascade passage. The maximum outlet-to-inlet static pressure ratio approaches 2.9, as shown in Figure 23. The pre-shock Mach numbers are reduced through compression waves, resulting in the disappearance of the boundary layer separation bubble. As for the large back exit pressure, the first passage shock moves away from the vane’s leading edge. Then, a stronger separation shockwave is formed, and the maximum static pressure ratio reaches p2/p1 = 3.04. The ramp profile hinders low-momentum fluids from moving downward within the boundary layer and shows less flow loss in the improved cascade. In addition, the maximum static pressure ratio of the improved cascade is about 1.6% higher than that of the baseline cascade, indicating that the improved model has potential for high-stage loading.

5. Conclusions

An improved method to reduce the boundary layer separation loss induced by the first-passage shock foot is investigated for a supersonic compressor cascade with a design inlet Mach number of 1.75. It employs a negative-curvature profile with a constant adverse-pressure gradient ahead of the position of the impingement of the first-passage shock on the suction surface. The numerical results show that the aerodynamic performance of the modified cascade is superior to that of the baseline cascade under design and off-design conditions. In addition, the comparison of flow field characteristics between the baseline model and the modified model provides a detailed analysis of the flow physics of negative-curvature ramps. Some valuable conclusions from this investigation are as follows:
(1)
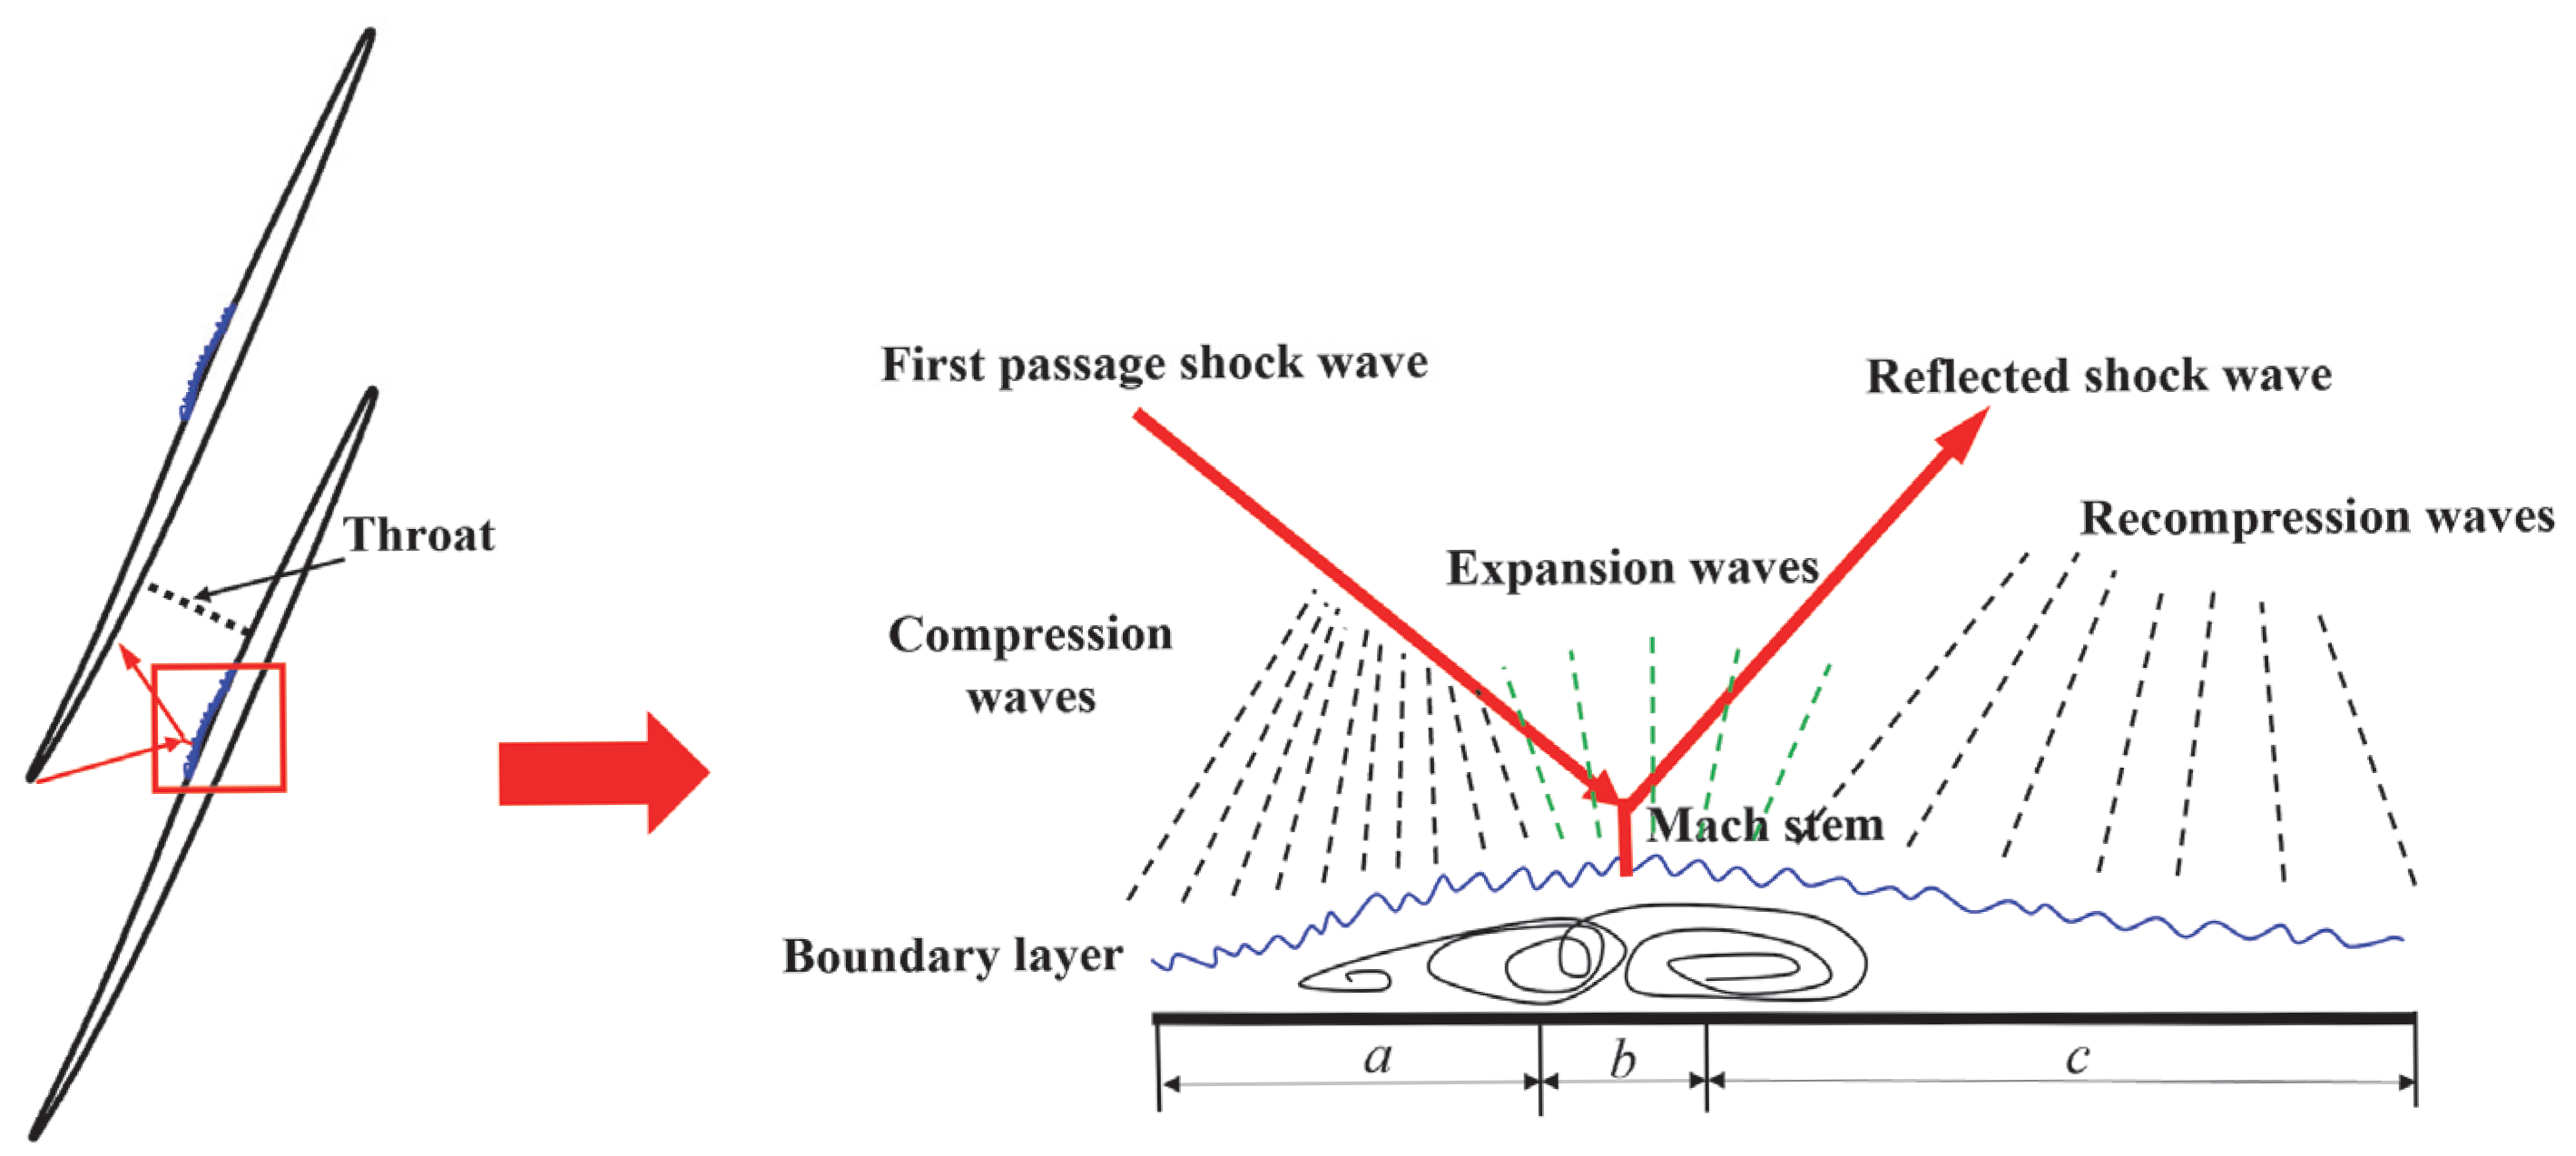
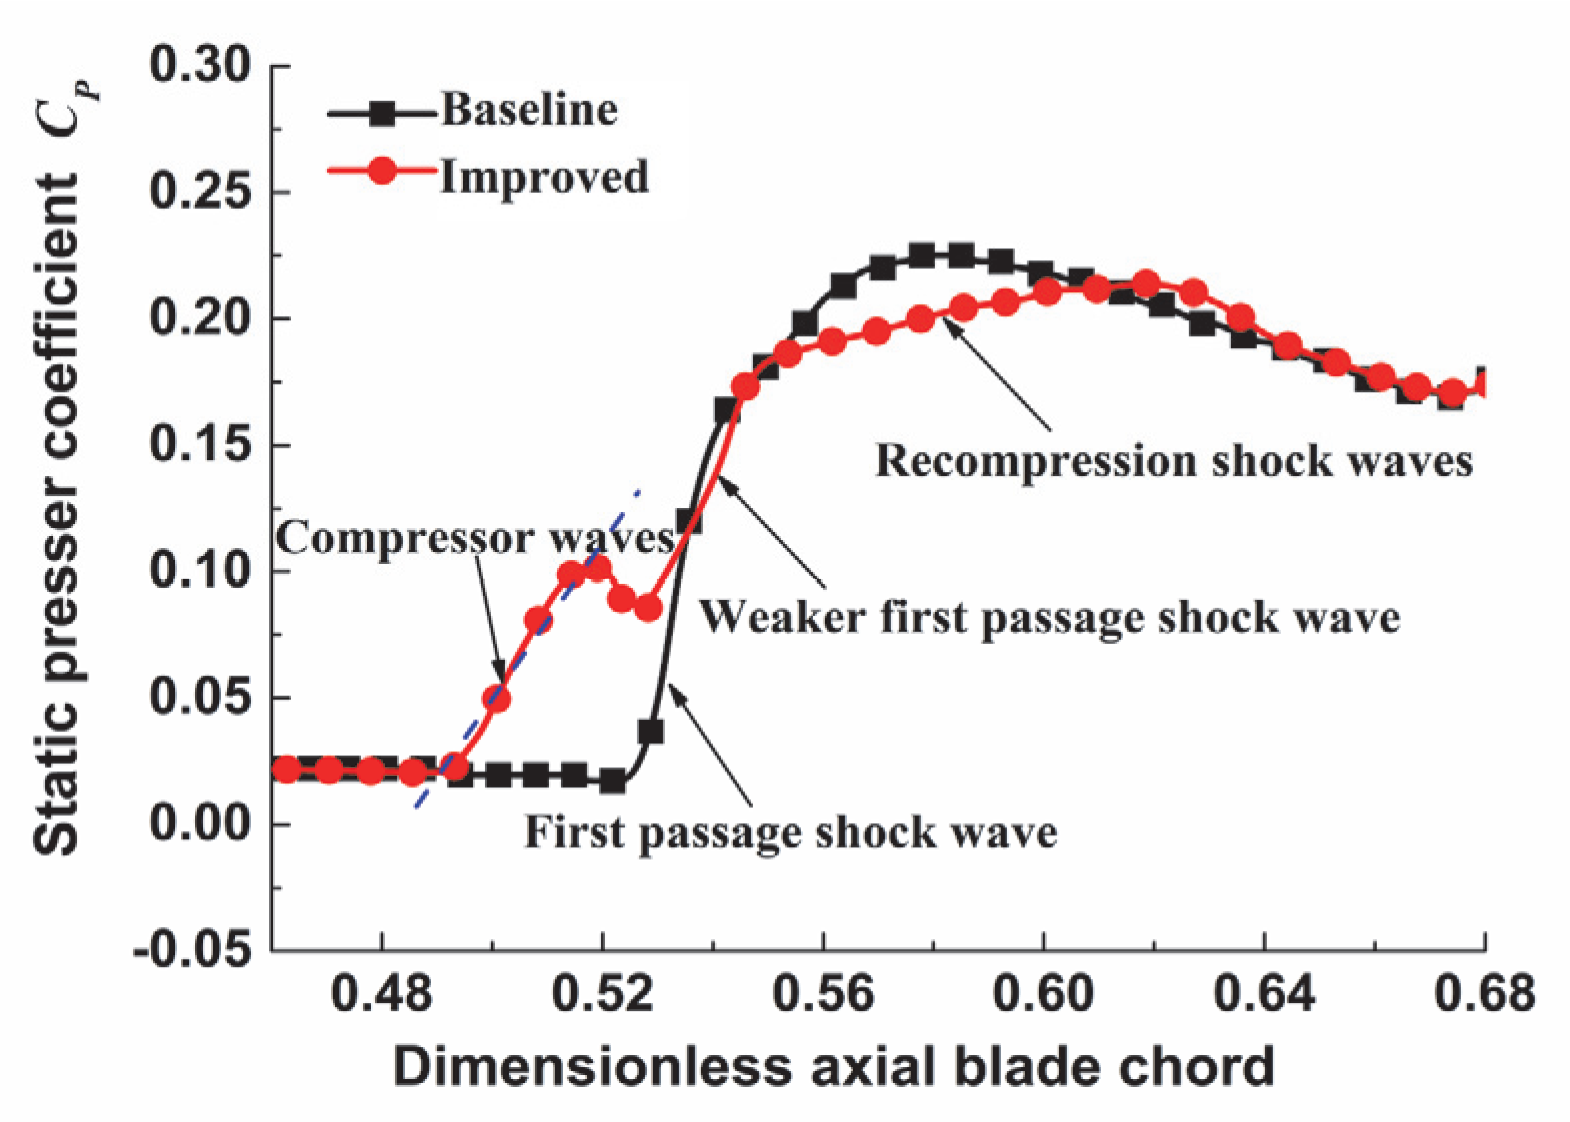
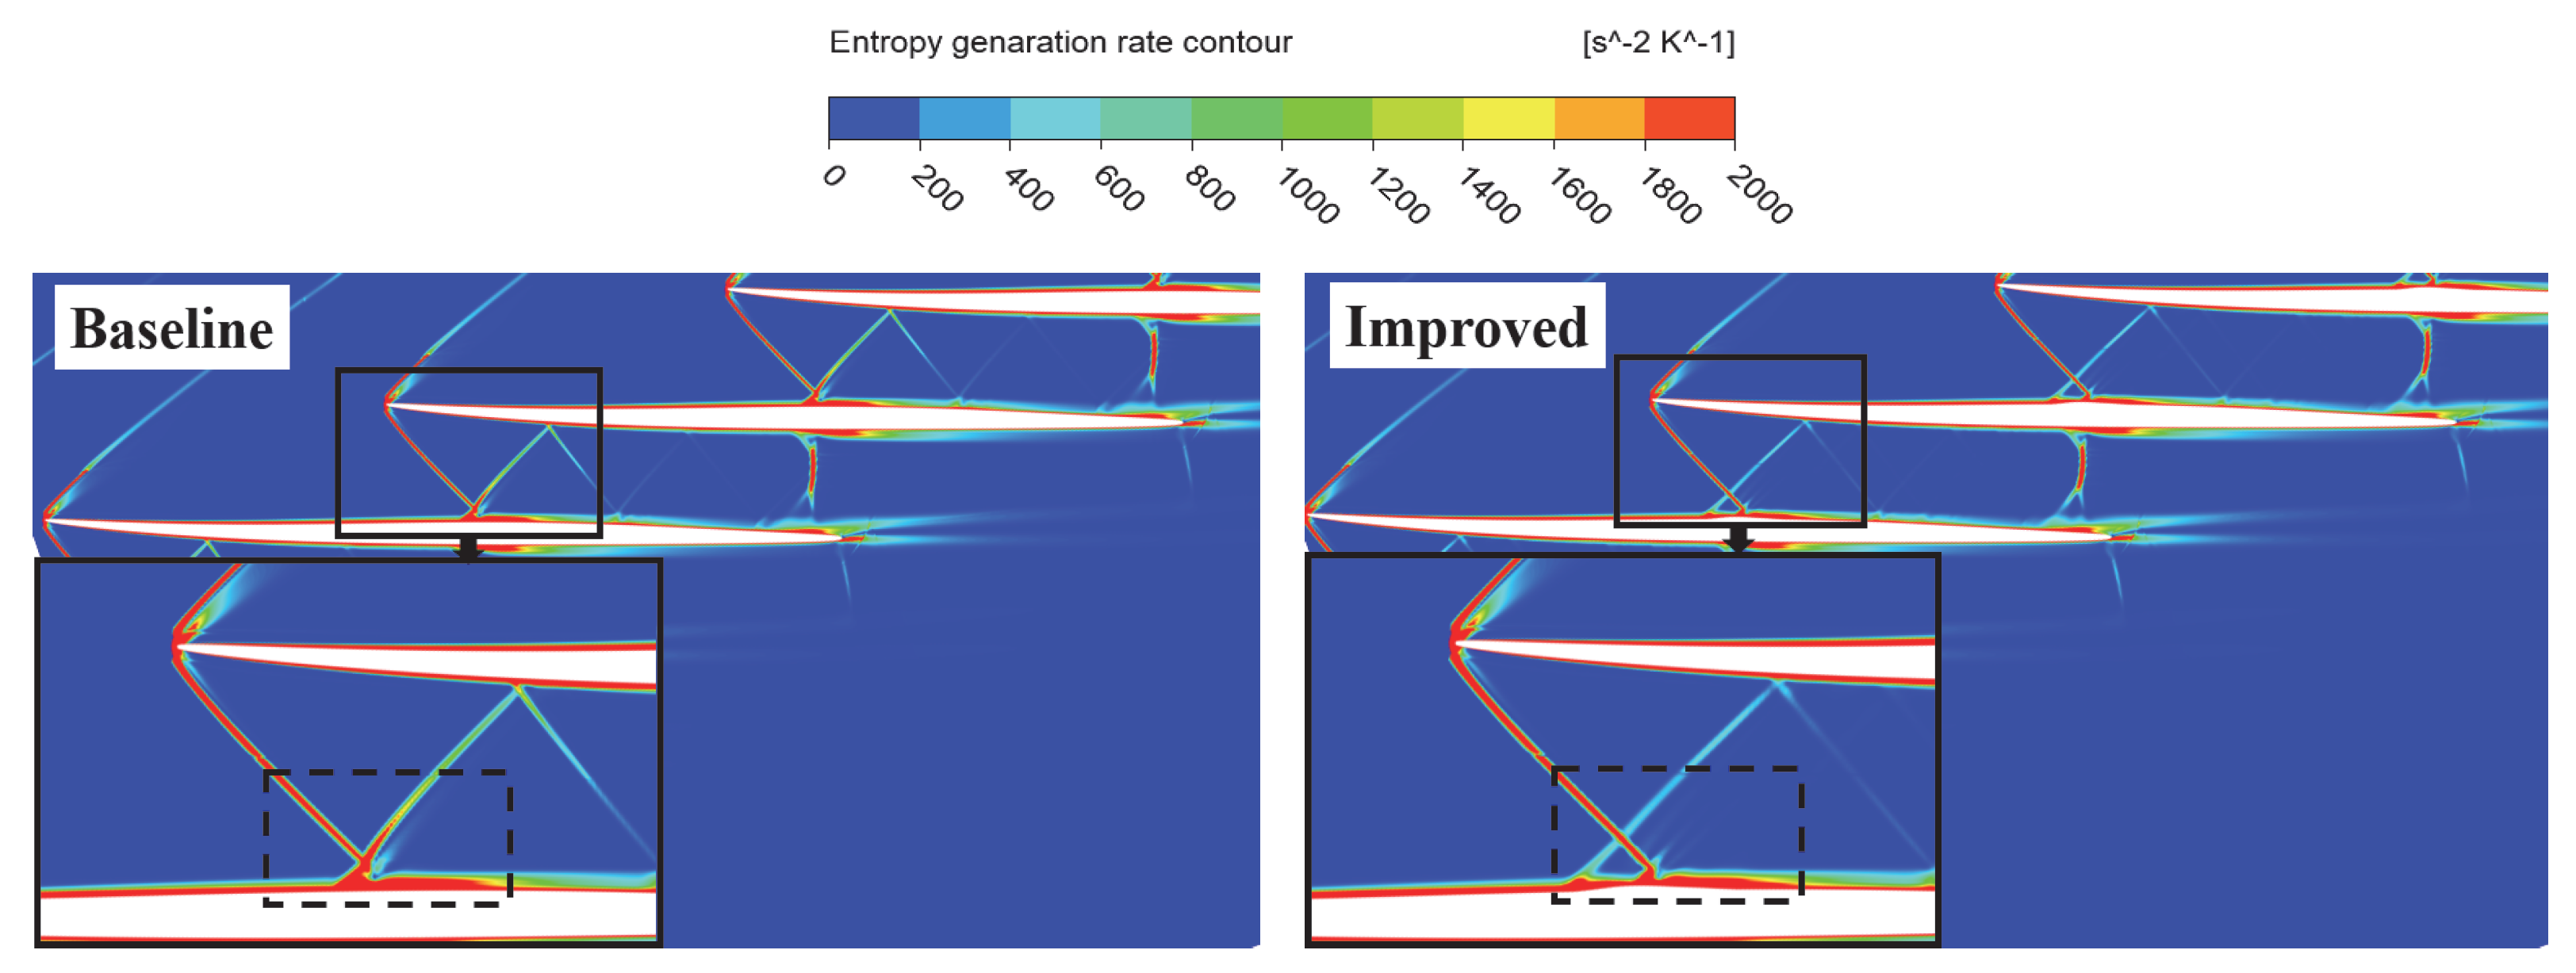
Under design conditions, the negative-curvature ramp splits the first-passage shock foot into a series of compression waves and a weaker-passage shock foot, which reduces the strong adverse-pressure gradient generated by the shock. The shock-induced flow separation is significantly suppressed, resulting in less loss from the interaction between the shockwave and the boundary layer;
(2)
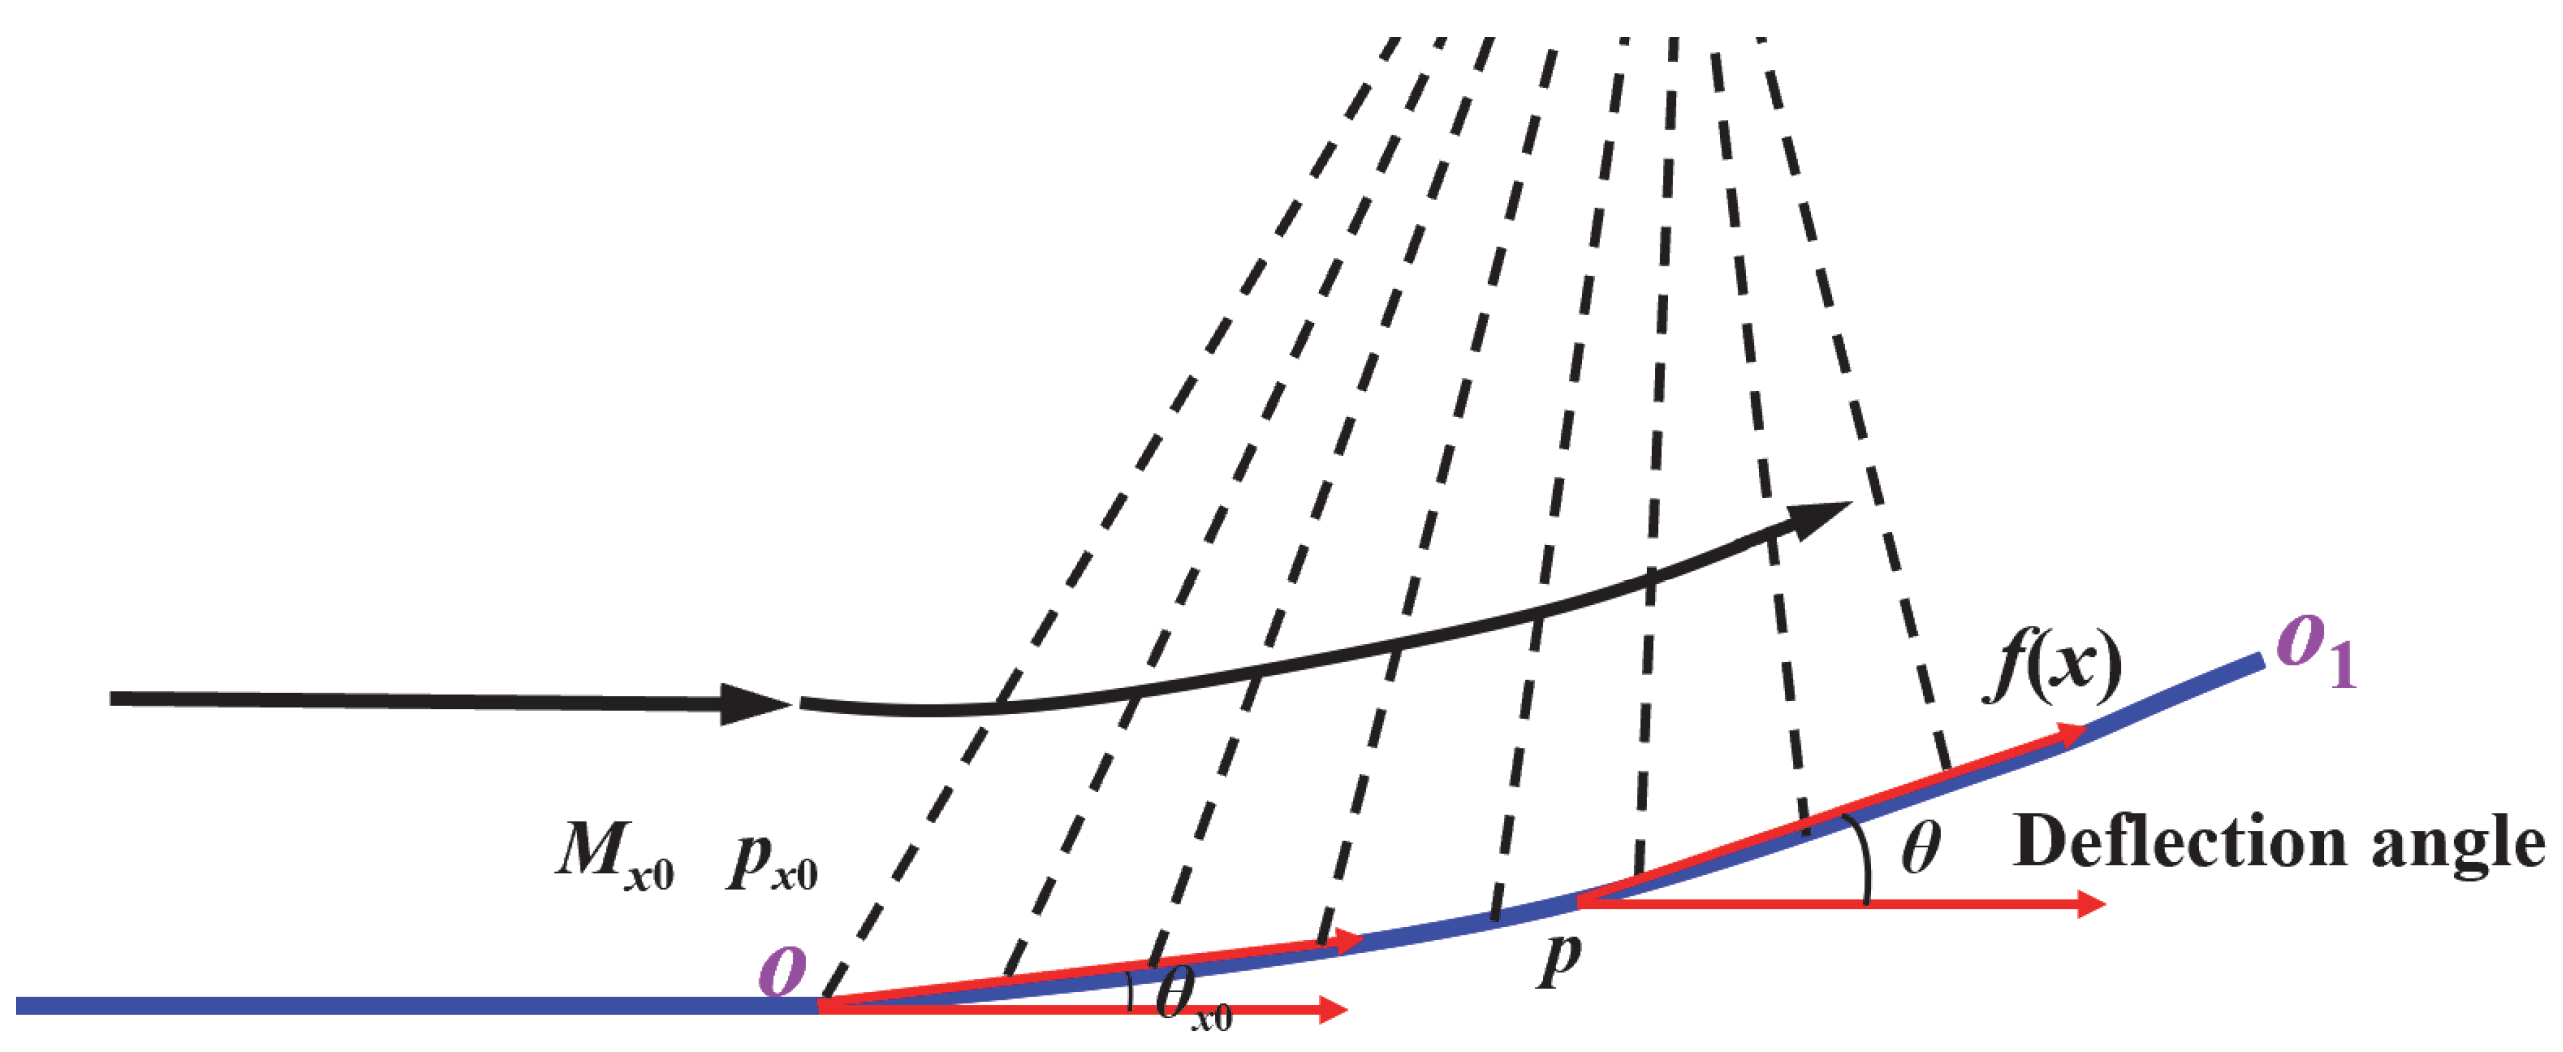
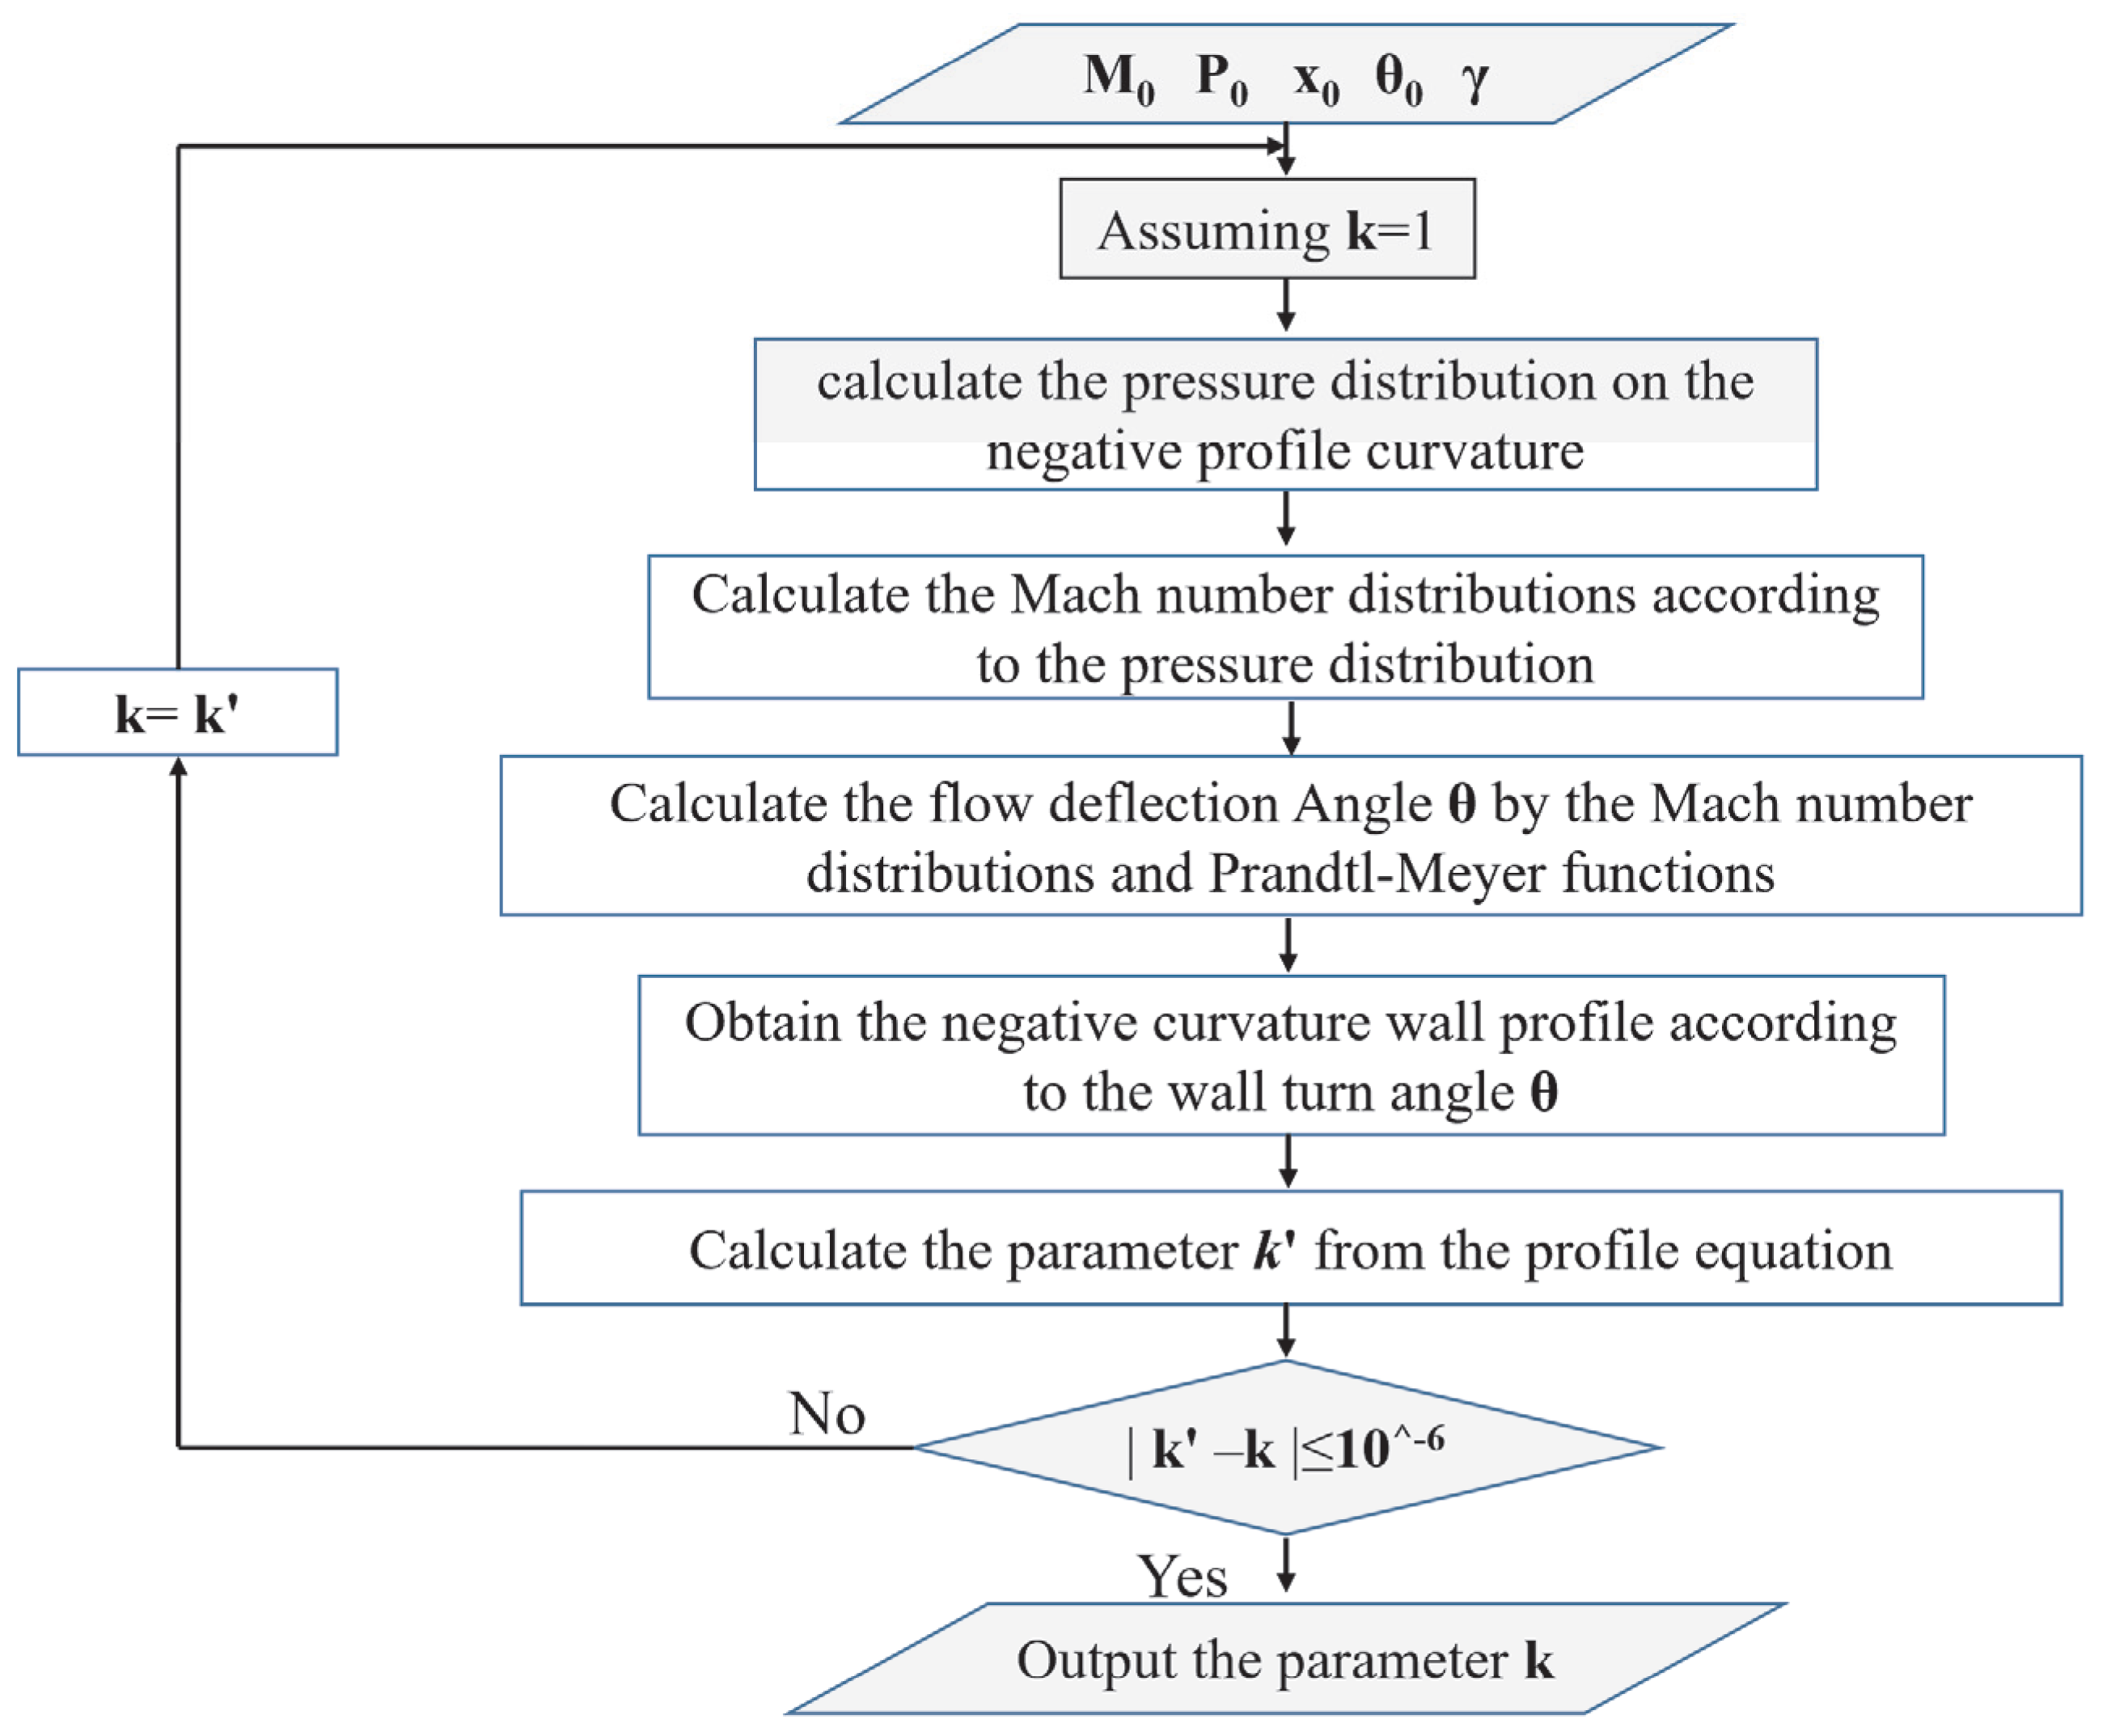
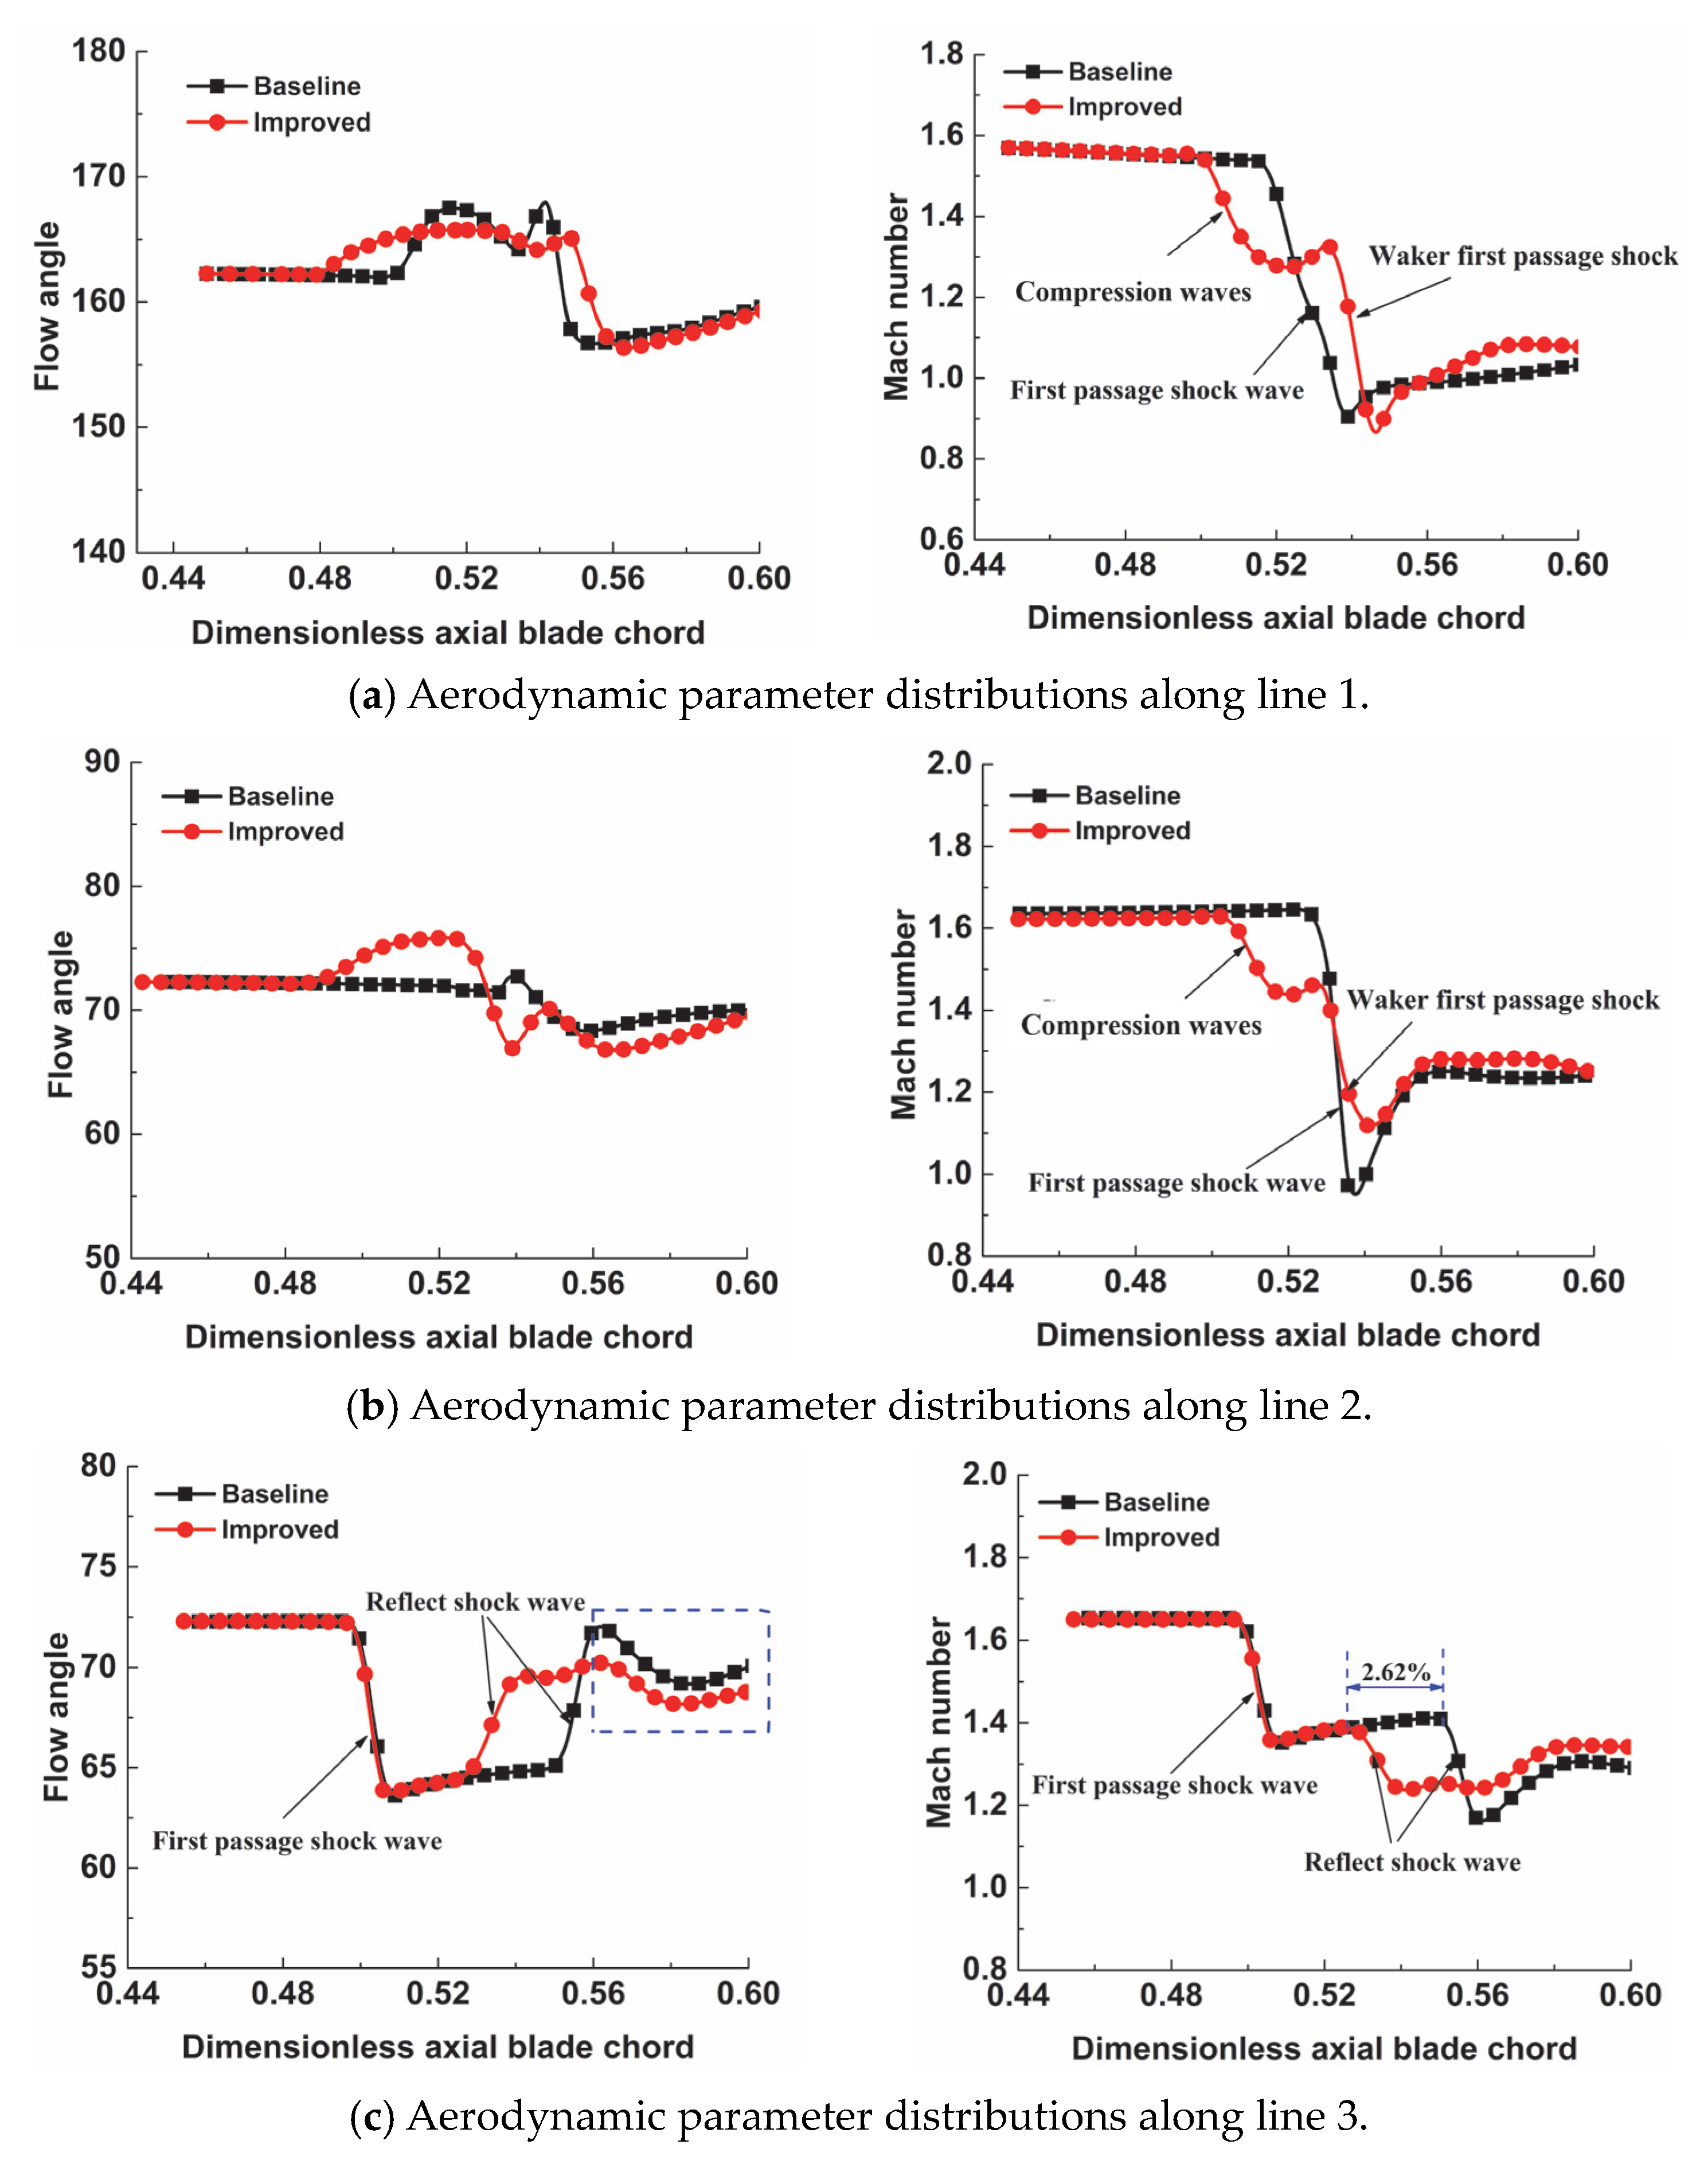
The heavy adverse-pressure gradient induced by the first-passage shock of the improved cascade is divided into three sections with a moderate pressure rise. There is an increasing tendency with a constant pressure gradient on the negative-curvature profile, which demonstrates the feasibility of the initial design method;
(3)
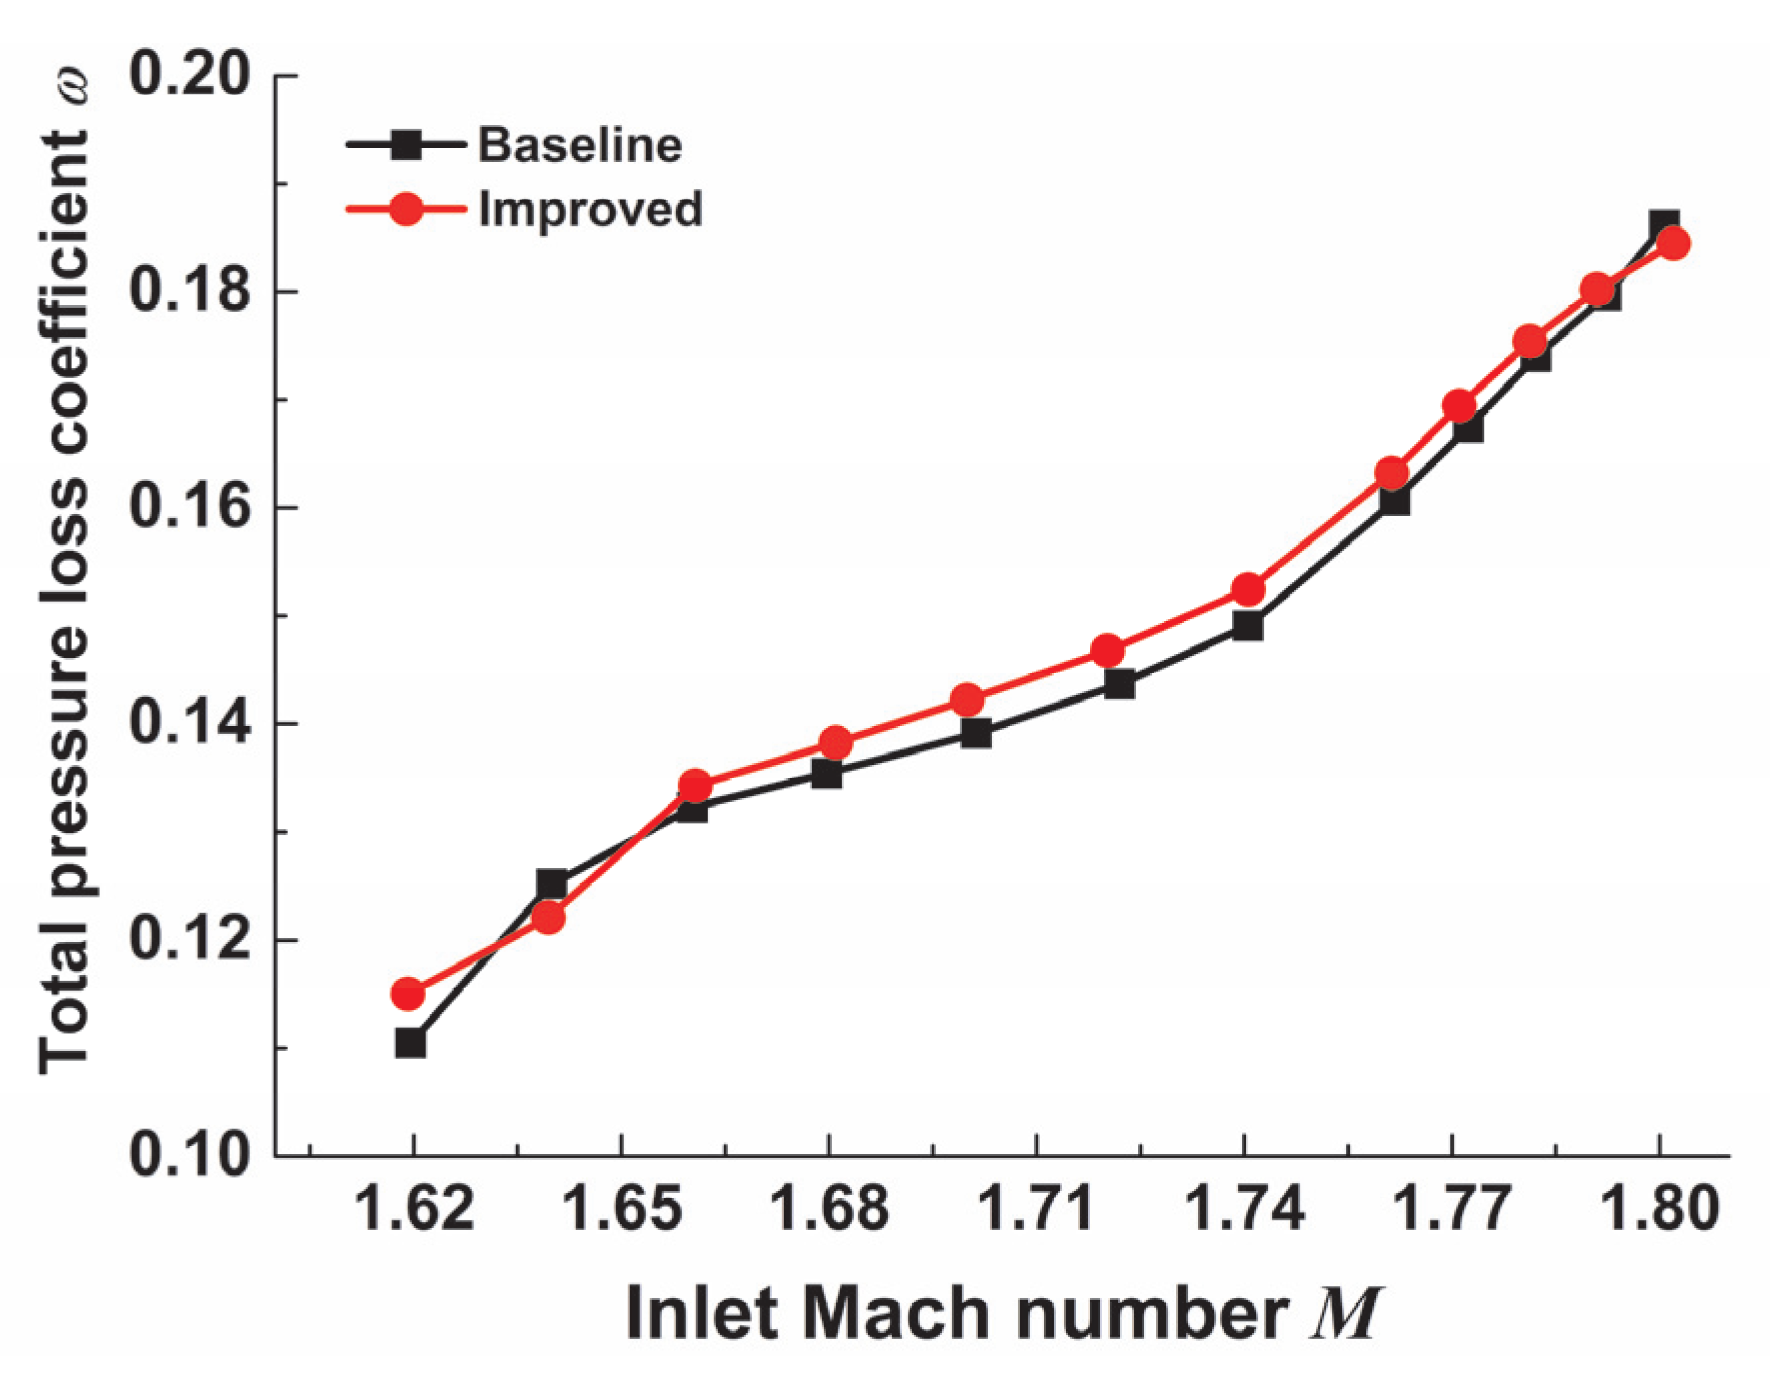
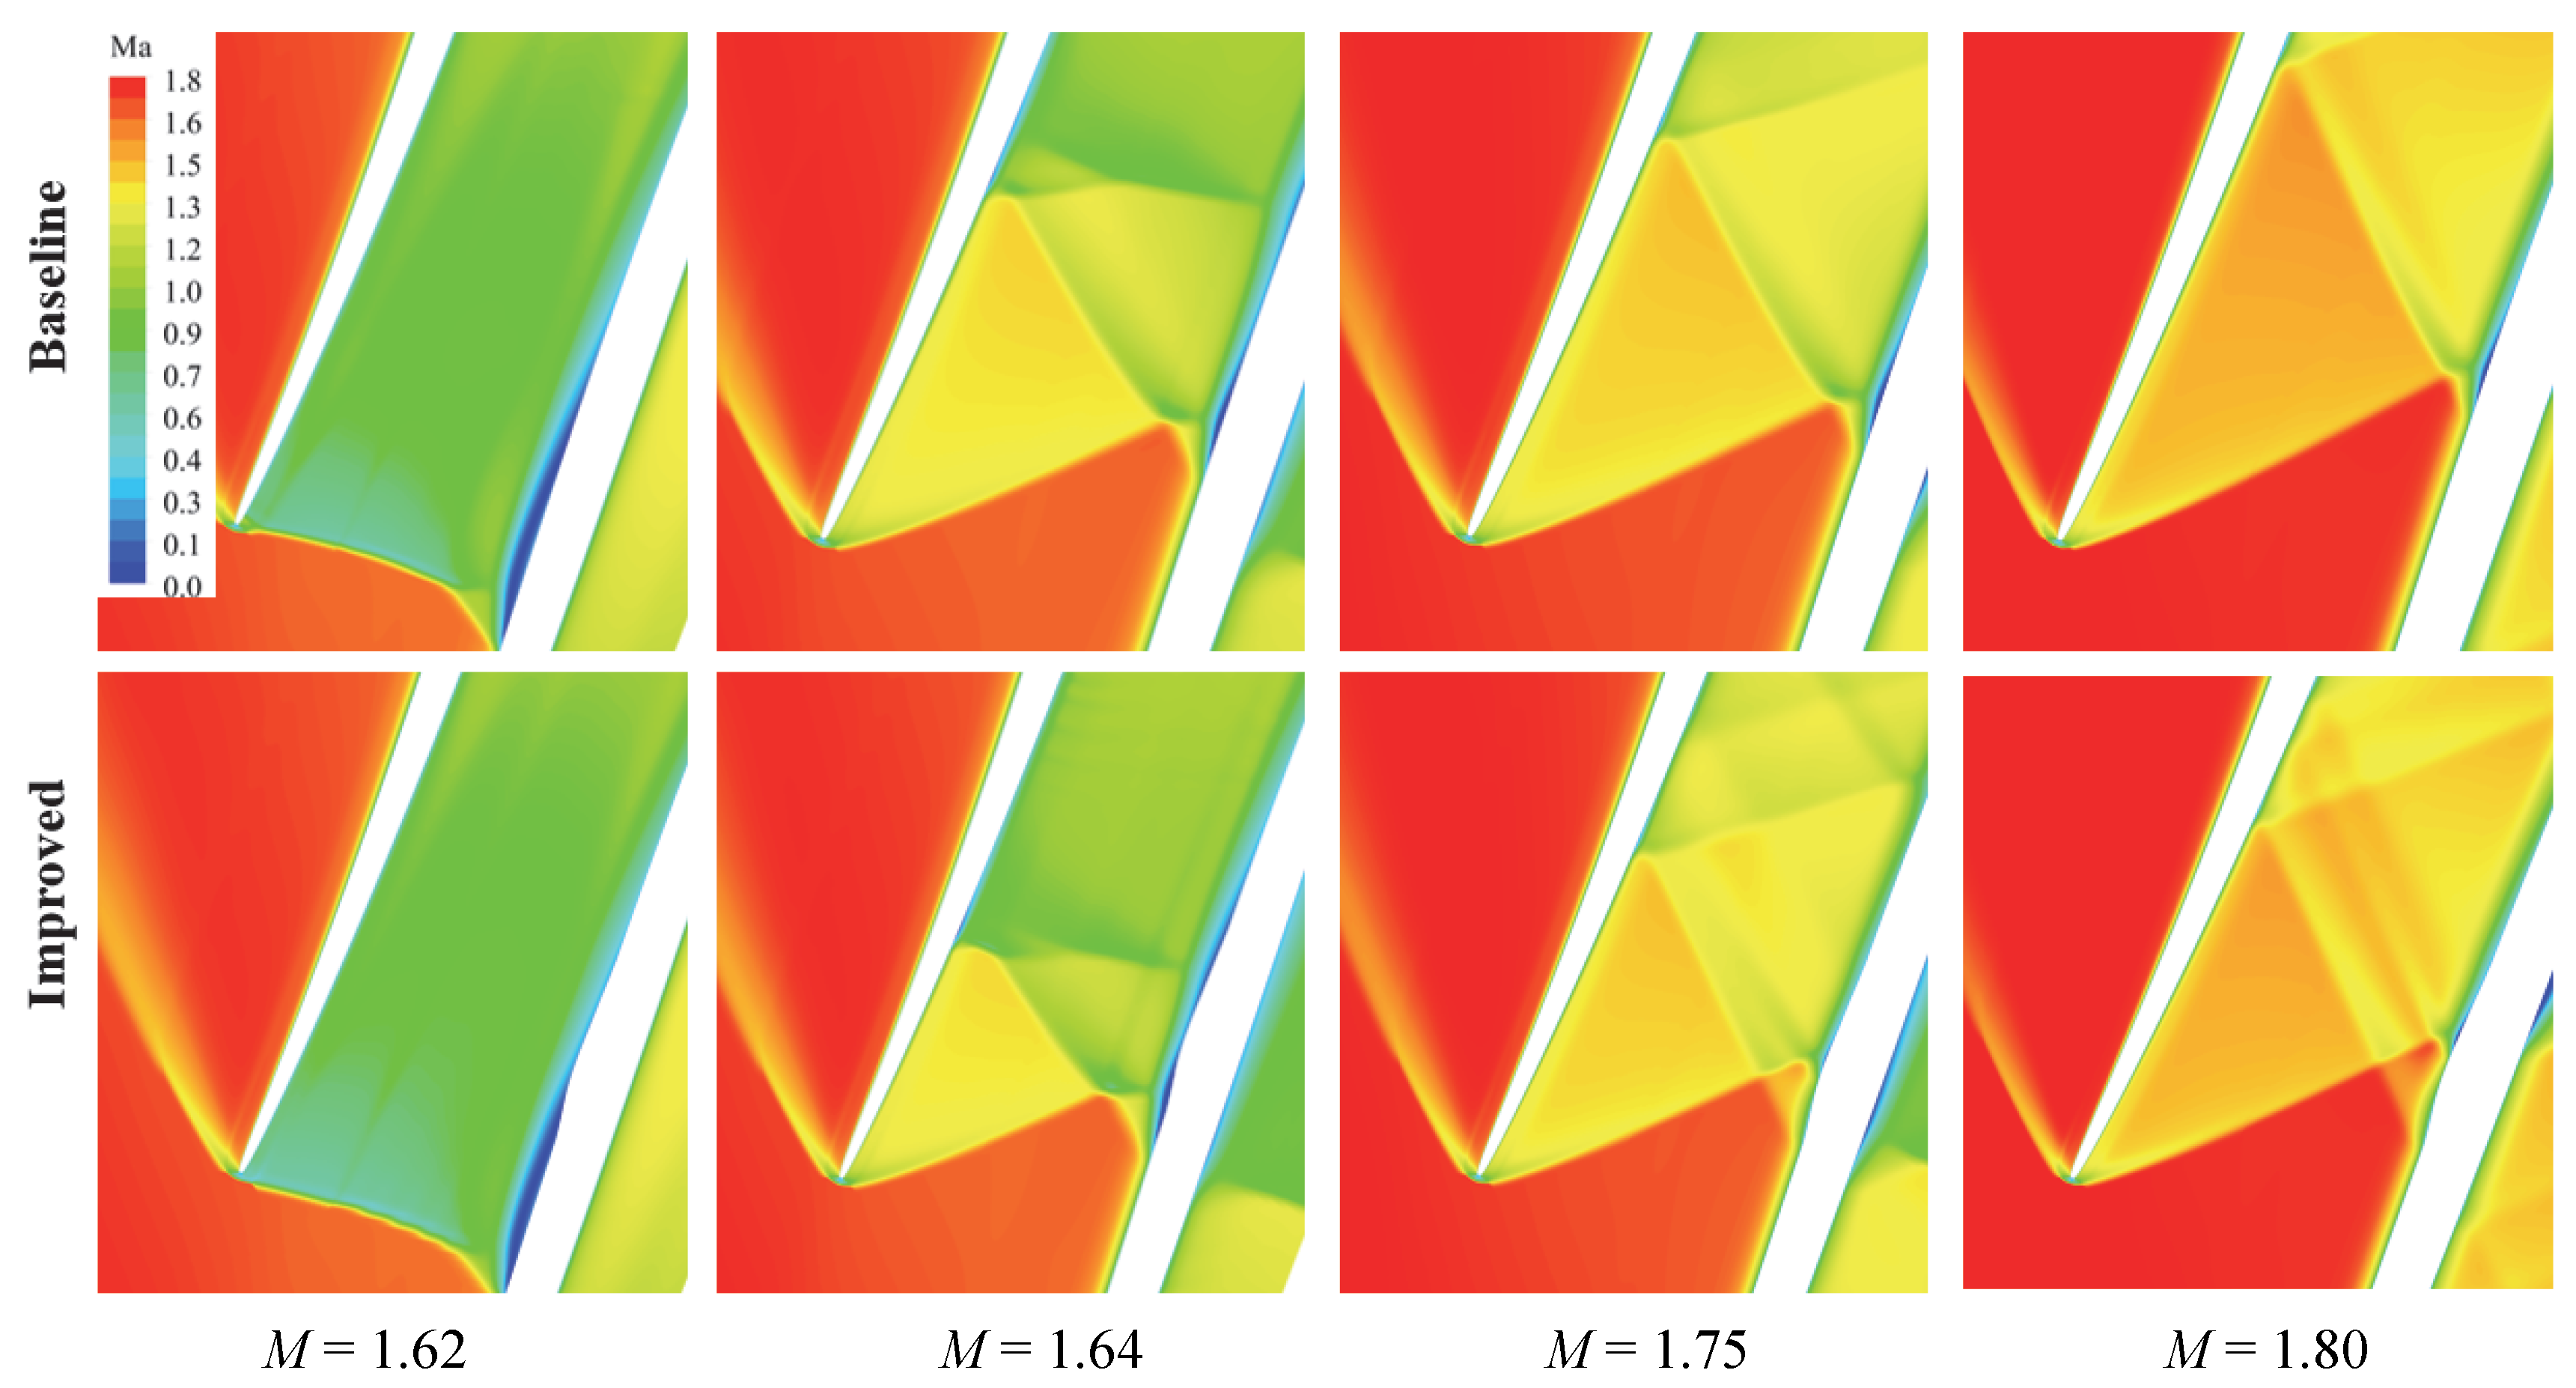
Under off-design conditions, the overall aerodynamic performance of the improved supersonic compressor cascade is superior to that of the baseline cascade at various inlet Mach numbers and exit pressure conditions, and the negative-curvature smooth ramp is compatible to some extent.
It should be noted that the design method of the negative-curvature profile with a constant adverse pressure may not be the best scheme. An optimized design method and experimental verification of the local negative-curvature section will be investigated in subsequent research. The control effects of different local negative-curvature profiles and multiple individual three-dimensional negative-curvature structures on the shock-induced separation will be compared and analyzed. Finally, the design method will be improved and modified according to the experimental data.

Author Contributions

Conceptualization, Q.Z.; Methodology, Y.L. and J.X.; Software, Z.F.; Formal analysis, Q.Z.; Investigation, Y.L.; Data curation, Z.F.; Writing—original draft, Y.L.; Writing—review & editing, W.C.; Supervision, J.X.; Project administration, Q.Z.; Funding acquisition, W.C. All authors have read and agreed to the published version of the manuscript.

Funding

This research was funded by the national natural science foundation of China grant number [52076124].

Institutional Review Board Statement

Not applicable.

Informed Consent Statement

Not applicable.

Data Availability Statement

The raw data supporting the conclusions of this article will be made available by the authors on request.

Acknowledgments

This work has been carried out with the support of the National Natural Science Foundation of China (No. 52076124). The authors would like to thank them for funding this work and for their permission to publish this paper.

Conflicts of Interest

The authors declare no conflicts of interest.

Nomenclature

aSpeed of sound
CpStatic pressure coefficient
HBoundary layer shape factor
lVane chord length, mm
MMach number
PPressure, Pa
P*Total pressure, Pa
RLELeading-edge radius, mm
RTETrailing-edge radius, mm
sSolidity, l/t
S ˙ g e n Entropy generation rate
tVane spacing, mm
TTemperature, K
uVelocity, m/s
βFlow angle, deg
βsStagger angle, deg
γRatio of specific heats
θCamber angle, deg
ωTotal pressure loss coefficient
Subscripts
0Position at point “O”
1Inlet plane
2Outlet plane

References

  1. Wennerstrom, A.J. Highly loaded axial flow compressors: History and current developments. J. Turbomach. 1990, 112, 567–578. [Google Scholar] [CrossRef]
  2. Biollo, R.; Benini, E. Recent advances in transonic axial compressor aerodynamics. Prog. Aerosp. Sci. 2013, 56, 1–18. [Google Scholar] [CrossRef]
  3. Denton, J.D. Loss mechanisms in turbomachines. J. Turbomach. 1993, 115, 621–656. [Google Scholar] [CrossRef]
  4. Saito, S.; Furukawa, M.; Yamada, K.; Watanabe, K.; Matsuoka, A.; Niwa, N. Mechanisms and Quantitative Evaluation of Flow Loss Generation in a Multi-Stage Transonic Axial Compressor. In Proceedings of the ASME Turbo Expo 2019, Phoenix, AZ, USA, 17–21 June 2019. ASME Paper GT2019-90439. [Google Scholar] [CrossRef]
  5. Burguburu, S.P.; Toussaint, C.; Bonhomme, C.; Leroy, G. Numerical optimization of turbomachinery bladings. J. Turbomach. 2004, 126, 91–100. [Google Scholar] [CrossRef]
  6. Xu, W.; Du, X.; Tao, C.; Wang, S.; Wang, Z. Correlation of solidity, aspect ratio and compound lean vane in compressor cascade design. Appl. Therm. Eng. 2019, 150, 175–192. [Google Scholar] [CrossRef]
  7. Green, J.E. Interactions between shock waves and turbulent boundary layers. Prog. Aerosp. Sci. 1970, 11, 235–340. [Google Scholar] [CrossRef]
  8. Inger, G.R. Transonic shock/turbulent boundary-layer interaction on curved surfaces. J. Aircr. 1983, 20, 571–574. [Google Scholar] [CrossRef]
  9. Brouwer, K.R.; Gogulapati, A.; McNamara, J.J. Interplay of Surface Deformation and Shock-Induced Separation in Shock/Boundary-Layer Interactions. AIAA J. 2017, 55, 4258–4273. [Google Scholar] [CrossRef]
  10. Hoffmann, P.H.; Muck, K.C.; Bradshaw, P. The effect of concave surface curvature on turbulent boundary layers. J. Fluid Mech. 1985, 161, 371–403. [Google Scholar] [CrossRef]
  11. Swearingen, J.D.; Blackwelder, R.F. The growth and breakdown of streamwise vortices in the presence of a wall. J. Fluid Mech. 1987, 182, 255–290. [Google Scholar] [CrossRef]
  12. Tandiono; Winoto, S.H.; Shah, D.A. On the linear and nonlinear development of Görtler vortices. Phys. Fluids 2008, 20, 094103. [Google Scholar] [CrossRef]
  13. Wang, Q.C.; Wang, Z.G. Structural characteristics of the supersonic turbulent boundary layer subjected to concave curvature. Appl. Phys. Lett. 2016, 108, 114102. [Google Scholar] [CrossRef]
  14. Sun, M.; Sandham, N.D.; Hu, Z. Turbulence structures and statistics of a supersonic turbulent boundary layer subjected to concave surface curvature. J. Fluid Mech. 2019, 865, 60–99. [Google Scholar] [CrossRef]
  15. Tai, T.C. Theoretical Aspects of Dromedaryfoil, Report 77-0104; Technical report; David, W., Ed.; Taylor Naval Ship Research and Development Center: Bethesda, MD, USA, 1997. [Google Scholar]
  16. Bruce, P.J.K.; Colliss, S.P. Review of research into shock control bumps. Shock Waves 2015, 25, 451–471. [Google Scholar] [CrossRef]
  17. Bruce, P.J.K.; Babinsky, H. Experimental study into the flow physics of three-dimensional shock control bumps. J. Aircr. 2012, 49, 1222–1233. [Google Scholar] [CrossRef]
  18. Tian, Y.; Liu, P.Q.; Feng, P.H. Shock control bumps parametric research on supercritical airfoil. Technol. Sci. 2011, 54, 2935–2944. [Google Scholar] [CrossRef]
  19. Mazaheri, K.; Nejati, A.; Kiani, K.C.; Taheri, R. The application of the gradient-based adjoint multi-point optimization of single and double shock control bumps for transonic airfoils. Shock Waves 2016, 26, 491–511. [Google Scholar] [CrossRef]
  20. Mazaheri, K.; Kiani, K.C.; Nejati, A.; Zeinalpour, M.; Taheri, R. Optimization and analysis of shock wave/boundary-layer interaction for drag reduction by Shock control bumps. Aerosp. Sci. Technol. 2015, 42, 196–208. [Google Scholar] [CrossRef]
  21. Pätzold, M.; Lutz, T.; Krämar, E.; Wagner, S. Numerical Optimization of Finite Shock Control Bumps. In Proceedings of the 44th AIAA Aerospace Sciences Meeting and Exhibit, Reno, NV, USA, 9–12 January 2006; AIAA: Reston, VA, USA, 2006; p. 1054. [Google Scholar]
  22. König, B.; Pätzold, M.; Lutz, T.; Krämer, E.; Rosemann, H.; Richter, K.; Uhlemann, H. Numerical and experimental validation of three-dimensional shock control bumps. J. Aircr. 2009, 46, 675–682. [Google Scholar] [CrossRef]
  23. Ogawa, H.; Babinsky, H. Shock-Wave/Boundary-Layer Interaction Control Using Three-Dimensional Bumps for Transonic Wings. AIAA J. 2008, 46, 1442–1452. [Google Scholar] [CrossRef]
  24. Zhang, Y.; Tan, H.J.; Tian, F.C. Control of incident shock/boundary-layer interaction by a two-dimensional bump. AIAA J. 2014, 52, 767–776. [Google Scholar] [CrossRef]
  25. Zhang, Y.; Tan, H.J.; Sun, S.; Rao, C.Y. Control of cowl shock/boundary-layer interaction in hypersonic inlets by bump. AIAA J. 2015, 53, 3492–3496. [Google Scholar] [CrossRef]
  26. Mazaheri, K.; Khatibirad, S. Using a Shock control bumps to Improve the Performance of an Axial Compressor vane Section. Shock Waves 2017, 27, 299–312. [Google Scholar] [CrossRef]
  27. Mazaheri, K.; Khatibirad, S. Optimization of bump and blowing to control the flow through a transonic compressor vane cascade. Shock Waves 2018, 8, 285–297. [Google Scholar] [CrossRef]
  28. John, A.; Shahpar, S.; Qin, N. Alleviation of shock-wave effects on a highly loaded axial compressor through novel vane shaping. In Proceedings of the ASME Turbo Expo 2016, Seoul, Republic of Korea, 13–17 June 2016. ASME Paper GT2016-57550. [Google Scholar] [CrossRef]
  29. John, A.; Qin, N.; Shahpar, S. Using shock control bumps to improve transonic fan/compressor vane performance. J. Turbomach. 2019, 141, 081003. [Google Scholar] [CrossRef]
  30. Liu, Y.Z.; Zhao, W.; Zhao, Q.J.; Zhou, Q.; Xu, J.Z. Passage shock wave/boundary layer interaction control for transonic compressors using bumps. Chin. J. Aeronaut. 2022, 35, 82–97. [Google Scholar] [CrossRef]
  31. Babinsky, H.; Harvey, J.K. Shock Wave-Boundary-Layer Interactions; Cambridge University Press: Cambridge, UK, 2011; Available online: https://www.cambridge.org/9780521848527 (accessed on 10 May 2025).
  32. Drayna, T.; Nompelis, I.; Candler, G. Hypersonic Inward Turning Inlets: Design and Optimization. In Proceedings of the 44th AIAA Aerospace Sciences Meeting and Exhibit, Reno, NV, USA, 9–12 January 2006; AIAA: Reston, VA, USA, 2006; p. 297. [Google Scholar]
  33. Venturelli, G.; Benini, E. Kriging-assisted design optimization of S-shape supersonic compressor cascades. Aerosp. Sci. Technol. 2016, 58, 275–297. [Google Scholar] [CrossRef]
  34. Casoni, M.; Magrini, A.; Benini, E. Supersonic Compressor Cascade Shape Optimization under Multiple Inlet Mach Operating Conditions. Aerospace 2019, 6, 64. [Google Scholar] [CrossRef]
  35. Mowatt, S.; Skews, B. Three-dimensional shock wave/boundary layer interactions. Shock Waves 2011, 21, 467. [Google Scholar] [CrossRef]
  36. Wilcox, D.C. Turbulence Modelling for CFD; DCW Industries: La Canada, CA, USA, 2004. [Google Scholar] [CrossRef]
  37. Menter, F. Two-Equation Eddy-Viscosity Turbulence Models for Engineering Applications. AIAA J. 1994, 32, 1598–1605. [Google Scholar] [CrossRef]
  38. Acquaye, F.; Li, J.; Wray, T.; Agarwal, R.K. Validation of the Wray-Agarwal Turbulence Model for Shock-Wave Boundary Layer Interaction Flows. In Proceedings of the 46th AIAA Fluid Dynamics Conference, Washington, DC, USA, 13–17 June 2016; AIAA: Reston, VA, USA, 2016; p. 3477. [Google Scholar] [CrossRef]
  39. Smirnov, N.N.; Betelin, V.B.; Nikitin, V.F.; Stamov, L.I.; Altoukhov, D.I. Accumulation of errors in numerical simulations of chemically reacting gas dynamics. Acta Astronaut. 2015, 117, 338–355. [Google Scholar] [CrossRef]
  40. Greizer, E.M.; Tan, C.S.; Graf, M.B. Internal Flow: Concepts and Applications; Cambridge University Press: New York, NY, USA, 2004; Available online: https://www.cambridge.org/9780521343930 (accessed on 10 May 2025).
Figure 1. Cascade geometric parameters of baseline profile.
Applsci 15 05664 g001
Figure 2. Structure of interaction between shockwave and boundary layer.
Applsci 15 05664 g002
Figure 3. Improvement in local wall curvature.
Applsci 15 05664 g003
Figure 4. Negative-curvature profile with a constant pressure gradient.
Applsci 15 05664 g004
Figure 5. The process of negative-curvature wall profile calculation.
Applsci 15 05664 g005
Figure 6. Supersonic compressor cascade with 6 vanes.
Applsci 15 05664 g006
Figure 7. Test section of supersonic compressor cascade wind tunnel.
Applsci 15 05664 g007
Figure 8. Calculation domain of cascade.
Applsci 15 05664 g008
Figure 9. Analysis of computational mesh independence with different mesh nodes.
Applsci 15 05664 g009
Figure 10. Experimental schlieren photographs of the cascade flow for M = 1.75 and different static pressure ratios.
Applsci 15 05664 g010
Figure 11. Vane isentropic Mach number distributions at an inlet Mach number of 1.75 with a static pressure ratio of 2.52.
Applsci 15 05664 g011
Figure 12. Calculated unique incidence curve.
Applsci 15 05664 g012
Figure 13. Mass-averaged aerodynamic parameters at the exit plane.
Applsci 15 05664 g013
Figure 14. Mach number contours of both cascades.
Applsci 15 05664 g014
Figure 15. Shock function contours of both cascades.
Applsci 15 05664 g015
Figure 16. Variation in flow angle and Mach number along lines 1, 2, and 3 of both cascades.
Applsci 15 05664 g016
Figure 17. Static pressure coefficient distributions on vane suction side of both cascades.
Applsci 15 05664 g017
Figure 18. Contours of entropy generation rate.
Applsci 15 05664 g018
Figure 19. Incompressible shape factor distributions near the first-passage shock incident position of both cascades.
Applsci 15 05664 g019
Figure 20. Variation in total pressure loss coefficients with different inlet Mach numbers.
Applsci 15 05664 g020
Figure 21. Mach number contours with different inlet Mach numbers.
Applsci 15 05664 g021
Figure 22. Variation in total pressure loss coefficient at different static pressure ratios.
Applsci 15 05664 g022
Figure 23. Mach number contours with different static pressure ratios.
Applsci 15 05664 g023
Table 1. Key geometric parameters of supersonic compressor cascade.
Upstream Mach numberM11.75
Soliditys = l/t2.21
Upstream flow angle, degβ170.5
Camber angle, degθ−2.5
Stagger angle, degβs69.5
Vane chord length, mml155
Vane spacing, mmt70
Leading-edge radius, mmRLE0.2
Trailing-edge radius, mmRTE0.2
Table 2. Detailed design parameters of the negative-curvature profile.
Initiation Position
(Chord)
Length
(mm)
Flow Deflection Angle
(deg)
Adverse Pressure Gradient
k (Pa/m)
0.495.18.21.39 × 107
Table 3. Boundary condition setting for numerical calculation.
Boundary ConditionsSetting
InletTotal temperature, total pressure, and velocity
OutletStatic pressure
WallNonslip and adiabatic wall
Turbulence modelSST(kω)
FluidIdeal gas
PeriodicityTranslational periodicity
InitializationInlet parameters
Table 4. Aerodynamic performance parameters of both cascades under design conditions.
Baseline CascadeImproved CascadeDifferences (%)
M20.860.871.16%
β273.7573.69−0.03%
ω0.1420.1354−4.6%
Table 5. Comparison of the loss breakdown in the SWBLI region.
BaselineImprovedDeviation
Relative Absolute
Boundary layer loss0.9660.908−6.0%−5.8%
First-passage shock foot loss0.0220.020−9.1%−0.2%
Reflected shock loss0.0120.008−33.3%−0.4%
Total loss10.936−6.4%−6.4%
Disclaimer/Publisher’s Note: The statements, opinions and data contained in all publications are solely those of the individual author(s) and contributor(s) and not of MDPI and/or the editor(s). MDPI and/or the editor(s) disclaim responsibility for any injury to people or property resulting from any ideas, methods, instructions or products referred to in the content.

