1. Introduction
With the accelerated urbanization process, underground engineering structures, such as metro systems, utility tunnels, and deeply buried tunnels, serve as critical components of national infrastructure, drawing significant attention to their seismic performance. Under seismic loading, underground structures are prone to severe damage or even progressive collapse due to the complexity of the soil–structure interaction (SSI). Historical seismic events such as the 1995 Great Hanshin earthquake in Japan [
1] and the 2008 Wenchuan earthquake in China [
2] revealed the substantial seismic risk associated with underground infrastructure. Consequently, the development of efficient and accurate analytical methods for evaluating the seismic responses of underground structures has become an urgent requirement for enhancing engineering safety and advancing disaster prevention and mitigation strategies.
Current seismic analysis methods for underground structures can be divided into two main categories: the dynamic time history method and simplified practical methods. The dynamic time history method, which directly solves dynamic differential equations to obtain structural seismic responses [
3,
4], is highly accurate in simulating the time-dependent dynamic behavior of underground structures. As a result, it has become the most predominant approach for evaluating the seismic performance of underground structures. However, its computational complexity and inefficiency often limit its applicability in the analysis of large-scale engineering projects. Recent advancements have introduced incremental dynamic analysis (IDA) as an extension of dynamic methodologies. By gradually modulating the amplitude of earthquake motion intensity [
5], IDA can be used to systematically evaluate the seismic performance margin of structures, making it particularly suitable for probabilistic risk assessment. Nevertheless, the resource-intensive nature of such approaches remains a barrier for routine engineering applications. To address these limitations, researchers have developed various quasistatic simplified methods. Among these methods, the response displacement method (RDM) has gained widespread adoption in practical engineering because of its theoretical clarity and computational efficiency. Notably, this method has been codified in the Standard for Seismic Design of Underground Structures (GB/T 51336-2018) [
6], further solidifying its role as a standard approach for underground structural analysis.
The accuracy of the traditional RDM is highly dependent on the rational determination of the equivalent foundation spring stiffness. Focusing on this critical aspect, Li et al. [
7] developed an improved algorithm for calculating foundation spring stiffness tailored to underground structures with rectangular cross-sections, significantly enhancing computational efficiency. Bin et al. [
8,
9] systematically evaluated the precision of six distinct approaches for deriving foundation spring coefficients by modifying load application modes. Their findings demonstrated that methods that independently solve for horizontal and vertical spring coefficients yield optimal accuracy. Ding et al. [
10,
11] conducted a comparative analysis of foundation spring stiffness coefficients determined through the test method, Li’s method, the MIDAS method, and the finite element method. Their study recommended prioritizing experimental methods and proposed applying a safety correction factor of 1.10 to structural internal force calculations to enhance structural integrity. Furthermore, Wang et al. [
12] derived an analytical solution for the foundation modulus incorporating radial–tangential modulus interactions and deformation effects, allowing for a precise and explicit consideration of soil deformation patterns.
To overcome the inherent limitations of traditional methods that rely on foundation spring calculations, researchers have developed multiple enhanced methodologies. Liu et al. [
13,
14,
15] systematically addressed the error sources of the classical RDM and then advanced the Integral Response Deformation Method (IRDM), which integrates the explicit physical concepts and rigorous theoretical framework of the original approach while eliminating traditional foundation spring models. Instead, it employs an integrated soil–structure mechanical model that directly characterizes continuum interactions, thereby eliminating errors associated with spring stiffness calibration and localized spring approximations. Xu et al. [
16] proposed a generalized response displacement method (GRDM) based on a “spring–stratum–structure” framework. This approach effectively mitigates errors caused by inappropriate spring stiffness assignments, particularly for underground structures with complex cross-sectional geometries. An et al. [
17] introduced an improved RDM that accounts for the influence of overlying frame structures on the seismic responses of metro stations. Bao et al. [
18] theoretically demonstrated that equivalent seismic loads induced by peripheral soil stresses in the IRDM can be obtained through a single static analysis of substructure models containing only one soil layer, with minimal influence from soil inertial forces. Building on this foundation, they developed an improved IRDM implementation that eliminates the computation and application of free-field soil inertial forces while maintaining accuracy, thereby streamlining the workflow [
19]. Akira [
20], Zhang et al. [
21], and Yan et al. [
22] proposed the forced response displacement method (FRDM) using a stratum-structure model. This method simplifies seismic action application by treating stratum relative displacements at model boundaries as static inputs for finite element analysis. Expanding on this concept, Chen et al. [
23,
24] proposed the Integral Forced Response Displacement Method (IFRDM), which mitigates load attenuation effects by imposing stratum deformations across entire soil domains.
However, existing methods typically employ fixed or free-field displacement assumptions at the cutoff boundaries, overlooking the radiation effects induced by far-field media on seismic wave propagation. This omission results in discrepancies between computational models and actual seismic environments. Insufficient boundary distances cause computational inaccuracies arising from spurious wave reflections from the far field. Furthermore, current codes lack explicit guidelines for boundary configuration in the IRDM, leading to widespread reliance on empirical estimations in practice. Although expanding the model domain can mitigate boundary effects, it disproportionately increases computational costs.
In response to these challenges, this study systematically investigates the influence of the truncation distance on computational accuracy, establishing quantitative criteria for boundary configuration. By incorporating artificial boundary conditions that simulate the static resistance of semi-infinite foundations and the constraint effects of far-field media, an improved IRDM considering far-field effects is developed. Comparative analyses of representative underground structures demonstrate that the proposed method maintains precision while significantly reducing the computational scale. This methodology provides an innovative solution that balances accuracy and efficiency for the seismic design of underground infrastructure, offering substantial practical implications for advancing safety assessment and disaster mitigation in large-scale underground engineering projects.
2. Introduction to the Integral Response Deformation Method
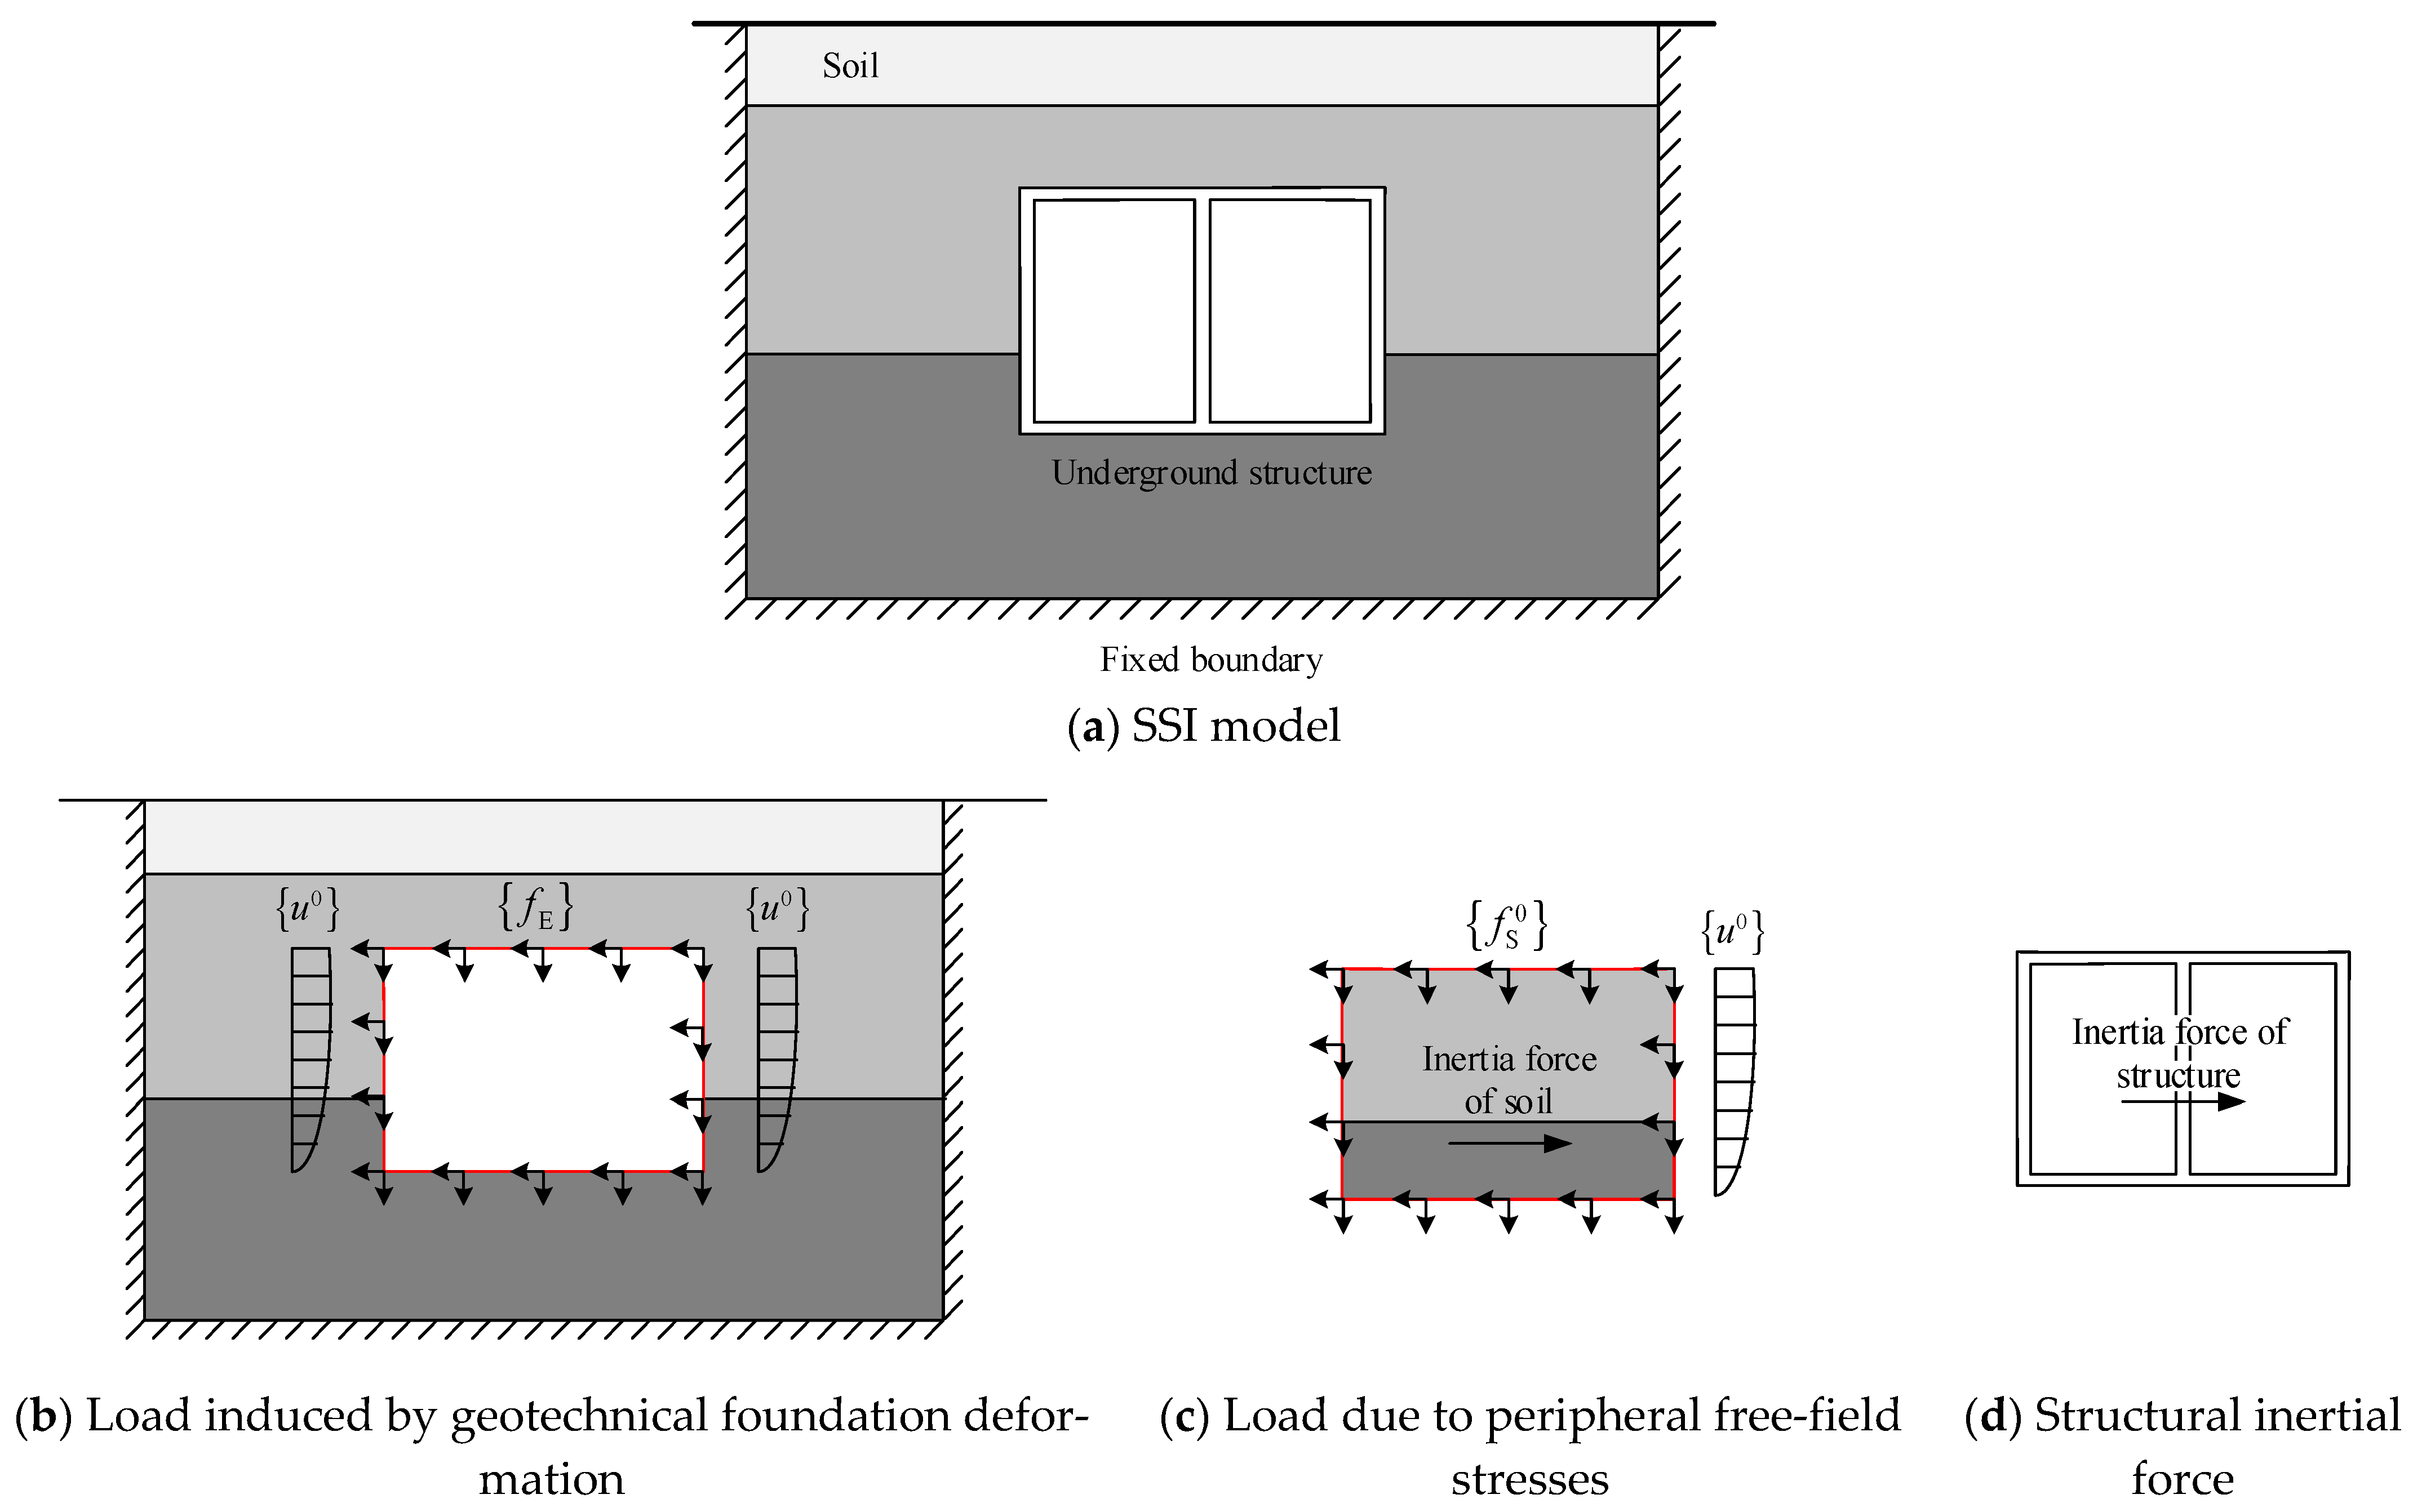
The computational model of the IRDM for underground structures is illustrated in
Figure 1a. On the basis of the fundamental theory of this method, the seismic-induced loads acting on underground structures can be decomposed into three constituent components:
- (1)
Load induced by geotechnical foundation deformation fE:
This component corresponds to the forces required to enforce free-field deformation at all the soil–structure interface nodes in a soil stratum finite element model with the structure removed, as illustrated in
Figure 1b.
- (2)
Load induced by free-field stresses fs0:
This component originates from the stresses in the soil medium surrounding the structure. Specifically, free-field displacements are applied at the boundaries of the free-field model, whereas free-field inertial forces are imposed internally. The resultant nodal reaction forces at the interface S
fs0 can be obtained through static analysis, as shown in
Figure 1c.
- (3)
Structural inertial force:
This load represents the product of the structural mass and seismic acceleration (
Figure 1d).
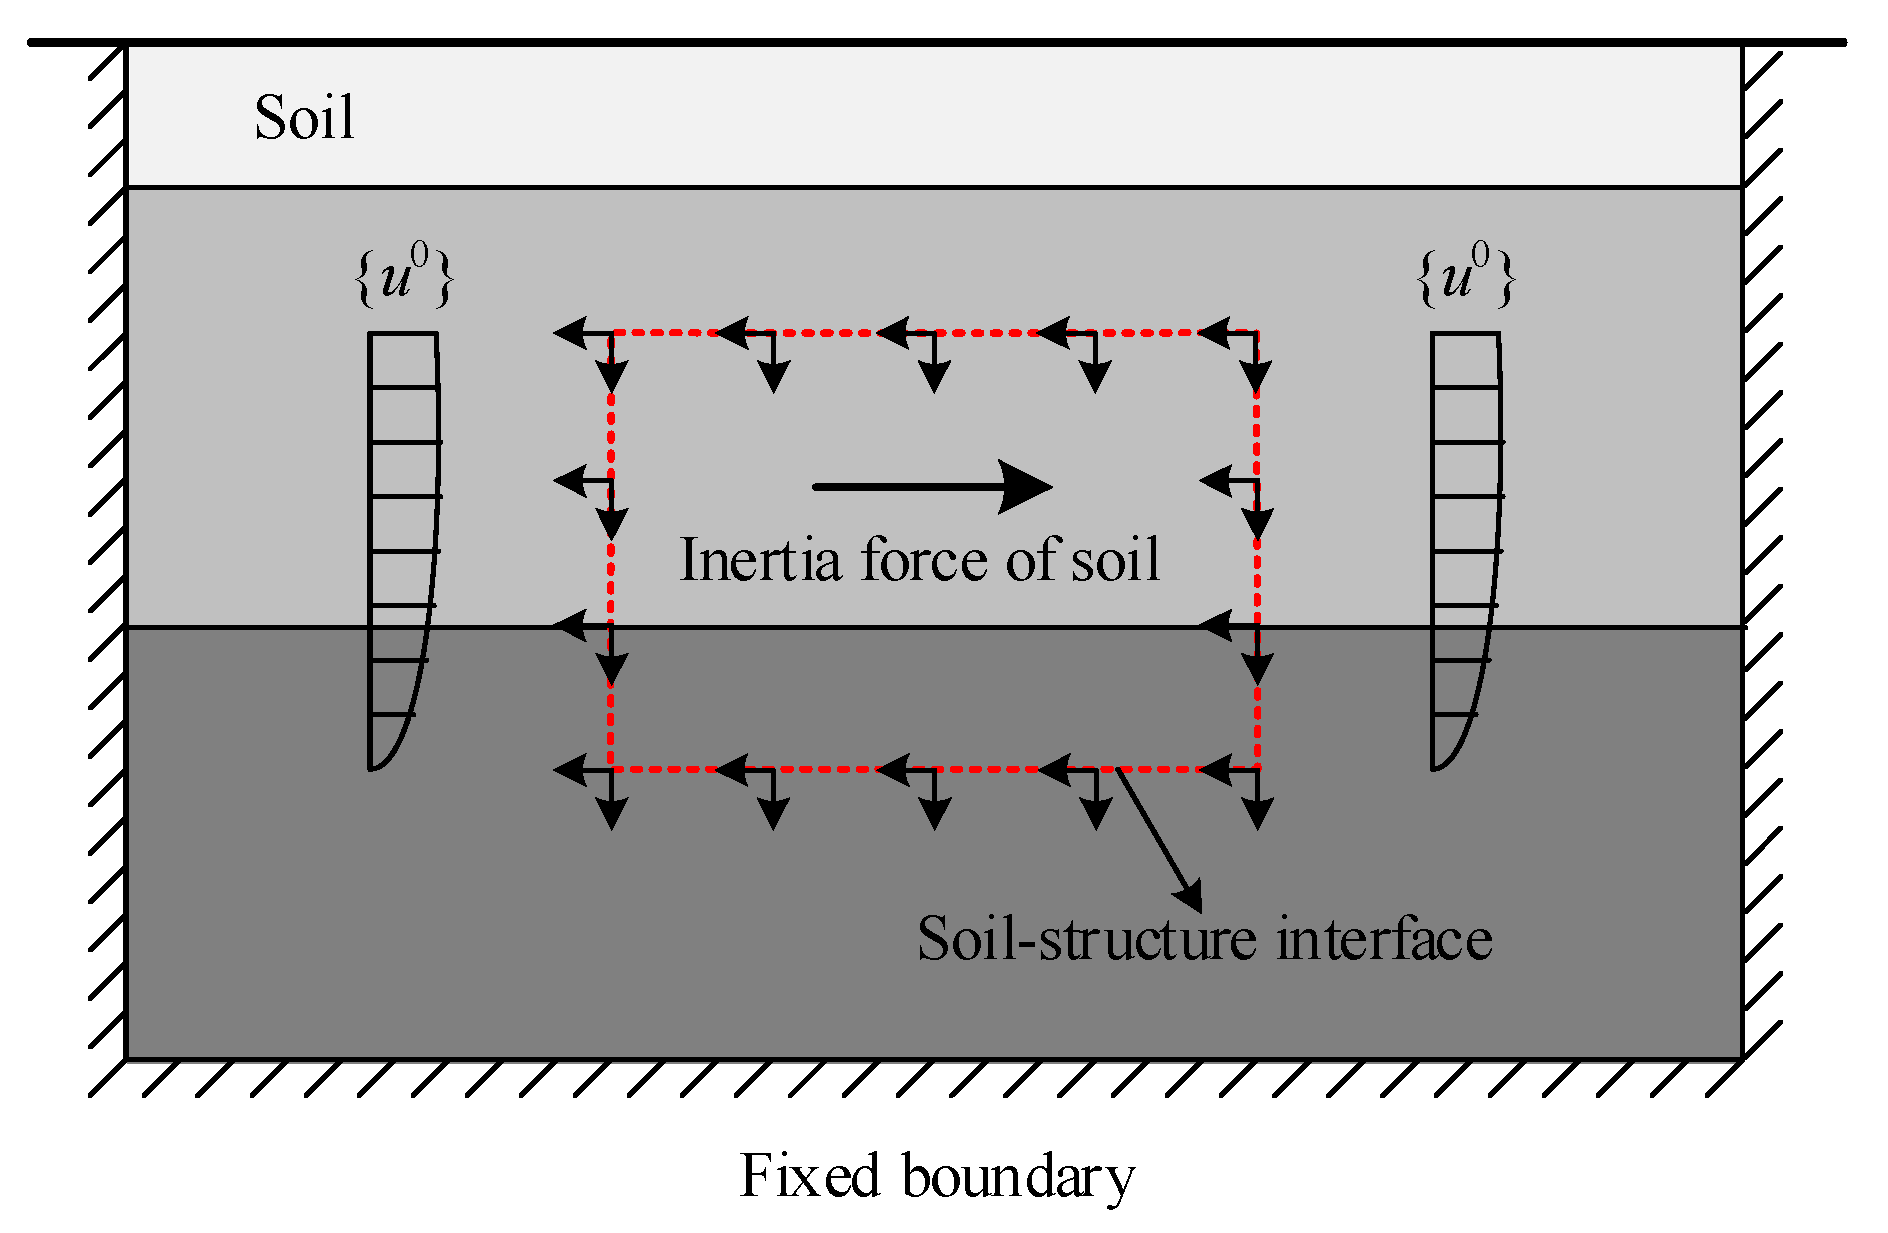
In practical applications of the IRDM for determining the peak seismic responses of underground structures, the first two load components can be combined for calculation. This process is facilitated by the auxiliary free-field model illustrated in
Figure 2, where the structural zone is replaced with free-field geological media. The implementation workflow is as follows:
- (1)
Impose the free-field relative displacements at the critical moment on the soil–structure interface of the free-field model;
- (2)
Apply the free-field inertial forces at the critical moment to the geological media within the interface domain;
- (3)
Perform a static analysis to obtain the nodal reaction forces at the soil–structure interface;
- (4)
The interface reaction forces are combined with the structural inertial forces to formulate the equivalent seismic loads, and these loads are applied to the corresponding nodes in the SSI model;
- (5)
Conduct a static analysis on the SSI model to derive peak seismic responses.
3. Influence of Boundary Distance in the Integral Response Deformation Method
In the traditional IRDM, exterior fixed boundaries are used to simulate the influence of semi-infinite medium domains. Consequently, these boundaries must be positioned sufficiently distantly to ensure that non-free-field displacements at interface S, induced by the uncoordinated movement of the soil structure, undergo adequate attenuation. However, current design codes lack explicit guidance on boundary setting. In practice, empirical approaches are commonly adopted, typically setting the bottom boundary at the bedrock surface and lateral boundaries at approximately three times the structural span. While this method generally ensures acceptable accuracy, its universal validity remains unverified. In specific scenarios, such as when structures are located far from bedrock or those with large transverse dimensions, this boundary configuration may result in excessively large models, significantly increasing computational complexity and resource demands. To address these limitations, this study investigates the impact of boundary distance on the computational accuracy of the IRDM, aiming to optimize boundary placement strategies and achieve a balance between precision and efficiency.
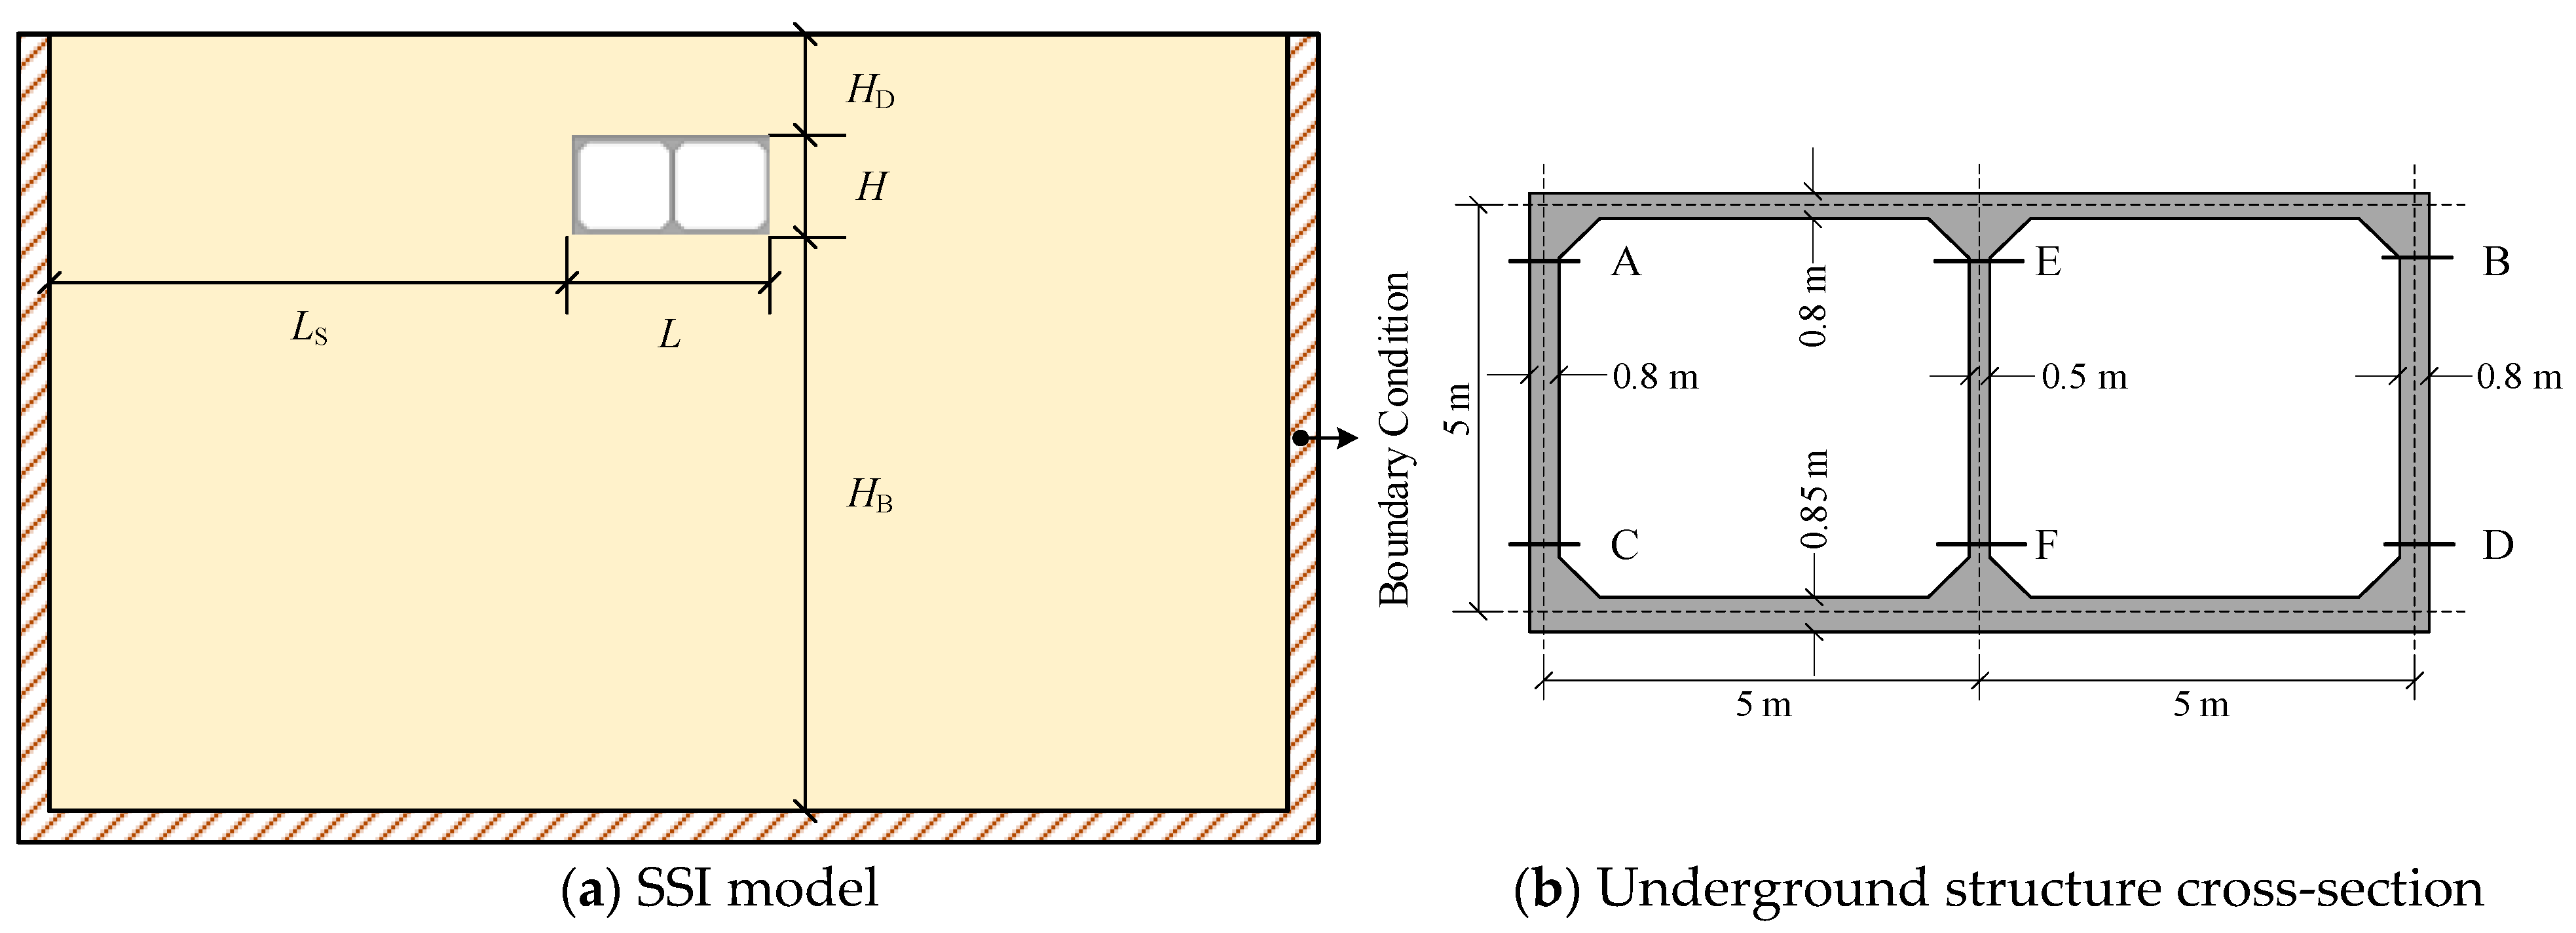
An SSI model is established as depicted in
Figure 3. The lateral boundary distance
LS denotes the horizontal distance from the outer wall of the structure to the lateral boundary, whereas the bottom boundary distance
HB denotes the vertical distance from the structural floor to the lower boundary. A single-story, double-span structure is adopted for modeling, featuring a span of
L = 10 m and height of
H = 5 m, as illustrated in
Figure 3b. The burial depth of the underground structure remains fixed at
HD = 5 m. The soil domain is discretized using plane strain elements 0.5 m × 0.5 m in size, characterized by a mass density of 2000 kg/m
3, a shear wave velocity of 300 m/s, and a Poisson’s ratio of 0.3. The reinforced concrete structure, which is composed of C30-grade concrete, is modeled with a mass density of 2500 kg/m
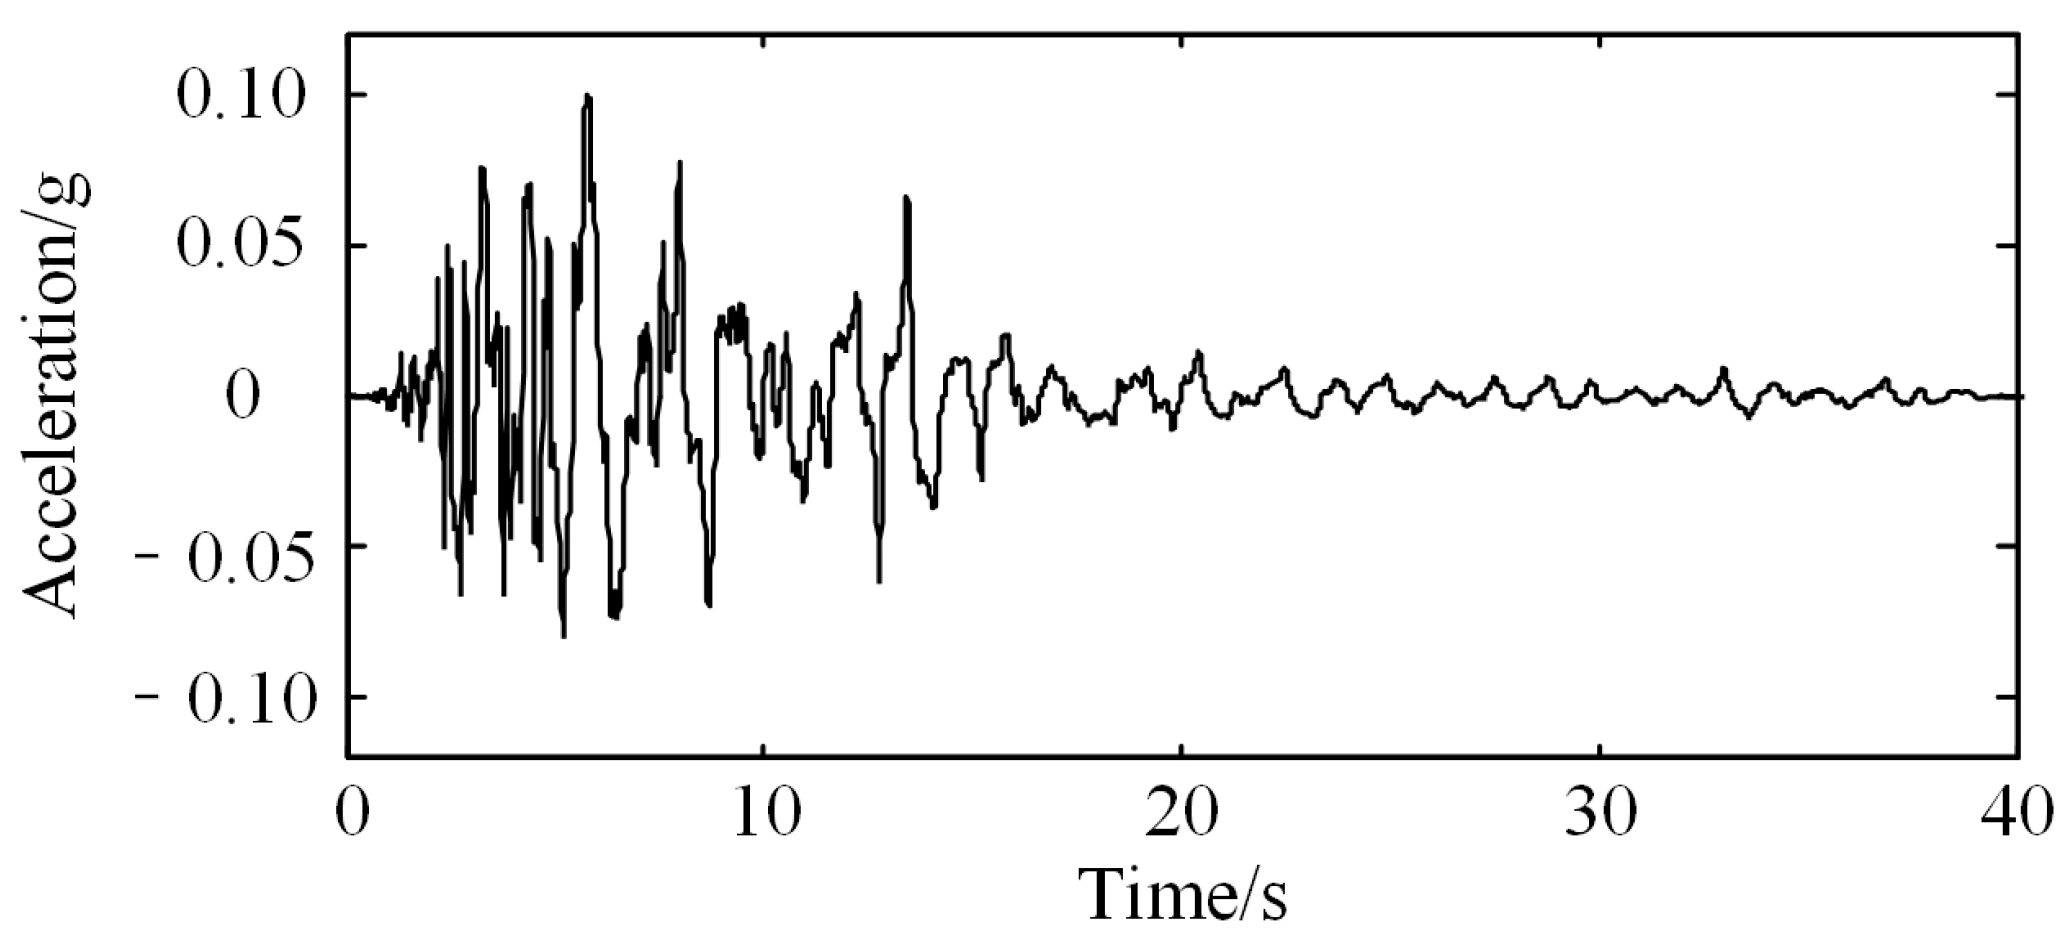
3, an elastic modulus of 30 GPa, and a Poisson’s ratio of 0.15. Shear-deformable beam elements with a mesh size of 0.5 m are used for structural discretization. The Kobe earthquake record (
Figure 4) is selected as the seismic input, with a total duration of 40.95 s.
To evaluate the computational accuracy of the IRDM, the dynamic time history method is employed as the benchmark in this study. For dynamic time history analysis, viscoelastic artificial boundaries are applied to simulate wave radiation effects in semi-infinite media, and seismic motions are introduced via the seismic wave input method, which is based on the substructure of the artificial boundary.
3.1. Influence of the Lateral Boundary Distance
This study first investigates the impact of the lateral boundary distance on the computational accuracy of the IRDM. A dimensionless lateral boundary distance ratio RS = LS/L is introduced and is set to 0.5, 1.0, 2.0, 3.0, 4.0, and 5.0 for parametric analysis via the IRDM. The bottom boundary of the numerical model is fixed at the bedrock surface.
3.1.1. Internal Forces and Deformations
The errors in the internal forces and deformation results computed by the IRDM are defined as follows:
where S denotes the internal forces (including the axial force
N, shear force
Q, and bending moment
M) or deformation results obtained from the IRDM, and
SD represents the corresponding results derived from the dynamic time history method.
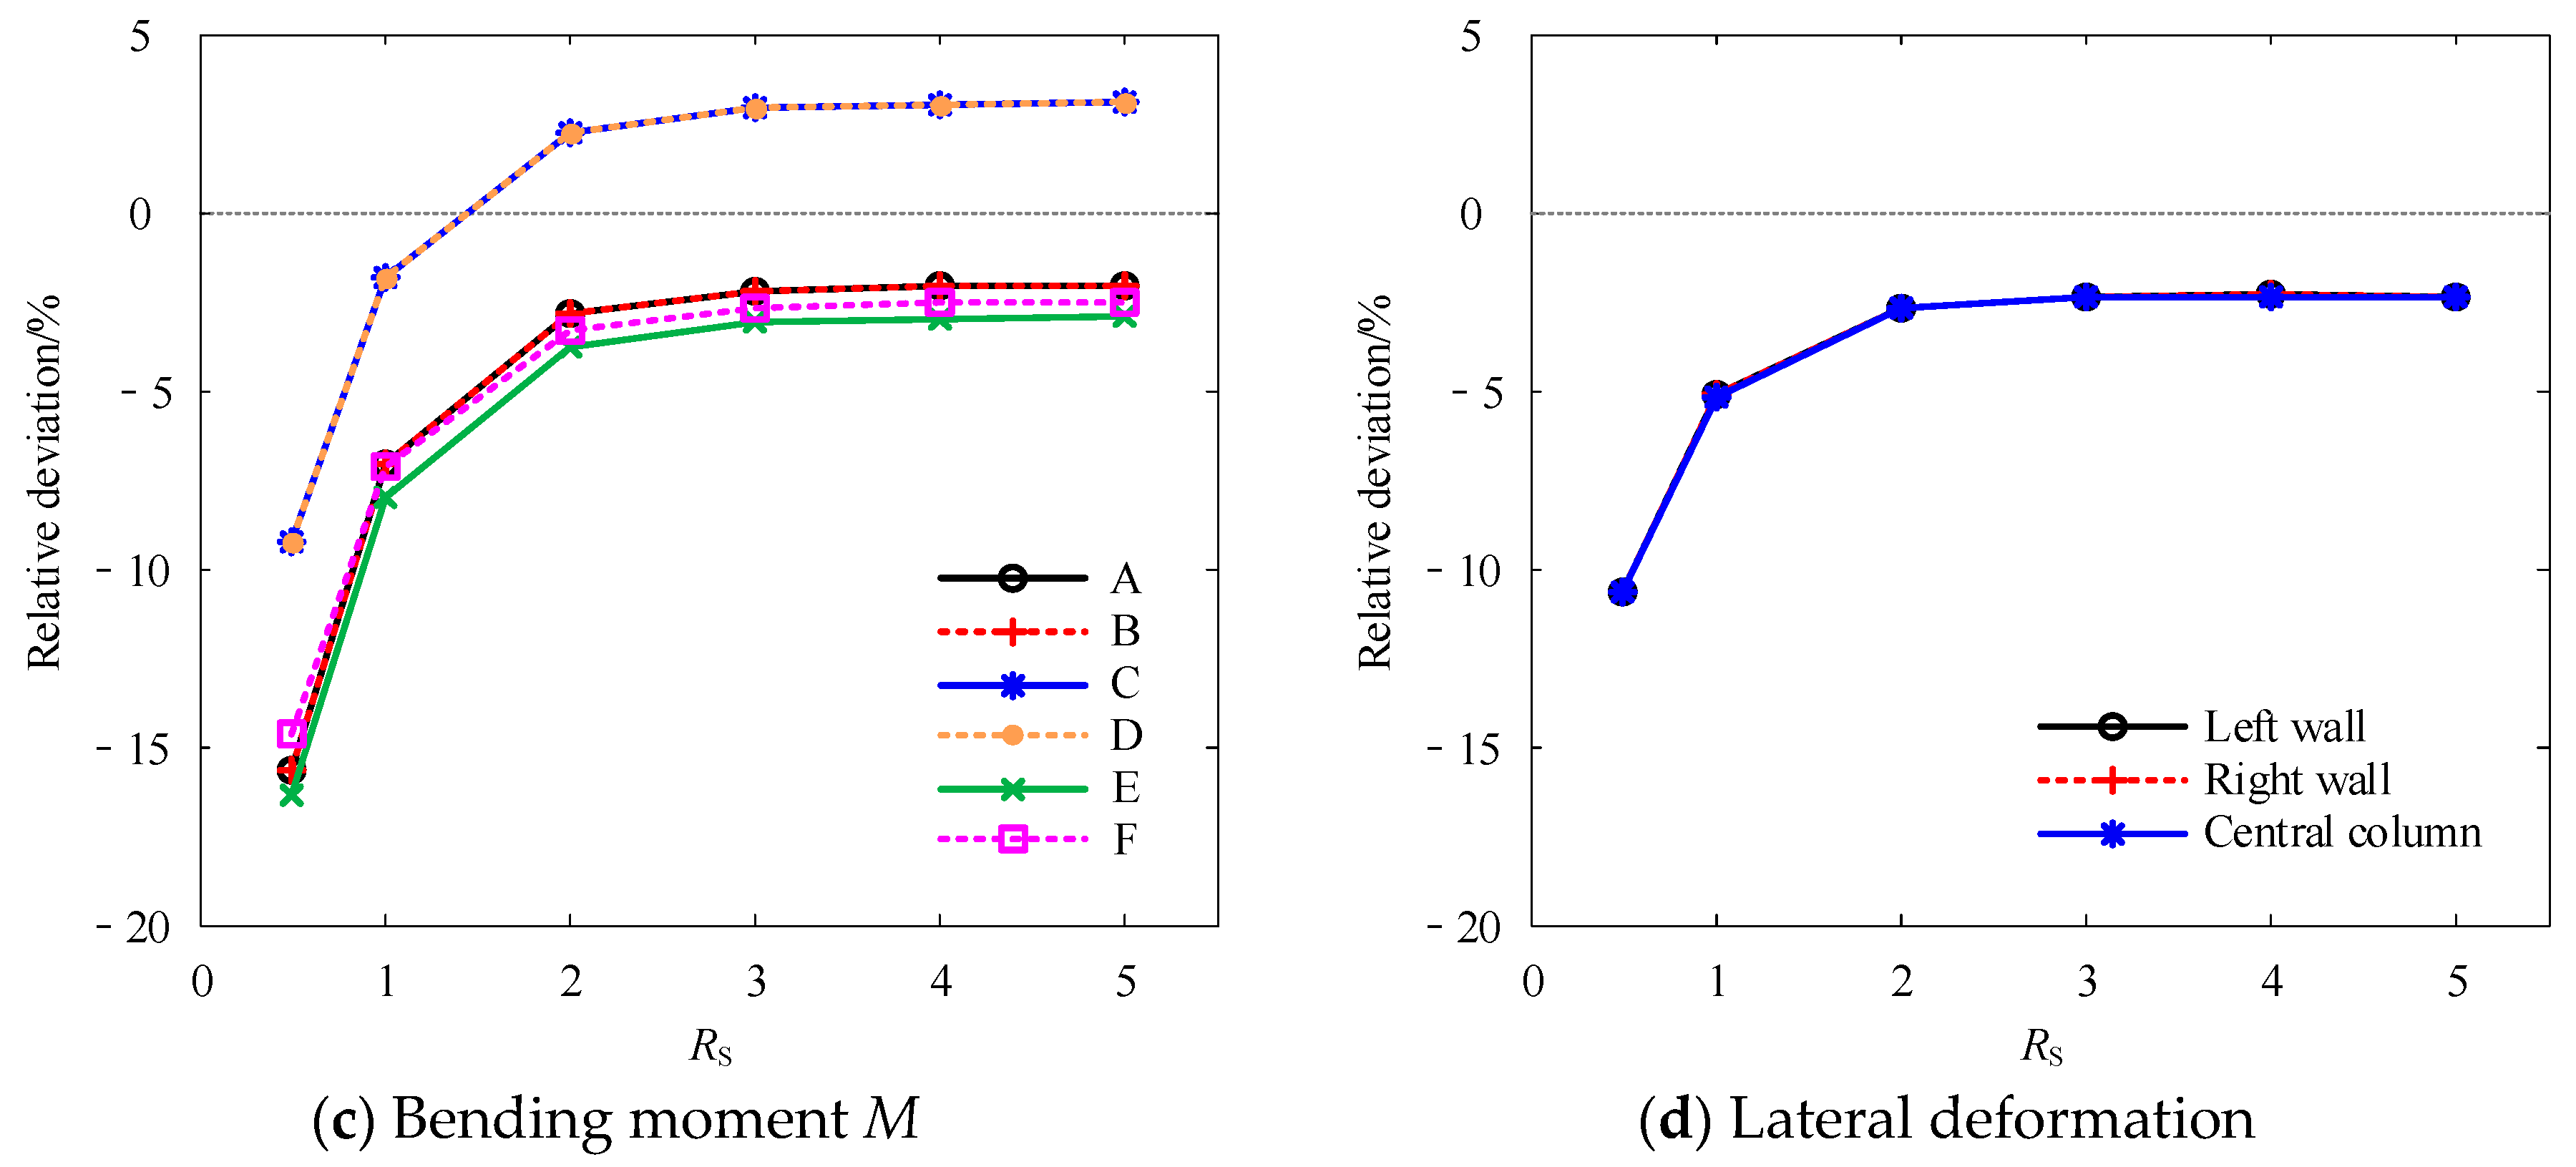
Figure 5 illustrates the relationship between the relative errors of the internal forces and lateral deformations of the vertical structural members and the dimensionless lateral boundary distance ratio
RS.
The results demonstrate that the errors in the internal forces across all sections of the underground structure, as well as the lateral deformations of the vertical members, decrease significantly as the RS increases. Specifically, as the RS increases from 0.5 to 5, the axial force error decreases from −17.11% to −1.63%, the shear force error decreases from −17.35% to −1.64%, the bending moment error decreases from −16.35% to −2.09%, and the lateral deformation error of the vertical members decreases from −10.63% to −2.35%.
Further analysis reveals that the errors in the internal forces and lateral deformations decrease significantly as the RS increases from 0.5 to 2.0, and then stabilize and remain under 5% for RS > 2.0. Although minor increases in shear and moment errors occur at specific sections (e.g., Sections C and D) when RS > 2.0, these deviations remain below 5%. As the calculated values slightly exceed the dynamic time history results, they provide conservative estimates from a safety perspective.
3.1.2. Soil Stress
Under seismic loading, the deformation of underground structures is primarily controlled by the surrounding geotechnical medium. Accordingly, the internal forces and deformations of a structure are closely related to the stress and deformation distributions within the surrounding soil or rock. Studies have demonstrated that the maximum shear stress in a geotechnical medium can, to some degree, reflect the constraints exerted on underground structures.
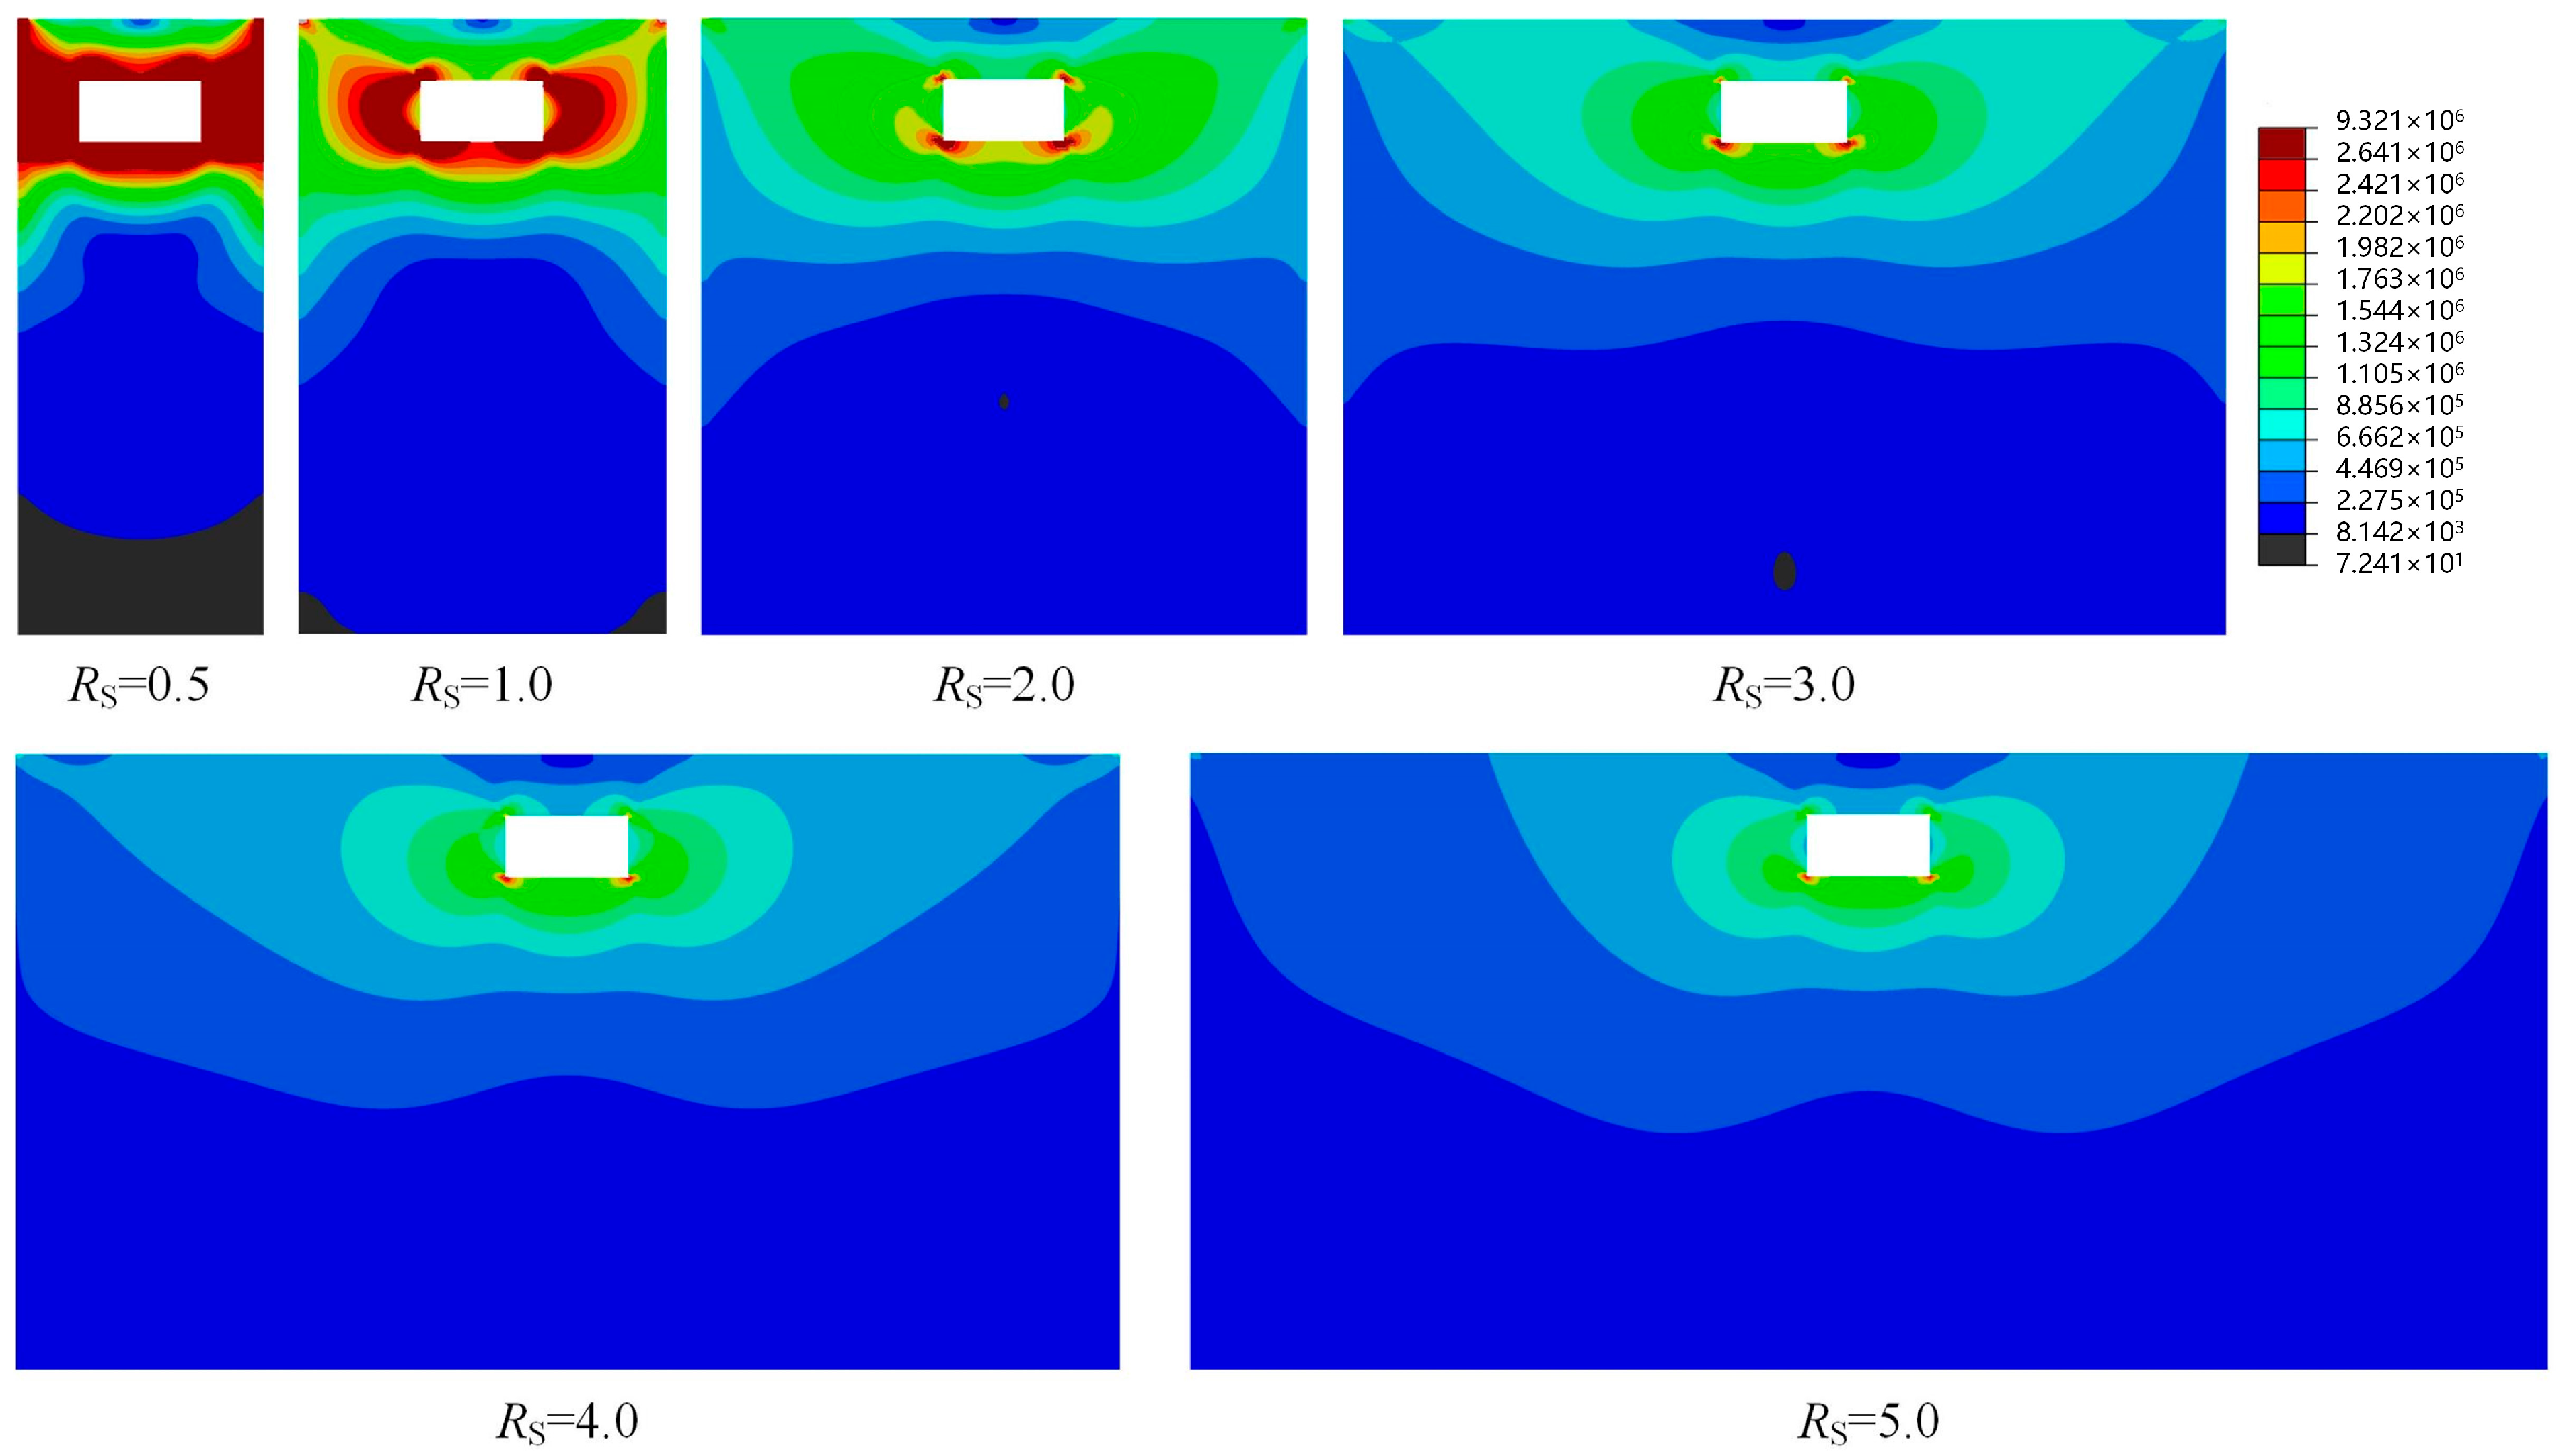
Figure 6 shows the maximum shear stress contours in the geotechnical medium computed by the IRDM under varying lateral boundary distances.
As the RS increases, the shear stress in the geotechnical medium surrounding the structure gradually decreases. When RS ≤ 1.0, the lateral boundaries are too close to the structure, imposing excessive constraints and causing elevated stress levels in the surrounding area. For RS = 2.0, the boundary influence on the surrounding region weakens significantly, although localized horizontal shear stress concentrations persist near the intersections of the sidewalls and floors. When RS ≥ 3.0, boundary effects on adjacent regions become negligible.
Therefore, when the IRDM is applied for seismic analysis of underground structures, lateral boundaries should be placed far enough to minimize boundary effects on computational accuracy. These findings suggest that setting the lateral boundary distance to three times the structural width effectively controls the boundary effect while maintaining high precision.
3.2. Influence of the Bottom Artificial Boundary Distance
For underground structures located far above bedrock, positioning the bottom boundary at the bedrock surface can lead to an excessively large computational domain, substantially increasing computational complexity and resource demands. To balance efficiency and accuracy, this study examines the influence of the bottom boundary distance on the computational precision of the IRDM. A dimensionless bottom boundary distance ratio,
RB =
HB/
H, is introduced for parametric analyses with
RB set to 0.5, 1.0, 2.0, 3.0, 4.0 and 5.0. Moreover, the lateral boundaries are fixed at three times the structural width, following the findings from
Section 3.1.
3.2.1. Internal Forces and Deformations
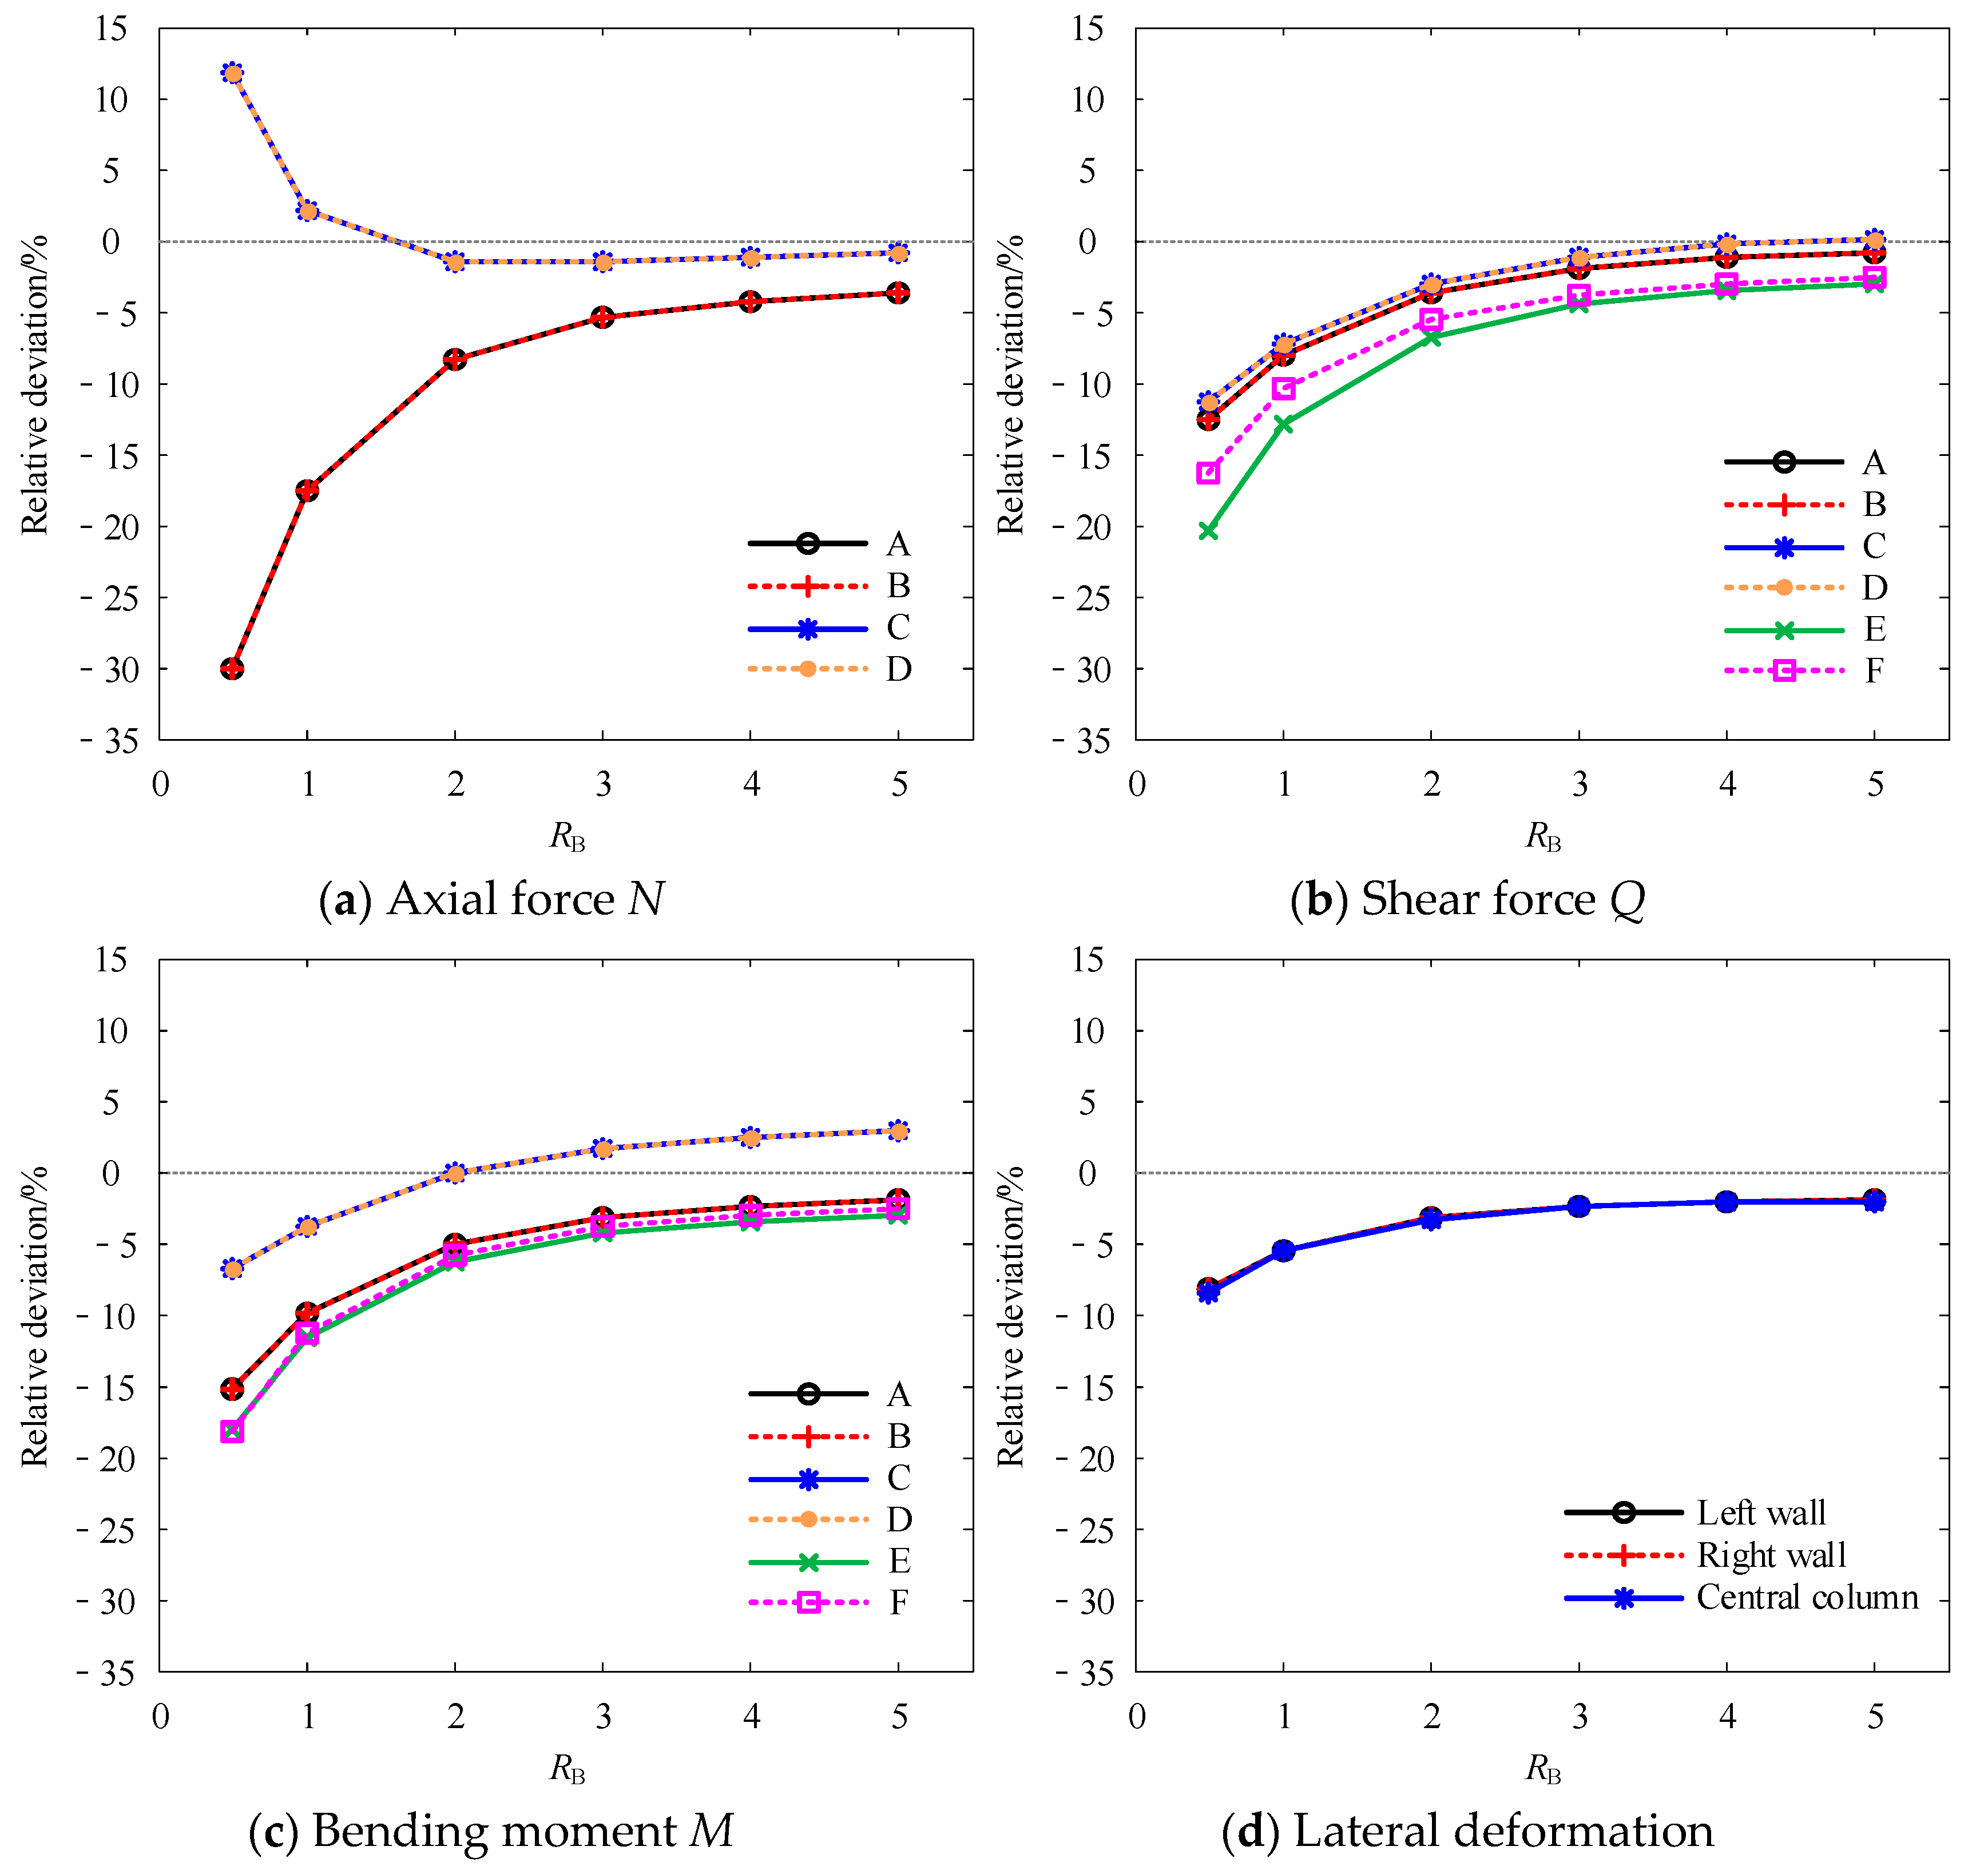
Figure 7 presents the variation in the relative errors of the internal forces and lateral deformations of the underground structure with the
RB. Overall, the errors significantly increase with increasing
RB. Specifically, as
RB increases from 0.5 to 5.0, the axial force errors at Sections A and B decrease from −30.02% to −3.70%; the shear force error at Section E decreases from −20.38% to −3.06%; the bending moment error at Section F decreases from −18.19% to −2.63%; and the lateral deformation error of the central column decreases from −8.49% to −2.04%.
Further analysis reveals that for RB between 0.5 and 3.0, errors in internal forces and lateral deformations decrease markedly with increasing RB. However, when RB ≥ 3.0, the error variations stabilize and remain consistently below 5%.
3.2.2. Soil Stress
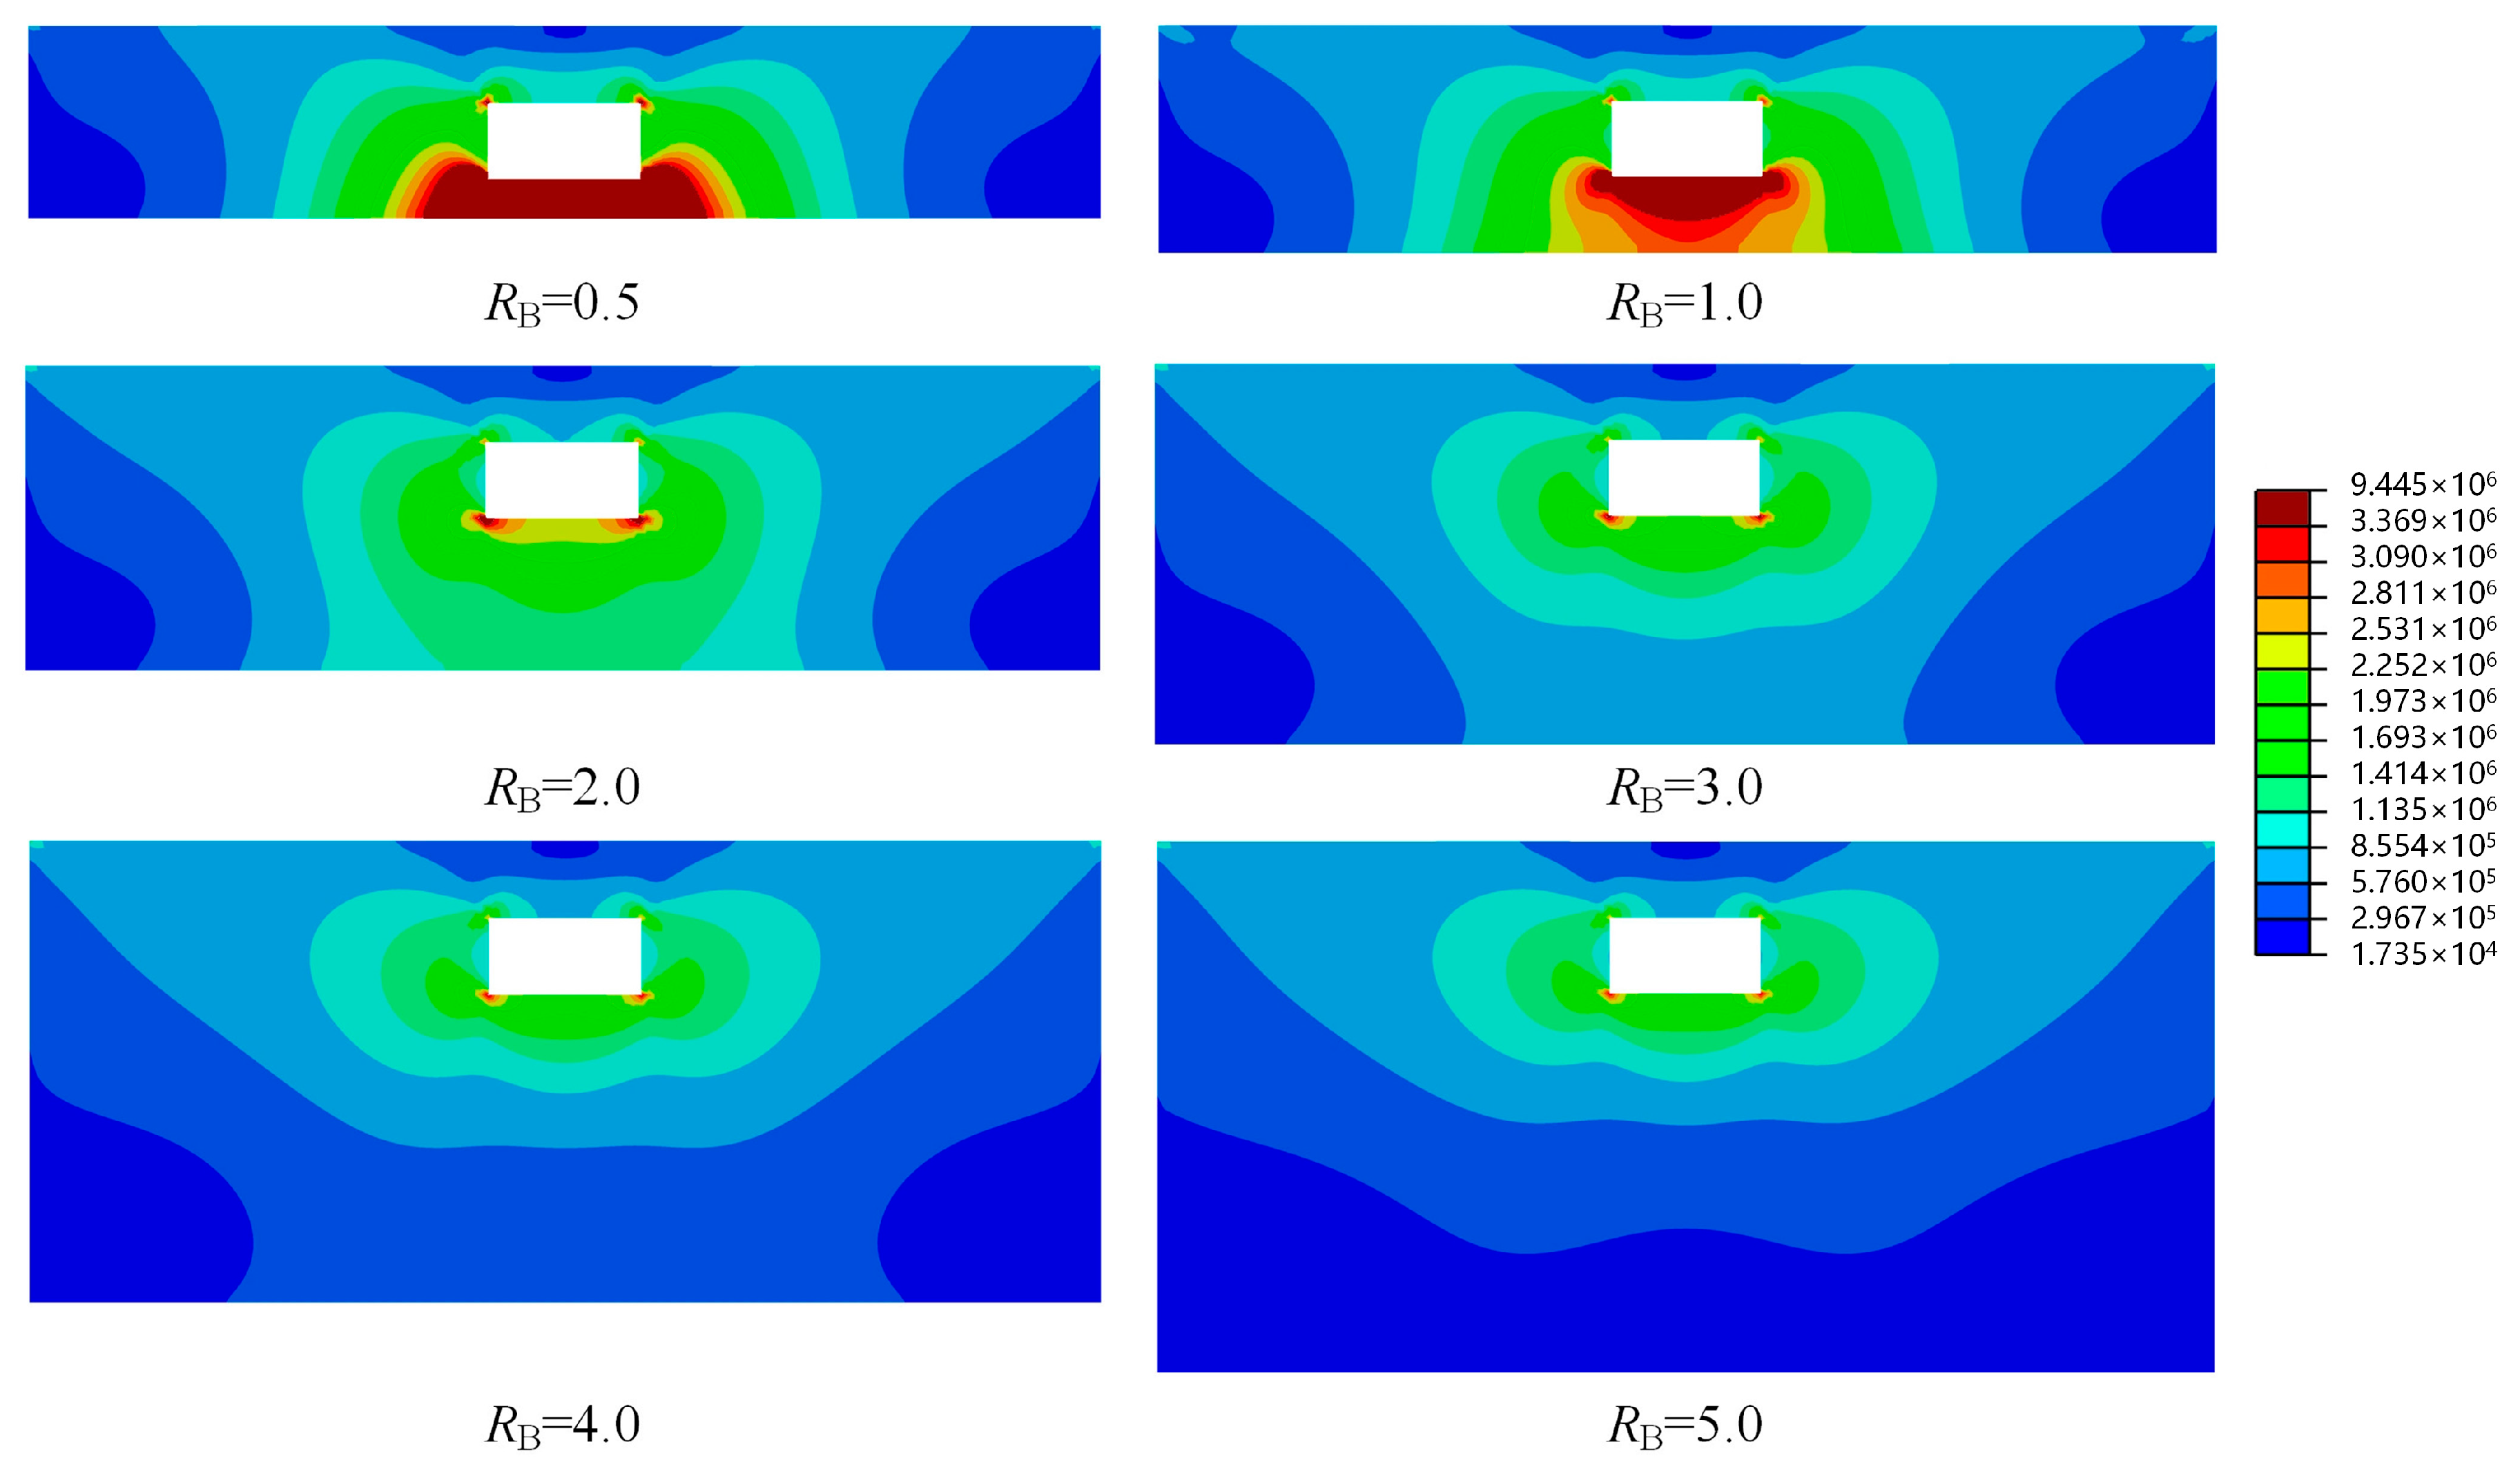
Figure 8 presents the shear stress distributions in the geotechnical medium under varying
RB. As
RB increases, the shear stress levels in the soil surrounding the structure gradually decrease, indicating a weakening of the constraints imposed by the bottom boundary. Specifically, when
RB ≤ 1.0, the bottom boundaries are too close to the structure, imposing excessive constraints and causing elevated stress levels in the surrounding area, especially near the floor. As
RB increases to the range of 2.0–3.0, the shear stress levels around the structure decrease significantly, although residual boundary effects remain observable. When
RB ≥ 3.0, the influence of the bottom boundary on the soil stresses becomes negligible, and the shear stress distribution stabilizes to a converged state.
A comprehensive analysis reveals that the bottom boundary distance plays a crucial role in the computational accuracy of the IRDM. When the bottom boundary is too close to the structure, the intensified constraints imposed by fixed boundaries distort the stress distributions in the surrounding soil, thereby undermining computational accuracy and resulting in reliability. To ensure the validity of the IRDM, the vertical distance from the structural floor to the bottom boundary should be set to at least three times the vertical height of the underground structure while also adhering to prescribed lateral boundary distance requirements.
3.3. Theoretical Basis and Engineering Specification Consensus
According to the classical theory of body wave (P- and S-wave) propagation in elastic media [
25], the displacement amplitude of a wave field radiating from a point source obeys a geometric spreading law:
where
r is the radial distance from the source. Consequently, the kinetic energy density decays proportionally to
.
If the lateral boundary distance is taken as
r = 3
L, the total round–trip distance for a reflected wave becomes 2
r = 6
L, and the reflected energy density is
=
≈ 2.78%. This implies that less than 3% of the original wave energy returns to the structure, meeting the noninterference threshold proposed by Lysmer’s radiation damping theory [
26], which stipulates that reflected energy below 5% has negligible influence. Solving the energy decay inequality
yields
r ≥ 2.24
L, and adopting
r = 3
L as a conservative integer multiple ensures safe truncation.
The proposed criterion aligns with the Standard for Seismic Design of Underground Structures [
6]: “The boundary distance in time history analysis should not be less than three times the characteristic dimension of the structure to ensure full attenuation of far-field wave effects”.
Japan’s Tunnel Seismic Design Guide [
27] and ASCE standards in the U.S. [
28] also adopt similar guidelines.
This consistency demonstrates the broad professional consensus supporting the 3 L guideline as a practical, validated approach in seismic modeling.
4. An Improved Integral Response Deformation Method Considering Far-Field Effects
In the IRDM, ideal boundary conditions should ensure that non-free-field displacements resulting from uncoordinated motion between the soil and structure undergo sufficient attenuation, thereby accurately capturing the confinement effects of the external infinite medium. On the basis of the preceding analysis, the lateral boundary distance (LS) and vertical bottom boundary distance (HB) must each reach three times the structural width (3 L) and height (3H), respectively, to ensure the accuracy of the IRDM. However, for large-scale three-dimensional seismic analyses of underground structures, such boundary configurations lead to excessively large computational models, significantly increasing modeling complexity and computational costs.
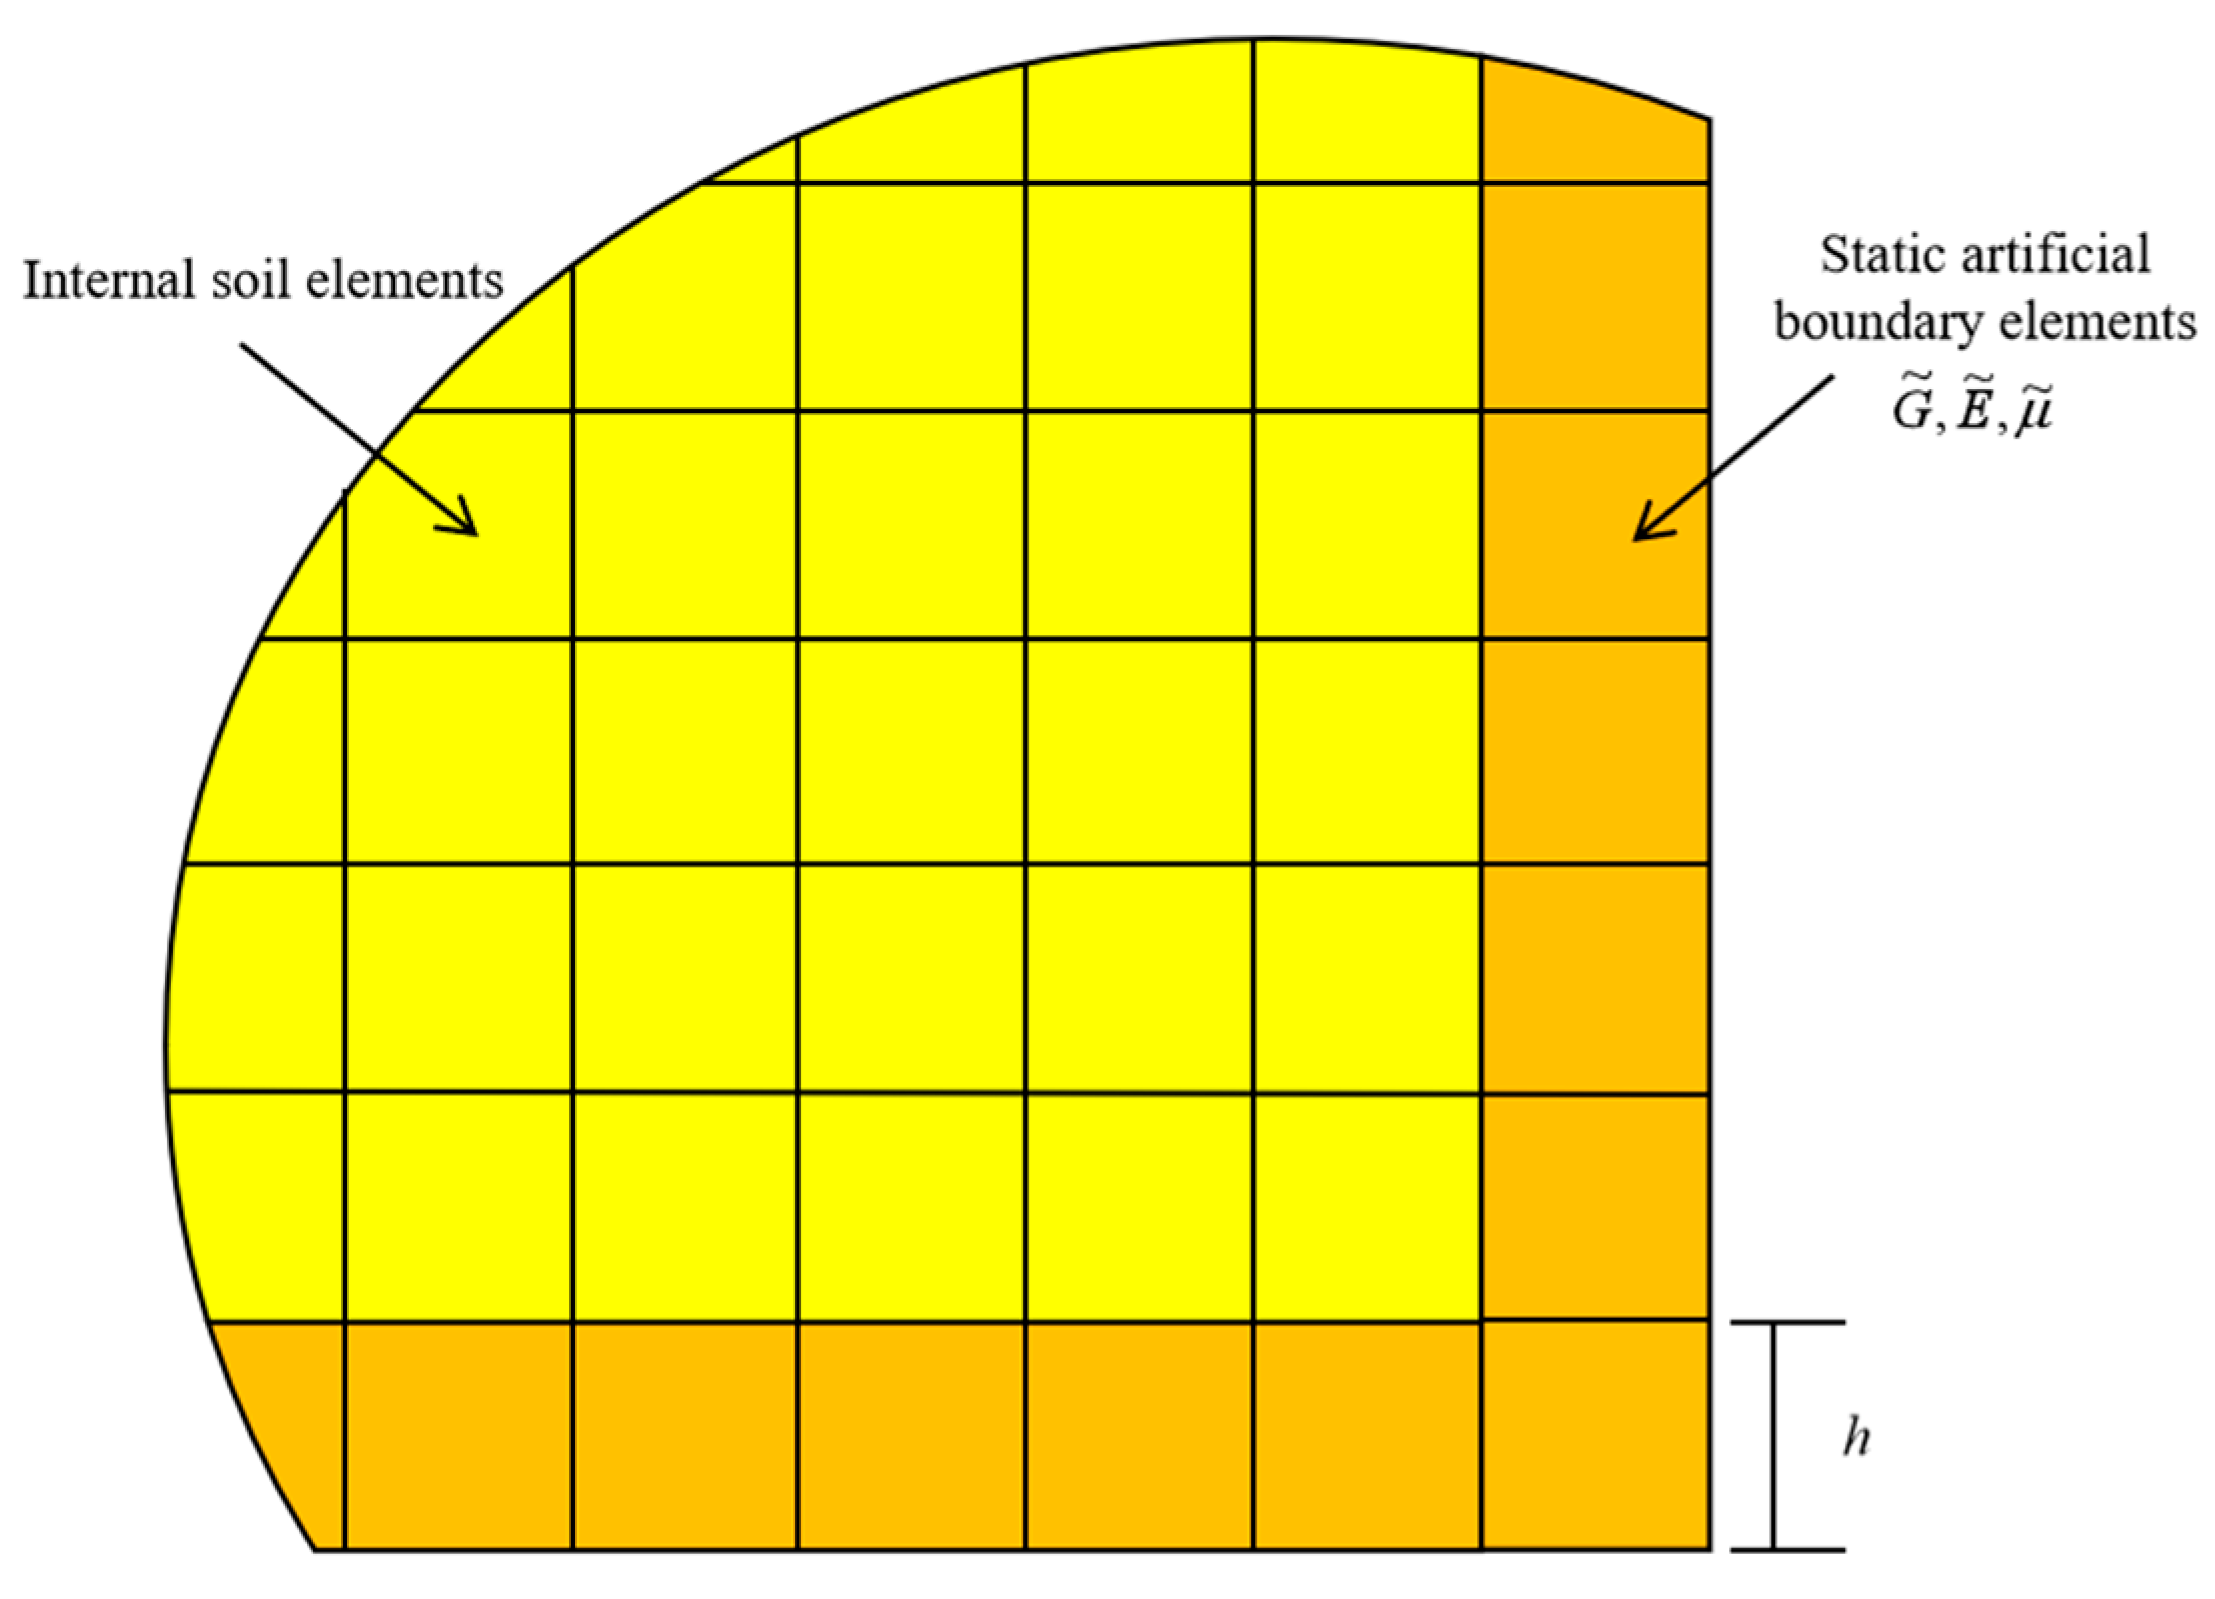
To address these challenges, boundary conditions that simulate the static resistance of semi-infinite foundations and far-field constraint effects, namely, static artificial boundaries, can be introduced into computational models, thereby reducing the required analysis domain. For dynamic problems, researchers have developed a variety of artificial boundary methods to consider the wave radiation in an infinite domain. Our research team has conducted extensive research and proposed several artificial boundary techniques, including viscoelastic artificial boundaries and viscoelastic artificial boundary elements. By degenerating the viscoelastic artificial boundary into static conditions, a static artificial boundary element suitable for the IRDM can be derived, as shown in
Figure 9, with its shear modulus (
), Young’s modulus (
), and Poisson’s ratio (
) determined as follows:
Here, h denotes the thickness of the equivalent element, R represents the distance from the structure to the boundary node, G represents the shear modulus of the geological medium, and , , and represent the tangential and normal artificial boundary parameters, respectively.
By incorporating static artificial boundary elements into the IRDM, an improved IRDM considering far-field effects is proposed. The implementation processes are as follows:
- (1)
Free-Field Seismic Response Analysis
Free-field seismic analysis is performed via standard finite element solvers (e.g., ANSYS 2022R1, ABAQUS 2022(64bit), Plaxis 3D 2024, or FLAC 3D 3.0-261) to obtain free-field displacements and accelerations at the structural location under vertically propagating seismic waves. The critical time instants corresponding to peak seismic responses are extracted.
- (2)
Equivalent seismic load calculation
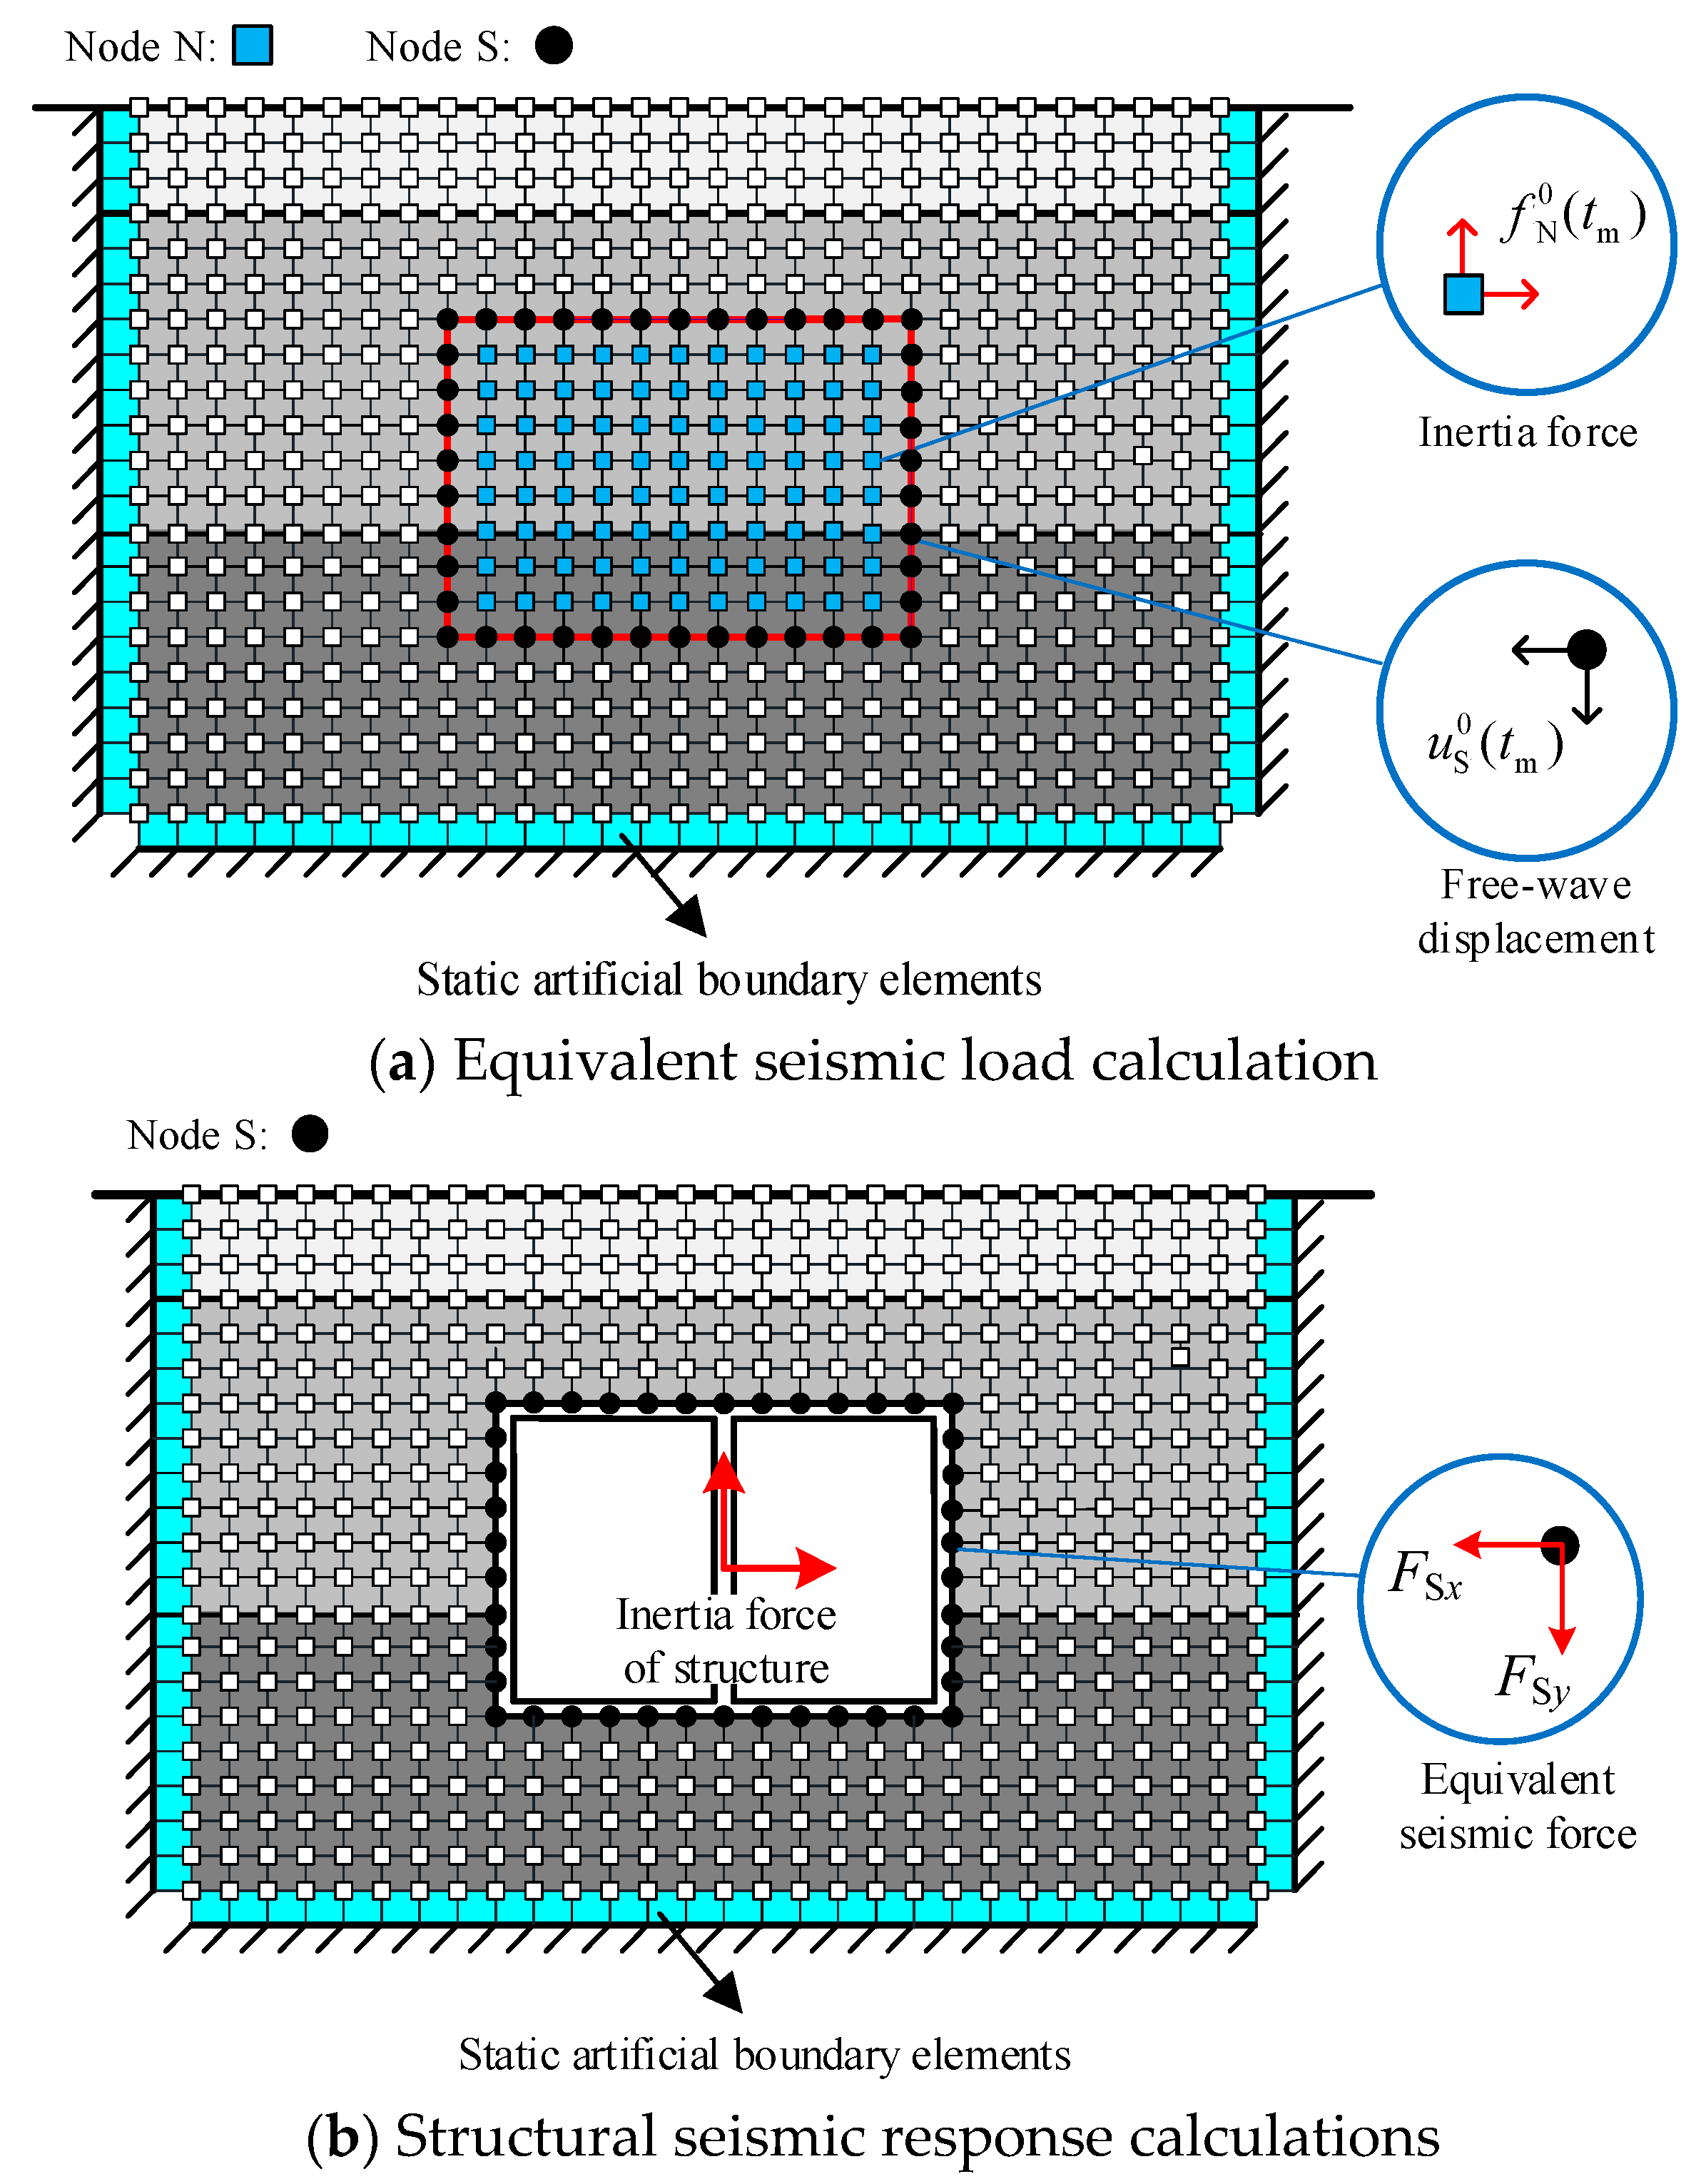
A free-field soil finite element model with an outer layer of static artificial boundary elements (material properties defined by Equation (2)) and fixed exterior nodes is constructed. The free-field displacements from Step 1 at the soil–structure interface nodes are applied, and free-field inertial forces are imposed on the internal nodes (
Figure 10a). Then, the nodal reaction forces at the interface are computed as the equivalent seismic loads.
- (3)
Structural inertial force calculation
Determine the structural inertial forces at critical time instants via the free-field accelerations obtained in Step 1.
- (4)
Integrated Static Analysis
An SSI model with an outer layer of static artificial boundary elements (material properties defined by Equation (2)) and fixed exterior nodes is developed. The equivalent seismic loads and structural inertial forces at designated positions (
Figure 10b) are applied to derive the seismic responses through static computation.
Key adaptability notes for engineers:
- (1)
Static artificial boundary elements: these can be implemented as equivalent solid elements with adjusted material properties (Equation (2)) in any software supporting user-defined material models.
- (2)
Load application: free-field displacements and inertial forces are applied via standard nodal displacement/force boundary conditions.
- (3)
Static analysis workflow: this method avoids dynamic solvers and relies solely on static analysis modules available in all commercial FE software such as ANSYS 2022R1.
5. Analysis of the Effects of Artificial Boundary Parameters on Computational Accuracy
To investigate the optimal static artificial boundary parameter values, a computational model of the IRDM accounting for far-field medium effects is established. The lateral and bottom boundaries are set at 0.5 times the structural width and height
(RS =
RB = 0.5), respectively. The artificial boundary parameter
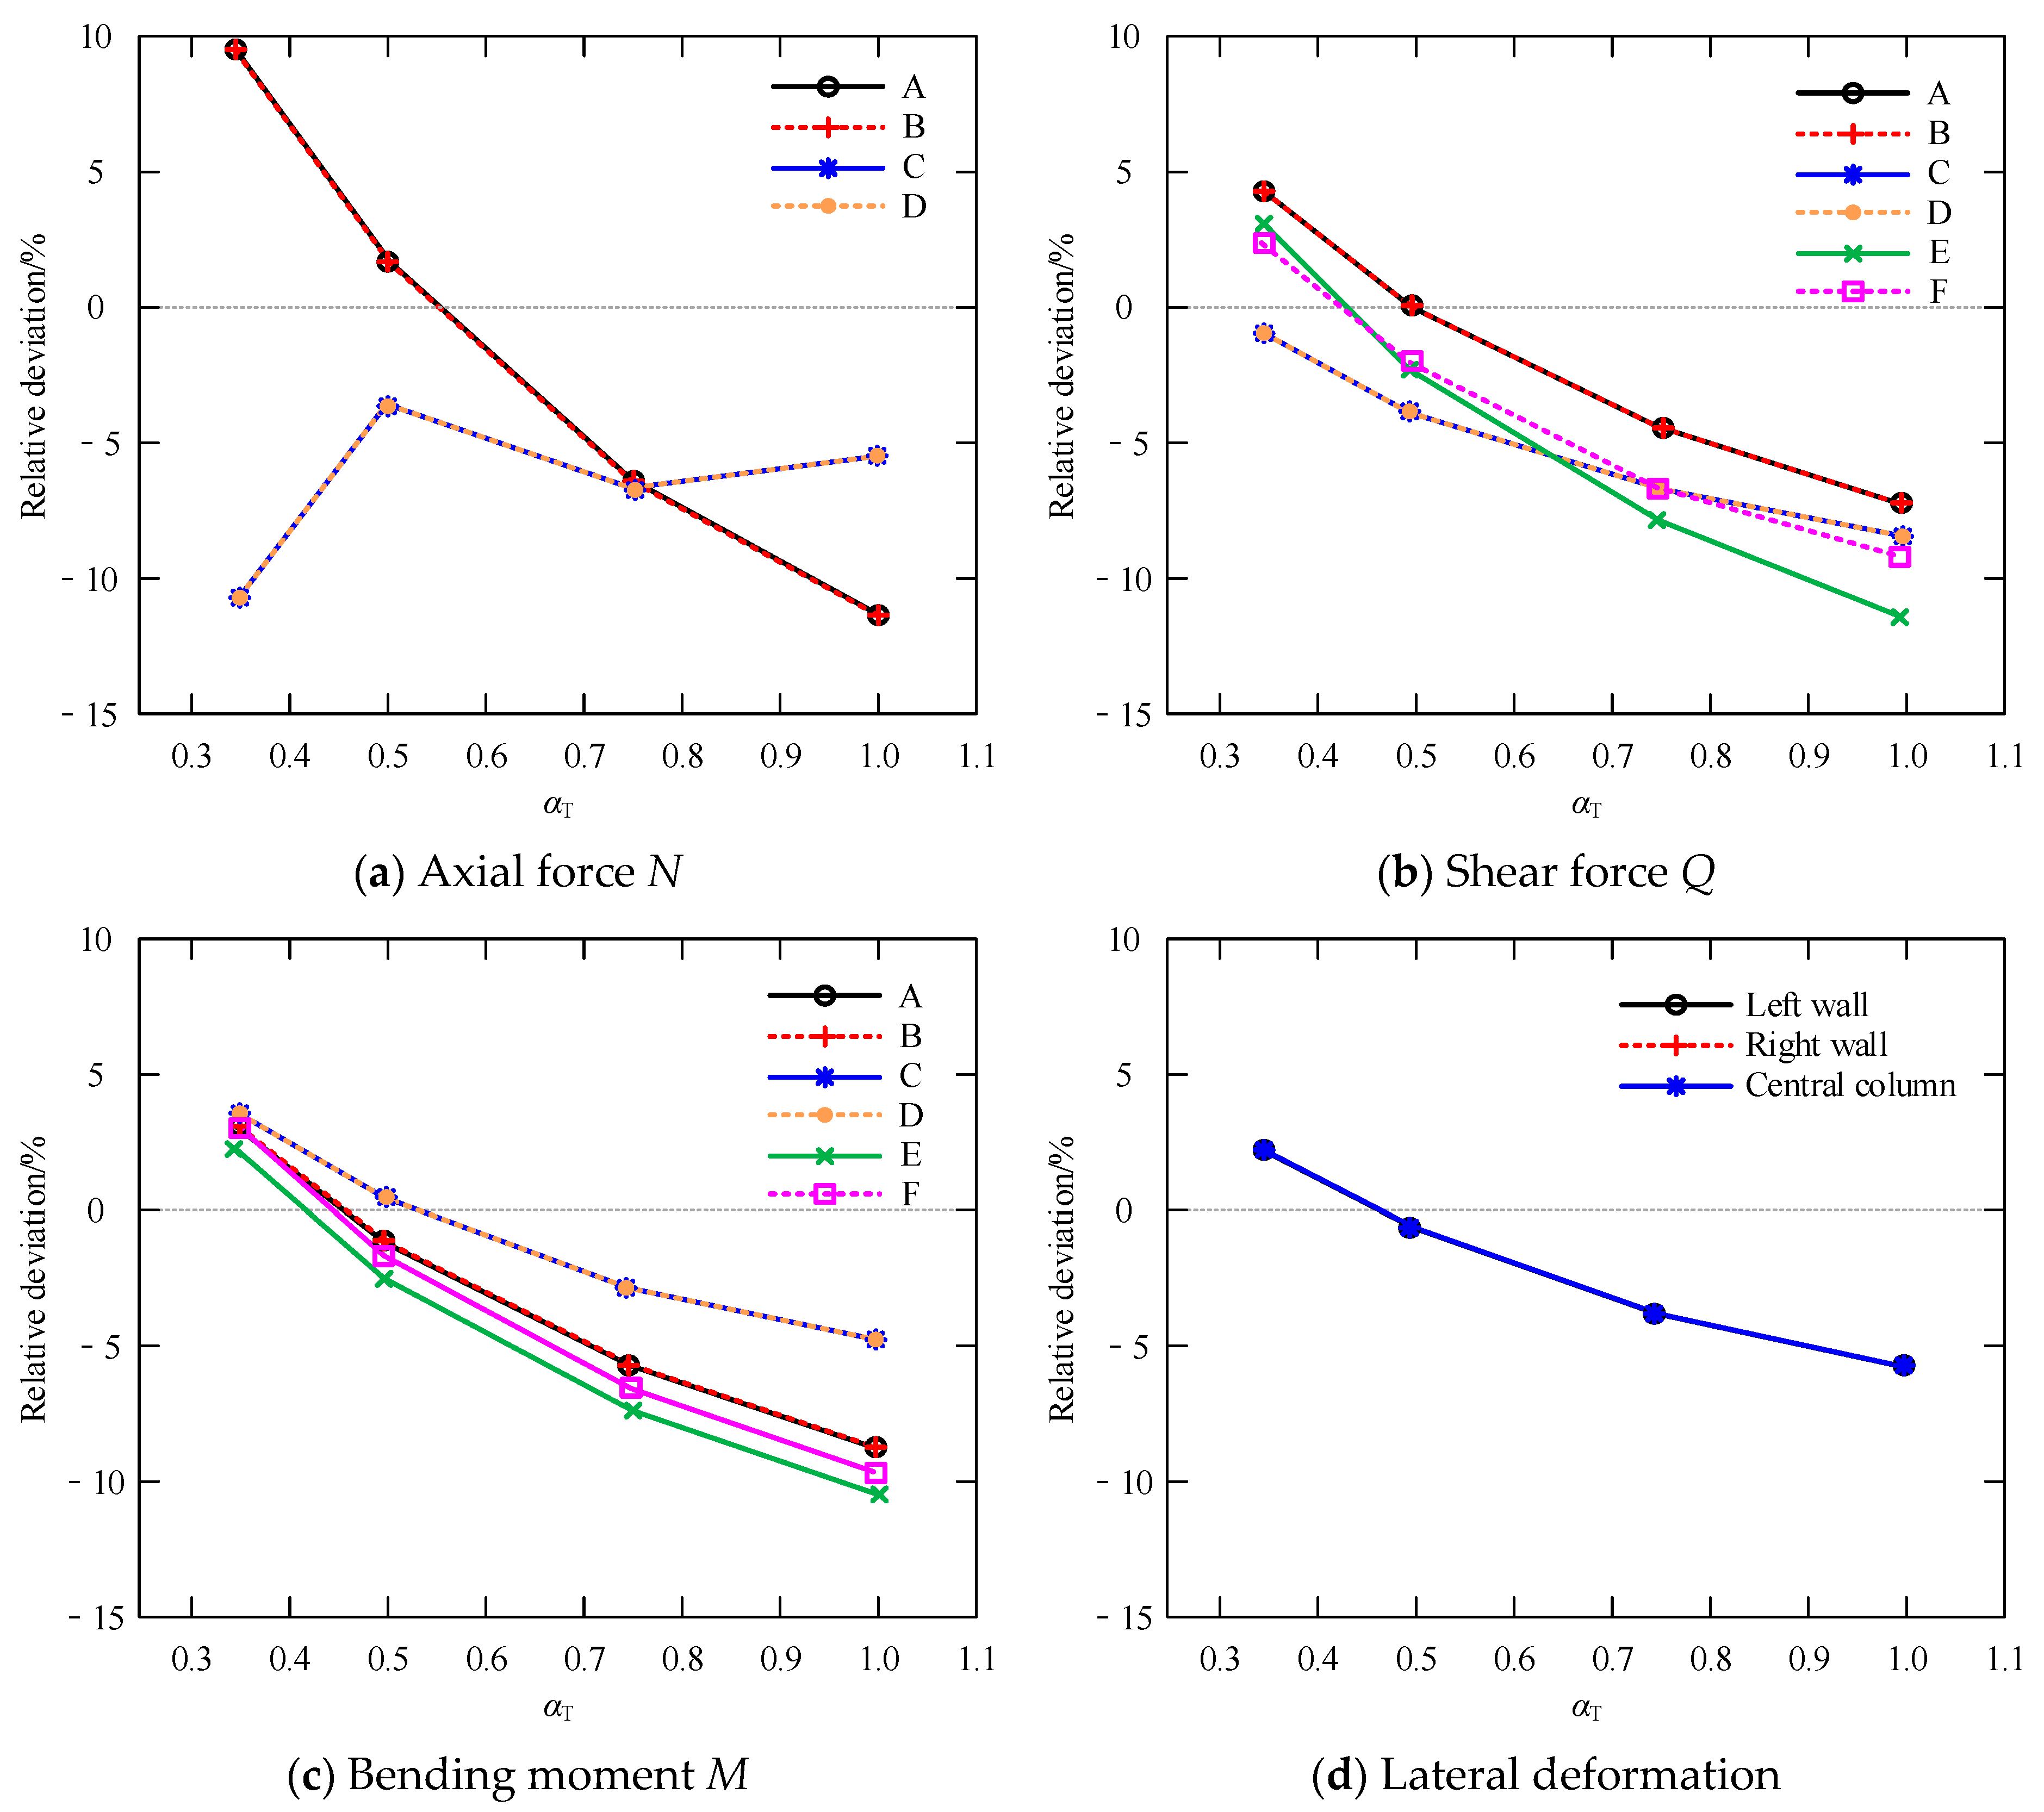
αT is assigned values of 0.35, 0.5, 0.75, and 1.0, with the parameter
αN set to twice
αT on the basis of Liu et al.’s study. By calculating the internal forces (axial force
N, shear force
Q, and bending moment
M) and lateral deformations of vertical structural members and comparing these results with those of dynamic time history analyses, the relative errors under different
αT conditions are systematically evaluated, as shown in
Figure 11.
The analysis results indicate that as αT increases from 0.35 to 1.0, the computational errors of the proposed method initially decrease and subsequently increase. When αT increases from 0.35 to 0.5, the errors transition from positive to negative. This phenomenon arises because insufficient artificial boundary stiffness at lower αT values prevents static foundation reactions from adequately balancing non-free-field displacements caused by soil–structure kinematic incompatibility. The unbalanced residual displacements are superimposed onto free-field displacements and are converted into equivalent seismic loads, leading to overestimation of internal forces and deformations. As αT further increases from 0.5 to 1.0, non-free-field displacements are effectively balanced; however, excessive boundary stiffness introduces overconstraint effects on the SSI model, gradually amplifying errors. A comprehensive evaluation demonstrates that the optimal parameters αT = 0.5 and αN = 1.0 minimize computational errors while achieving an ideal balance between accuracy and model complexity, which is a recommended configuration.
6. Case Study Validation
To validate the effectiveness of the proposed IRDM and the rationality of its parameter configuration, the underground structure model described in
Section 3.1 is adopted. Six SSI models are established with dimensionless boundary distance ratios
R =
RS =
RB set to 0.5, 1.0, 2.0, 3.0, 4.0, and 5.0. Seismic responses under the Kobe, Loma Prieta, and Northridge earthquake records are computed via three approaches: the dynamic time history method, the conventional IRDM, and the proposed improved IRDM (with artificial boundary parameters of
αT = 0.5 and
αN = 1.0). The ground surface acceleration time histories of the three seismic motions are shown in
Figure 4 and
Figure 12, with the peak ground acceleration (PGA) normalized to 0.1 g and a time step of 0.01 s.
6.1. Computational Accuracy Analysis
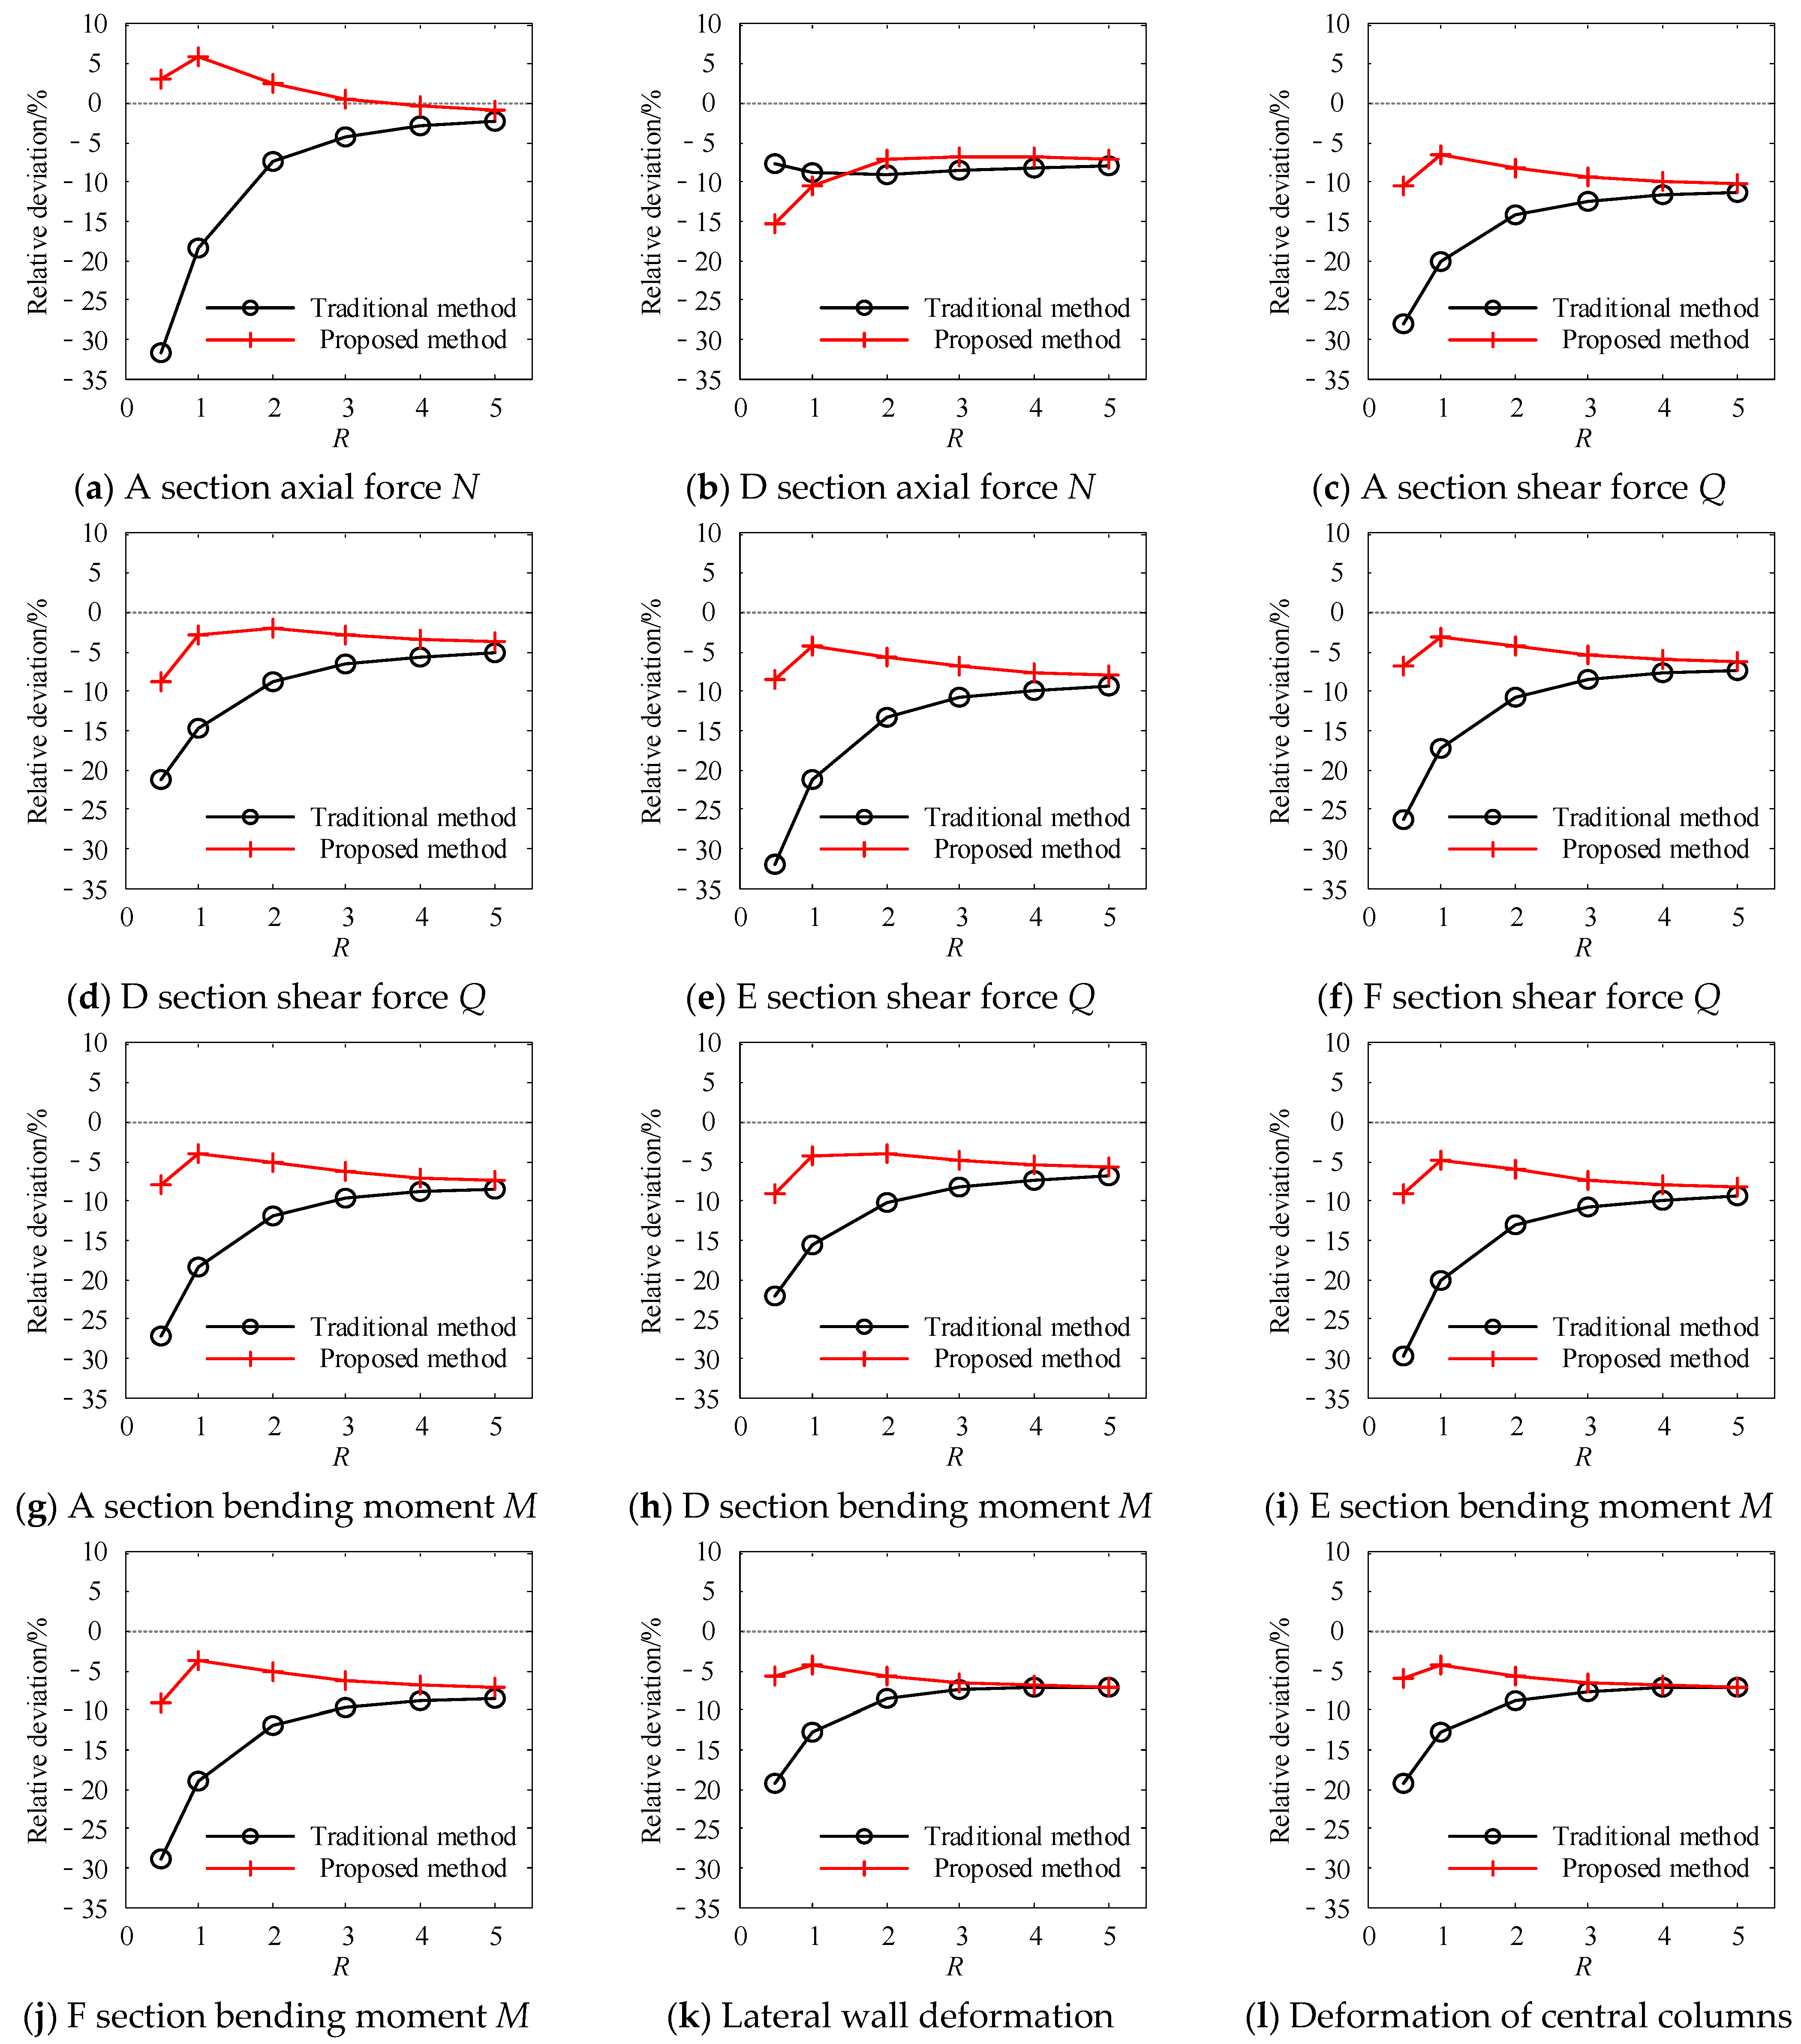
Figure 13,
Figure 14 and
Figure 15 illustrate the error variation trends of the internal forces at critical cross-sections and lateral deformations of vertical structural members calculated via the proposed method and conventional methods relative to the dynamic time history results, plotted against the dimensionless boundary distance ratio
R, under three real earthquake records. Owing to the consistent internal forces between Sections A and B, as well as between Sections C and D, and the identical deformation patterns of the left and right sidewalls, the graphical representations are simplified. For each seismic scenario, only the internal force results for Section A and Section D, along with the deformation results for the left sidewall, are displayed.
Table 1 systematically summarizes the internal forces and deformation results for key sections obtained via different computational methods from the three earthquake records.
The proposed method has significant advantages in terms of computational accuracy over the conventional IRDM. Under various seismic excitations, the errors of the new method are generally controlled within 5%, with a maximum error not exceeding 10%, which is markedly superior to the conventional method’s maximum error of −32.64%. As the boundary distance ratio R varies, the errors of the new method initially decrease but then increase, ultimately converging with the conventional method’s error curves toward the same asymptote. This behavior arises because at smaller R values, the artificial boundaries not only balance non-free-field displacements induced by soil–structure kinematic incompatibility, but also provide sufficient constraints to the computational model, whereas as R increases, the constraining effects of artificial boundaries gradually diminish. When R becomes sufficiently large, the boundary type exerts a negligible influence on the results, leading to convergence between different boundary configurations. Furthermore, the proposed method demonstrates enhanced computational accuracy under boundary distance ratios of R = 0.5 and 1.0, exhibiting significantly lower errors than conventional methods while effectively reducing the computational scale. This dual advantage of precision and efficiency renders the method particularly suitable for seismic response analysis of large-scale, complex underground structures, aligning with the stringent requirements of modern seismic design standards.
6.2. Computational Efficiency Comparison
Table 2 compares the differences in the number of elements and nodes between the proposed method and the conventional method, with the reduction percentages relative to those of the conventional method indicated in parentheses. The results demonstrate that the proposed method significantly reduces both element and node counts. When the dimensionless boundary distance ratio
R is set to 0.5, the element and node quantities are reduced by more than 90%, confirming that the new method substantially lowers the computational complexity and resource demands while maintaining accuracy. This advancement provides a more efficient and economical solution for the seismic design and analysis of underground structures.
6.3. Applicability Analysis
The applicability of the proposed method is further examined under varying medium stiffness and structural stiffness conditions.
First, the applicability of the proposed method under varying medium stiffnesses is assessed while keeping all other model parameters consistent with those outlined in
Section 3. The dimensionless boundary distance ratio is set to
R = 0.5, and the artificial boundary parameters are specified as
αT = 0.5 and
αN = 1.0.
In this analysis, only the shear wave velocity of the surrounding soil medium is varied. The internal force and deformation responses of the underground structure, which are calculated via the proposed method under Kobe wave excitation, are compared with those obtained via the dynamic time history method for soil shear wave velocities of 140 m/s, 200 m/s, 300 m/s, and 600 m/s. The corresponding comparison results are summarized in
Table 3.
As shown in
Table 3, the errors in the axial force, shear force, bending moment, and deformation calculated via the proposed method under varying medium stiffnesses are all within 6%. Moreover, as the shear wave velocity of the surrounding soil medium decreases, the errors tend to diminish.
The applicability of the proposed method is further examined under varying structural stiffness conditions. Let the elastic modulus of the structural material in
Section 3 be denoted as
E*. In this analysis, the elastic modulus
Es is set to 0.5
E*, 1.5
E*, and 2.0
E*, while all other parameters remain consistent with those in
Section 3. The dimensionless boundary distance ratio is fixed at
R = 0.5, and the artificial boundary parameters are set to
αT = 0.5 and
αN = 1.0.
Seismic response analyses of the underground structure under Kobe wave excitation are performed via both the proposed method and the dynamic time history method. A comparative study is conducted, and the results are presented in
Table 4.
The results indicate that the errors in the internal force and deformation calculated via the proposed method remain within 8% across all structural stiffness scenarios. Furthermore, as the structural stiffness increases, the calculation errors of the proposed method show minimal variation. This demonstrates that the proposed method offers high computational accuracy and robust applicability, with the influence of structural stiffness on the method’s accuracy being relatively insignificant.
6.4. Applicable Boundaries and Limitations of the Method
While the proposed method has demonstrated robust performance in simulating the seismic responses of underground structures, its current applicability is bounded by the following conditions:
The method is theoretically applicable to deep underground structures and heterogeneous or layered geological media. However, the current validation cases focus on homogeneous soils. Additional verification for stratified or spatially variable soil profiles will strengthen its generalizability.
- (2)
Earthquake Type:
The present verification is based solely on horizontal ground motions. The influences of vertical earthquake components and their coupling effects have not yet been considered. To fully capture three-dimensional seismic behavior, the method must be extended to three-dimensional analyses.
- (3)
Soil Constitutive Model:
The current framework assumes elastic soil behavior. Thus, it does not account for soil nonlinearity or liquefaction phenomena, which may occur under strong seismic excitation. The incorporation of nonlinear constitutive models is necessary for applications involving severe ground motions or soft soils.
- (4)
Structural Type:
The validation is currently limited to single-story underground structures. Structures with complex cross-sectional configurations, such as multicell tunnels or irregular geometries, have not yet been validated and require further verification to confirm the generalizability of the method.
- (5)
Boundary Representation Fidelity
Current boundary conditions are based on static artificial boundaries without the incorporation of specialized infinite elements. In future work, the proposed method will be integrated with infinite elements to synergistically enhance both computational efficiency and accuracy.
In addition, a comparative summary table is summarized to enhance clarity and allow better evaluation of the advantages and limitations of each method. The results are presented in
Table 5.
7. Conclusions
This study systematically investigates the influence of boundary truncation distances on the computational accuracy of the conventional IRDM. By introducing static artificial boundary conditions simulating semi-infinite medium constraints, an improved IRDM considering the far-field effect is developed. The key findings are as follows:
- (1)
The boundary distance in the IRDM significantly affects the computational accuracy. When boundaries are positioned close to the structure, excessive constraining effects degrade precision. To ensure reliable results, the lateral boundary distance must be at least three times the structural span, and the vertical bottom boundary distance must be at least three times the structural height.
- (2)
By degenerating viscoelastic dynamic artificial boundaries to static conditions, static artificial boundary conditions are derived to simulate both static foundation reactions and far-field constraint effects. These boundaries are integrated into the IRDM, resulting in an improved methodology that accounts for far-field medium interactions.
- (3)
The computational accuracy of the IRDM considering far-field effects is influenced by the static artificial boundary parameters αT and αN and the dimensionless boundary distance ratio R. Through comprehensive numerical analyses, the following optimal parameters are recommended: αT = 0.5, αN =1.0, and R = 0.5 or 1.0. Compared with conventional approaches, the proposed method achieves significantly greater accuracy in terms of these parameters. This advancement provides an efficient and precise solution for seismic response analysis of large-scale underground structures.
- (4)
The proposed method facilitates rapid evaluation of multiple structural design schemes—such as variations in cross-sectional geometry or reinforcement layout—during early-stage design. For example, designers can now assess and compare the seismic performance of a three-cell metro station with that of a five-cell metro station within 2–3 h, a significant reduction from the 2–3 days typically required for full dynamic finite element simulations. This acceleration in decision-making efficiency is achieved without compromising compliance with the safety margins stipulated in codes.
Author Contributions
Conceptualization, X.B.; methodology, X.B. and D.W.; software, S.W. and B.Z.; validation, S.W. and D.W.; formal analysis, S.W.; investigation, S.W.; resources, X.B. and B.Z.; data curation, S.W.; writing—original draft preparation, S.W. and B.Z.; writing—review and editing, S.W. and D.W.; visualization, B.Z.; supervision, X.B. and B.Z.; project administration, X.B.; funding acquisition, X.B. All authors have read and agreed to the published version of the manuscript.
Funding
This study is supported by the National Key Research and Development Program of China (no. 2022YFC3003603), the National Natural Science Foundation of China (no. 52478497), and the Fundamental Research Funds for the Central Universities (DUT23RC(3)069). Financial support from these organizations is gratefully acknowledged.
Institutional Review Board Statement
Not applicable.
Informed Consent Statement
Not applicable.
Data Availability Statement
The raw data supporting the conclusions of this article will be made available by the authors upon request.
Conflicts of Interest
Author Dongyang Wang was employed by the company China Nuclear Power Engineering Co., Ltd. The remaining authors declare that the research was conducted in the absence of any commercial or financial relationships that could be construed as a potential conflict of interest.
References
- Du, X.L.; Wang, G.; Li, D.C. Earthquake damage mechanism analysis of Daikai Metro Station by Kobe earthquake. J. Disaster Prev. Mitig. Eng. 2016, 36, 165–171. (In Chinese) [Google Scholar]
- Shen, Y.; Gao, B.; Yang, X.; Tao, S. Seismic damage mechanism and dynamic deformation characteristic analysis of mountain tunnel after Wenchuan earthquake. Eng. Geol. 2014, 180, 85–98. [Google Scholar] [CrossRef]
- Li, W.T.; Wang, R.; Zhang, J.M. Influence of aboveground structure on connected underground structure seismic response within an integrated system. Tunn. Undergr. Space Technol. 2023, 134, 105003. [Google Scholar] [CrossRef]
- Qiu, D.; Wang, P.; Ren, W.; Chen, J.; Zhao, C. Seismic responses and failure mechanism of the superstructure-integrated underground structure considering the seismic aboveground-underground interaction. Soil Dyn. Earthq. Eng. 2023, 175, 108259. [Google Scholar] [CrossRef]
- Farzin, K.; Neda, A.; Robert, J. Optimization-based stacked machine-learning method for seismic probability and risk assessment of reinforced concrete shear walls. Expert Syst. Appl. 2024, 255, 124897. [Google Scholar]
- GB/T51336-2018; Chinese Standard for Seismic Design of Underground Structures. China Architecture & Building Press: Beijing, China, 2018.
- Li, L.; Yang, X.H.; Du, X. Improved response displacement method for evaluating seismic responses of underground structures. Chin. J. Geotech. Eng. 2014, 36, 1360–1364. (In Chinese) [Google Scholar]
- Bin, J.; Jing, L.; Cui, J.; Zou, Y.; Li, Y. Improvement of Spring Constant Calculation in Response Displacement Method. China Earthq. Eng. J. 2014, 36, 525–531. (In Chinese) [Google Scholar]
- Xu, K.; Jing, L.; Bin, J. A Comparative Analysis of Forced Displacement and Response Acceleration Methods for Underground Structures. China Earthq. Eng. J. 2020, 42, 967–972. (In Chinese) [Google Scholar]
- Ding, D.; Yang, X. Discussion on the Spring Constant of Ground Foundation in the Seismic Design of Underground Structures Using the Response Displacement Method. China Earthq. Eng. J. 2016, 38, 685–692. (In Chinese) [Google Scholar]
- Ding, D.Y. Discussion on Determination Methods for Coefficient of Subgrade Reaction in Response Displacement Method. Appl. Mech. Mater. 2014, 2974, 1524–1529. [Google Scholar] [CrossRef]
- Wang, W.; Feng, K.; Wang, Y.; He, C.; Zhu, G.; Ning, Y.; Zhao, L. A Solution of Subgrade Modulus for Response Displacement Method of Circular Underground Structures. Shock Vib. 2021, 2021, 3654147. [Google Scholar] [CrossRef]
- Liu, J.; Wang, D.; Tan, H.; Li, S.; Xin, B. Theorectical derivation and consistency proof of the integral response deformation method. China Civ. Eng. J. 2019, 52, 18–23. (In Chinese) [Google Scholar]
- Liu, J.B.; Wang, W.H.; Zhao, D.D.; Zhang, X.B. Integral response deformation method for seismic analysis of underground structure. Chin. J. Rock Mech. Eng. 2013, 32, 1618–1624. (In Chinese) [Google Scholar]
- Liu, J.; Wang, W.; Zhao, D.; Zhang, X. Integral response deformation method in seismic analysis of complex section underground structures. China Civ. Eng. J. 2014, 47, 134–142. (In Chinese) [Google Scholar]
- Xu, Z.; Ding, L.; Du, X.; Xu, C.; Zhuang, H. Generalized response displacement methods for seismic analysis of underground structures with complex cross section. Earthq. Eng. Eng. Vib. 2023, 22, 979–993. [Google Scholar] [CrossRef]
- An, J.; Feng, F.; Zhang, Y.; Li, M. Response Displacement Method for Seismic Calculation of Subway Station Complex Structure of TOD Mode. Buildings 2023, 13, 2987. [Google Scholar] [CrossRef]
- Bao, X.; Liu, J.B.; Li, S.T.; Lu, X.H.; Wang, F. Improvement of integral response deformation method for underground structures. Eng. Mech. 2023, 40, 76–86. (In Chinese) [Google Scholar]
- Hamada, M.; Sugihara, Y.; Shiba, Y.; Iwano, M. Observation and study on dynamic behavior of rock cavern during earthquake. Proc. Jpn. Earthq. Eng. Symp. 1982, 6, 1881–1888. [Google Scholar] [CrossRef][Green Version]
- Tateishi, A. A study on seismic analysis methods in the cross section of underground structures using static finite element method. J. Geotech. Eng. 2005, 22, 41–54. [Google Scholar] [CrossRef]
- Zhang, J.; He, C.; Geng, P.; Wang, W.; Yan, Q. Two simplified analysis processing and their application of underground structure seismic deformation method. Earthq. Eng. Eng. Dyn. 2014, 34, 248–253. (In Chinese) [Google Scholar]
- Yan, Q.; Yao, C.; He, C.; Geng, P. Application and Comparison of Conventional and Generalized Response Displacement Methods for Shallow-Buried DOT Shield Tunnels. Mod. Tunn. Technol. 2017, 54, 83–90. (In Chinese) [Google Scholar]
- Chen, Z.; Tan, Z.; Lou, M. Integral Forced Displacement Method for Seismic Design of Underground Structures. J. Tongji Univ. (Nat. Sci.) 2016, 44, 1145–1152. (In Chinese) [Google Scholar]
- Chen, Z.; Tan, Z.; Lou, M. Applicability analysis and modification for integral forced response displacement method. J. Vib. Shock. 2018, 37, 126–133. (In Chinese) [Google Scholar]
- Aki, K.; Paul, G. Quantitative Seismology, 2nd ed.; University Science Books: Sausalito, CA, USA, 2002. [Google Scholar]
- Lysmer, J.; Kuhlemeyer, R. Finite dynamic model for infinite media. J. Eng. Mech. ASCE 1969, 95, 859–877. [Google Scholar] [CrossRef]
- Japan Society of Civil Engineers. Japan’s Tunnel Seismic Design Guide; JSCE Press: Tokyo, Japan, 2016. [Google Scholar]
- American Society of Civil Engineers. Minimum Design Loads and Associated Criteria for Buildings and Other Structures; ASCE/SEI 7-22; ASCE Press: Reston, VA, USA, 2022. [Google Scholar]
Figure 1.
Computational model and load components of the IRDM.
Figure 1.
Computational model and load components of the IRDM.
Figure 2.
Auxiliary free-field model for computing equivalent seismic loads in the IRDM.
Figure 2.
Auxiliary free-field model for computing equivalent seismic loads in the IRDM.
Figure 3.
Schematic diagram of the SSI model.
Figure 3.
Schematic diagram of the SSI model.
Figure 5.
Computational accuracy of the IRDM under different RS values, where RS is a dimensionless lateral boundary distance ratio RS = LS/L.
Figure 5.
Computational accuracy of the IRDM under different RS values, where RS is a dimensionless lateral boundary distance ratio RS = LS/L.
Figure 6.
Shear stress distributions computed via the IRDM under different RS values, where RS is a dimensionless lateral boundary distance ratio RS = LS/L.
Figure 6.
Shear stress distributions computed via the IRDM under different RS values, where RS is a dimensionless lateral boundary distance ratio RS = LS/L.
Figure 7.
Computational accuracy of the IRDM under different RB values, where RB is a dimensionless bottom boundary distance ratio RB = HB/H.
Figure 7.
Computational accuracy of the IRDM under different RB values, where RB is a dimensionless bottom boundary distance ratio RB = HB/H.
Figure 8.
Shear stress computed via the IRDM under different RB values, where RB is a dimensionless bottom boundary distance ratio RB = HB/H.
Figure 8.
Shear stress computed via the IRDM under different RB values, where RB is a dimensionless bottom boundary distance ratio RB = HB/H.
Figure 9.
Schematic diagram of the static artificial boundary elements, where is the shear modulus, is the Young’s modulus, is the Poisson’s ratio of the static artificial boundary element, and h is the thickness of the element.
Figure 9.
Schematic diagram of the static artificial boundary elements, where is the shear modulus, is the Young’s modulus, is the Poisson’s ratio of the static artificial boundary element, and h is the thickness of the element.
Figure 10.
Schematic diagram of the IRDM computational model considering far-field effects.
Figure 10.
Schematic diagram of the IRDM computational model considering far-field effects.
Figure 11.
Computational accuracy of the proposed method under different αT values, where αT is the parameter of the static artificial boundary element.
Figure 11.
Computational accuracy of the proposed method under different αT values, where αT is the parameter of the static artificial boundary element.
Figure 12.
Acceleration time histories of seismic ground motions.
Figure 12.
Acceleration time histories of seismic ground motions.
Figure 13.
Computational accuracy comparison under the Kobe earthquake excitation, where R is the dimensionless boundary distance ratio R = RS = RB.
Figure 13.
Computational accuracy comparison under the Kobe earthquake excitation, where R is the dimensionless boundary distance ratio R = RS = RB.
Figure 14.
Computational accuracy comparison under Loma Prieta earthquake excitation, where R is the dimensionless boundary distance ratio R = RS = RB.
Figure 14.
Computational accuracy comparison under Loma Prieta earthquake excitation, where R is the dimensionless boundary distance ratio R = RS = RB.
Figure 15.
Computational accuracy comparison under Northridge earthquake excitation, where R is the dimensionless boundary distance ratio R = RS = RB.
Figure 15.
Computational accuracy comparison under Northridge earthquake excitation, where R is the dimensionless boundary distance ratio R = RS = RB.
Table 1.
Internal forces at selected sections and deformation of the central columns under different loading cases.
Table 1.
Internal forces at selected sections and deformation of the central columns under different loading cases.
| RT | Seismic Wave | Method | A section Axial Force N (kN) | E Section Shear Force Q (kN) | F Section Bending Moment M (kN·m) | Deformation of Central Columns (mm) |
|---|
| 0.5 | Loma Prieta | Dynamic time history method | −31.54 | −11.51 | −32.91 | −0.6801 |
Traditional
IRDM | −21.52
(−31.78%) | −7.82
(−32.07%) | −23.42
(−28.82%) | −0.5482
(−19.39%) |
| New method | −32.48
(2.96%) | −10.51
(−8.66%) | −30.44
(−7.50%) | −0.6403
(−5.85%) |
| Kobe | Dynamic time history method | −32.54 | −10.85 | −31.87 | −0.6587 |
Traditional
IRDM | −21.92
(−32.64%) | −7.88
(−27.35%) | −24.24
(−23.93%) | −0.5616
(−14.74%) |
| New method | −33.09
(1.71%) | −10.62
(−2.12%) | −31.38
(−1.54%) | −0.6542
(−0.69%) |
| Northridge | Dynamic time history method | −31.88 | −11.32 | −32.66 | −0.6703 |
Traditional
IRDM | −21.96
(−31.11%) | −8.06
(−28.84%) | −23.94
(−26.70%) | −0.5603
(−16.40%) |
| New method | −33.19
(4.11%) | −10.82
(−4.41%) | −31.14
(−4.64%) | −0.6555
(−2.20%) |
| 1.0 | Loma Prieta | Dynamic time history method | −31.54 | −11.51 | −32.91 | −0.6801 |
Traditional
IRDM | −25.77
(−18.31%) | −9.06
(−21.27%) | −26.64
(−19.03%) | −0.5923
(−12.91%) |
| New method | −33.37
(5.80%) | −11.02
(−4.23%) | −31.68
(−3.72%) | −0.6512
(−4.25%) |
| Kobe | Dynamic time history method | −32.54 | −10.85 | −31.87 | −0.6587 |
Traditional
IRDM | −26.26
(−19.30%) | −9.15
(−15.73%) | −27.51
(−13.67%) | −0.6058
(−8.03%) |
| New method | −34.01
(4.52%) | −11.14
(2.64%) | −32.64
(2.41%) | −0.6651
(0.97%) |
| Northridge | Dynamic time history method | −31.88 | −11.32 | −32.66 | −0.6703 |
Traditional
IRDM | −26.29
(−17.52%) | −9.33
(−17.57%) | −27.24
(−16.57%) | −0.6057
(−9.63%) |
| New method | −34.11
(7.00%) | −11.35
(0.24%) | −32.43
(−0.70%) | −0.6671
(−0.46%) |
| 5.0 | Loma Prieta | Dynamic time history method | −31.54 | −11.51 | −32.91 | −0.6801 |
Traditional
IRDM | −30.79
(−2.40%) | −10.43
(−9.38%) | −30.14
(−8.40%) | −0.6319
(−7.09%) |
| New method | −31.26
(−0.89%) | −10.58
(−8.02%) | −30.54
(−7.20%) | −0.6320
(−7.07%) |
| Kobe | Dynamic time history method | −32.54 | −10.85 | −31.87 | −0.6587 |
Traditional
IRDM | −31.37
(−3.57%) | −10.54
(−2.90%) | −31.08
(−2.50%) | −0.6458
(−1.96%) |
| New method | −31.86
(−2.08%) | −10.70
(−1.43%) | −31.48
(−1.23%) | −0.6457
(−1.98%) |
| Northridge | Dynamic time history method | −31.88 | −11.32 | −32.66 | −0.6703 |
Traditional
IRDM | −31.43
(−1.41%) | −10.74
(−5.17%) | −30.84
(−5.57%) | −0.6467
(−3.51%) |
| New method | −31.91
(0.10%) | −10.90
(−3.77%) | −31.23
(−4.35%) | −0.6473
(−3.43%) |
Table 2.
Computational efficiency comparison of different analysis methods.
Table 2.
Computational efficiency comparison of different analysis methods.
| Computational Efficiency Index | New Method | Traditional
IRDM (R = 4.0) |
|---|
| R = 0.5 | R = 1.0 | R = 2.0 |
|---|
| Elements | 1836 (91.36%) | 3496 (83.55%) | 8016 (62.29%) | 21,256 |
| Node | 2028 (90.69%) | 3738 (82.85%) | 8358 (61.65%) | 21,792 |
Table 3.
Internal forces at selected sections and deformation of the central columns under different soil shear velocities.
Table 3.
Internal forces at selected sections and deformation of the central columns under different soil shear velocities.
| Soil Shear Velocity/(m/s) | Method | A section Axial Force N (kN) | E section Shear Force Q (kN) | F section Bending Moment M (kN·m) | Deformation of Central Columns (mm) |
|---|
| 140 | Dynamic time history method | −34.80 | −22.64 | −63.02 | −1.6181 |
| Proposed method | −34.44 (−1.03%) | −22.34 (−1.33%) | −62.22 (−1.27%) | −1.5987 (−1.20%) |
| 200 | Dynamic time history method | −35.41 | −17.68 | −49.90 | −1.1003 |
| Proposed method | −35.02 (−1.10%) | −17.10 (−3.28%) | −48.50 (−2.81%) | −1.0801 (−1.84%) |
| 300 | Dynamic time history method | −32.54 | −10.85 | −31.87 | −0.6587 |
| Proposed method | −33.09 (1.71%) | −10.62 (−2.12%) | −31.38 (−1.54%) | −0.6542 (−0.69%) |
| 600 | Dynamic time history method | −29.14 | −2.78 | −11.65 | −0.2342 |
| Proposed method | −27.57 (−5.39%) | −2.65 (−4.68%) | −11.32 (−2.83%) | −0.2277 (−2.78%) |
Table 4.
Internal forces at selected sections and deformation of the central columns under different structural stiffnesses.
Table 4.
Internal forces at selected sections and deformation of the central columns under different structural stiffnesses.
| Es/E* | Method | A Section Axial Force N (kN) | E Section Shear Force Q (kN) | F Section Bending Moment M (kN·m) | Deformation of Central Columns (mm) |
|---|
| 0.5 | Dynamic time history method | −32.07 | −6.02 | −19.75 | −0.8016 |
| Proposed method | −32.87 (2.49%) | −5.83 (−3.16%) | −19.11 (−3.24%) | −0.7798 (−2.72%) |
| 1 | Dynamic time history method | −32.54 | −10.85 | −31.87 | −0.6587 |
| Proposed method | −33.09 (1.71%) | −10.62 (−2.12%) | −31.38 (−1.54%) | −0.6542 (−0.69%) |
| 1.5 | Dynamic time history method | −34.11 | −14.27 | −40.49 | −0.5718 |
| Proposed method | −32.75 (−3.99%) | −13.24 (−7.22%) | −39.04 (−3.58%) | −0.5539 (−3.13%) |
| 2 | Dynamic time history method | −34.63 | −16.83 | −46.92 | −0.5114 |
| Proposed method | 32.98(−4.76%) | −16.00 (−4.93%) | −44.91 (−4.28%) | −0.5011 (−2.01%) |
Table 5.
Comparison of different methods.
Table 5.
Comparison of different methods.
| Criteria | Dynamic Time History Method | Conventional IRDM | Improved IRDM |
|---|
| Accuracy | High (benchmark) | Moderate (errors up to 30% for small R) | High (errors < 5% for R = 0.5) |
| Computational Demands | Very high (full dynamic model) | High (large domain, R ≥ 3.0) | Low (80–90% reduction vs. conventional) |
| Boundary Treatment | Requires artificial boundaries (e.g., viscoelastic boundary) | Fixed boundaries at R ≥ 3.0 | Static artificial boundaries (R ≥ 0.5) |
| Applicability | Complex 3D/nonlinear analyses | Homogeneous/layered soils | Homogeneous/layered soils |
| Ease of Use | Complex (time-step integration) | Moderate (empirical boundary placement) | High (small model) |
| Disclaimer/Publisher’s Note: The statements, opinions and data contained in all publications are solely those of the individual author(s) and contributor(s) and not of MDPI and/or the editor(s). MDPI and/or the editor(s) disclaim responsibility for any injury to people or property resulting from any ideas, methods, instructions or products referred to in the content. |
© 2025 by the authors. Licensee MDPI, Basel, Switzerland. This article is an open access article distributed under the terms and conditions of the Creative Commons Attribution (CC BY) license (https://creativecommons.org/licenses/by/4.0/).
