Article

Evaluation of Manufacturing Accuracy in Merlon Fracture Models Fabricated by Vat Photopolymerization 3D-Printing Technologies

1
Department of Dental Technology, Bucheon University, 56 Sosa-ro, Bucheon 14774, Republic of Korea
2
Department of Dental Laboratory Technology, Faculty of Health and Medical Sciences, Wonkwang Health Science University, 514 Iksan-Daero, Iksan 54538, Republic of Korea
3
Department of Dental Engineering, College of Health Sciences, Honam University, 100 Honamdae-gil, Gwangju 62399, Republic of Korea
4
Department of Dental Biomaterials and the Institute for Biomaterials and Implant, College of Dentistry, Wonkwang University, 460 Iksan-Daero, Iksan 54538, Republic of Korea
5
Department of Oral and Maxillofacial Surgery, College of Dentistry, Wonkwang University, 460 Iksan-Daero, Iksan 54538, Republic of Korea
*
Author to whom correspondence should be addressed.
Appl. Sci. 2025, 15(10), 5595; https://doi.org/10.3390/app15105595
Submission received: 19 March 2025 / Revised: 7 May 2025 / Accepted: 15 May 2025 / Published: 16 May 2025
(This article belongs to the Special Issue Advances in Additive Manufacturing: Novel Technologies and Processes)

Abstract

:
This study evaluates the manufacturing accuracy of Merlon fracture models produced using two vat-photopolymerization-based three-dimensional (3D) printers: digital light processing (DLP) and liquid-crystal display (LCD). The Merlon fracture model is used to assess dimensional precision and machining accuracy. The root mean square (RMS) values, wall and bottom thicknesses, and field-emission scanning electron microscopy images are analyzed. The DLP-based printers exhibit lower RMS values and superior accuracy compared with LCD-based printing and subtractive milling. Polymer-based slurries for permanent dental applications exhibit better dimensional stability than those for temporary restorations. This study also highlights the significant impact of postprocessing and cleaning procedures on the final model accuracy. These findings suggest that optimizing the postprocessing parameters is crucial for enhancing the precision of 3D-printed dental restorations. The Merlon fracture model is a viable method for evaluating additive manufacturing accuracy, contributing to the improved clinical application of vat photopolymerization in dental prosthetics.

1. Introduction

The accuracy and precision of dental prosthetics are crucial for ensuring optimal performance, longevity, and patient satisfaction [1,2]. The most popular computer-aided design/manufacturing (CAD/CAM) systems in dentistry, which are based on subtractive manufacturing (SM) technology, offer good accuracy and precision in dental prosthetics [3,4]. However, the limitation of milling burrs in reaching all areas restricts the precise machining of fine and complex parts of dental prostheses. Additive manufacturing (AM) technology is a recent development in the field of dentistry that can address the limitations of SM technology. Recent advancements in three-dimensional (3D)-printing technology have revolutionized the manufacturing field, particularly in the production of complex geometries and customized structures in dentistry [5,6,7]. Among various 3D-printing techniques, polymer-based vat photopolymerization is notable because of its ability to produce highly detailed and precise dental prostheses. This process employs light to cure polymer-based resins into solid polymers, making it particularly suitable for applications requiring high accuracy and intricate details [8,9].
As technology advances, a variety of vat-photopolymerization printers, each with unique capabilities and specifications, have become available in the market. These printers utilize different photopolymer resins, layer thicknesses, and exposure settings, all of which can significantly influence the accuracy and fidelity of printed models [9,10,11]. Despite the promise of these technologies, the variability in manufacturing accuracy persists, posing challenges to their clinical implementation. The most important factors in the fabrication of dental prostheses are the accuracy and precision of the initial design image and final manufactured prosthesis [12,13]. Accuracy evaluation methods based on various standard models were proposed for SM-based CAD/CAM systems [14,15,16]. However, an academically oriented model for accuracy evaluation has not been proposed for dental prostheses produced using AM technology, and it is evaluated using clinically relevant clinical models [17,18].
Prior to developing a new standard model for AM-accuracy evaluation, we performed a pilot test on existing international standard models for machining evaluation to evaluate their applicability to AM-accuracy evaluation [14,15,16]. Among the various international standard models, the Merlon fracture model defined in ISO Three-Dimensional-Printed exhibits several advantages over other standard models [14]. The Merlon fracture model, originally designed to evaluate the accuracy of SM processes, is a standardized model of most manufactured dental crowns, consisting of a base and four separate walls (referred to as merlons), and presents a potential solution for assessing AM accuracy. Therefore, despite its small size, the complexity of the four separate walls makes it a good model for evaluating the machinability of AM-fabricated dental prostheses.
Therefore, this research investigated the feasibility of using the Merlon fracture model to evaluate the accuracy of vat-photopolymerization-based AM techniques. Two widely used 3D-printing technologies, digital light processing (DLP) and liquid-crystal display (LCD), were selected along with two polymer-based printing slurries for temporary and permanent crowns and bridges (C&Bs) to examine their influence on dimensional precision. By employing a series of quantitative metrics and comparisons, we aimed to identify the features and limitations of each 3D printer by rendering these models.

2. Materials and Methods

2.1. Materials and Devices

Two vat-photopolymerization printers (DLP and LCD) and two 3D-printing resins were used to print the Merlon fracture model. The 3D-printing resin for temporary C&Bs (Arum C&B 5.0 hybrid resin, Arum Dentistry Co., Daejeon, Republic of Korea) is not compatible with an LCD 3D printer (Phrozen sonic mighty 4K, Phrozen Tech Co., Hsinchu City, Taiwan, China); therefore, this combination was excluded from this study. In addition, we used a Merlon model prepared using a milling machine (DWX-51D, Roland DGC Co., Irvine, CA, USA) and CAM block (Kuwotech PMMA A2, Kuwotech Co., Kwangju, Republic of Korea) as the control group. A comprehensive list of all materials and devices utilized in this study is provided in Table 1.

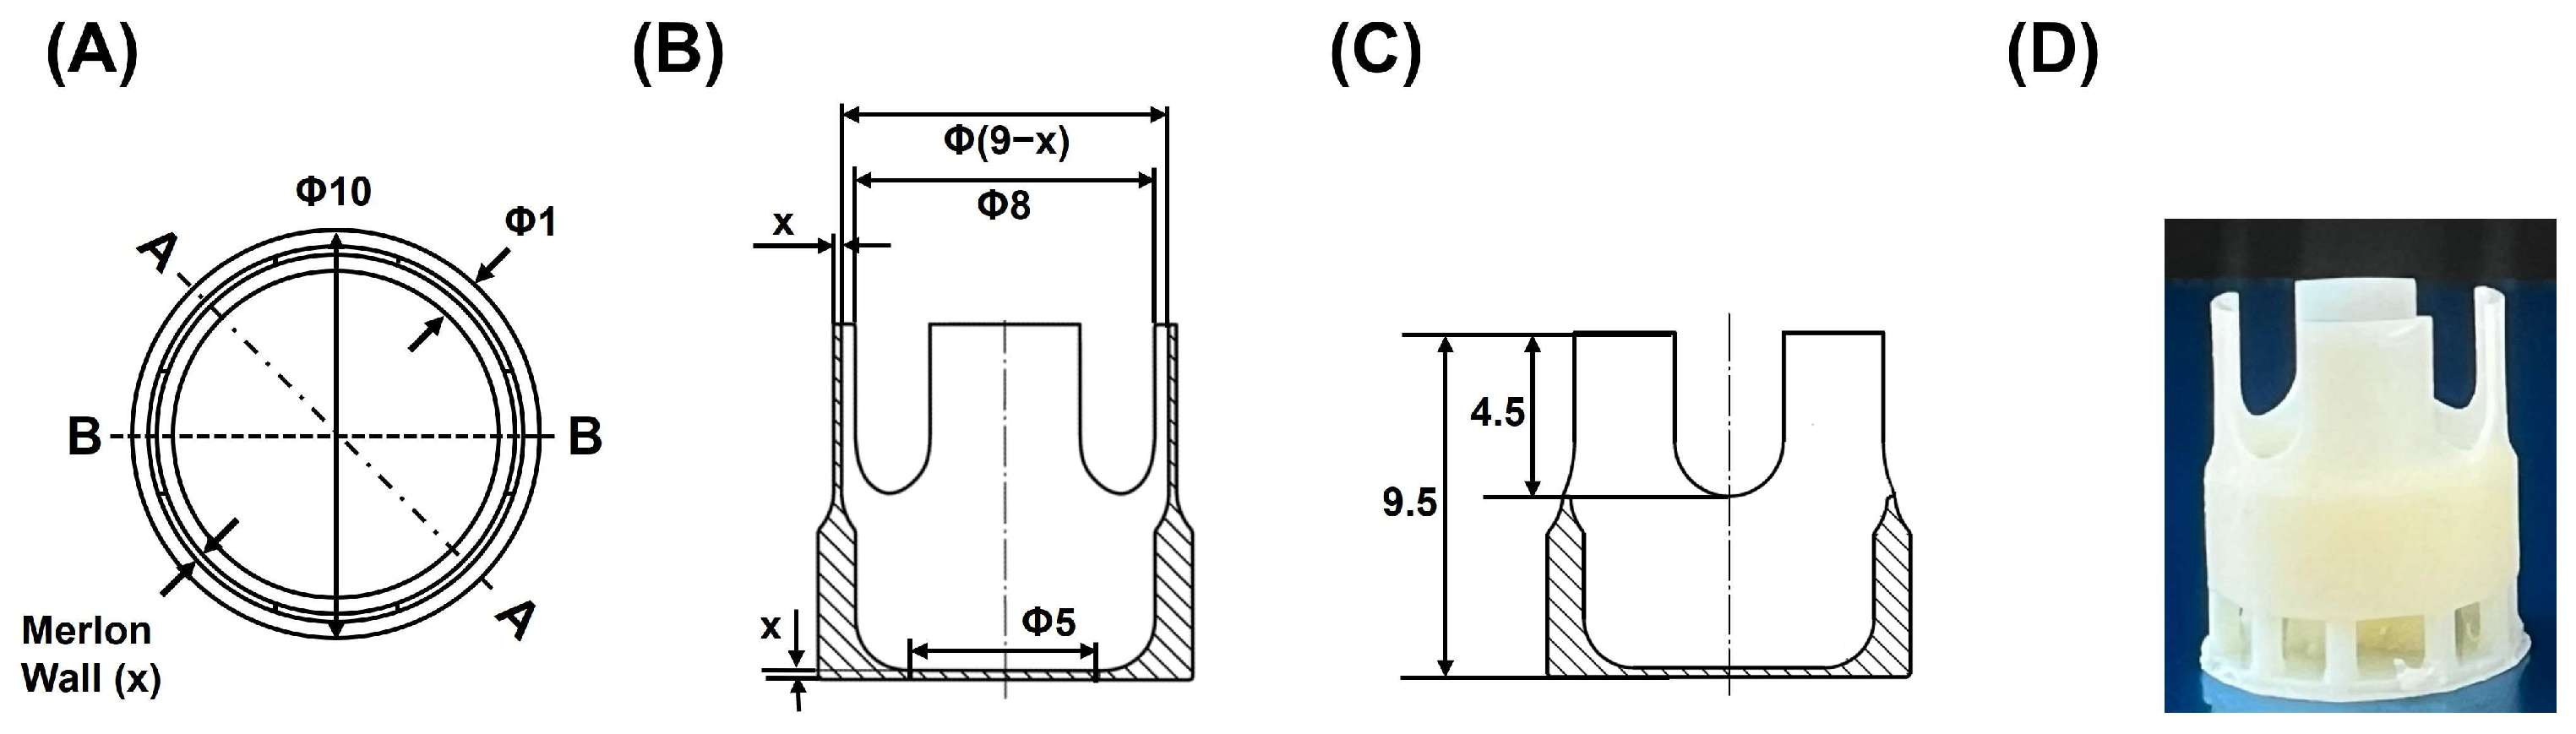
2.2. CAD Reference-Data Design

To create the Merlon fracture model defined in ISO 18675 [14], CAD reference data (CRD) in the STL file format were generated using 3D-design software (AutoCAD Ver. 24, Autodesk Inc., San Francisco, CA, USA). The designed model, illustrated in Figure 1A–C, features a circular structure (⌀ = 10.0 mm, h = 9.5 mm) with one side enclosed. Four vertical walls, known as merlons, extend from a flat bottom floor, and the wall and bottom thicknesses varied in 0.1 mm increments. A photograph of the 3D-printed Merlon fracture model with the support is shown in Figure 1D.

2.3. Sample Preparation

The protocol for sample preparation using a 3D printer was as follows. After fabrication, all samples were ultrasonically cleaned for 5 min in a solution of 99% isopropyl alcohol (Green Pharmaceutical Co., Jincheon, Republic of Korea) using an ultrasonic cleaner for 3D-printing resins (Form Wash, Formlabs Co., Somerville, MA, USA). The cleaned samples were then subjected to postcuring using an ultraviolet curing machine (Arum UV Curing Machine, Arum Co., Daejeon, Republic of Korea) for 10 min to obtain the final cure. After postcuring, the bottom support was removed using a tungsten carbide burr without additional treatment of the bottom surface.
A total of 120 specimens were fabricated according to the Merlon fracture test model, divided into four experimental groups (thirty samples per group) with three varying thicknesses. The specimens that were partially broken or deformed during the manufacturing process were discarded and reprinted to ensure an equal number of specimens in each experimental group. Based on ISO 18675, the thickness used in the Merlon fracture model ranges from 0.1 mm to 0.5 mm. However, models with thicknesses of 0.1 mm and 0.2 mm could not be successfully fabricated using either the 3D-printing or milling processes. Consequently, these thickness conditions were excluded from the manufacturing accuracy tests.

2.4. Manufacturing Accuracy Test

The sample was digitized using a 3D scanning device (E4, 3Shape, Copenhagen, Denmark) to generate CAD specimen data (CSD). The obtained CSD were subsequently aligned with the CRD through 3D analysis software (Geomagic Control X Ver. 2023, 3D Systems Inc., Rock Hill, SC, USA), enabling the calculation of the root mean square (RMS) value based on Equation (1):
R M S = 1 n i = 1 n X 1 , i X 2 , i 2
where X1,i represents the measurement point i of the CRD, X2,i denotes the corresponding measurement point of the CSD, and n indicates the total number of measurement points.
Computed RMS values were visualized through a colorization map, providing a graphical representation of the manufacturing accuracy of the fabricated samples.

2.5. Thickness Measurement of Wall and Bottom Part

To validate the digital analysis, the thicknesses of the wall and bottom components were measured using a tube micrometer and point micrometer, respectively (Digimatic® micrometer, measuring range: 0–25.0 mm, resolution: 0.001 mm, Mitutoyo Co., Kanagawa, Japan). Wall thickness was assessed by measuring the upper two-thirds and center of the wall, whereas the bottom thickness was measured at one point in each of the four directions within a 5 mm diameter from the center of the bottom surface (green areas in Figure 2). Twenty thickness measurements were performed for five specimens per group.

2.6. FE-SEM Observation

The vertical walls of the specimens were analyzed to evaluate the quality of the 3D-printed layers. Surface morphology was examined using field-emission scanning electron microscopy (FE-SEM; S4800, Hitachi Ltd., Tokyo, Japan).

2.7. Statistical Analysis

All test results were expressed as mean ± standard deviation. To assess statistically significant differences among the results, a one-way analysis of variance (ANOVA) was performed, followed by the Games–Howell test for post hoc comparisons. A significance level of α = 0.05 was applied, and all statistical analyses were conducted using IBM SPSS 24 software (SPSS Inc., Chicago, IL, USA).

3. Results

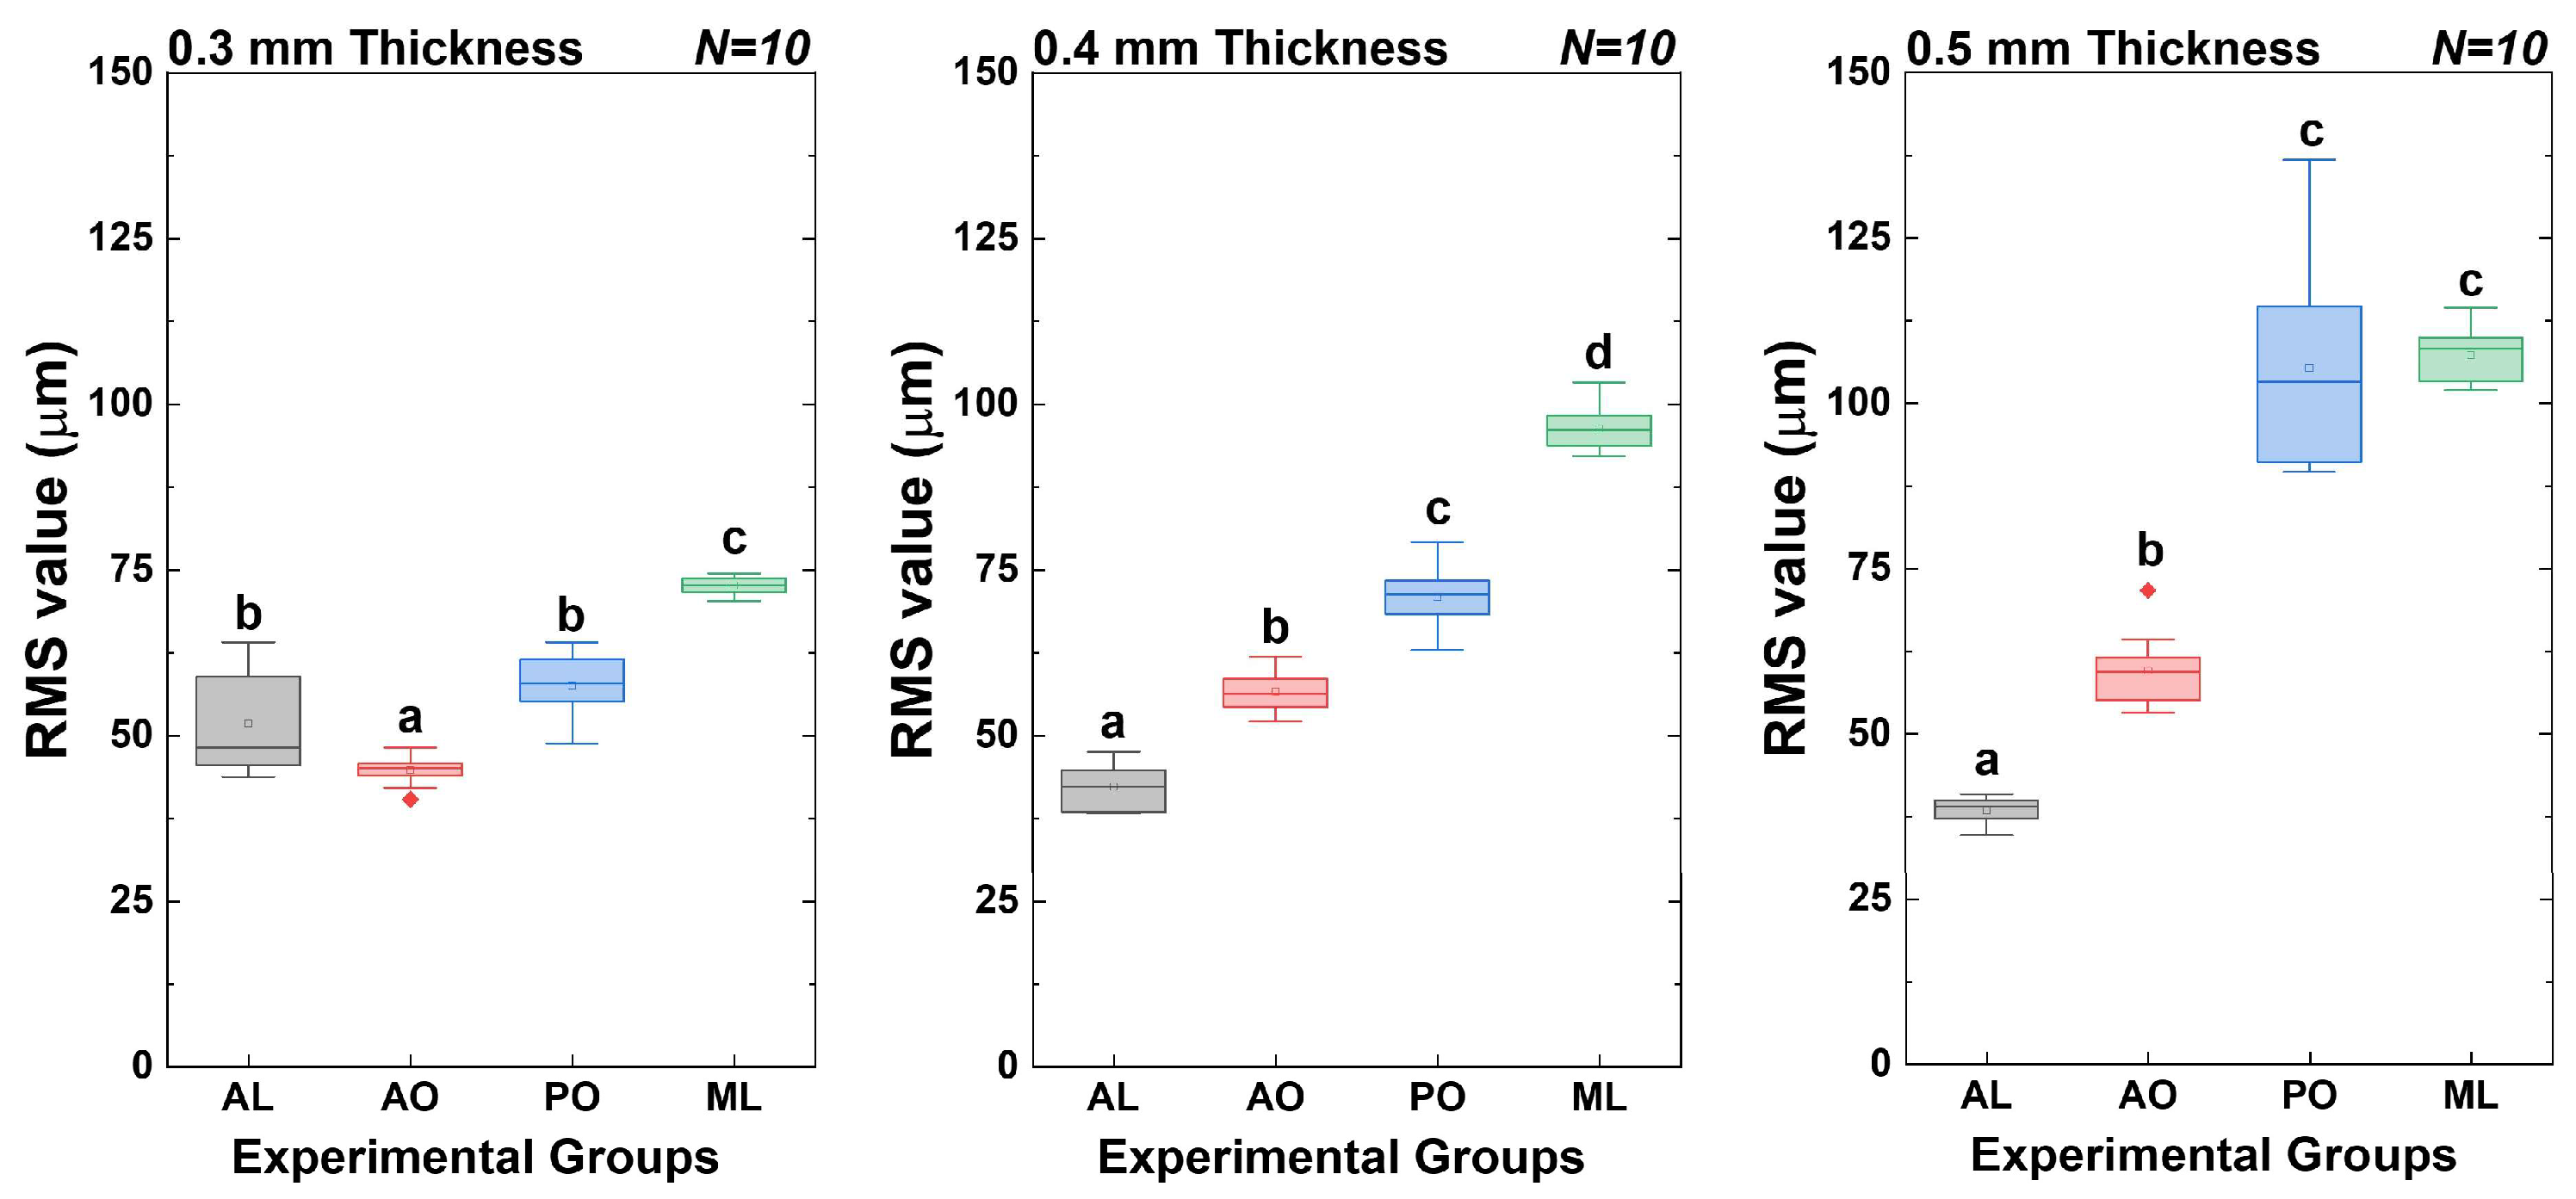
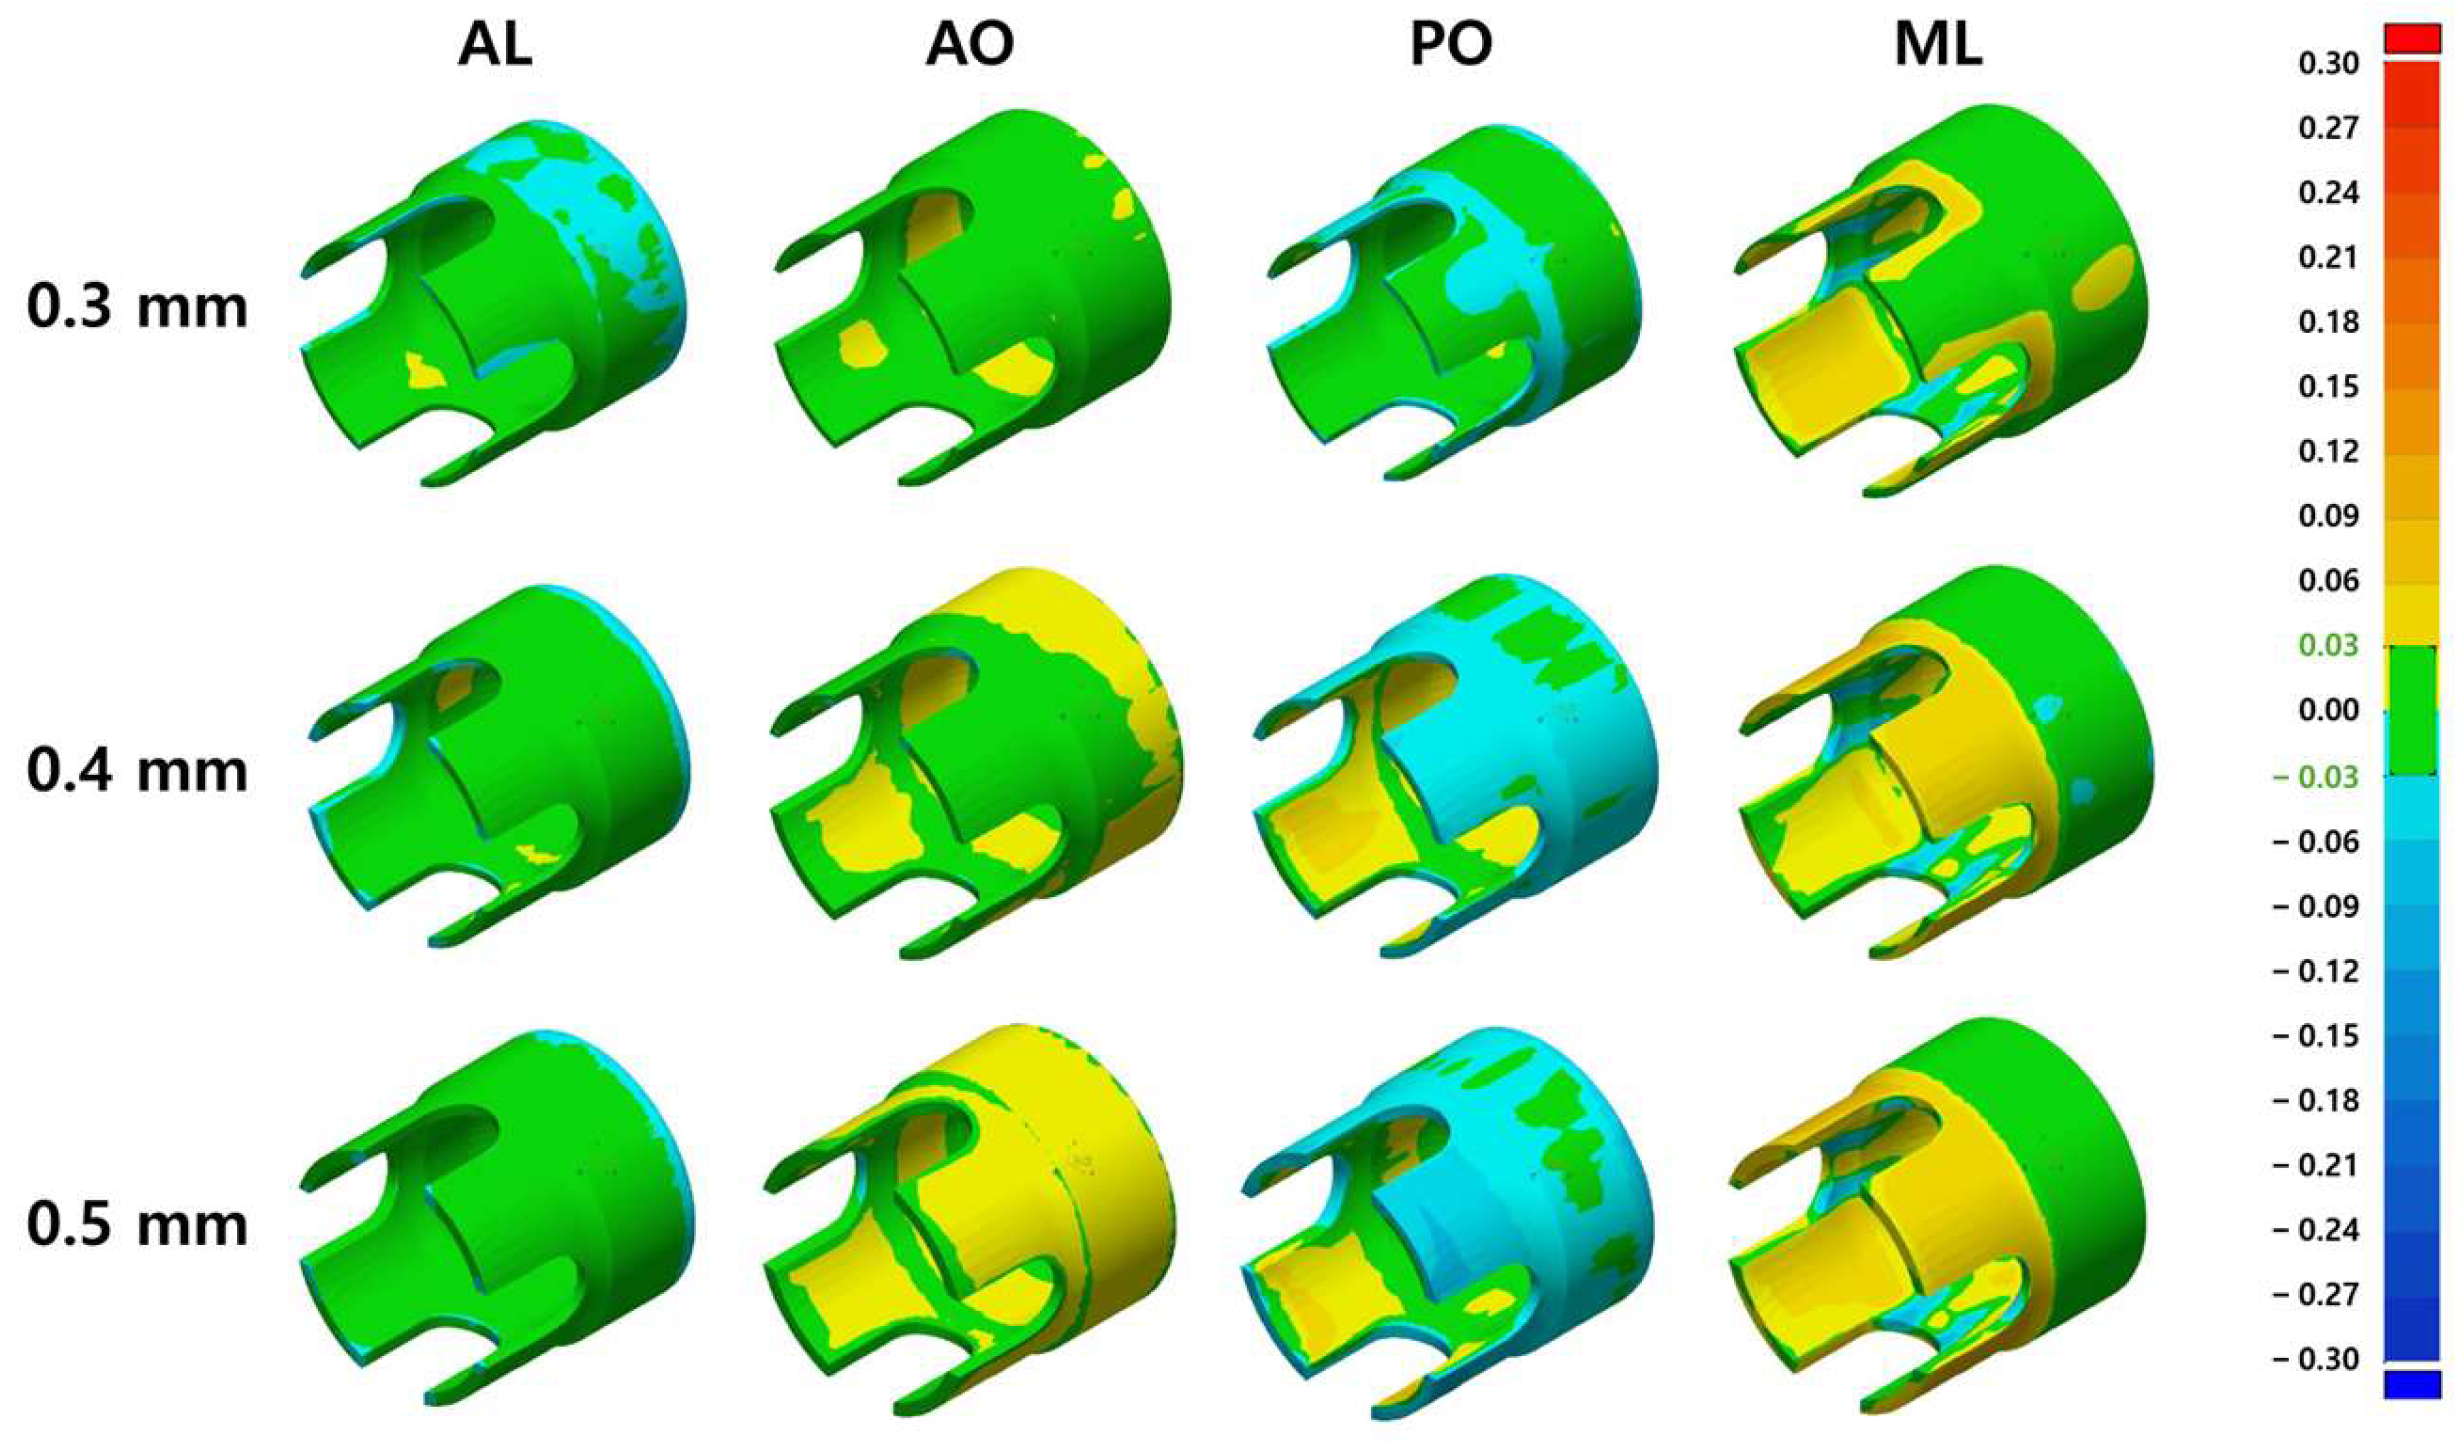
3.1. Manufacturing Accuracy Test

The RMS values for the total area, encompassing both the wall and bottom sections across all experimental groups, are presented in Table 2 and Figure 3. At a wall thickness of 0.3 mm, the AO group exhibited the lowest RMS value (44.78 ± 2.19 µm) among all experimental groups, with a statistically significant difference (p < 0.05). For the 0.4 mm and 0.5 mm wall thickness conditions, the RMS value of the AL group had the lowest value among all experimental groups (0.4 mm thickness: 42.25 ± 3.27 μm; 0.5 mm thickness: 38.50 ± 2.05 μm), followed by that of the AO group (0.4 mm thickness: 56.58 ± 3.02 μm; 0.5 mm thickness: 59.54 ± 5.41 μm) (p < 0.05). The RMS value of the ML group had the highest value for all wall thickness conditions (0.3 mm thickness: 72.68 ± 1.27 μm; 0.4 mm thickness: 96.31 ± 3.31 μm; 0.5 mm thickness: 107.29 ± 4.06 μm).
The calculated RMS values for samples from each experimental group are illustrated in Figure 4. Most of the image area was green, indicating an error within 30 μm. The yellow areas (error of 30–90 μm) in the images for the AO, PO, and ML groups were mostly located in the wall area. In the PO specimen, a cyan area was observed on the outside, including in the wall area, which was observed to decrease compared to the STL image.

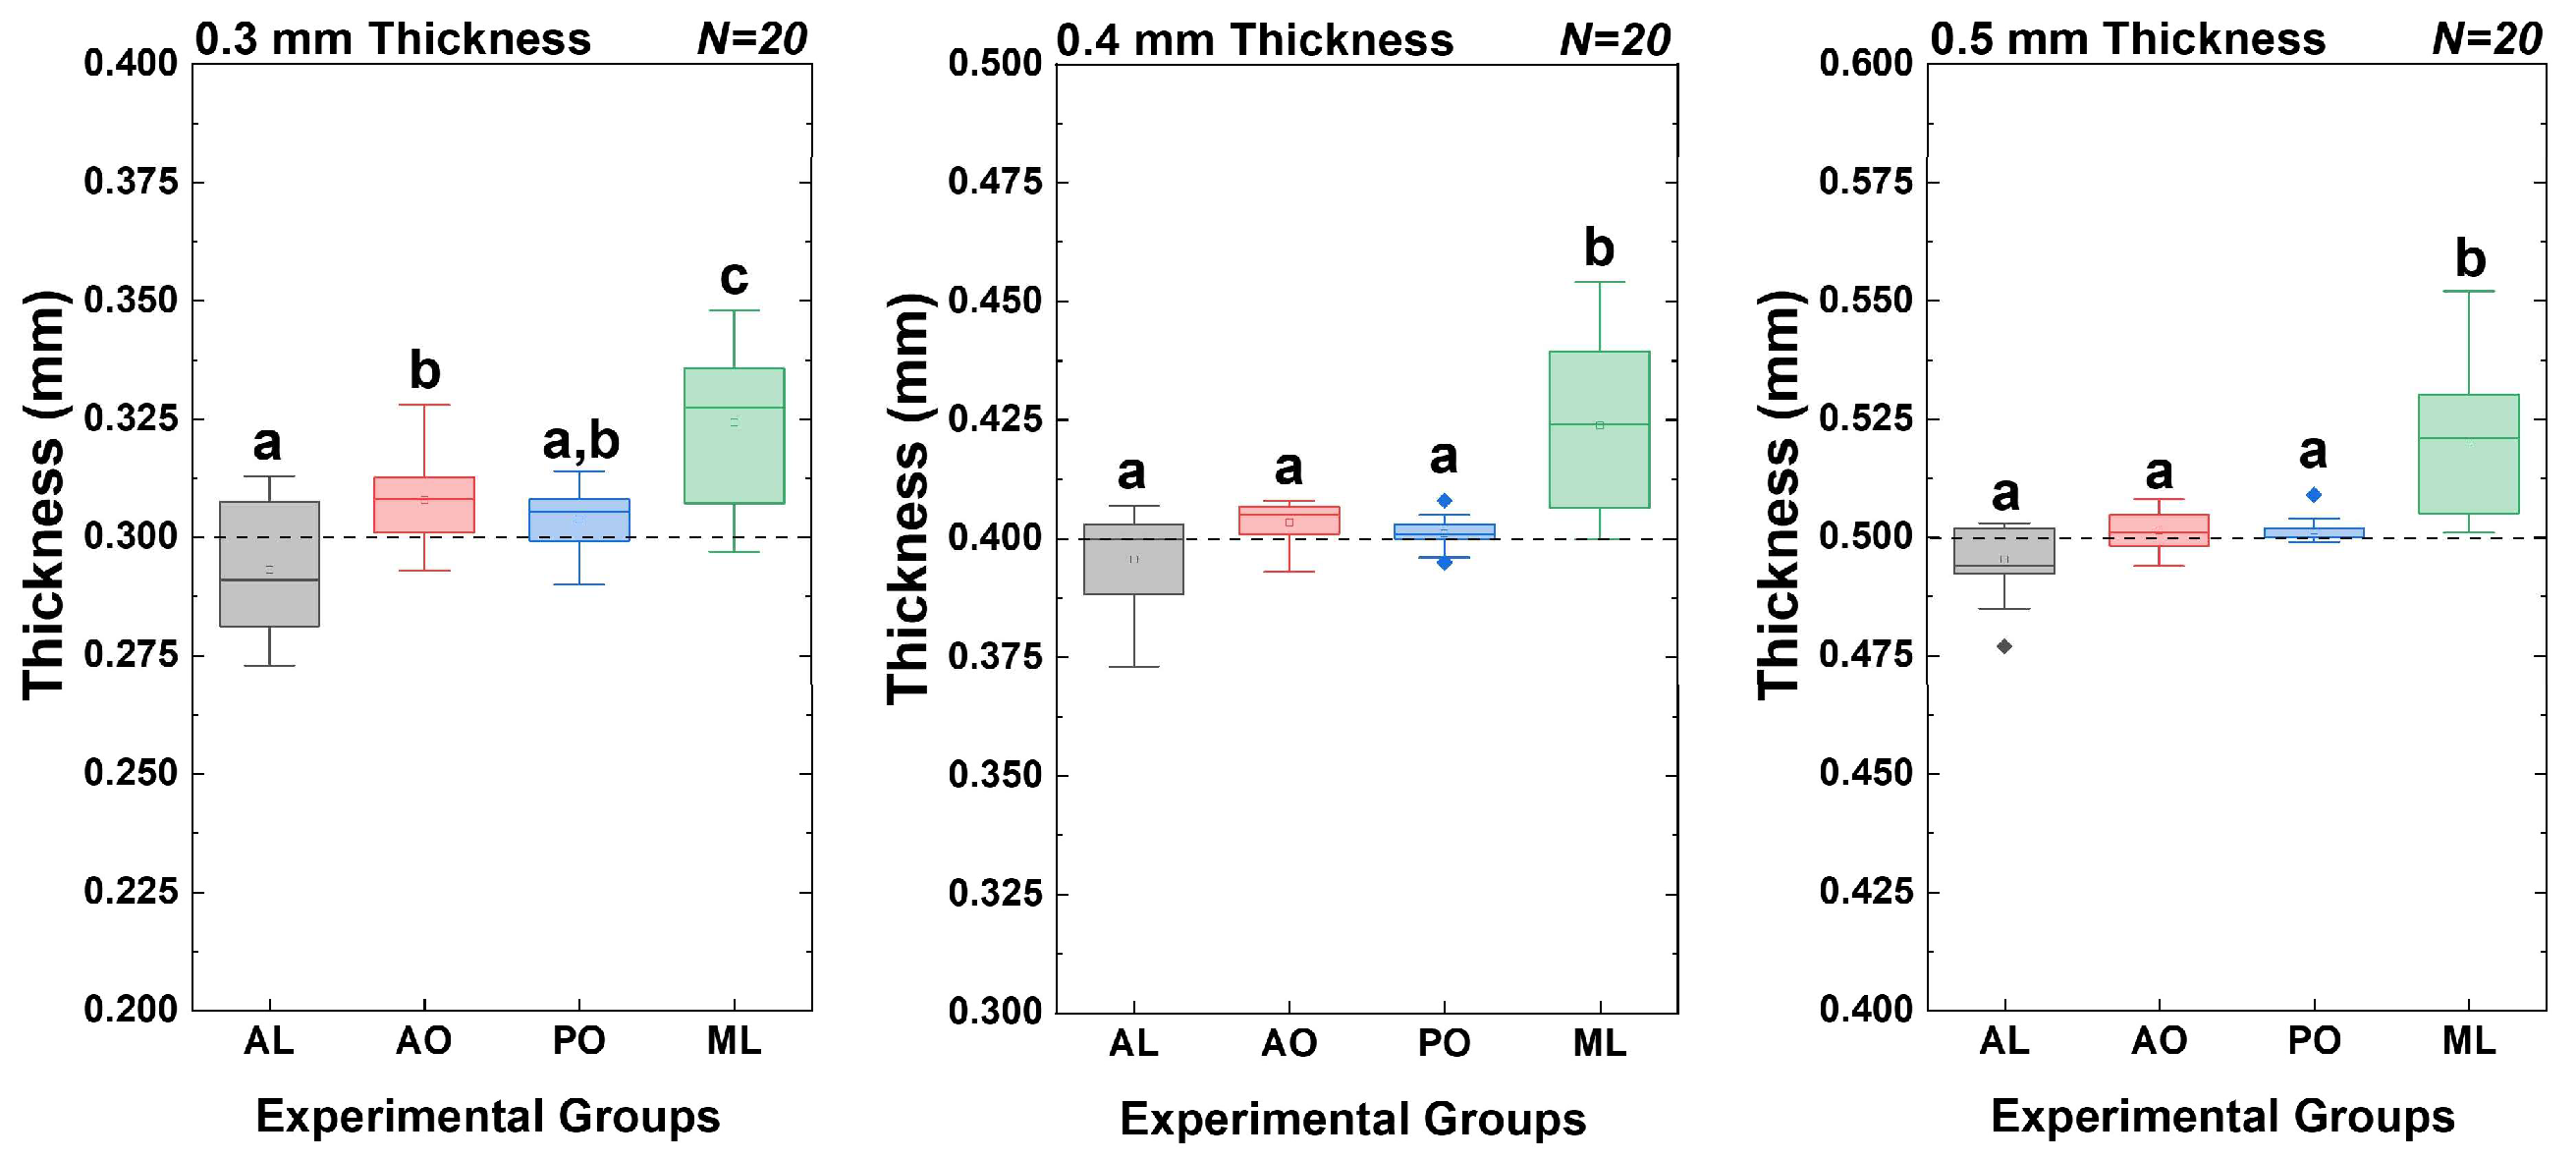
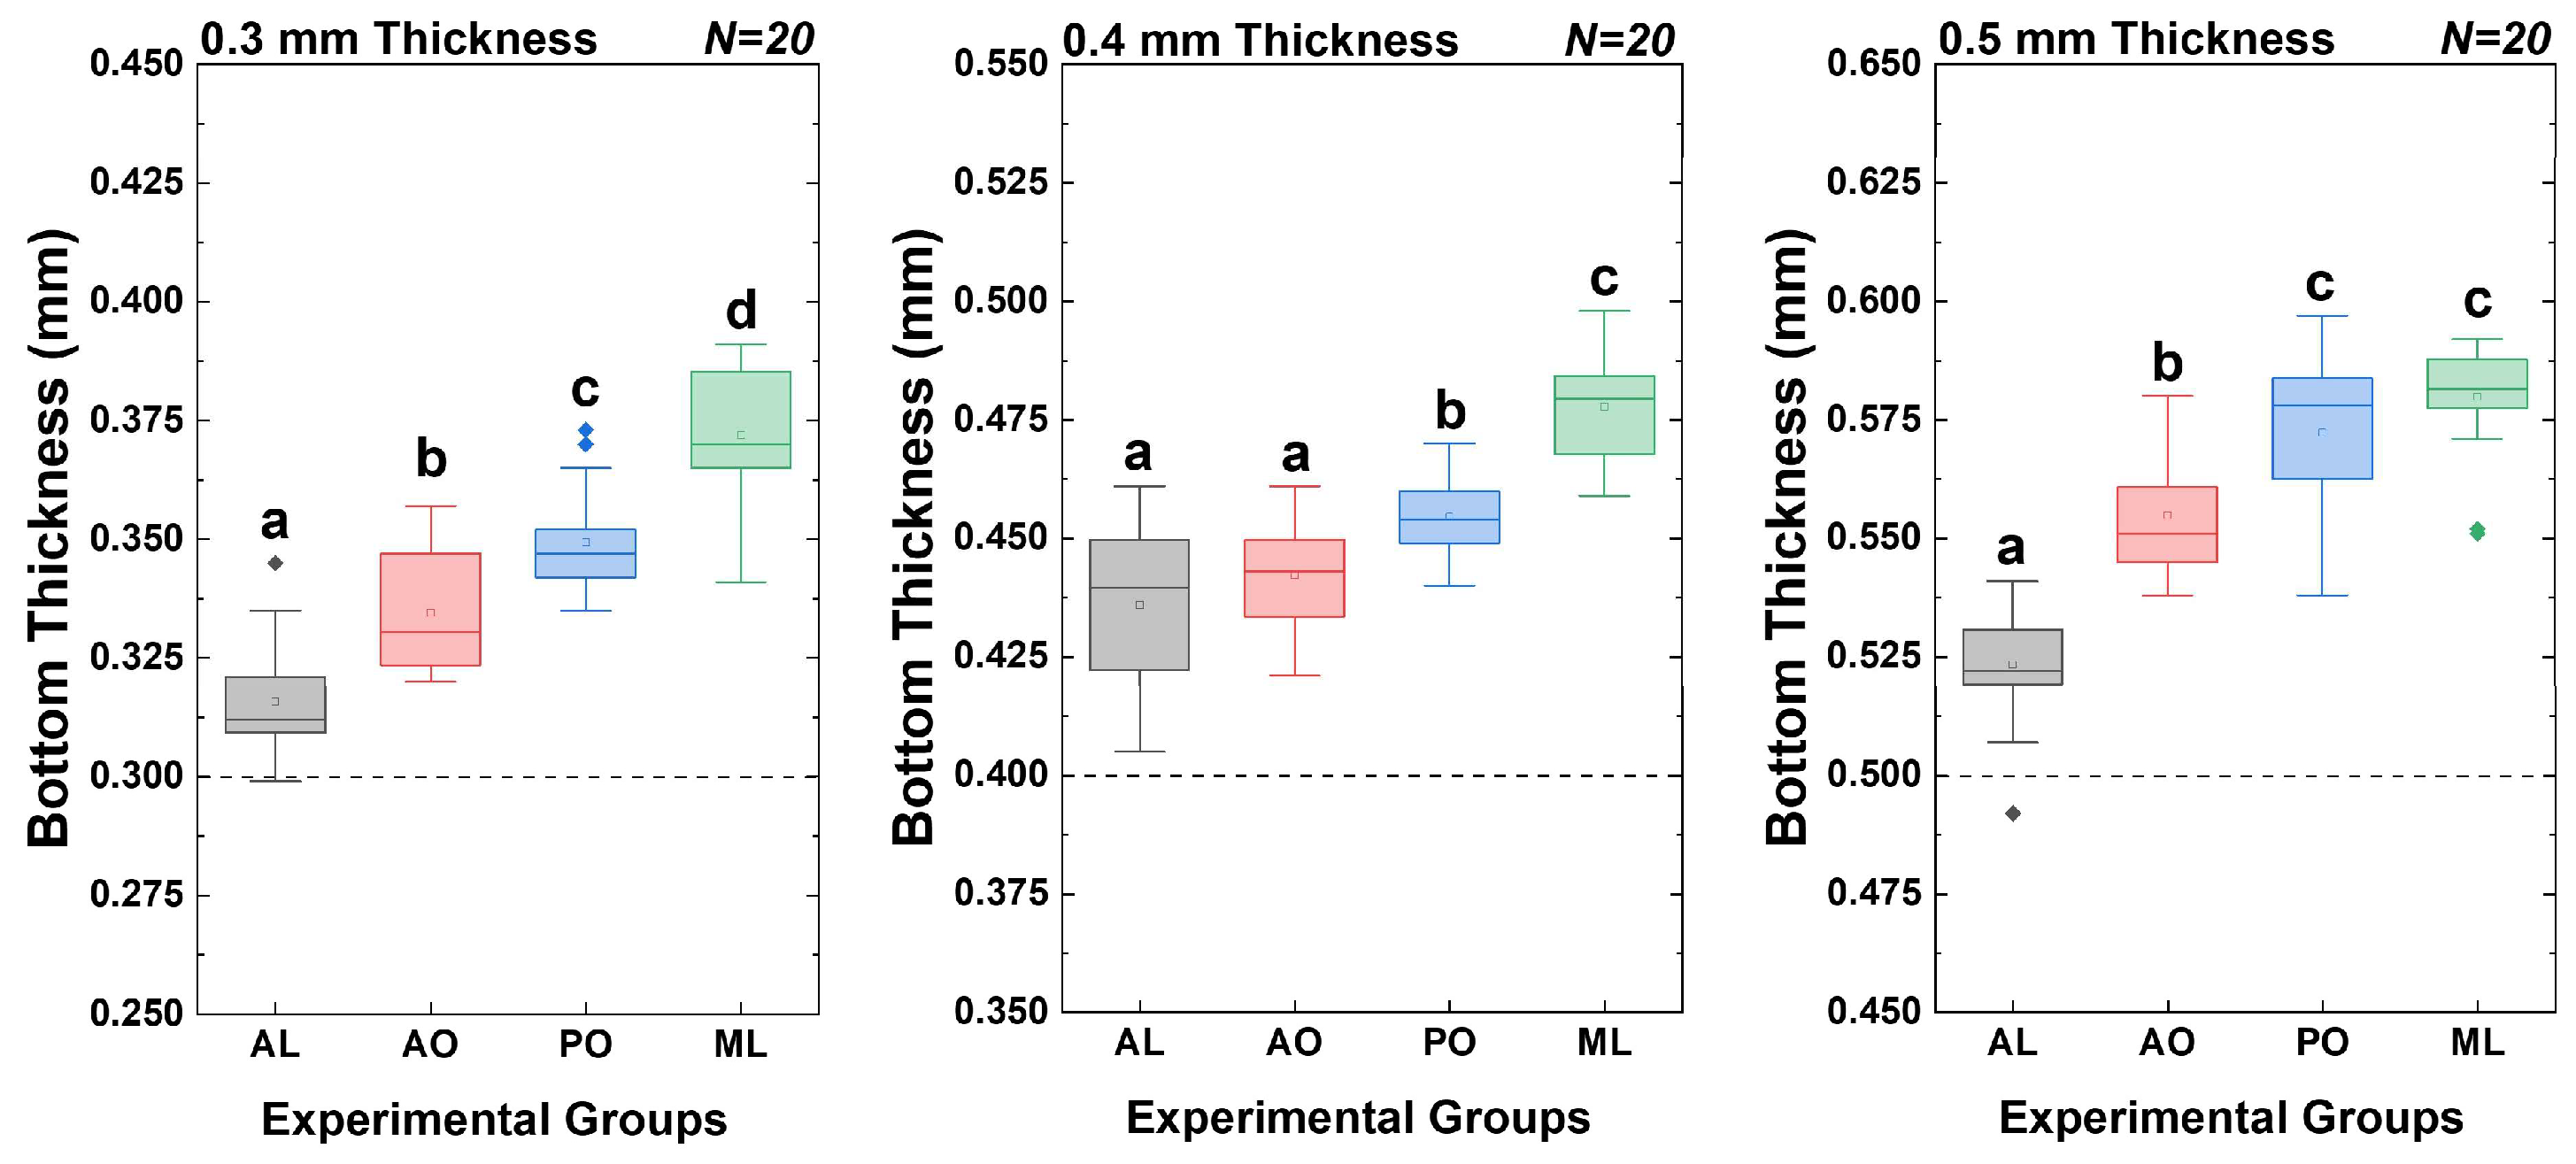
3.2. Thickness Measurement of Wall and Bottom Part

The wall thickness results for all experimental groups are presented in Table 3 and Figure 5. For all thickness conditions, the AO group and PO group exhibited the most accurate measurements, closely aligning with the intended thickness values with slight positive deviations. In contrast, the AL group demonstrated the closest measurements to the intended thickness values but with slight negative deviations. The ML group had the highest values relative to the original thickness for all thickness conditions (p < 0.05).
The bottom thickness results for all experimental groups are displayed in Table 4 and Figure 6. For all thickness conditions, the bottom thickness value of the AL group showed the lowest value among all experimental groups. In addition, the bottom thickness value of the ML group had the highest value for all wall thickness conditions.

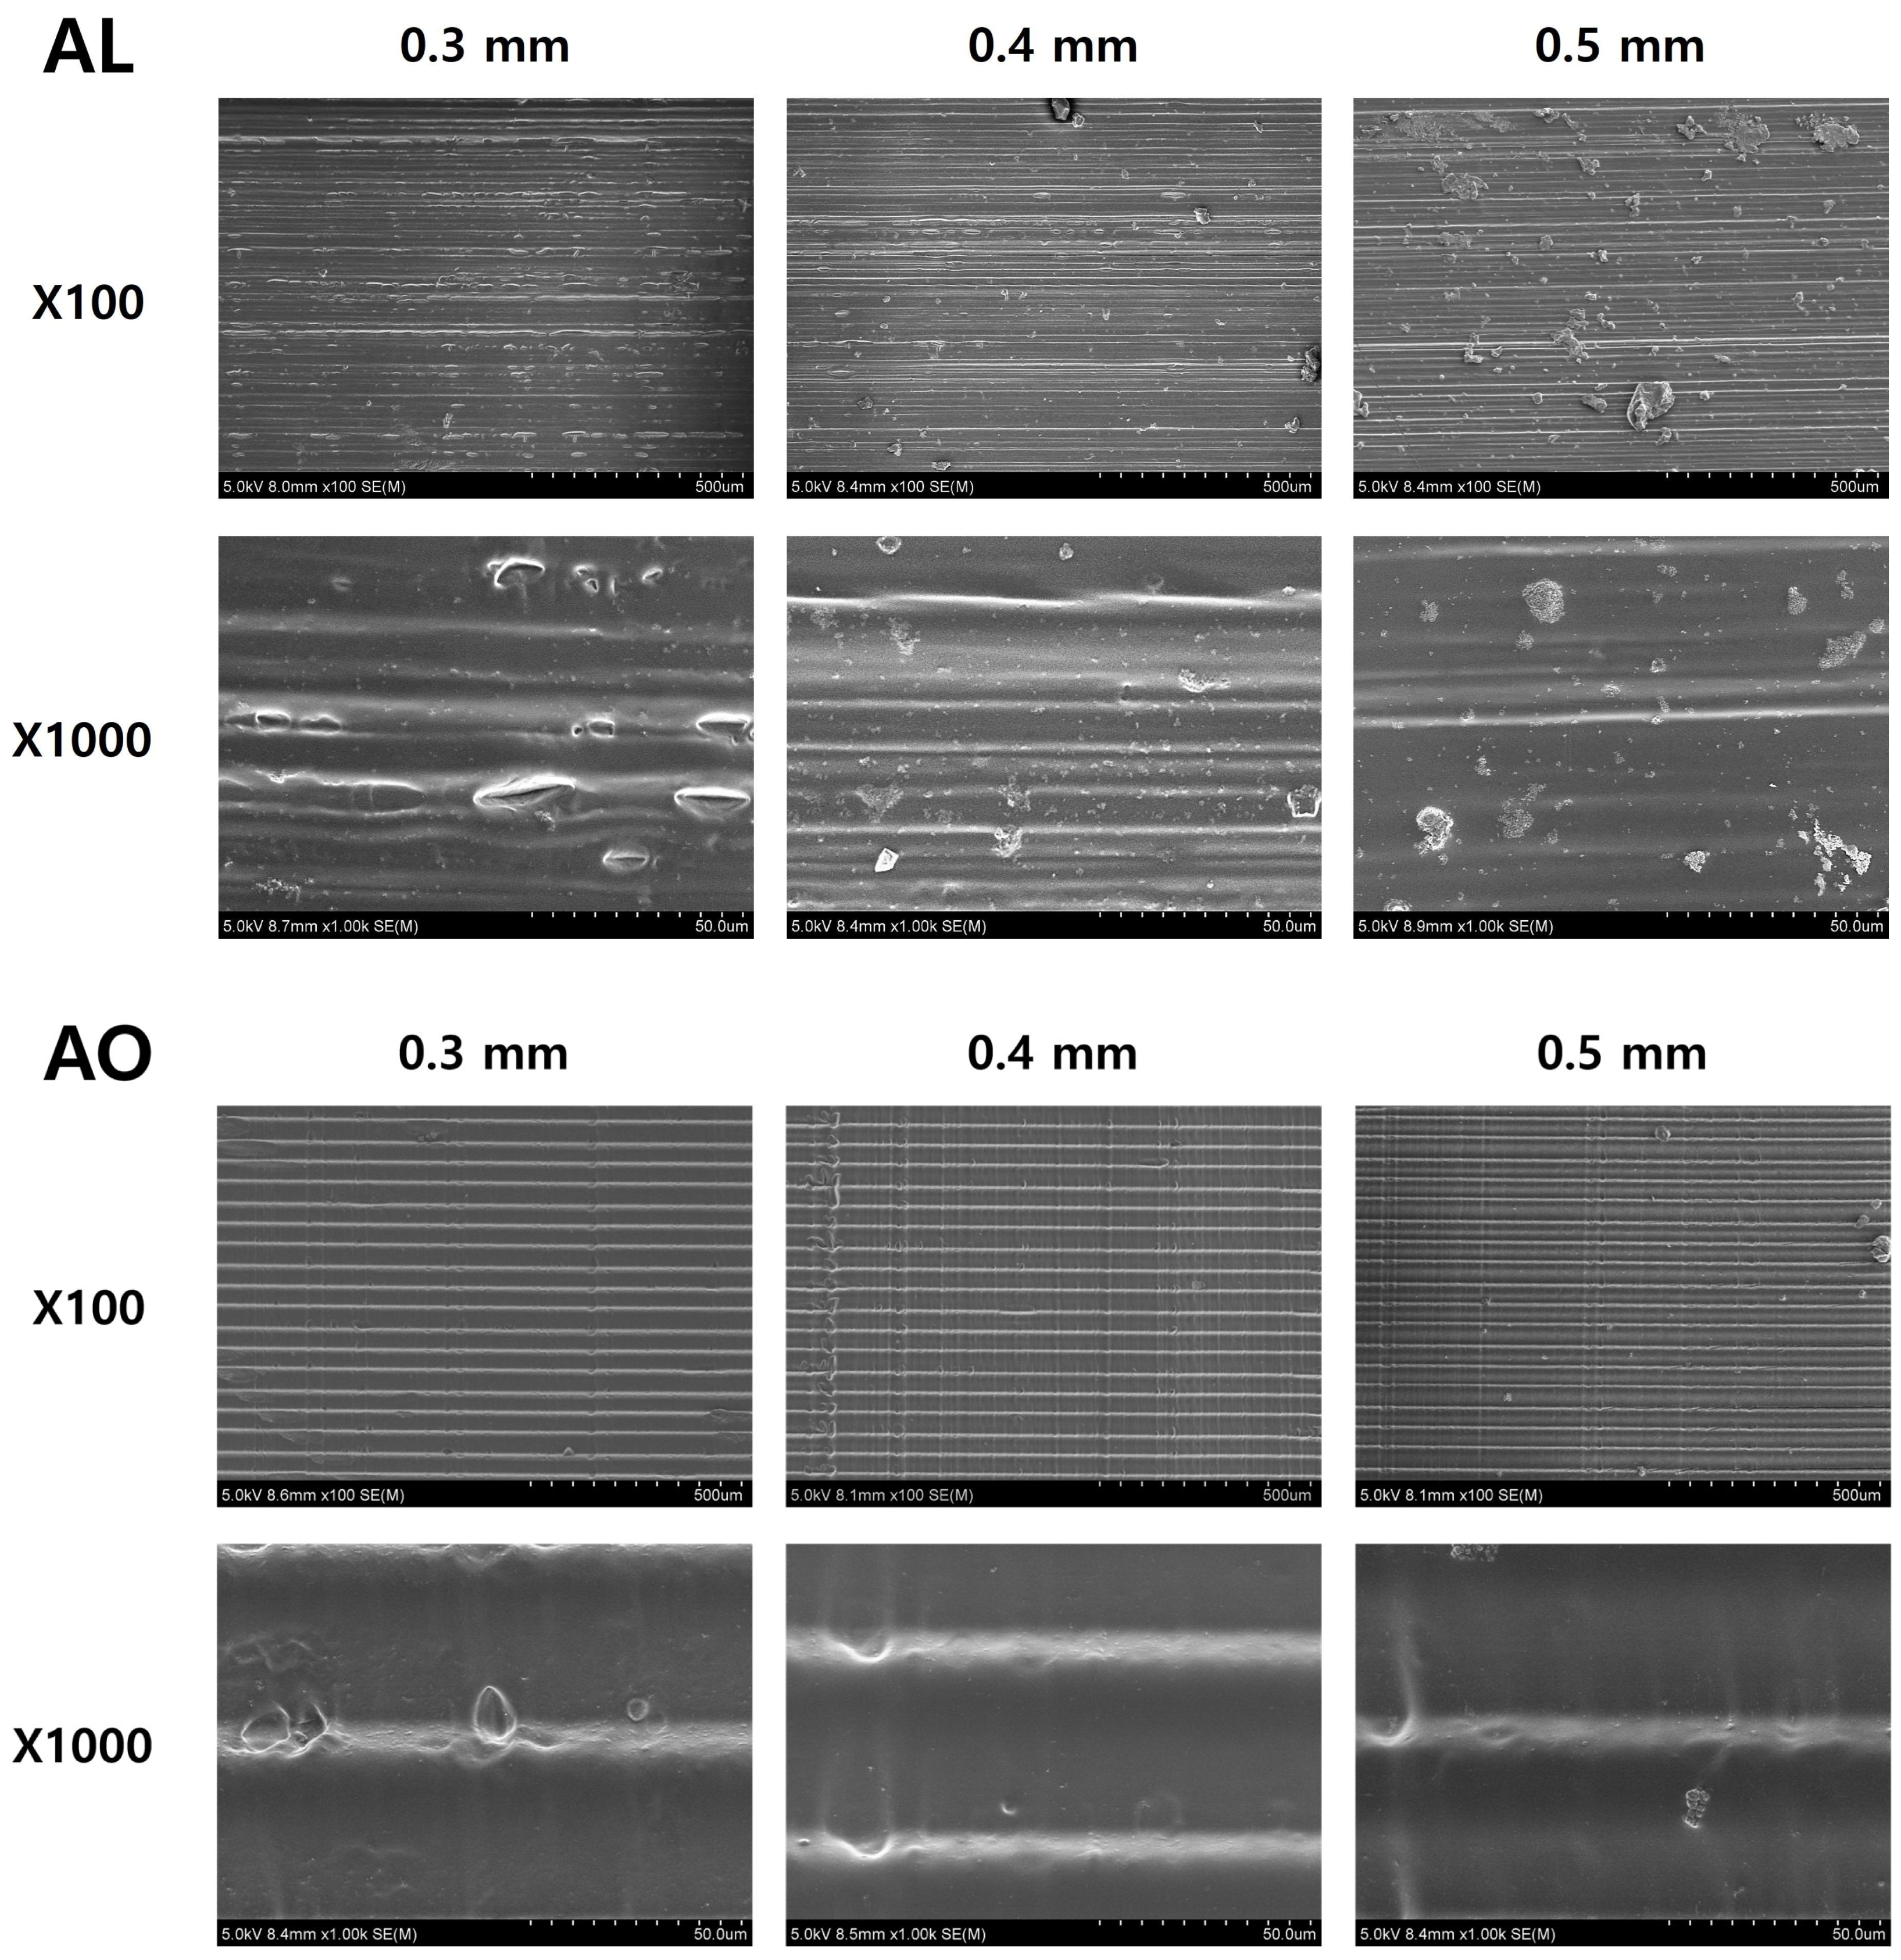
3.3. FE-SEM Obsevation

Figure 7 and Figure 8 show the FE-SEM images of the walls of all experimental groups. Round-shaped defects and debris were observed on the surfaces of the AL specimens for all the wall thicknesses. The AO specimen exhibited relatively few surface defects, and the low-magnification FE-SEM images demonstrated a uniformly stacked layer structure. The surface topography of the PO specimen was similar to that of the AO specimen, with few defects observed and a very uniform lamination layer (approximately 50 μm) confirmed in the low-magnification FE-SEM images.

4. Discussion

This study aimed to assess the feasibility of utilizing the Merlon fracture model to evaluate the accuracy of two commonly employed vat-photopolymerization-based additive manufacturing (AM) techniques: DLP and LCD. In addition, we selected 3D-printing slurries for preparing temporary and permanent dental products to examine their influence on the dimensional precision of the two polymer-based 3D-printing materials.
Comparative evaluation of the RMS results and colorization maps between the experimental groups showed that the RMS results of the AL and AO groups using the DLP 3D printer were significantly lower for all wall thicknesses; among them, the RMS results of the AL group using the 3D-printing slurry for temporary dental product fabrication were significantly lower for the 0.4 and 0.5 mm thickness conditions (p < 0.05). The colorization maps of the AL and AO groups showed a pattern similar to that of the RMS results, as shown in Figure 4. Interestingly, the RMS results of the PO group using the LCD 3D printer and ML control group based on SM increased equally as the wall thickness increased. In addition, the colorization map of the PO group showed an overall shrinkage of the Merlon fracture model, and the map of the ML group indicated a less ablative wall for all wall thicknesses. Estimating the overall structure of the experimental groups is difficult using only the colorization map image for one model in each group; however, we can speculate that the internal shrinkage (PO group) of the model using the LCD printer and inaccurate milling of the walls (ML group) using the milling machine were the main reasons for the high RMS values.
The wall thickness results show that the thickness values of the AL, AO, and PO groups using 3D-printing material for permanent dental product fabrication were closer to the original thickness than those of the ML group (p < 0.05). In particular, the thickness results of the AL group using 3D-printing material for the fabrication of temporary dental products exhibited thinner values than the original thickness. The decreased accuracy of the thickness of the final 3D-printed product can be attributed to multiple factors [19]. The intrinsic characteristics of the photopolymerization process and specific resin composition induce polymerization shrinkage [20]. In addition, variations in printing parameters such as layer thickness, light-source intensity, and exposure time further contribute to the discrepancy [21]. Finally, partial dissolution of the printed resin during postprocessing exacerbates the shrinkage [22,23].
To investigate the underlying cause of the observed differences in results, we analyzed the degree of conversion (DC) of specimens printed using DLP and LCD technologies. FT-IR spectroscopy was employed to quantify the DC by comparing the absorption peaks of aliphatic C=C and aromatic C=C bonds—representative of monomeric structures—based on the intensity ratios before and after polymerization (see Supplementary Materials). The FT-IR results indicated that the DC values for the AL, AO, and PO groups were 36.60 ± 0.42%, 53.20 ± 1.41%, and 53.63 ± 1.52%, respectively. These findings demonstrate that the AL group exhibited lower polymerization compared to the AO and PO groups. Regarding the polymerization shrinkage of the AL group, we could not determine any predominant effect on the polymer-shrinkage factor of the 3D-printed model based on the colorization map (Figure 4). In terms of the 3D-printing process parameters, the printed layer thickness of the DLP printer (0.05 mm) was half that of the LCD printer (0.10 mm), as noted in the footnote of Table 1; however, no difference in the printing accuracy was observed between the two printers despite this variation in layer thickness. Additionally, we employed two different urethane acrylate-based resin materials with a DLP 3D printer to fabricate the Merlon model, as listed in Table 1 (AL and AO groups). If the 3D-printing process parameters were the primary factors affecting the thickness reduction, both groups would exhibit similar results. However, only the AL group, which used a resin formulated for temporary crowns, exhibited a decrease in print thickness.
In addition, using the dissolution of the printed resin in the cleaning solution, we could estimate this factor from the FE-SEM images of the AL, AO, and PO specimens (Figure 7 and Figure 8). The 3D-printed lamination layer was clearly observed in the AO and PO specimens, whereas the lamination layer was not clearly visible in the AL specimen, suggesting dissolution of the printed materials. Thus, these findings suggest that the primary cause of the thickness reduction in the AL group was likely partial dissolution during the cleaning process.
Several cleaning solutions for 3D-printed products have been introduced, including isopropyl alcohol (IPA), tripropylene glycol monomethyl ether, and water-based cleaning solutions [24]. Among these, IPA is commonly used because of its relatively low cost and short cleaning time. Excessive exposure to IPA or prolonged cleaning processes can degrade the mechanical properties and cause structural changes in polymeric materials owing to decreased chemical durability [25,26]. To assess the degree of dissolution of the 3D-printed specimens in the IPA cleaning solution, a solubility test was conducted for the three experimental groups after immersion in IPA for 15 and 30 min (see Supplementary Materials). The results showed that the AL group exhibited higher solubility compared to the AO and PO groups at both time points. These findings suggest that the lower degree of polymerization in the AL group contributes to its increased solubility in cleaning solutions. Therefore, one of the main reasons for the thinning of the walls of the merlon in the AL group with materials for temporary crowns may be the degradation of the polymeric material during the cleaning process.
Based on the bottom thickness measurements, the AL group recorded the lowest thickness value, while the ML group exhibited the highest thickness among all experimental groups. In addition, we observed similarities in the RMS results of the bottom thickness measurements. In models 3D printed using vat-photopolymerization technology, several factors affect the difference in thickness between the horizontal plane (XY direction) and vertical plane (Z direction) after all the processing, such as the light scattering of the 3D printer causing over-polymerization in the XY plane [20,22], differences in the curing depth and shrinkage behavior of 3D-printing resin [23], and nonuniform shrinkage caused by cleaning and postcuring processes [25]. To minimize these deviation factors during the 3D-printing process, exposure settings should be optimized to prevent excessive overcuring in XY, the postcuring time should be controlled to achieve uniform shrinkage, and the IPA cleaning time should be minimized to avoid excessive resin swelling and shrinkage.
Based on the results of all the tests conducted in this study, we confirmed that the Merlon fracture model developed for evaluating the machinability of SM models is a suitable method for assessing the manufacturing accuracy of models fabricated using vat-photopolymerization AM technologies (DLP and LCD). Additionally, we observed differences in the manufacturing accuracy between 3D-printing slurries designed for temporary and permanent dental products. Furthermore, it is anticipated that cleaning and post-processing procedures will be essential in reducing manufacturing tolerances in 3D-printed models.

5. Conclusions

The manufacturing accuracy of vat-photopolymerization-based 3D printers was assessed using the Merlon fracture model, as outlined in ISO 18675. In summary, the Merlon fracture model, originally designed for estimating the machining accuracy of the SM model, was also found to be applicable for evaluating the manufacturing accuracy of the AM model. In addition, the difference in manufacturing accuracy between 3D-printing polymer slurries is greater than that between vat-photopolymerization 3D printers. Therefore, based on the results of this study, minimizing unwanted variables in the cleaning and postprocessing of 3D-printed restorations is the best method to maximize the machining accuracy of 3D-printed dental restorations in dental practice.

Supplementary Materials

The following supporting information can be downloaded at: https://www.mdpi.com/article/10.3390/app15105595/s1, Figure S1: Representative FT-IR spectra of (A) unpolymerized and (B) polymerized 3D-printed specimens prepared using the ODS printing slurry and AO formulation.; Figure S2: Solubility values of the three experimental groups (AL, AO, and PO) after 15 and 30 min of immersion in the IPA cleaning solution.

Author Contributions

Conceptualization, H.-j.L. and S.-h.O.; investigation, H.-j.L., C.-s.J., and J.-m.M.; methodology, H.-j.L., C.-s.J., and J.-m.M.; writing—original draft preparation, H.-j.L. and S.-h.O.; writing—review and editing, E.-j.C. and J.-m.B.; supervision, S.-h.O.; funding acquisition, S.-h.O. All authors have read and agreed to the published version of the manuscript.

Funding

This paper was supported by Wonkwang University in 2023.

Institutional Review Board Statement

Not applicable.

Informed Consent Statement

Not applicable.

Data Availability Statement

The original contributions presented in this study are included in this article. Further inquiries can be directed to the corresponding author.

Conflicts of Interest

The authors declare no conflicts of interest.

References

  1. Nulty, A. A literature review on prosthetically designed guided implant placement and the factors influencing dental implant success. Br. Dent. J. 2024, 236, 169–180. [Google Scholar] [CrossRef]
  2. Brenes, C.; Bencharit, S.; Fox, T. Evaluation of Prosthetic Outcomes and Patient Satisfaction with 3D-Printed Implant-Supported Fixed Prosthesis. Cureus 2023, 15, e42537. [Google Scholar] [CrossRef]
  3. Suganna, M.; Kausher, H.; Tarek Ahmed, S.; Sultan Alharbi, H.; Faraj Alsubaie, B.; Ds, A.; Haleem, S.; Meer Rownaq Ali, A.B. Contemporary Evidence of CAD-CAM in Dentistry: A Systematic Review. Cureus 2022, 14, e31687. [Google Scholar] [CrossRef] [PubMed]
  4. Alhallak, K.; Hagi-Pavli, E.; Nankali, A. A review on clinical use of CAD/CAM and 3D printed dentures. Br. Dent. J. 2023. [Google Scholar] [CrossRef] [PubMed]
  5. Tian, Y.Y.; Chen, C.X.; Xu, X.T.; Wang, J.Y.; Hou, X.Y.; Li, K.L.; Lu, X.Y.; Shi, H.Y.; Lee, E.S.; Jiang, H.B. A Review of 3D Printing in Dentistry: Technologies, Affecting Factors, and Applications. Scanning 2021, 2021, 9950131. [Google Scholar] [CrossRef]
  6. Mobarak, M.H.; Islam, M.A.; Hossain, N.; Al Mahmud, M.Z.; Rayhan, M.T.; Nishi, N.J.; Chowdhury, M.A. Recent advances of additive manufacturing in implant fabrication—A review. Appl. Surf. Sci. Adv. 2023, 18, 100462. [Google Scholar] [CrossRef]
  7. Liu, Y.; Liang, L.; Rajan, S.S.; Damade, Y.; Zhang, X.; Mishra, K.; Qu, L.; Dubey, N. Recent advances in additive manufacturing for tooth restorations. Appl. Mater. Today 2024, 39, 102275. [Google Scholar] [CrossRef]
  8. Yüceer, Ö.M.; Kaynak Öztürk, E.; Çiçek, E.S.; Aktaş, N.; Bankoğlu Güngör, M. Three-Dimensional-Printed Photopolymer Resin Materials: A Narrative Review on Their Production Techniques and Applications in Dentistry. Polymers 2025, 17, 316. [Google Scholar] [CrossRef]
  9. Subedi, S.; Liu, S.; Wang, W.; Naser Shovon, S.M.A.; Chen, X.; Ware, H.O.T. Multi-material vat photopolymerization 3D printing: A review of mechanisms and applications. NPJ Adv. Manuf. 2024, 1, 9. [Google Scholar] [CrossRef]
  10. Shah, M.; Ullah, A.; Azher, K.; Rehman, A.U.; Juan, W.; Aktürk, N.; Tüfekci, C.S.; Salamci, M.U. Vat photopolymerization-based 3D printing of polymer nanocomposites: Current trends and applications. RSC Adv. 2023, 13, 1456–1496. [Google Scholar] [CrossRef]
  11. Chekkaramkodi, D.; Jacob, L.; Shebeeb, C.M.; Umer, R.; Butt, H. Review of vat photopolymerization 3D printing of photonic devices. Addit. Manuf. 2024, 86, 104189. [Google Scholar] [CrossRef]
  12. Juneja, M.; Thakur, N.; Kumar, D.; Gupta, A.; Bajwa, B.; Jindal, P. Accuracy in dental surgical guide fabrication using different 3-D printing techniques. Addit. Manuf. 2018, 22, 243–255. [Google Scholar] [CrossRef]
  13. Deng, K.; Chen, H.; Wei, W.; Wang, X.; Sun, Y. Accuracy of tooth positioning in 3D-printing aided manufactured complete dentures: An in vitro study. J. Dent. 2023, 131, 104459. [Google Scholar] [CrossRef]
  14. ISO 18675; Dentistry—Machinable Ceramic Blanks. ISO: Geneva, Switzerland, 2022.
  15. ISO 12836; Dentistry—Digitizing Devices for CAD/CAM Systems for Indirect Dental Restorations—Test Methods for Assessing Accuracy. ISO: Geneva, Switzerland, 2015.
  16. ISO 23298; Dentistry—Test Methods for Machining Accuracy of Computer-Aided Milling Machines. ISO: Geneva, Switzerland, 2023.
  17. Alyami, M.H. The Applications of 3D-Printing Technology in Prosthodontics: A Review of the Current Literature. Cureus 2024, 16, e68501. [Google Scholar] [CrossRef]
  18. Su, G.; Zhang, Y.; Jin, C.; Zhang, Q.; Lu, J.; Liu, Z.; Wang, Q.; Zhang, X.; Ma, J. 3D printed zirconia used as dental materials: A critical review. J. Biol. Eng. 2023, 17, 78. [Google Scholar] [CrossRef] [PubMed]
  19. Dawood, A.; Marti, B.M.; Sauret-Jackson, V.; Darwood, A. 3D printing in dentistry. Br. Dent. J. 2015, 219, 521–529. [Google Scholar] [CrossRef]
  20. Revilla-Leon, M.; Ozcan, M. Additive Manufacturing Technologies Used for Processing Polymers: Current Status and Potential Application in Prosthetic Dentistry. J. Prosthodont. 2019, 28, 146–158. [Google Scholar] [CrossRef]
  21. Young, J.C.; Brinckmann, S.A.; Fertig Iii, R.S.; Lynch, S.P.; Frick, C.P. Influence of layer thickness and exposure on mechanical properties of additively manufactured polymer-derived SiOC ceramics. Open Ceram. 2024, 19, 100652. [Google Scholar] [CrossRef]
  22. Alharbi, N.; Osman, R.B.; Wismeijer, D. Factors Influencing the Dimensional Accuracy of 3D-Printed Full-Coverage Dental Restorations Using Stereolithography Technology. Int. J. Prosthodont. 2016, 29, 503–510. [Google Scholar] [CrossRef]
  23. Sahrir, C.D.; Ruslin, M.; Lee, S.Y.; Lin, W.C. Effect of various post-curing light intensities, times, and energy levels on the color of 3D-printed resin crowns. J. Dent. Sci. 2024, 19, 357–363. [Google Scholar] [CrossRef]
  24. Liu, Y.; Jin, G.; Lim, J.-H.; Kim, J.-E. Effects of washing agents on the mechanical and biocompatibility properties of water-washable 3D printing crown and bridge resin. Sci. Rep. 2024, 14, 9909. [Google Scholar] [CrossRef] [PubMed]
  25. Katheng, A.; Prawatvatchara, W.; Tonprasong, W.; Namano, S.; Kongkon, P. Effect of Postrinsing Times and Methods on Surface Roughness, Hardness, and Polymerization of 3D-Printed Photopolymer Resin. Eur. J. Dent. 2025, 19, 154–164. [Google Scholar] [CrossRef] [PubMed]
  26. Caussin, E.; Moussally, C.; Le Goff, S.; Fasham, T.; Troizier-Cheyne, M.; Tapie, L.; Dursun, E.; Attal, J.P.; Francois, P. Vat Photopolymerization 3D Printing in Dentistry: A Comprehensive Review of Actual Popular Technologies. Materials 2024, 17, 950. [Google Scholar] [CrossRef] [PubMed]
Figure 1. Merlon fracture test model as specified in ISO 18675: (A) top view, (B) cross-sectional view along AA, (C) cross-sectional view along BB, and (D) photographic image of the printed model with bottom support. The variable x represents the merlon wall thickness. (Unit: mm).
Applsci 15 05595 g001
Figure 2. Measurement regions for micrometer-based evaluation of wall and bottom thicknesses. (Unit: mm).
Applsci 15 05595 g002
Figure 3. Boxplots displaying the RMS values for all experimental groups across different merlon wall thickness conditions (0.3 mm, 0.4 mm, and 0.5 mm). Columns sharing the same lowercase letter are not significantly different at p < 0.05 (one-way ANOVA followed by Games–Howell).
Applsci 15 05595 g003
Figure 4. Representative visualization of the experimental groups based on RMS analysis, highlighting manufacturing accuracy variations.
Applsci 15 05595 g004
Figure 5. Boxplots displaying wall thickness measurements for all experimental groups under different merlon wall thickness conditions (0.3 mm, 0.4 mm, and 0.5 mm). The dashed line in the graph represents the original thickness. Columns sharing the same lowercase letter are not significantly different at p < 0.05 (one-way ANOVA followed by Games–Howell).
Applsci 15 05595 g005
Figure 6. Boxplots displaying bottom thickness measurements for all experimental groups under different merlon wall thickness conditions (0.3 mm, 0.4 mm, and 0.5 mm). The dashed line in the graph represents the original thickness. Columns sharing the same lowercase letter are not significantly different at p < 0.05 (one-way ANOVA followed by Games–Howell).
Applsci 15 05595 g006
Figure 7. FE-SEM micrographs of the merlon wall surfaces for AL and AO groups, illustrating surface morphology and structural characteristics.
Applsci 15 05595 g007
Figure 8. FE-SEM micrographs of the merlon wall surfaces for PO and ML groups, illustrating surface morphology and structural characteristics.
Applsci 15 05595 g008
Table 1. Specifications of materials and devices utilized in this study.
Group
Name
DevicesMaterials
NameComposition
ALAsiga Pro 4K DLP 3D printer 1Arum C&B 5.0 hybrid 4Titanium dioxide, Trimethylolpropane trimethacrylate, Diphenyl phosphine oxide, Silicon Oxide, Urethane Dimethacrylate, and pigments
AOAsiga Pro 4K DLP 3D printerODS C&B Permanent A2 5Diurethane dimethacrylate, 2-Propenoic acid, 2-methyl-, (1-methylethylidene) bis (4,1-phenyleneoxy(1-methyl-2,1-ethanediyl)) ester, 2-HEMA, diphenyl (2,4,6- trimethylbenzoyl) phosphine oxide, and additives
POPhrozen sonic mighty 4K LCD 3D printer 2ODS C&B Permanent A2Same as the composition of AO group
MLDWX-51D
milling machine 3
Kuwotech PMMA A2 6Polymethyl methacrylate
1 Asiga Co., Alexandria, NSW, Australia (light intensity = 7.5 mW/cm2, layer thickness = 0.05 mm, curing time per layer = 4 s); 2 Phrozen Tech Co., Hsinchu city, Taiwan, China (light intensity = 3.2 mW/cm2, layer thickness = 0.10 mm, curing time per layer = 4 s); 3 Roland DGC Co., Irvine, CA, USA; 4 Arum Dentistry Co., Daejeon, Republic of Korea; 5 ODS Co., Incheon, Republic of Korea; 6 Kuwotech Co., Kwangju, Republic of Korea.
Table 2. Root mean square (RMS) values (mean ± standard deviation) of the experimental groups across various merlon wall thickness conditions. (Unit: μm).
GroupThickness
0.3 mm0.4 mm0.5 mm
AL51.83 ± 7.7242.25 ± 3.2738.50 ± 2.05
AO44.78 ± 2.1956.58 ± 3.0259.54 ± 5.41
PO57.53 ± 4.4970.86 ± 4.50105.30 ± 15.01
ML72.68 ± 1.2796.31 ± 3.31107.29 ± 4.06
Table 3. Measured wall thickness (mean ± standard deviation) of the experimental groups under different merlon wall thickness conditions. (Unit: mm).
GroupThickness
0.3 mm0.4 mm0.5 mm
AL0.293 ± 0.0130.396 ± 0.0100.495 ± 0.007
AO0.303 ± 0.0100.403 ± 0.0040.501 ± 0.004
PO0.304 ± 0.0060.401 ± 0.0030.501 ± 0.002
ML0.324 ± 0.0160.424 ± 0.0180.520 ± 0.014
Table 4. Measured bottom thickness (mean ± standard deviation) of the experimental groups under different merlon wall thickness conditions. (Unit: mm).
GroupThickness
0.3 mm0.4 mm0.5 mm
AL0.316 ± 0.0110.436 ± 0.0180.523 ± 0.011
AO0.335 ± 0.0120.442 ± 0.0110.555 ± 0.013
PO0.349 ± 0.0100.455 ± 0.0080.572 ± 0.016
ML0.372 ± 0.0130.478 ± 0.0120.580 ± 0.011
Disclaimer/Publisher’s Note: The statements, opinions and data contained in all publications are solely those of the individual author(s) and contributor(s) and not of MDPI and/or the editor(s). MDPI and/or the editor(s) disclaim responsibility for any injury to people or property resulting from any ideas, methods, instructions or products referred to in the content.

