Abstract
This study presents the implementation of a new Type for TRNSYS based on the integral exponential function, which is fundamental in subsurface heat transfer modeling. This function can be expressed as a series expansion, and the developed Type enables the representation of multiple terms in this expansion. To validate its accuracy, the model’s results are compared with experimental data from two geothermal boreholes located in Asturias, Spain: Q-Thermie-Uniovi 1 and Q-Thermie-Uniovi 2. These boreholes, spaced 7.3 m apart and each 48 m deep, were used in a thermal response test, where Q-Thermie-Uniovi 1 underwent thermal injection while temperature measurements were recorded in Q-Thermie-Uniovi 2 over a period of three months. This study evaluates how the number of terms in the series expansion influences the model’s accuracy and demonstrates that the newly developed Type effectively replicates experimental data. This work provides a robust tool for optimizing the design of geothermal systems and enhancing the understanding of subsurface heat transfer dynamics.
1. Introduction
Climate change represents one of the most pressing global challenges of the 21st century, with severe consequences for ecosystems, human societies, and the global economy. The increasing concentration of greenhouse gases, particularly carbon dioxide (CO2), has led to a rise in average global temperatures, triggering extreme weather events such as heatwaves, intense storms, and polar ice melting [1]. In response to this crisis, the international community has recognized the urgent need for mitigation and adaptation strategies. Consequently, global agreements, such as the Paris Agreement, have been established to limit global warming to 1.5 °C above pre-industrial levels [2].
The need to limit the rise in global temperatures is driving the transition toward sustainable, low-carbon technologies. This transition is essential for reducing the reliance on fossil fuels and lowering greenhouse gas emissions to mitigate the effects of climate change [3].
In Spanish households, heating and domestic hot water (DHW) account for a significant share of residential energy consumption. According to data from the Statistical Office of the European Union [4], heating represents approximately 47% of household energy consumption, while DHW accounts for around 19%. These percentages vary depending on housing type and climatic region. For instance, in single-family homes located in the Mediterranean region, heating can account for up to 63.9% of energy consumption, whereas in apartments in the Atlantic region, this percentage decreases to 32.2%.
Shallow geothermal energy has a range of practical applications, particularly in regions where extremely high temperatures are not required. Some of the most common applications of low-temperature geothermal energy include building heating and cooling and domestic hot water production, among others.
Low-enthalpy geothermal energy represents a renewable source that plays an increasing role in the field of energy sustainability. Shallow geothermal systems, which use geothermal boreholes to capture or dissipate thermal energy in the subsurface, are becoming more common in residential and industrial applications [5]. However, the performance of these systems largely depends on the local ground conditions [6], as well as the thermal interactions between the boreholes, particularly when designing geothermal fields composed of multiple boreholes [7,8,9].
Recent studies have addressed the thermal interference between boreholes using numerical simulations and empirical models [10,11,12]. While these contributions have improved the understanding of borehole interaction dynamics, most rely on numerical solvers or simplified G-function approaches and are not directly implemented in widely used simulation environments such as TRNSYS. Moreover, few models incorporate the exponential integral function in a customizable format suitable for long-term simulations. This gap motivates the development of our module, which brings an analytical basis into TRNSYS and provides an accessible, validated tool for geothermal system design.
In this context, the use of advanced simulation tools such as TRNSYS (Transient System Simulation Tool) has proven to be essential for studying and predicting the long-term thermal behavior of the subsurface, allowing for the optimization of geothermal exchange systems’ design and ensuring their effectiveness and sustainability [13]. This program also helps to evaluate how boreholes interact with each other and can assist in the design and optimization of borehole location and quantity [14,15,16,17].
In TRNSYS, there are several types/modules available for modeling boreholes as components. These modules aid in simulating the behavior of Ground Source Heat Pump (GSHP) systems and shallow geothermal energy systems.
While TRNSYS offers several predefined types for modeling borehole heat exchangers, most rely on empirical G-functions or simplified analytical solutions that do not include the exponential integral function explicitly. Moreover, these existing models do not allow for user control over the mathematical approximation level, limiting their flexibility and precision in cases involving strong thermal interactions between boreholes. The newly developed Type 1410 addresses this gap by implementing the exponential integral function through a series expansion with a user-defined number of terms. This approach offers greater modeling flexibility, higher physical consistency, and improved accuracy for long-term thermal simulations in shallow geothermal systems.
To simulate complete geothermal heating and cooling systems, these modules are customizable and can be integrated with other TRNSYS components such as heat pump models, storage tanks, and building loads. The modular nature of TRNSYS enables engineers to produce tailored simulations of various system configurations and performance scenarios.
Despite its extensive capabilities, TRNSYS lacks a predefined module for modeling thermal interference between boreholes using the integral exponential function, which is a fundamental component in subsurface heat transfer models. The integral exponential function is commonly used to describe temperature evolution in response to heat injection into the ground. However, due to its complexity, it is often approximated by a series expansion.
This study presents the development and implementation of a new TRNSYS module (Type 1410) that incorporates the integral exponential function using its series expansion. The module allows for the representation of multiple terms of the series, improving the accuracy of subsurface heat transfer modeling. To validate its performance, the module’s results are compared with experimental data from two shallow geothermal boreholes located in Asturias, Spain: Q-Thermie-Uniovi 1 and Q-Thermie-Uniovi 2. These boreholes, which are 7.3 m apart and have a depth of 48 m, were used in a thermal response test where Q-Thermie-Uniovi 1 underwent thermal injection while temperatures were monitored in Q-Thermie-Uniovi 2 over a three-month period.
2. Materials and Methods
2.1. Mathematical Model for the Study of Thermal Behavior in a Geothermal Heating Process
The Fourier Equation is a fundamental tool in the study of heat conduction and the thermal behavior of materials. This equation describes how temperature varies across a medium as a function of time and position, allowing for the modeling of heat transfer processes. Its versatility and accuracy make the General Fourier Equation an essential mathematical model for thermal analysis in geothermal heating processes (1).
This expression can also be written as follows:
where
- is the divergence of the temperature gradient.
The analytical model used in this study is based on the solution of the Fourier heat conduction equation for a line source in an infinite, homogeneous medium. The following assumptions apply: the soil is homogeneous and isotropic, the thermal properties are constant, there is no internal heat generation, and the heat transfer is purely radial. These conditions justify the use of the exponential integral function to represent temperature evolution in the ground. However, this approach does not account for advective transport (e.g., groundwater flow), stratification, or anisotropic thermal conductivity. As such, it is best suited for steady geological formations with limited hydrological variability.
The solution to this equation is provided by expressions (3) and (4) [18], which describes the temperature at a distance from the heat source, for a given time (with being the instant when heat transfer begins), assuming that the initial temperature is uniform and that is constant.
where
- [°C] is the temperature at a distance and at a given time .
- [°C] is the initial or reference temperature.
- [W/m] is the heat injection rate per meter, also referred to as the linear heat rate.
- [m] is the radial distance from the measurement point to the heat source.
- [m2/s] represents the apparent thermal diffusivity.
- is the exponential integral function given by the following expression:
In this case and it is always positive, meaning that the argument of the exponential integral function is always negative. In such cases, to avoid the discontinuity of at zero, it is advisable to use the function.
This is related to the previous one through the following expression: Therefore, Equation (4) is given by the following:
Equation (7) is employed, enabling the evaluation of thermal behavior in one borehole while a geothermal heating process occurs in a nearby borehole.
The application of the exponential integral function is complex; therefore, it is commonly replaced by its series expansion:
where
- is Euler’s constant, which has a value of approximately 0.5772.
The number of terms in the exponential integral series can be freely defined by the user, which enables a balance between numerical accuracy and computational time. In this study, the number of terms was determined through an iterative process: the series order was gradually increased until the simulation reached a coefficient of determination of R2 = 0.997 when compared with experimental data at t > 1000 h. This threshold was selected because the system approaches a quasi-steady state in this phase, and early transients have a reduced impact on long-term temperature evolution. Users can reproduce this method by incrementally increasing the number of terms until ∆R2 becomes negligible (e.g., <0.001), ensuring that the solution is both accurate and efficient.
Having defined the theoretical basis of the model using the exponential integral function and its series expansion, we now proceed to describe its implementation in the TRNSYS simulation environment.
2.2. Materials
2.2.1. TRNSYS
TRNSYS v. 18.00.0011 (Transient System Simulation Tool) [19] is an advanced software platform primarily employed for modeling and simulating the dynamic performance of energy systems. This tool is particularly valuable for the design and analysis of renewable energy systems, energy efficiency in buildings, and thermal management solutions. TRNSYS enables the simulation of complex energy systems that integrate both thermal and electrical components, and it is widely applied in the fields of energy research and system optimization.
Among its various capabilities, TRNSYS includes a specialized geothermal module specifically designed to model geothermal energy systems. This module is intended for simulating both geothermal heat pump (GHP) systems and geothermal energy production systems, with a particular focus on the heat exchange dynamics between the ground and systems consuming or producing energy. The geothermal module enables the evaluation and optimization of geothermal system performance across a variety of applications, such as residential heating and cooling, district heating, and large-scale geothermal energy production.
TRNSYS allows engineers, researchers, and system designers to optimize geothermal system configurations, assess energy efficiency, and predict long-term operational performance. Its ability to model the dynamic interactions between the geothermal system and its environment makes TRNSYS an essential tool in the design, analysis, and optimization of geothermal energy systems.
2.2.2. Borehole Q-Thermie-Uniovi 1 and 2
For this research, two geothermal boreholes were employed. The boreholes, referred to as Q-Thermie-Uniovi 1 and Q-thermie-Uniovi-2, are located within the Viesques’ campus of the University of Oviedo (Gijón, Spain), 26 m above sea level and 3 km away from the coast. Their coordinates are longitude 5°37′16′′ Wand latitude 43°31′23′′ N.
The selection of the experimental site and borehole characteristics was based on both technical and scientific criteria. The 7.3 m spacing between boreholes was chosen to replicate realistic configurations commonly found in small-to-medium-sized geothermal installations, where close borehole spacing can lead to significant thermal interference effects. The 48 m depth was selected to ensure that sensors were placed in a stable thermal region of the subsurface, reducing the influence of surface temperature variations. Additionally, the site was selected for its homogeneous geological composition, which facilitates the interpretation of the experimental results and the validation of the numerical model. This configuration allows for an accurate observation of heat propagation between the boreholes and supports the validation of the developed module under real and controlled conditions.
The temperature measurements used for model validation were obtained using DS18B20 digital sensors, which have a manufacturer-specified accuracy of ±0.5 °C and a resolution of 0.01 °C. Data were recorded every 10 min using an Arduino-based datalogger. Sensors were installed at multiple depths inside the borehole, and for this study, the sensor located at 22.62 m was selected. This depth lies below the convergence zone, where the temperature remains stable year-round and is not significantly affected by surface thermal fluctuations or groundwater level variations.
Although potential sources of uncertainty such as sensor calibration drift, minor installation misalignments, or local thermal heterogeneities may be present, the impact of these factors was minimized through careful sensor placement and validation procedures. The recorded temperatures are therefore considered robust and suitable for validating the numerical model.
Borehole Q-Thermie-Uniovi 1
The drilled borehole has a diameter of Db = 125 mm and a depth of h = 48 m. Two concentric pipes have been installed inside; the outer pipe has a diameter of D0 = 50 mm, and the inner pipe has a diameter of Di = 25 mm. The length of the outer pipe is 48 m and it is closed at the bottom. The inner concentric pipe is open at the bottom, allowing the fluid descending through it to rise back to the surface through the annular section [20].
Borehole Q-Thermie-Uniovi 2
Unlike the previous borehole, this one is exposed to the elements and is located 7.3 m from the Q-Thermie-Uniovi 1 borehole. The borehole has a diameter of Db = 125 mm and a depth of h = 48 m. This borehole only has an exterior geothermal pipe with a diameter of D0 = 50 mm, and its interior is filled with water [20].
To monitor the temperature inside the borehole during the TRT, the following instrumentation was used:
- Commercial temperature sensors (DS18B20) inside the pipe and connected by a 1-wire serial bus were placed. The sensors are positioned at different depths. The data obtained from the sensor located at a depth of 22.62 m were used because at this depth, the sensor is below the water level and is not affected by thermal interferences from the surface.
- Temperature data were recorded using specific software.
3. Experimental Temperature Graphs
In the Q-Thermie 1 borehole, a thermal response test (TRT) was conducted with a power input of 3485 W, while in the Q-Thermie 2 borehole, temperature was recorded at a depth of 22.62 m over a period of three months. This power value was selected to ensure a clear and stable thermal signal at the second borehole (Q-Thermie-Uniovi 2) without inducing excessive temperature gradients in the surrounding ground. The preliminary simulations confirmed that 3485 W provided a measurable thermal response after several weeks while keeping the fluid temperatures within operational limits. Moreover, this value is consistent with the typical power levels used in TRT experiments for boreholes of comparable depth, ensuring the practical relevance of the experiment and its suitability for model validation. The two boreholes are separated by a distance, , of 7.3 m. The thermal properties of the ground at this depth are as follows: thermal conductivity, , was estimated to be 1.835 W/m·K, and thermal diffusivity, , was 8.52 × 10⁻⁷ m2/s [20].
With the objective of studying the behavior of temperature over time, the data are provided in Table 1. These values correspond to the ones indicated above.

Table 1.
Data for analyzing the interference between geothermal boreholes.
Figure 1 represents the exponential integral function for the data shown in Table 1. From the figure, it can be observed that as time progresses, the temperature exhibits a gradual increase; however, for initial time values, the function remains virtually constant.
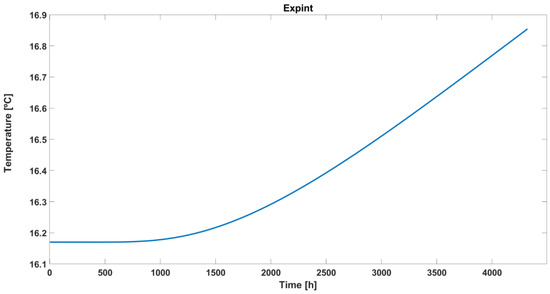
Figure 1.
Graphical representation of exponential integral function for the data shown in Table 1 (Equation (7)).
Figure 2 illustrates the temperature evolution at a depth of 22.62 m in the Q-Thermie 2 borehole during the thermal heating process in the Q-Thermie 1 borehole. This thermal behavior reflects the propagation of heat generated in Q-Thermie 1 into the surrounding ground, as indicated by the increase in temperature inside the Q-Thermie 2 borehole over the course of the test.
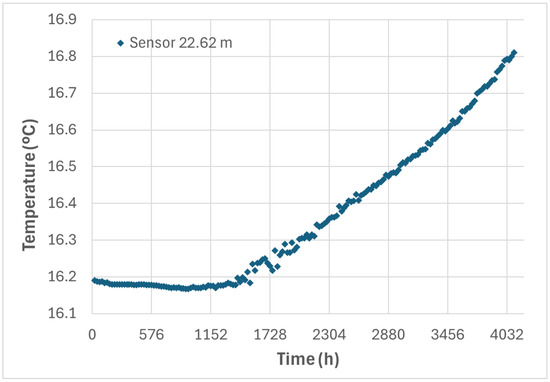
Figure 2.
Representation of the experimental data at a depth of 22.62 m in the Q-Thermie 2 borehole during the thermal heating process in the Q-Thermie 1 borehole.
4. Model Implementation and Simulation Using TRNSYS
To analyze the thermal interference between shallow geothermal boreholes, the geothermal heat pump (GHP) package of TRNSYS was employed. Using this package, the influence of the simplification of the exponential integral was studied, and the following approach was adopted. Starting from Table 2, instead of using the value of the exponential integral function, terms from the series expansion shown in Equation (8) were calculated for the temperature sensor located at a depth of 22.62 m from the surface, whose thermal conductivity and diffusivity are known.
Table 2.
The series expansion of according to Equation (8). The mathematical expression is presented on the right, and the terms are listed on the left.
The number of terms in the series expansion of the exponential integral function was determined empirically through an iterative process. We started with a minimal number of terms (e.g., 1–2) and increased them gradually until the simulated temperature curve showed strong agreement with the experimental data, particularly after 1000 h, where transient effects are more dominant.
To evaluate convergence, we monitored the coefficient of determination (R2) between the simulated and measured temperatures at the sensor depth (22.62 m). When adding more terms yielded a negligible improvement (∆R2 < 0.003), the expansion was considered to be sufficiently accurate.
This process ensures both numerical efficiency and model fidelity and can be replicated in other scenarios using the same strategy: iteratively increasing the number of terms and monitoring the impact on model performance.
The model is implemented using three modules:
- Type 9e represents the temperature data recorded at the Q-Thermie-Uniovi-2 borehole at a depth of 22.62 m over a period of 3 months.
- The element labeled 1410 evaluates the thermal behavior of the borehole through a series expansion of the exponential integral function. This requires defining the power applied during the TRT, the depth of the Q-Thermie-Uniovi-2 borehole, the thermal conductivity and diffusivity at a depth of 22.62 m, and the distance between boreholes 1 and 2 (Figure 3).
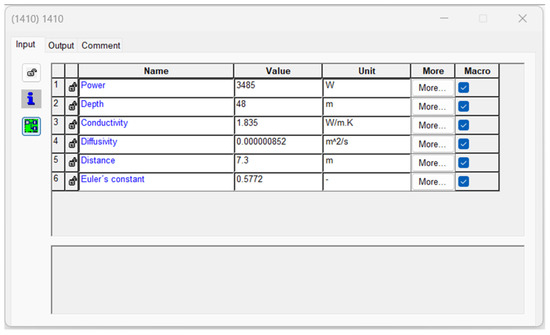 Figure 3. User-defined features in Type 1410.
- Type65c allows for a graphical representation of the solution to the proposed problem.
Figure 4 illustrates the implementation of the model in the TRNSYS graphical environment.
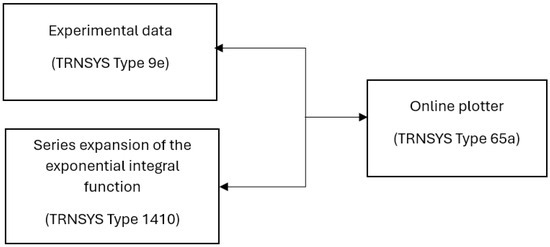
Figure 4.
Graphical environment of the TRNSYS software created to carry out the study of thermal interference between boreholes.
4.1. Simulation in TRNSYS Using the Simplification of the Exponential Integral Function, Employing Term A
The results shown in Figure 5 are as follows:
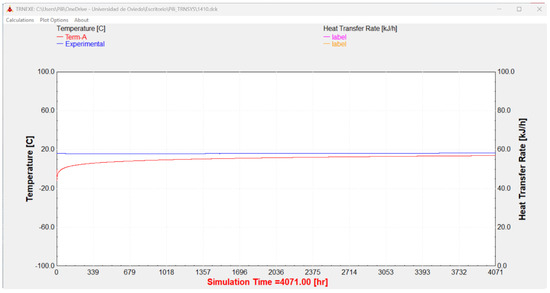
Figure 5.
TRNSYS simulation using the simplification of the exponential integral function (term A).
- Experimental data (in blue) represent the actual measurements obtained from the Q-Thermie-Uniovi 2 borehole at a depth of 22.62 m. These data correspond to the recordings of the sensor laid at this precise location.
- TRNSYS simulation (in red) displays the simulation performed using the TRNSYS software, which employs a series expansion designated as term A (Table 2). This simplification, with a fixed term of the exponential integral function, aims to model the behavior observed in the experimental data.
4.2. Simulation in TRNSYS Using the Simplification of the Exponential Integral Function, Employing Term B
To further evaluate the model’s accuracy, we increased the number of terms in the series expansion (term B) and repeated the simulation, aiming to reduce the discrepancies observed in the initial approach.
The results shown in Figure 6 are as follows:
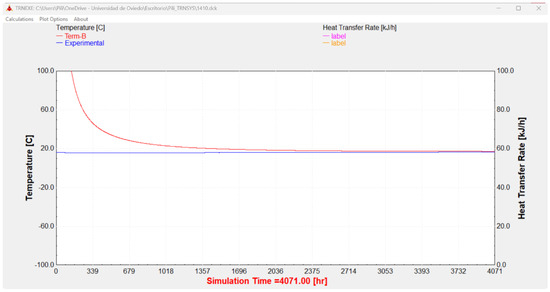
Figure 6.
TRNSYS simulation using the simplification of the exponential integral function (term B).
- Experimental data (in blue) represent the actual measurements obtained from the Q-Thermie-Uniovi 2 borehole at a depth of 22.62 m. These data correspond to the readings of the sensor laid at this precise location.
- TRNSYS simulation (in red) displays the simulation performed using the TRNSYS software, which employs a series expansion designated as term B (Table 2).
The comparison between both datasets (blue and red) suggests limitations in the approximation used.
4.3. Simulation in TRNSYS Using the Simplification of the Exponential Integral Function, Employing Term L
Finally, we tested a more detailed expansion (term L) to assess whether a higher-order approximation yields a closer match to the experimental data, particularly during the long-term phase.
The results shown in Figure 7 are as follows:
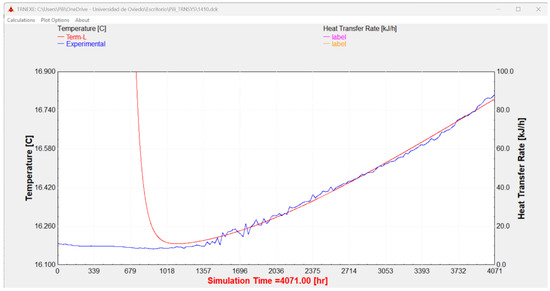
Figure 7.
TRNSYS simulation using the simplification of the exponential integral function (term L).
- Experimental data (in blue) represent the actual measurements obtained from the Q-Thermie-Uniovi 2 borehole at a depth of 22.62 m. These data correspond to the readings of the sensor laid at this precise location.
- TRNSYS simulation (in red) displays the simulation performed using the TRNSYS software, which employs a series expansion designated as term L (Table 2).
During the early stages of the simulation (t < 1000 h), a larger discrepancy is observed between the experimental data and the values produced by the model. These differences can be attributed to several factors not considered in the current implementation, such as simplified boundary conditions, which assume an infinite homogeneous medium with no groundwater flow or surface temperature variations. In addition, initial transient effects, thermal inertia of the ground, possible local heterogeneities in the subsurface, and non-uniform initial temperature fields may influence the thermal response in the early phase. The sensor system’s response time may also play a role, particularly when temperature gradients are more pronounced. As the system evolves and reaches thermal equilibrium, these discrepancies diminish, as reflected in the high correlation observed for when greater than 1000 h (R2 = 0.997 corresponding to a 95% goodness of fit), confirming the model’s validity in the quasi-steady regime. Additionally, the following indicators have been calculated: Root Mean Square Error (RMSE) = 0.396 and Mean Absolute Error (MAE) = 0.01. As time progresses (t > 1000 h), the divergence between the experimental data and the TRNSYS simulation decreases significantly, suggesting that the model’s accuracy improves with the inclusion of additional terms in the series expansion.
For t > 1000 h, the high correlation coefficient (R2 = 0.997) indicates excellent agreement between the simulated and measured experimental values, supporting the validity of the model based on the series expansion of the exponential integral function.
This deviation is attributed to model simplifications, including the assumption of a homogeneous, isotropic, and infinite medium, the exclusion of axial heat conduction and groundwater flow, and a uniform initial ground temperature. The ground may exhibit stratification, anisotropy, or temperature gradients near the borehole. Additional uncertainty may stem from sensor placement or thermal inertia. These effects are more prominent during the early phase of the experiment and gradually diminish as the system stabilizes, which explains the improved match at later times.
These results suggest that the methodology implemented in TRNSYS is a reliable approach for predicting thermal behavior under similar conditions. Furthermore, with appropriate adjustments, it could be extended to other scenarios.
5. Discussion
A practical comparison between the three tested configurations (terms A, B, and L) reveals the trade-off between accuracy and computational demand. Term A achieved an R2 of 0.964 with the shortest runtime. Term B improved the fit significantly (R2 = 0.994) with a moderate increase in simulation time. Term L reached the best fit (R2 = 0.997) but required approximately 40% more computational time than term B. These findings suggest that intermediate configurations may provide a good balance between precision and performance, especially for long-term or multi-borehole simulations.
6. Conclusions
This study presents the development and implementation of Type 1410, a new TRNSYS module that incorporates the integral exponential function through its series expansion. This function is fundamental in subsurface heat transfer modeling but was not previously included in TRNSYS’ predefined modules. By implementing this function, the Type 1410 module improves the accuracy of geothermal system simulations, particularly in evaluating the thermal interference effects between boreholes.
The model’s accuracy was validated using experimental data from two shallow geothermal boreholes (Q-Thermie-Uniovi 1 and Q-Thermie-Uniovi 2), located in Asturias, Spain, and separated by 7.3 m. A thermal response test (TRT) was performed, where thermal injection in Q-Thermie-Uniovi 1 led to a measurable temperature response in Q-Thermie-Uniovi 2. These experimental measurements served as a benchmark for assessing the reliability of the TRNSYS simulations.
While the current application focuses on a pair of boreholes located in Asturias (Spain), the developed Type 1410 is designed to be fully generalizable. It allows users to define input parameters such as borehole depth, spacing, thermal conductivity, and diffusivity, as well as the number of terms in the exponential integral series. This makes the module applicable to a wide range of shallow geothermal configurations, regardless of geographic location.
The Q-Thermie-Uniovi system served as a controlled experimental validation platform, but the modeling approach is not site-specific and is suitable for broader use in research, system design, and optimization tasks.
Regarding applicability, the developed Type 1410 allows the user to define all relevant input parameters, including the following:
- Borehole depth and spacing;
- Thermal conductivity and diffusivity of the soil;
- Heating power and test duration;
- The number of terms in the exponential integral series.
This makes it compatible with a wide range of geological conditions (e.g., varying diffusivities or stratified layers, provided these are averaged or estimated at the sensor depth) and borehole configurations, as long as the borehole can be modeled as a line source.
The results demonstrate that increasing the number of terms in the series expansion of the integral exponential function significantly improves the accuracy of the model, aligning the simulated results more closely with experimental data. This finding underscores the importance of correctly approximating the integral exponential function when modeling subsurface heat transfer, as well as the effectiveness of Type 1410 in capturing geothermal borehole behavior.
By integrating Type 1410 into TRNSYS, researchers and engineers can achieve more precise and reliable simulations of subsurface heat transfer processes. The module provides a valuable tool for optimizing borehole configurations, minimizing thermal interference effects, and ultimately enhancing the efficiency of geothermal energy systems. Additionally, it enables improved decision-making in borehole spacing and system design, ensuring the better long-term performance of shallow geothermal systems.
The Type 1410 module was developed to solve heat conduction problems governed by the exponential integral function. It provides a customizable, semi-analytical solution to the radial Fourier heat conduction equation from a line source in a homogeneous and isotropic medium. Therefore, the module is applicable to any system configuration in which this mathematical formulation is appropriate; not only geothermal boreholes but also other thermal conduction problems in porous or solid media.
The implementation of this function within TRNSYS allows users to simulate long-term heat transfer by conduction in contexts where traditional borehole models may not apply or may oversimplify the underlying physics. As such, the Type 1410 module expands the modeling capabilities of TRNSYS in all situations where the exponential integral function is required.
Despite its advantages, the Type 1410 module has inherent limitations that must be considered. Its implementation assumes a homogeneous and isotropic ground, without advective heat transfer such as groundwater flow, and it models heat transfer as purely radial from a line source. These assumptions may limit their accuracy in heterogeneous, anisotropic, or hydrologically active environments. Furthermore, increasing the number of series terms may raise the computational time and increase the risk of manual input errors if not automated. Future developments may address these aspects by incorporating layered ground models or advanced boundary condition management.
To carry out this work, the version used was Trnsys v. 18.00.0011.
Author Contributions
Conceptualization. T.A.-S. and M.P.C.-G.; methodology, M.P.C.-G.; software, S.N.-L. and Y.C.-I., validation, M.P.C.-G., formal analysis, S.N.-L., investigation, M.P.C.-G. and Y.C.-I., resources, T.F.-G., data curation, M.P.C.-G. and S.N.-L., writing—original draft preparation, M.P.C.-G. and S.N.-L., writing—review and editing, Y.C.-I., visualization, S.N.-L.; supervision, T.A.-S., project administration, T.F.-G., funding acquisition, T.A.-S. All authors have read and agreed to the published version of this manuscript.
Funding
The authors declare that this study received funding from Cátedra HUNOSA CAT-004-17. The funder had the following involvement with the study SV-21-HUNOSA-1. This research was funded by the University of Oviedo.
Institutional Review Board Statement
Not applicable.
Informed Consent Statement
Not applicable.
Data Availability Statement
The data presented in this study are available on request from the corresponding author.
Conflicts of Interest
The authors declare no conflicts of interest.
Correction Statement
This article has been republished with a minor correction to the Funding statement. This change does not affect the scientific content of the article.
References
- NASA. Climate Change and Global Warming. 2020. Available online: https://climate.nasa.gov/ (accessed on 10 May 2025).
- ONU. Acuerdo de París Sobre el Cambio Climático. 2015. Available online: https://unfccc.int/process-and-meetings/the-paris-agreement/the-paris-agreement (accessed on 10 May 2025).
- IPCC. Impacts of 1.5 °C Global Warming on Natural and Human Systems. In Global Warming of 1.5 °C; Cambridge University Press: Cambridge, UK, 2022; pp. 175–312. [Google Scholar]
- EUROSTAT. Informe de Consumo Residencial. 2024. Available online: https://informesweb.idae.es/consumo-usos-residencial/informe.php (accessed on 10 May 2025).
- Liu, Z.; Qiana, Q.K.; Visschera, H.; Zhang, G. Review on shallow geothermal promoting energy efficiency of existing buildings in Europe. In IOP Conference Series: Earth and Environmental Science; Institute of Physics: London, UK, 2022. [Google Scholar] [CrossRef]
- Arias-Penas, D.; Castro-García, M.P.; Rey-Ronco, M.A.; Alonso-Sánchez, T. Determining the thermal diffusivity of the ground based on subsoil temperatures. Preliminary results of an experimental geothermal borehole study Q-THERMIE-UNIOVI. Geothermics 2015, 54, 35–42. [Google Scholar] [CrossRef]
- Zhou, Z.; Yang, H.; Lee, C.K. Investigation on the thermal interaction among boreholes in a large borehole field with different configurations. Appl. Therm. Eng. 2020, 173, 115222. [Google Scholar] [CrossRef]
- Li, X.; Zhang, Y.; Chen, S. Simulation study on thermal interference of closely spaced boreholes in ground source heat pump systems. Energy Build. 2022, 250, 111276. [Google Scholar] [CrossRef]
- Wang, H.; Qi, C.; Du, H. Numerical analysis of thermal interactions among multiple boreholes in a shallow geothermal system using TRNSYS. Renew. Energy 2023, 201, 1234–1245. [Google Scholar] [CrossRef]
- Huang, Y.; Zhang, Y.; Gao, X.; Ma, Y. Thermal disturbance analysis in rock-soil induced by heat extraction from the abandoned well. Geothermics 2022, 101, 102374. [Google Scholar] [CrossRef]
- Shen, J.; Luo, Y.; Zhou, C.; Song, Y.; Tian, Z.; Fan, J.; Zhang, L.; Liu, A. A slightly inclined deep borehole heat exchanger array behaves better than vertical installation. Renew. Energy 2025, 238, 121963. [Google Scholar] [CrossRef]
- Zhao, Y.; Pang, Z.; Huang, Y.; Ma, Z. An efficient hybrid model for thermal analysis of deep borehole heat exchangers. Geotherm. Energy 2020, 8, 18. [Google Scholar] [CrossRef]
- Benedicto, T.M. Validación Experimental de los Métodos de Diseño de Instalaciones de Bomba de Calor Acoplada al Terreno. Ph.D. Thesis, Universidad Politécnica de Valencia, Valencia, Spain, 2010. [Google Scholar]
- Ruiz-Calvo, F.; Montagud, C.; Cazorla-Marín, A.; Corberán, J.M. Development and Experimental Validation of a TRNSYS Dynamic Tool for Design and Energy Optimization of Ground Source Heat Pump Systems. Energies 2017, 10, 1510. [Google Scholar] [CrossRef]
- Antelmi, M.; Turrin, F.; Zille, A.; Fedrizzi, R. A New Type in TRNSYS 18 for Simulation of Borehole Heat Exchangers Affected by Different Groundwater Flow Velocities. Energies 2023, 16, 1288. [Google Scholar] [CrossRef]
- Zhang, Y.; Zheng, J.; Liu, A.; Zhang, Q.; Shao, J.; Cui, Y. Numerical Simulation of Shallow Geothermal Field in Operating of a Ground Source Heat Pump System—A Case Study in Nan Cha Village, Ping Gu District, Beijing. Water 2020, 12, 2938. [Google Scholar] [CrossRef]
- Christodoulides, P.; Vieira, A.; Lenart, S.; Maranha, J.; Vidmar, G.; Popov, R.; Georgiev, A.; Aresti, L.; Florides, G. Reviewing the Modelling Aspects and Practices of Shallow Geothermal Energy Systems. Energies 2020, 13, 4273. [Google Scholar] [CrossRef]
- Carslaw, H.S.; Jaeger, J.C. Conduction of Heat in Solids, 2nd ed.; Oxford University Press: London, UK, 1959. [Google Scholar]
- University of Wisconsin—Madison. Solar Energy Laboratory. TRNSYS, a Transient Simulation Program, Trnsys v. 18.00.0011; University of Wisconsin—Madison. Solar Energy Laboratory: Madison, WI, USA, 1975. [Google Scholar]
- Marcos-Robredo, G.; Rey-Ronco, M.A.; Castro-García, M.P.; Alonso-Sánchez, T.A. Device to Register Temperature in Boreholes in Northwest Spain for Geothermal Research. Sensors 2022, 22, 4945. [Google Scholar] [CrossRef] [PubMed]
Disclaimer/Publisher’s Note: The statements, opinions and data contained in all publications are solely those of the individual author(s) and contributor(s) and not of MDPI and/or the editor(s). MDPI and/or the editor(s) disclaim responsibility for any injury to people or property resulting from any ideas, methods, instructions or products referred to in the content. |
© 2025 by the authors. Licensee MDPI, Basel, Switzerland. This article is an open access article distributed under the terms and conditions of the Creative Commons Attribution (CC BY) license (https://creativecommons.org/licenses/by/4.0/).