Article

Carbon Footprint Assessment on the Viability of Utilizing Brewer’s Spent Grain to Produce Biochar

Department of Food Science & Technology, University of California, Davis, CA 95618, USA
*
Author to whom correspondence should be addressed.
Appl. Sci. 2025, 15(10), 5525; https://doi.org/10.3390/app15105525
Submission received: 10 March 2025 / Revised: 7 May 2025 / Accepted: 8 May 2025 / Published: 15 May 2025

Abstract

:
The waste generated by the brewing industry, particularly brewer’s spent grain (BSG) and wastewater, presents challenges for sustainable management practices. While BSG is traditionally utilized as cattle feed, this option is not universally accessible. This study considered the environmental impact of a novel, laboratory-based process for converting BSG into biochar that also utilizes brewing wastewater, as compared to disposing of BSG and cleaning chemical wastewater. The study employed a carbon footprint assessment approach to quantify the greenhouse gas (GHG) emissions associated with each disposal method, using one unprocessed kg of BSG as the functional unit. The results indicated that landfilling BSG generated approximately 3 kg CO2 equivalent (CO2e) per kg of unprocessed BSG, whereas biochar production reduced emissions to 1.18 kg CO2e per kg of BSG. The study concluded that diverting BSG from landfills to biochar production presents a viable strategy for minimizing environmental impacts associated with BSG disposal. However, several factors must be considered in the development of a biochar production facility, including biochar transportation. These elements may contribute more GHG emissions than landfilling if not properly designed.

1. Introduction

1.1. Background

Beer is one of the most widely consumed beverages globally; world brewers produced 1.82 trillion hectoliters in 2020 [1]. However, the substantial water requirements for production and cleaning result in significant waste generation compared to product yield and present the industry with sustainability challenges. The primary waste stream in brewing, aside from water, is brewer’s spent grain (BSG), which refers to the husk, pericarp, and seed layers of barley that remain after the extraction of soluble sugars from the grain. This fibrous byproduct accounts for 85% of the total waste from beer production, with the remaining portions consisting of trub (hop solids, clarifying agents, yeast nutrient, and other ingredients added to the boiling stage) and yeast solids. In 2020, the yield of BSG as a result of beer produced reached 36.4 million metric tons [1].
The Food and Agriculture Organization of the United Nations (FAO) introduced Sustainable Development Goal (SDG) 12.3, which calls for action to reduce food loss throughout the food supply chain. In line with this goal, Champions 12.3, a collaborative group of executives working on SDG 12.3, conducted a study that presented the optimal hierarchy of solutions for valorizing food waste [2]. The top three solutions include: (1) prevention and redistribution to people; (2) diversion to animal feed; and (3) biomaterial/processing of waste. Notably, landfilling is considered “no valorization” and is an undesirable method of waste disposal.
Traditionally, the primary use for BSG has been animal feed (70%), while the rest is landfilled (20%) or used for biogas production (10%) [3]. While using BSG as animal feed is recommended by the FAO, it is not feasible for breweries located far from agricultural communities due to its high water content, excessive weight for transportation, and microbial instability. With the growth of microbreweries in urban areas, this challenge of transportation continues to amplify. Therefore, the brewing industry seeks alternatives to animal feed and landfilling to meet sustainability goals. It is crucial to determine whether specific upcycling techniques for valorizing BSG impose a higher or lower environmental burden than other destination options for BSG. Multiple studies have reviewed the process of converting BSG and other highly fibrous biomasses into biochar [4,5,6]. Other studies have reviewed the greenhouse gas emissions associated with producing biochar [7], applying biochar to soil [8,9,10,11,12], and using biochar for water treatment [13]; however, there are no current studies that analyze the environmental impact of a small-scale biochar production process from BSG to determine if it emits less C O 2 e than landfilling. In this study, we produce a novel carbon footprint assessment (CFA) of converting BSG to biochar and compare these results to disposing BSG in landfills.

1.2. Brewing Industry Waste

BSG, the major waste stream generated during beer production, primarily consists of the husk, pericarp, and seed coats of crushed malted grains. It may also contain trace amounts of silica, polyphenols, insoluble protein, and oils [14]. The composition of BSG can vary, depending on factors including grain quality, malting and mashing conditions, the use of adjuncts, and salt incorporated during the mashing stage.
The high water activity and fermentable sugar concentration of BSG are major limiting factors for valorization, as they make it highly unstable and prone to rapid deterioration from microbial activity. Drying BSG can extend its shelf life and reduce weight, thereby limiting transportation costs and storage needs, making it a potentially valuable biomaterial. However, the drying process is often energy-intensive, and, therefore, costly.
During the cleaning-in-place (CIP) process of brewing equipment, caustic chemicals, such as sodium hydroxide (NaOH) or potassium hydroxide (KOH), are commonly used. These chemicals often maintain a relatively high pH at the end of their use, indicating the need for neutralization before disposal. Instead of neutralizing and discarding these aqueous solutions, they can be recovered and reused as a pretreatment to enhance the quality of BSG for biochar production. Soaking a lignocellulosic material in a caustic chemical solution is a common precursor to biochar production. This form of pretreatment induces lignin removal, which yields more pure cellulose and hemicellulose fractions, and ultimately improves pyrolysis efficiency and biochar quality [15,16].

1.3. Biochar Production Model for BSG

Biochar, as defined by the International Biochar Initiative (IBI), is a solid material derived from the thermochemical conversion of biomass in an oxygen-limited environment [17]. Biomass refers to the biodegradable portion of agricultural, forestry, and related industries’ products, waste, and residues, as well as the biodegradable portion of industrial and municipal waste [17]. The characteristics of biochar, such as porosity, organic carbon content, pH, etc., are influenced by the type of biomass used in its production, including its cellulosic, sugar, and fat fractions, as well as the presence of any contaminants.
Biochar is distinct from charcoal and other carbon products due to its predetermined use, which is primarily environmental management. This can include soil remediation, resource efficiency improvement, pollution prevention, greenhouse gas (GHG) mitigation, and so on [17]. Biochars are highly porous, amorphous materials, typically containing negligible levels of heavy metals and low nitrogen and ash concentrations while maintaining a high surface area and adsorption capacity [18,19]. They also exhibit a low degree of aromatization, resulting in high porosity and reactivity, which is correlated with a high surface area and electrical conductivity [18,19].
BSG can gain value when utilized to produce biochar. The production of biochar from BSG generates bio-oil and syngas as byproducts, which can be utilized for energy applications or further purified to obtain their primary components for use as raw materials. The resulting biochar can be applied in soil amendment, carbon sequestration, energy production, and other applications. This approach has the potential to transform the brewing industry and contribute to a circular economy, revolutionizing the environmental impact associated with beer production. Additionally, this approach offers economic benefits, serving as a potential secondary income or cost reduction for breweries.

1.4. Post-Production Utilization of Biochar, Syngas, and Bio-Oil

A study by Matuštík et al. [9] compiled data from 27 peer-reviewed papers that utilized LCA methodology to evaluate the environmental impact of pyrolysis-based biochar systems that specifically used biochar for soil amendment. The selected studies were published between 2011 and 2019 from several global regions. The functional units employed in these studies varied considerably depending on factors such as the use of wet or dry biomass, time, or land. The system boundaries also varied due to the inclusion of different feedstocks, particularly when the biomass was derived from waste streams. Most of the studies adopted a system expansion approach to consider the downstream utilization of syngas and bio-oil. The application rate of biochar to the soil exhibited significant variation across the studies (from 1 t/ha to 30 t/ha). Biochar stability also differed; most authors used conservative values (80% or lower) for the concentration of stable biochar.
Most of the studies considered the impact of biochar on soil, acknowledging its potential to increase crop yield; the availability of nutrients; the sorption of pollutants; its positive impact on the microbial population in soils; and its ability to reduce methane and nitrous oxide emissions [9]. However, the overall impact of biochar on soil varied amongst studies, depending on the specific benefits considered. Despite differences, the results of all 27 studies consistently demonstrated the trend that biochar-soil amendment systems benefit climate change mitigation [9]. The primary benefits are carbon sequestration driven by carbon storage from the biochar in soil, crop yield increase, which reduces the use of fertilizer, and a reduction in methane or nitrous oxide emissions from biochar [9].
Matuštík et al. [9] reported that GHG emissions from the pyrolysis process were consistently offset by the carbon capture benefit of biochar and the energy production offsets achieved through the utilization of the pyrolysis co-products, syngas, and bio-oil.
Bio-oil can be utilized in replacement of heating oil or refined into gasoline, ethanol, and/or other chemical compounds [20]. Syngas is primarily used for generating power and heat through stand-alone combined heat and power (CHP) plants or through co-firing the gas in large-scale power plants [21]. A system expansion approach that considers the utilization of syngas and bio-oil from pyrolysis can achieve fuel savings and emissions reductions by utilizing these co-products for heat and electricity within the processing system.

1.5. Landfilling Biomass

To determine gas emissions from landfills, models are employed to predict methane generation based on the biological changes that occur during landfill decomposition. These models typically utilize a first-order kinetic equation that correlates methane production with the degradation of organic matter while considering annual waste amounts and decomposition rates [22]. In first-order models, such as LandGEM, methane production is assumed to be directly proportional to the degradation of organic matter within the landfill. LandGEM is a widely used first-order model in the United States, providing a framework to describe the behavior of landfills in terms of landfill gas generation [22]. These models enable an estimation of the amount of methane generated by landfills, thereby allowing for an assessment of the environmental burden of these waste disposal sites. Quantifying methane emissions from landfills allows for a consideration of mitigation strategies to reduce the overall environmental impact.

2. Materials and Methods

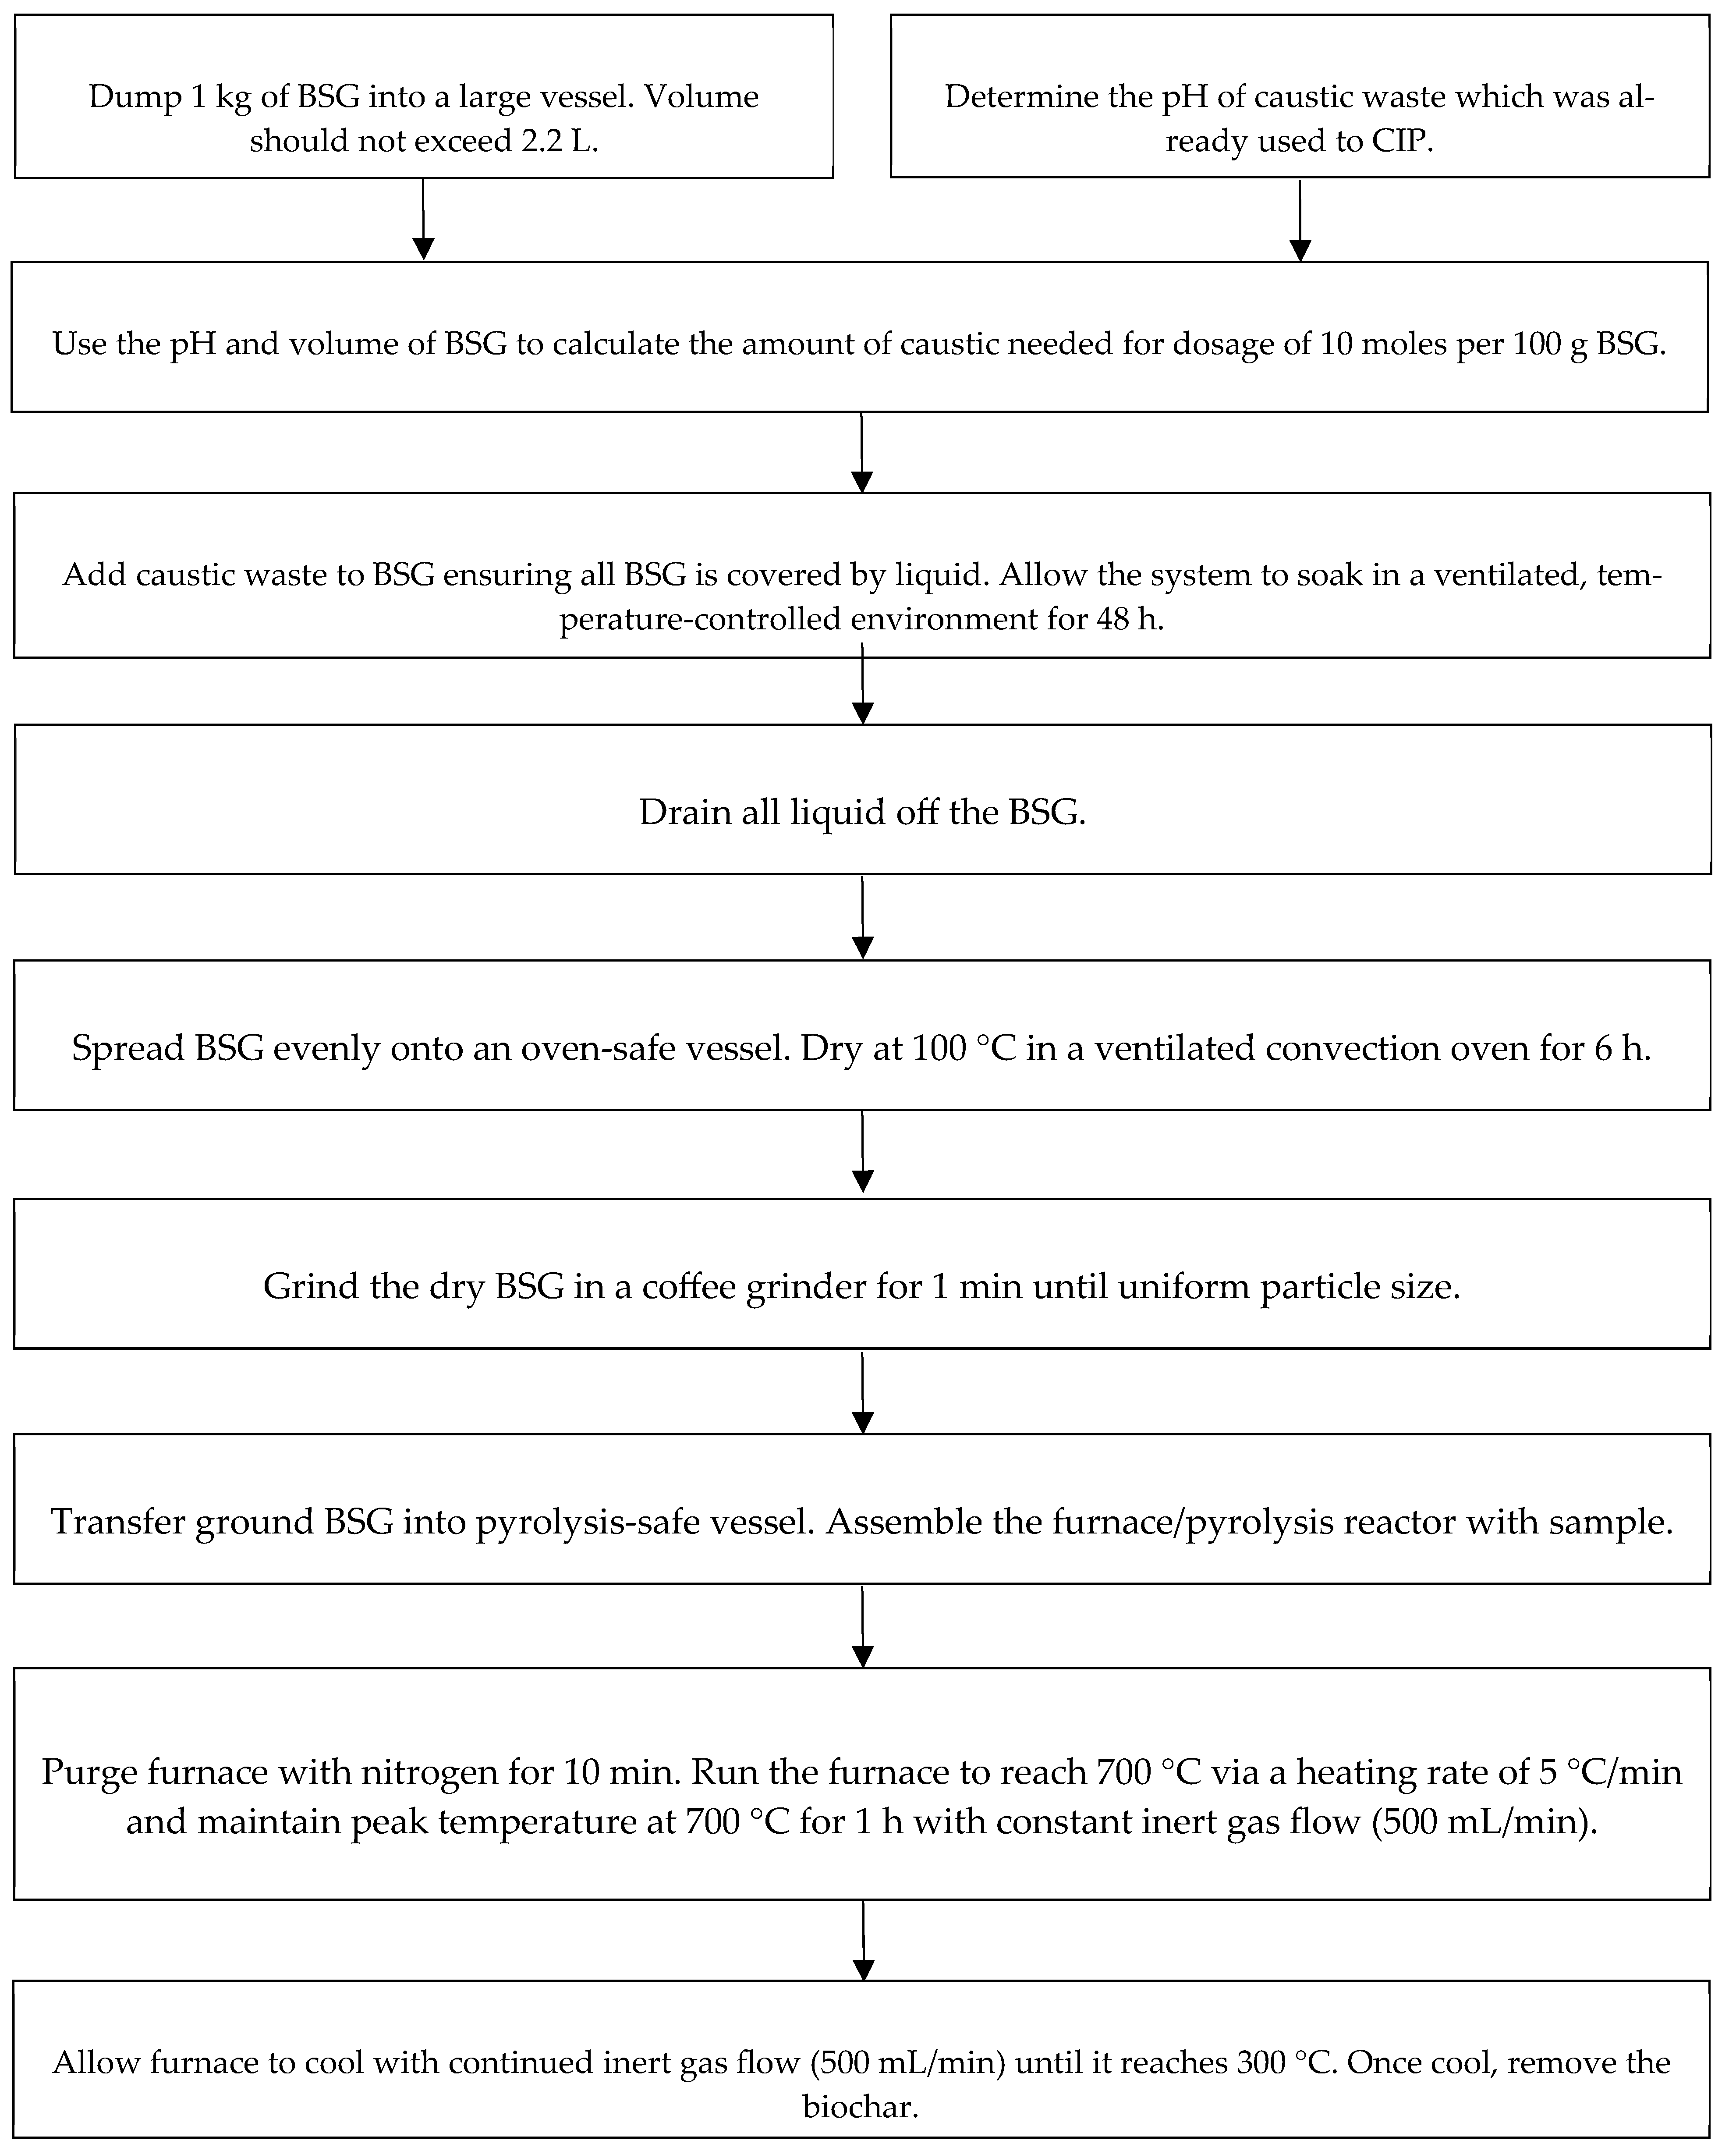
2.1. Biochar Production Method

The laboratory-based (bench-scale) method used for biochar production in this study is illustrated in Figure 1, below. Briefly, BSG (produced at the UC Davis Anheuser Busch InBev Pilot Brewery on the 30 L Nano-brewhouse systems) was soaked in waste caustic (collected after CIPing the UC Davis Anheuser Busch InBev Pilot Brewery 1.5-barrel brewhouse), at a dosage rate of 10 moles per 100 g BSG for a period of 48 h. After soaking, the caustic was drained off the BSG. Then, the BSG was dried for 6 h in a convection oven at 100 °C. The BSG was ground in a coffee grinder, then pyrolyzed in a 200 mm quartz tube furnace with a peak temperature of 700 °C for a residence time of 1 h.

2.2. Biochar Evaluation Methods

The following methods, presented by Singh et al. 2022 [23], were used to evaluate biochar quality: pH; liming potential; organic and inorganic carbon content; total porosity; and specific surface area.
The mass of biochar recovered was correlated with the peak pyrolysis temperature. Specifically, higher volumes of biochar were recovered for all samples pyrolyzed at 400 °C (3.59 g average) than at 700 °C (2.76 g average).
Biochar samples (250 mg) were weighed onto weighing paper, then transferred to 15 mL centrifuge tubes. DI water (5 mL) was added to each tube. Samples were mechanically shaken on a wrist-action shaker for 1 h at room temperature. They then stood at room temperature for 1 h. The pH meter was calibrated using pH 7 and 10 buffers. The pH of the suspension was evaluated three times for each sample, rinsing the probe with DI water and blotting dry with a Kimwipe between each measurement; the values were averaged.
The total organic carbon (TOC) analysis was conducted by the University of California, Davis Analytical Lab in 2023. The analytical laboratory completed the AOAC Official Method 972.43, Microchemical Determination of Carbon, Hydrogen, and Nitrogen, Automated Method from the 16th Edition of the Official Methods of Analysis of AOAC International. Briefly, the protocol involves acid fumigation with hydrochloric vapor to remove inorganic carbon. The process of flash combustion converts organic and inorganic substances into the combustion gases N 2 ,   N O x , C O 2 ,   a n d   H 2 O . The detection limit is approximately 0.02% carbon
Biochar (250 mg) was weighed onto weighing paper, then transferred to 15 mL plastic centrifuge tubes. Hydrochloric acid (5 mL, 1 M) was added; the suspension was hand-shaken to combine it, then mechanically shaken on an orbital shaker for 2 h at room temperature. The samples were left to settle overnight. The suspensions were titrated with 0.5 M NaOH with constant stirring until a neutral pH (~7.0) was reached. The volume of NaOH was recorded. A blank titration was performed to determine the volume of NaOH consumed by 1 M HCl without biochar. Equation (1) was used to determine the % C a C O 3 equivalent:
%   C a C O 3   e q u i v a l e n t = M b a   10 3 100.09 2 W
where
  • M = Standardized molarity of NaOH (mol L−1);
  • b = Volume of NaOH consumed (mL) by the blank;
  • a = Volume of NaOH consumed (mL) by the biochar;
  • 10 3 = Conversion from mL to L;
  • 100.09 = Molar mass of CaCO3;
  • W = Mass of biochar (g);
  • 2 = 1 mole of CaCO3 consumes 2 moles of H+.
The method was found to produce an ideal biochar, categorized by a mass recovery of 25–30% initial weight, a neutral pH of ~7.85, a Class 1 categorized liming potential (1–10% C a C O 3   e q ), a high TOC (~70%), and consistent porosity.

2.3. Carbon Footprint Assessment (CFA) Model Assumptions and Equations

We conducted a carbon footprint assessment (CFA) to systematically evaluate the GHG emissions associated with our proposed BSG-to-biochar system. To complete this analysis, we accounted for all the energy inputs into the system, as defined by our system boundary, and converted this energy use to GHG emissions using conversion factors as described in the following sections. Further, we tabulated all additional emissions.

2.3.1. Inventory of BSG-to-Biochar Process Inputs and Outputs

Data collection was categorized by the industrial phases of: soaking (1); drying (2); grinding (3); weighing (4); and pyrolysis (5). The resulting quantities of BSG after each phase, starting from 1 kg of unprocessed BSG were: 0.3 kg post drying; 0.299 kg post grinding; 0.299 kg post weighing; and 0.0825 kg post pyrolysis.
Phase 1 inputs considered fume hood usage, while the outputs were wastewater and vented fumes. Fume hood data was collected using the Lawrence Berkeley National laboratory calculator for determining the energy usage of a fume hood, considering sash height and a variety of other parameters. The tool was set to Sacramento, CA with an opening of 62 by 29 in (horizontal by vertical); a face velocity of 100 ft/min; temperature maintenance at 55 °F; a delivery air temp of 65 °F; and the energy type being fuel. The volume of wastewater was collected at the laboratory scale after caustic adsorption for 48 h. The volume of C O 2 produced from fermentation was determined at the laboratory scale by closing the system for 48 h and measuring the volume of collected gas. These were considered biogenic carbon emissions, which could be considered climate-neutral; however, we are including these in this analysis for a complete assessment of emissions.
The major input for drying, phase 2, was the electricity used to power the oven; the major output was water vapor from the BSG. The modeled equipment was a Shel Lab Forced Air Oven SMO3 110–120 Voltage. The wattage of this oven was 1610 W, with a capacity of 85 L. The water-vapor volume was assumed to be equivalent to the mass loss of the BSG, post drying.
The inputs of phases 3 and 4 were primarily electricity, the MJ inputs were calculated considering the conversion of P o w e r ( W a t t s ) = E n e r g y ( J o u l e s ) T i m e ( s e c o n d s ) . There were no considerable outputs for these phases.
Phase 5, pyrolysis, required nitrogen gas and electricity as the major inputs. At the laboratory scale, researchers used the same style of furnace; however, the quartz tube had a 60 mm diameter. The load limit for a 60 mm tube was small, only allowing for 0.030 kg of dried, ground BSG in each run. Instead, this CFA assumes that a 200 mm diameter quartz tube could host 0.299 kg of dried, ground BSG, which is equivalent to the functional unit of 1 kg of unprocessed BSG. The nitrogen gas flow rate was set to 500 mL/min and was active for 3 h and 40 min, thereby requiring 170 L per run. It is known that 1 L nitrogen is equivalent to 0.808 kg [24]. Furnace electricity usage was determined based on wattage and time. There were three major outputs of pyrolysis: syngas, bio-oil, and biochar; yield data for bio-oil and syngas were not collected at the laboratory scale. Another study considered the greenhouse gas impact of the pyrolysis of switchgrass for biochar production [25]. The functional unit of the study was 1 Mg of BSG. Yields of syngas and bio-oil were reported on a percentage dry basis, and, therefore, did not need to be converted. The biochar yield was 29% on a dry basis; the bio-oil yield was 64.1% on a dry basis; and the syngas yield was 6.1% on a dry basis [26]. This aligned with the present study’s yields, as biochar recovery averaged 27.6% or 0.0825 kg.

2.3.2. Global Warming Potential (Impact Assessment) Input Phases

The United States Environmental Protection Agency (EPA) offers guidance on calculating GHG equivalencies from emissions or energy data into the equivalent amount of GHG emissions. Briefly, electricity consumption was converted from MJ to kg of C O 2 e using an emissions factor of 0.1187 kg C O 2 e per MJ [27]. Utilizing this, values were determined from the impact categories named in Table 1 and presented in Table 2.

2.3.3. Global Warming Potential (Impact Assessment) Output Phases

GWP values were determined from the impact categories named in Table 1 and presented in Table 2. Wastewater treatment emissions were calculated using a predictive model from the EPA [28]. In this model, it was assumed that wastewater was sent to an activated sludge system for treatment with a methane correction factor for wastewater treatment value of 0, a conversion factor for maximum C O 2 generation per unit of oxygen demand of 1.38, and a conversion factor for maximum C H 4 generation per unit of oxygen demand of 0.5. The annual C O 2 emissions from processing wastewater in this system were 316 Mg C O 2 / y e a r , or 3.16 × 10⁵ kg C O 2 e / y e a r . The system processed 158 m 3 / h .
In this CFA, biochar was utilized in soil application to sequester carbon. The direct carbon sequestration value of biochar was estimated in terms of a carbon stability factor by utilizing Equation (2):
C O 2 , s e q u e s t = 3.66 ( 1 e ( t 1 / 2 l n ( 0.5 ) ) / T H )
where 3.66 is the ratio of molecular weight of C O 2 to that of C , t 1 / 2 (the half-life of biochar in soil), and TH is the analytical time horizon [12]. The half-life of biochar in soil was calculated using Equation (4) from [12]. Equation (4) first required Equation (3) to determine O : C :
O : C = m a x 0.6 0.00079 T 0
t 1 / 2 = 1000 e 7 ( O : C )
where T is the pyrolysis peak temperature.

2.4. Goal and Scope

The aim of this study was to assess the GWP of the method provided for converting BSG into biochar and comparing it to the alternative pathway of landfilling BSG. Understanding the greenhouse gas implications of this practice supports informed decision making and facilitates the adoption of sustainable practices.
The intended audience of this study includes brewing industry professionals, policymakers, and researchers. Brewing industry professionals can utilize this CFA to assess the benefits of implementing biochar production in their facilities. Policymakers and environmental professionals can leverage the results to advocate for or shape policies and regulations that promote sustainable practices within the brewing industry and potentially the beverage industry at large.
The functional unit chosen for this study is one unprocessed kg of BSG (collected directly from the lauter tun). This allows for data comparison with one unprocessed kg of BSG sent to the landfill.

2.5. System Boundary

This study conducted an evaluation of biochar production at the laboratory–bench scale, which imposed limitations on production volumes due to equipment size. It is important to note that scale-up of this system could enhance the accuracy of the environmental impact and potential benefits of this system. Scaling up would also represent more applicable conditions to help determine the feasibility and suitability on a larger scale.
The boundaries of this system are depicted in Figure 2. Any item shown outside of the system boundary is considered background data, while items listed inside are considered foreground data. The system boundary excludes beer production and the production of brewery cleaning materials, as these processes will occur regardless of this valorization process. The transportation of BSG and caustic waste is excluded from the boundary. Although these steps will differ from the traditional brewing process, the distance will vary, depending on the location of the processing facility in relation to the breweries. The boundary also excludes the industrial production of equipment and materials used in this process, as they will vary depending on the size of the installed pyrolysis system.
The production process of BSG biochar involves the following six major steps: (1) soaking of BSG in caustic waste in a ventilated area; (2) drying of BSG in an oven; (3) grinding of BSG; (4) weighing of BSG; and (5) pyrolysis of BSG. The primary inputs in steps 2, 3, and 4 are electricity use. Step 5 involves electricity and nitrogen gas.
The primary output of step 1 is wastewater, with consideration given to vented fumes. Step 2 mainly produces evaporated water. Step 5 results in the production of biochar as well as syngas and bio-oil, which are valuable commodities and can be considered co-products. It is assumed in this system that the source of electricity utilizes natural gas.

3. Results

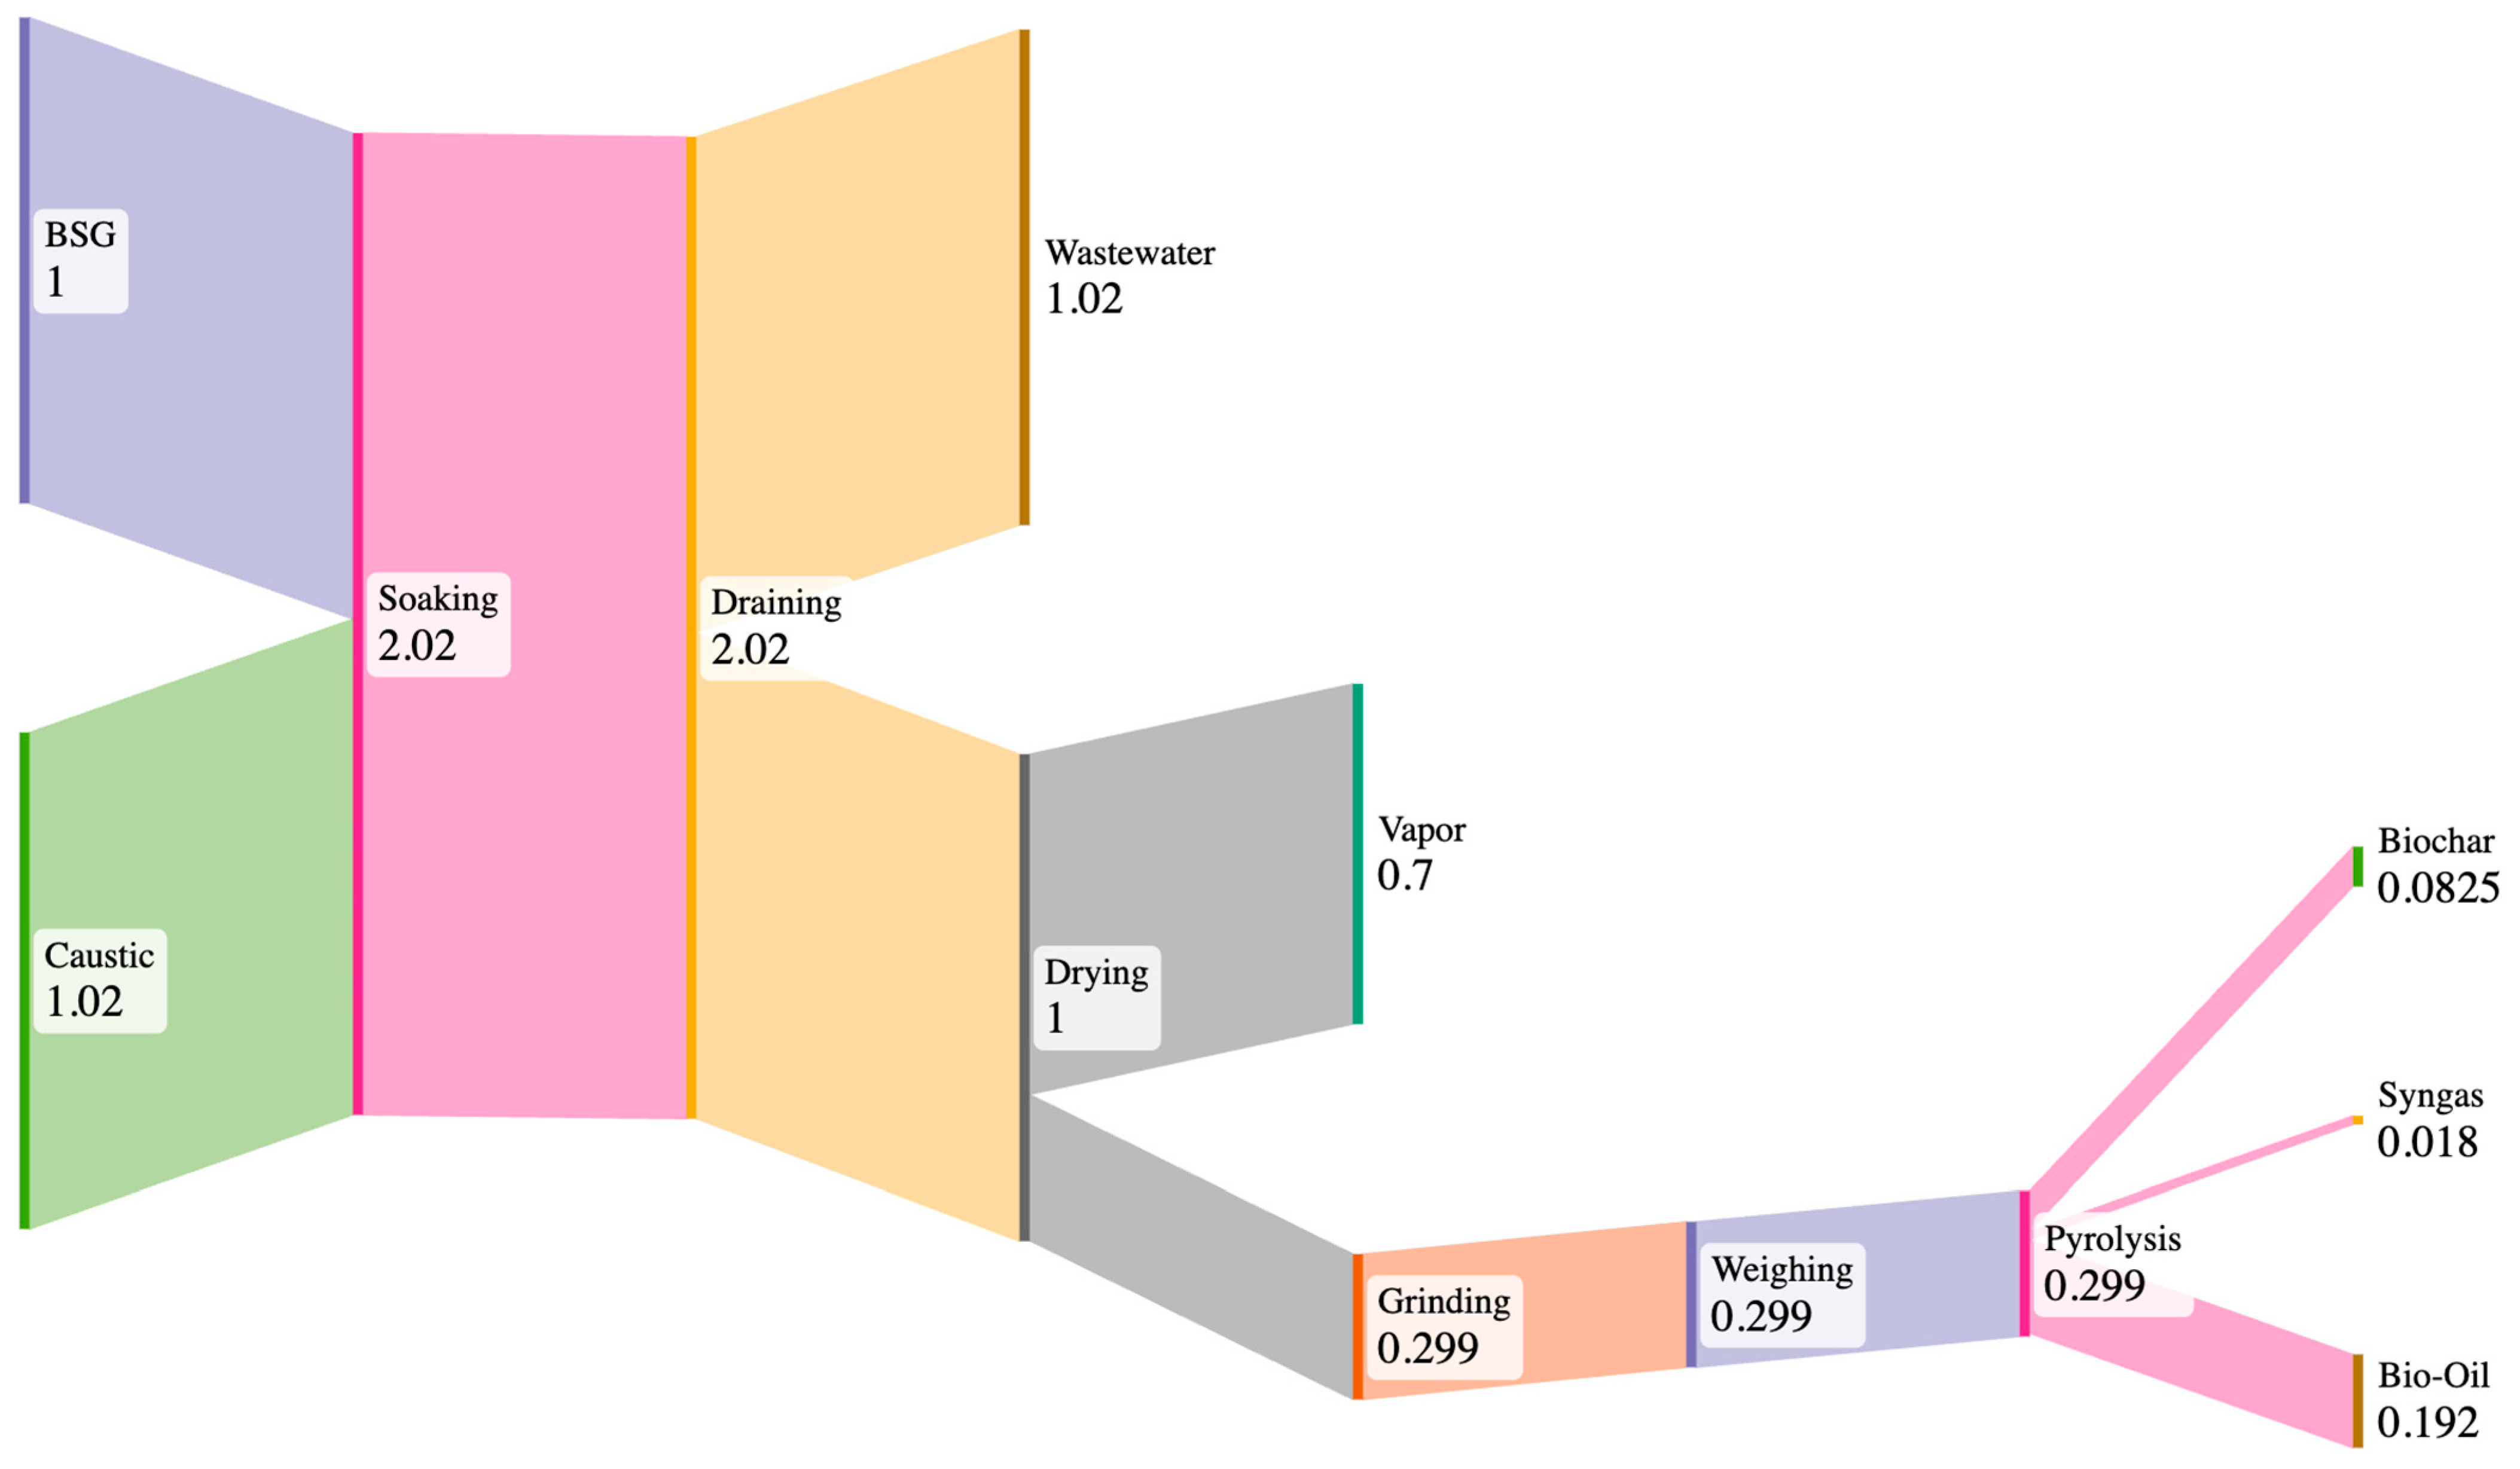
3.1. BSG-to-Biochar Process Inputs and Outputs

Data collection was categorized by the industrial phases (1–5) outlined in Section 2.3.1. Data were collected from the laboratory-scale protocol utilized by the researcher and from publications on similar processes.
The major inputs for phase 1, soaking, were the electricity required for operation of a fume hood and the electricity required for operation of a scale. The Lawrence Berkeley National laboratory calculator found that the closed fume hood would use 71.4 kWh/day, which is equivalent to 257 MJ [25]. The volume was adapted to consider the functional unit of 1 kg of unprocessed BSG. Specifically, 1 kg of BSG is equivalent to 220 c m 2 , while the fume hood volume is 11,600 c m 2 . Therefore, 1 kg of BSG requires 9.74 MJ for 48 h of soaking. Utilizing a scale with 10-watt power for 30 min required 0.018 MJ.
Phase 2, drying, considered the electricity for heating as the major input, and water vapor dissipated off of the BSG as the major output. At the laboratory scale, 1 kg of unprocessed BSG was equivalent to 2.2 L; therefore per 1 kg of BSG, the oven utilized 0.915 MJ. At the laboratory scale, BSG lost 70–75% of its weight after drying. It was assumed that the water vapor produced from BSG drying was 0.7 kg per 1 kg of unprocessed BSG.
The major input for grinding, phase 3, was the electricity required to power the coffee grinder. After drying, 1 kg of unprocessed BSG was equivalent to 0.3 kg of processed BSG. A 300-watt coffee grinder used for 1 min was suitable for 0.3 kg of dry BSG, requiring 0.018 MJ for use. There was some minor dust associated with this protocol; however, the total volume was considered negligible as an environmental burden. After this stage, 1 kg of unprocessed BSG was equivalent to 0.299 kg of pretreated, dried, ground BSG.
The major input for weighing, phase 4, was the electricity used to power the scale. Utilizing a scale with 10-watt power for 15 min required 0.009 MJ. There was no considerable output for this phase.
Phase 5, pyrolysis, required nitrogen gas and electricity as the major inputs. Based on the assumptions provided in Section 2.2. GHGA Model Assumptions and Equations, it was determined that 137 kg of nitrogen were utilized per 1 kg of unprocessed BSG. Therefore, bio-oil production was determined to be 0.192 kg; syngas was 0.018 kg per kg of unprocessed BSG.
Figure 3 provides an overview of the mass flows for the BSG to biochar process. The major outputs of phase 1 were wastewater drained off the grain after soaking and the vented fumes. Per 1 kg of unprocessed BSG, 1.02 L of wastewater was drained via filtering the BSG solution over a cheesecloth. The filtrate had a pH value of 5.17, and, therefore, would require negligible neutralization treatment prior to discarding. In phase 1, BSG is maintained in a room-temperature, moist environment where naturally present microbes can readily metabolize and release greenhouse gasses. Because of this output, the BSG vessels were held in a well-ventilated area, the fume hood. The resulting volume for 1 kg of unprocessed BSG was 109 mL; this was assumed to be primarily C O 2 , and, therefore, had a weight of 0.074 kg. A study found that after the fermentation of BSG, the total dissolved gas had a concentration of 0.72% dissolved C H 4 ; the remaining gas was C O 2 [29]. Because of the significant drop in pH and the increased presence of gaseous bubbles over the 48 h period, it was concluded that the main gas present in this study was C O 2 resulting from fermentation.

3.2. Landfilling BSG Comparison

A study conducted a cost–benefit analysis of greenhouse gas emissions associated with diverting food waste from landfills [30]. The food waste in question was generated by a restaurant during a 6-day work week, stored in bins without refrigeration, and picked up on a weekly basis. The study used a functional unit of 1 kg unprocessed food waste. It accounted for C O 2 emissions resulting from the usage of grid electricity at the waste producer site; C O 2 emissions from fossil fuel consumption during transportation over a distance of 15 km; and C H 4 emissions originating from the food waste at the landfill [30]. In the modeled scenario, the gases were released into the environment rather than being collected for use.
The study revealed that the primary contributor to C O 2 e emissions from landfilling food waste is the release of fugitive methane (3 kg of C O 2 e per kg of food waste) [30]. Comparatively, transportation of the food waste to the landfill was a minor contributor, at 0.006 kg of C O 2 e per kg of food waste [30]. The net emissions associated with landfilling increased proportionally with the volume of uncaptured methane released. Furthermore, the study demonstrated that capturing methane onsite at a landfill can reduce the environmental burden of landfilling BSG. Adapting the functional unit of the present study, the total emissions from landfilling 1 kg of unprocessed BSG would be 3.01 kg C O 2 e .
The Sanciolo et al. study [30] also examined various other scenarios, including: centralized composting; centralized composting of dehydrated food waste; food waste or diversion to wastewater treatment plants as a result of using aerobic digesters with liquid outputs; or in-sink disposal. In all these scenarios, the C O 2 e values were significantly lower than landfilling; they ranged from 0.04 to 0.7 kg C O 2 e per kg of food waste [30]. More specifically, composting and aerobic digestion both proved to be more favorable compared to landfilling, with C O 2 e values of 0.3 and 0.11 kg C O 2 e per kg of food waste, respectively [30].
However, the Sanciolo et al. study [30] did not provide data on the composition of the food waste utilized. Methane is primarily produced in a landfill setting when an oxygen-limited environment is formed, leading to anaerobic bacteria fermenting carbohydrates and amino acids. Since the carbohydrate and amino acid concentration of BSG is considerably smaller than that of the generic food waste evaluated in the Sanciolo et al. study, it can be presumed that the actual C O 2 e generation is slightly less than 3 kg per kg of unprocessed BSG (See Chapter 1, Table 2 for BSG composition data), but still greater than 1 kg C O 2 e per kg of unprocessed BSG.

3.3. Global Warming Potential (Impact Assessment)

3.3.1. Input Phases

Among the consumption categories, electricity usage for ventilation in phase 2 and electricity consumption for pyrolysis in phase 6 were the most significant contributors. Meanwhile, electricity usage for weighing in phases 2 and 5, electricity consumption in phases 3 and 4, and nitrogen gas usage in phase 6 were relatively insignificant.

3.3.2. Output Phases

Wastewater treatment emissions were calculated using the EPA predictive model [28]. Considering the functional unit, where 1.02 kg of wastewater were produced per kg of unprocessed BSG and the wastewater processed from the evaluated system was 0.00076% of what the system processed per hour, this would equate to 6 × 10⁻⁷ kg C O 2 e / y e a r for 1 kg unprocessed BSG.
Fumes from fermentation were vented at a rate of 0.074 kg C O 2 per kg of unprocessed BSG, and, therefore, emitted 0.074 kg C O 2 e per kg of unprocessed BSG.
Using Equation (3), O : C was found to be 0.047. Using Equation (4), t 1 / 2 was found to be 719 years. Using Equation (2), C O 2 , s e q u e s t was found to be 3.63 Mg C O 2 e /Mg feedstock processed when T H was 100 years [12]. Sequestration values ranged from 0 to 3.66 Mg C O 2 e /Mg feedstock processed, indicating that the studied pyrolysis conditions yielded an extremely effective carbon sequestration mechanism [31]. To consider the functional unit, 3.63 Mg C O 2 e per Mg feedstock processed was converted to 8.93 kg C O 2 e per kg of unprocessed BSG. Specifically, there are 30,082 seeds of barley per kg of barley plant [32], one barley seed weighs 0.0436 g [33]; BSG accounts for 31% of the original malt weight [14].
For the biorefining process, it was found that converting bio-oil into gasoline and diesel using the syngas from pyrolysis (Case 1) yielded a GWP value of −0.0275 kg C O 2 e per kg of unprocessed BSG [34]. However, if the syngas (hydrogen) underwent steam reforming, and the bio-oil was hydrogenated into gasoline and diesel (Case 2), a GWP value of −0.063 kg C O 2 e per kg unprocessed BSG was found [34]. In the referenced study, the biomass was corn-stover, which was pyrolyzed at 500 °C with ambient pressure [34]. Because of this difference, and a functional unit of 1 MJ of biofuel produced, data from the study have been extrapolated to match the current study. Based on these results, Case 2 has the more favorable GWP value; however, it also released a higher GWP value for biomass consumption and the pretreatment stage, respectively (8.80, 15.9 g C O 2 e per MJ biofuel produced), than Case 1 (6.70, 12.1 g C O 2 e per MJ biofuel produced). This must be considered when designing a biochar processing facility with bio-oil and syngas recovery. For this study, Case 1 was used, as it required less equipment and processing.
As presented in Table 2, the primary category contributing to C O 2 e production was the electricity consumed throughout the process, amounting to 9.81 kg C O 2 e . The most significant steps, in terms of electricity use, were pyrolysis, fume hood ventilation, and drying, in that order. Figure 4 illustrates that the top C O 2 e removal category was biochar–soil application (−8.93 kg C O 2 e ). The overall GWP for this system was determined to be 1.18 kg C O 2 e per kg of unprocessed biochar.

4. Discussion

The findings of this study concluded that landfilling BSG releases nearly 3 kg C O 2 e per kg of unprocessed BSG, while processing BSG into biochar at the laboratory scale results in a lower emission of 1.18 kg C O 2 e per kg of unprocessed BSG. Based on these results, it is strongly recommended that BSG should be diverted from landfills and utilized in more environmentally sustainable ways such as through biochar production. This alternative use has the potential to significantly mitigate the environmental impacts associated with BSG disposal, particularly when built to a large scale in an urban area. The insights gained from this study can inform the development of policies and regulations aimed at minimizing the environmental impact of food waste disposal.

4.1. Comparative Models

While the researchers did not encounter any studies that considered the carbon footprint assessment of producing biochar from BSG, one study confirmed that BSG-based biochar is comparable to that made from wood, sugarcane, grape or olive bagasse, and hazelnut shells [14]. Further, BSG-based biochar is an effective adsorbent material, removing volatile organic compounds, dyes, water contaminants and other undesired compounds from different systems [10,14,35,36]. The biochar production parameters considered in this study were confirmed by a study by Pereira da Silva Araújo et al., which concluded that BSG-based biochar exhibits excellent porosity when pretreated with KOH or NaOH and processed at high temperatures (700–900 °C) [37].

4.2. Commercial Applicability of BSG-to-Biochar Process

The recommended BSG-to-biochar approach is primarily applicable to breweries that have the potential to expand their energy sources in their warehouse and those that do not have access to local farmers who can utilize the BSG as cattle feed.
Ideally, this approach could be adapted by a cooperative set of craft breweries located in one condensed urban area. In this setting, farmers would be less inclined to drive into the area and pick up the BSG, making the diversion to animal feed unattainable for these breweries. A centralized biochar production facility would enable the craft breweries to send their BSG for processing, ultimately reducing the cost and material expenditure associated with transporting unprocessed BSG offsite, far out of the urban area, to a landfill or composting facility. Ideally, caustic waste from the craft brewery closest to the processing facility would be utilized to enhance the biochar. Utilizing caustic waste in processing removes the need to neutralize chemical waste prior to draining and decreases the total wastewater produced in brewing facilities. Once processed, the biochar should be sent for soil amendment at a barley agriculture site because soil amendment is the most effective use of biochar for GHG reduction. The weight of BSG biochar is significantly less than that of BSG; therefore, transportation of finalized biochar offsite from the centralized processing facility to a barley farm would be less resource-intensive than transporting unprocessed BSG. Efforts should be made to minimize the distance for transporting biochar to barley growers.
At a BSG-to-biochar processing facility, the syngas released during biochar production should be captured and utilized as an energy source. This would decrease the required energy input, thereby improving the overall energy requirements and consequently reducing the GHG emissions associated with the biochar production process. Moreover, the syngas can also serve as an energy source to clarify the bio-oil produced during BSG processing if the bio-oil is being refined within the same facility. The clarified crude oil then has applications for gasoline, diesel fuel, and heating oil production, which can be utilized in-house.

4.3. Biochar End-of-Life Use

The end-of-life use for biochar was not specifically considered in this model because it is not feasible to remove biochar from the soil once it has been applied for soil amendment. However, if the biochar was utilized in other potential applications (e.g., water filtration, beer filtration, or supercapacitors) the biochar could be applied to soil for end-of-life use. In these scenarios, the biochar would be impregnated with nutrients that could further benefit the soil.

4.4. Limitations

The most significant limitation for this study is the scale at which calculations were performed. Generally, as the scale increases, the cost (monetarily, energetically, and resource-wise) tends to decrease while maintaining the desired output, thereby improving the system. This analysis does not consider construction of the buildings or equipment used in the process, which could contribute to a higher GWP, depending on the timeframe of the analysis.
There were multiple minor data collection limitations:
  • Collecting data on the pH of caustic waste proved challenging, and, therefore, confirmation was only obtained from a few breweries;
  • In the calculated model, the oven would need to be filled to full capacity, potentially requiring drying times exceeding 6 h;
  • The calculations for grinding were based on a small coffee grinder, which would not be efficient for large-scale production;
  • Although the recorded average nitrogen loss was 50 L per run, the calculations indicated a requirement of 170 L for the duration of the run, suggesting an error with the flow meter. The actual flow rate for nitrogen depleted was closer to 15 mL/min, while the flow meter read 5 L/min;
  • Regarding the syngas and bio-oil recovery calculations, the reference study employed an auger reactor (1 kg biomass per hour), while the present study used a smaller-scale pyrolysis furnace (30 g per run);
One final major limitation to consider is the extrapolation of data to calculate the GWP of utilizing biochar for soil amendment and recovering bio-oil and syngas for energy. The data collected utilize different biomass precursors and slightly different pyrolysis conditions. The BSG-to-biochar model excludes transportation of biochar to a farm for soil amendment and transportation of the BSG to a central processing facility.

4.5. Future Considerations

The major factor that contributed to the GWP of this process was the electricity used in the pyrolysis step. It is presumed that employing larger-scale and more energy-efficient pyrolysis equipment would lead to a significant decrease in emissions. This straightforward modification would render the process more sustainable. Therefore, future studies should prioritize the implementation of this biochar production method on a larger scale to gather more robust and reliable data.
To mitigate the negative environmental impacts of the energy required for pyrolysis, the utilization of sustainable forms of electricity (e.g., solar panels, syngas from anaerobic digestion, recovered steam from the brewery) would be beneficial. Additionally, during the soaking phase, BSG could be left to soak in a ventilated area that is more energy-efficient, as the fume hood used in this scenario consumed a substantial amount of energy, contributing significantly to GHG emissions. While the electricity demand for oven usage was relatively small compared to pyrolysis and ventilation, it still contributed to overall emissions. Therefore, the adoption of a more energy-efficient oven or the use of sustainable forms of electricity would also be advantageous in this regard.

Author Contributions

Conceptualization, E.N., N.N., E.S. and G.F.; Methodology, E.N., N.N., E.S. and G.F.; Formal analysis, E.N.; Investigation, E.N. and G.F.; Resources, G.F.; Data curation, E.N.; Writing—original draft, E.N.; Writing—review & editing, E.N., N.N., E.S. and G.F.; Visualization, E.N.; Supervision, N.N., E.S. and G.F.; Funding acquisition, G.F., N.N., and E.S. All authors have read and agreed to the published version of the manuscript.

Funding

Nitin N was supported by U.S. Department of Agriculture Natural Resources Conservation Service (USDA-NRCS) award #NR243A750004G028. Spang E was supported by U.S. National Science Foundation (NSF) award #2115405.

Institutional Review Board Statement

Not applicable.

Informed Consent Statement

Not applicable.

Data Availability Statement

The original contributions presented in this study are included in the article. Further inquiries can be directed to the corresponding author.

Conflicts of Interest

The authors declare no conflict of interest.

References

  1. Zeko-Pivač, A.; Tišma, M.; Žnidaršič-Plazl, P.; Kulisic, B.; Sakellaris, G.; Hao, J.; Planinić, M. The potential of brewer’s spent grain in the circular bioeconomy: State of the art and future perspectives. Front. Bioeng. Biotechnol. 2022, 10, 870744. [Google Scholar] [CrossRef] [PubMed]
  2. Hanson, C. Guidance on Interpreting Sustainable Development Goal Target 12.3. Available online: https://champions123.org/sites/default/files/2020-09/champions-12-3-guidance-on-interpreting-sdg-target-12-3.pdf (accessed on 1 August 2024).
  3. Mitri, S.; Salameh, S.-J.; Khelfa, A.; Leonard, E.; Maroun, R.G.; Louka, N.; Koubaa, M. Valorization of brewers’ spent grains: Pretreatments and fermentation, a review. Fermentation 2022, 8, 50. [Google Scholar] [CrossRef]
  4. Cancelliere, R.; Carbone, K.; Pagano, M.; Cacciotti, I.; Micheli, L. Biochar from Brewers’ Spent Grain: A Green and Low-Cost Smart Material to Modify Screen-Printed Electrodes. Biosensors 2019, 9, 139. [Google Scholar] [CrossRef]
  5. Zhang, J.; Wang, Q. Sustainable mechanisms of biochar derived from brewers’ spent grain and sewage sludge for ammonia–nitrogen capture. J. Clean. Prod. 2016, 112, 3927–3934. [Google Scholar] [CrossRef]
  6. Xi, X.; Yan, J.; Quan, G.; Cui, L. Removal of the Pesticide Pymetrozine from Aqueous Solution by Biochar Produced from Brewer’s Spent Grain at Different Pyrolytic Temperatures. Bioresources 2014, 9, 7696–7709. [Google Scholar] [CrossRef]
  7. Roberts, K.G.; Gloy, B.A.; Joseph, S.; Scott, N.R.; Lehmann, J. Life cycle assessment of biochar systems: Estimating the energetic, economic, and climate change potential. Environ. Sci. Technol. 2010, 44, 827–833. [Google Scholar] [CrossRef]
  8. Stewart, C.E.; Zheng, J.; Botte, J.; Cotrufo, M.F. Co-generated fast pyrolysis biochar mitigates green-house gas emissions and increases carbon sequestration in temperate soils. Glob. Change Biol. Bioenergy 2013, 5, 153–164. [Google Scholar] [CrossRef]
  9. Matuštík, J.; Hnátková, T.; Kočí, V. Life cycle assessment of biochar-to-soil systems: A review. J. Clean. Prod. 2020, 259, 120998. [Google Scholar] [CrossRef]
  10. Bergman, R.D.; Gu, H.; Page-Dumroese, D.S.; Anderson, N.M. Life cycle analysis of biochar. In Biochar: A Regional Supply Chain Approach in View of Climate Change Mitigation; Bruckman, V.J., Apaydın Varol, E., Uzun, B.B., Liu, J., Eds.; Cambridge University Press: Cambridge, UK, 2016; pp. 46–69. ISBN 9781107117099. [Google Scholar]
  11. Miller-Robbie, L.; Ulrich, B.A.; Ramey, D.F.; Spencer, K.S.; Herzog, S.P.; Cath, T.Y.; Stokes, J.R.; Higgins, C.P. Life cycle energy and greenhouse gas assessment of the co-production of biosolids and biochar for land application. J. Clean. Prod. 2015, 91, 118–127. [Google Scholar] [CrossRef]
  12. Hammond, J.; Shackley, S.; Sohi, S.; Brownsort, P. Prospective life cycle carbon abatement for pyrolysis biochar systems in the UK. Energy Policy 2011, 39, 2646–2655. [Google Scholar] [CrossRef]
  13. Uddin, M.M.; Wright, M.M. Life cycle analysis of biochar use in water treatment plants. In Sustainable Biochar for Water and Wastewater Treatment; Elsevier: Amsterdam, The Netherlands, 2022; pp. 705–735. ISBN 9780128222256. [Google Scholar]
  14. Mussatto, S.I.; Dragone, G.; Roberto, I.C. Brewers’ spent grain: Generation, characteristics and potential applications. J. Cereal Sci. 2006, 43, 1–14. [Google Scholar] [CrossRef]
  15. Wool, R.; Sun, X.S. Chapter 16: Lignin Polymers and Composites. In Bio-Based Polymers and Composites; Wool, R., Sun, X.S., Eds.; Academic Press: Amsterdam, The Netherlands, 2011; pp. 551–598. [Google Scholar]
  16. De, S.; Mishra, S.; Poonguzhali, E.; Rajesh, M.; Tamilarasan, K. Fractionation and characterization of lignin from waste rice straw: Biomass surface chemical composition analysis. Int. J. Biol. Macromol. 2020, 145, 795–803. [Google Scholar] [CrossRef]
  17. International Biochar Initiative. Standardized Product Definition and Product Testing Guidelines for Biochar That Is Used in Soil. Version 2.1. Available online: https://biochar-international.org/wp-content/uploads/2020/06/IBI_Biochar_Standards_V2.1_Final2.pdf (accessed on 1 August 2024).
  18. Rodriguez Correa, C.; Hehr, T.; Voglhuber-Slavinsky, A.; Rauscher, Y.; Kruse, A. Pyrolysis vs. hydrothermal carbonization: Understanding the effect of biomass structural components and inorganic compounds on the char properties. J. Anal. Appl. Pyrolysis 2019, 140, 137–147. [Google Scholar] [CrossRef]
  19. Surampalli, R.Y.; Zhang, T.C.; Tyagi, R.D.; Naidu, R.; Gurjar, B.R.; Ojha, C.S.P.; Yan, S.; Brar, S.K.; Ramakrishnan, A.; Kao, C.M. Carbon Capture and Storage: Physical, Chemical, and Biological Methods; American Society of Civil Engineers: Reston, VA, USA, 2015; ISBN 9780784478912. [Google Scholar]
  20. Yoder, J.; Galinato, S.; Granatstein, D.; Garcia-Pérez, M. Economic tradeoff between biochar and bio-oil production via pyrolysis. Biomass Bioenergy 2011, 35, 1851–1862. [Google Scholar] [CrossRef]
  21. Biogreen. Syngas—High Energy Pyrolysis Gas for Power Applications. Available online: https://www.biogreen-energy.com (accessed on 1 August 2024).
  22. Mohsen, R.A.; Abbassi, B.; Dutta, A. Assessment of greenhouse gas emissions from Ontario’s solid waste landfills: Assessment of improvement scenarios. J. Environ. Eng. 2019, 145. [Google Scholar] [CrossRef]
  23. Singh, B.; Wang, T.; Camps-Arbestain, M. Biochar characterization for water and wastewater treatments. In Sustainable Biochar for Water and Wastewater Treatment; Elsevier: Amsterdam, The Netherlands, 2022; pp. 135–152. ISBN 9780128222256. [Google Scholar]
  24. Fremantle, F.E.; Finnemore, H. The Abbott versimetric charts for the conversion of metric into English measure. Br. Med. J. 1908, 2, 1384–1385. [Google Scholar] [CrossRef]
  25. Lawrence Berkeley National Laboratory and Earth Advantage. Laboratory Fume Hood Energy Modeler. Available online: https://fumehoodcalculator.lbl.gov (accessed on 1 August 2024).
  26. Brassard, P.; Godbout, S.; Pelletier, F.; Raghavan, V.; Palacios, J.H. Pyrolysis of switchgrass in an auger reactor for biochar production: A greenhouse gas and energy impacts assessment. Biomass Bioenergy 2018, 116, 99–105. [Google Scholar] [CrossRef]
  27. Greenhouse Gas Equivalencies Calculator-Calculations and References|US EPA. Available online: https://www.epa.gov/energy/greenhouse-gas-equivalencies-calculator-calculations-and-references (accessed on 14 March 2025).
  28. RTI International. Greenhouse Gas Emissions Estimation Methodologies for Biogenic Emissions from Selected Source Categories: Solid Waste Disposal Wastewater Treatment Ethanol Fermentation. Available online: https://www3.epa.gov/ttnchie1/efpac/ghg/GHG_Biogenic_Report_draft_Dec1410.pdf (accessed on 1 August 2024).
  29. Ran, T.; Jin, L.; Abeynayake, R.; Saleem, A.M.; Zhang, X.; Niu, D.; Chen, L.; Yang, W. Effects of brewers’ spent grain protein hydrolysates on gas production, ruminal fermentation characteristics, microbial protein synthesis and microbial community in an artificial rumen fed a high grain diet. J. Anim. Sci. Biotechnol. 2021, 12, 1. [Google Scholar] [CrossRef]
  30. Sanciolo, P.; Rivera, E.; Navaratna, D.; Duke, M.C. Food waste diversion from landfills: A cost–benefit analysis of existing technological solutions based on greenhouse gas emissions. Sustainability 2022, 14, 6753. [Google Scholar] [CrossRef]
  31. Field, J.L.; Keske, C.M.H.; Birch, G.L.; DeFoort, M.W.; Cotrufo, M.F. Distributed biochar and bioenergy coproduction: A regionally specific case study of environmental benefits and economic impacts. Glob. Change Biol. Bioenergy 2013, 5, 177–191. [Google Scholar] [CrossRef]
  32. Jacobs, A.A. Plant Guide for Common Barley (Hordeum vulgare L.). Available online: https://plants.usda.gov/DocumentLibrary/plantguide/pdf/pg_hovu.pdf (accessed on 1 August 2024).
  33. Bertholdsson, N.O. Characterization of malting barley cultivars with more or less stable grain protein content under varying environmental conditions. Eur. J. Agron. 1999, 10, 1–8. [Google Scholar] [CrossRef]
  34. Dang, Q.; Yu, C.; Luo, Z. Environmental life cycle assessment of bio-fuel production via fast pyrolysis of corn stover and hydroprocessing. Fuel 2014, 131, 36–42. [Google Scholar] [CrossRef]
  35. Jackowski, M.; Niedźwiecki, Ł.; Jagiełło, K.; Uchańska, O.; Trusek, A. Brewer’s Spent Grains-Valuable Beer Industry By-Product. Biomolecules 2020, 10, 1669. [Google Scholar] [CrossRef] [PubMed]
  36. Chetrariu, A.; Dabija, A. Brewer’s spent grains: Possibilities of valorization, a review. Appl. Sci. 2020, 10, 5619. [Google Scholar] [CrossRef]
  37. da Silva Araújo, F.P.; de Souza Cupertino, G.; de Cássia Superbi de Sousa, R.; de Castro Santana, R.; Pereira, A.F. Use of biochar produced from brewer’s spent grains as an adsorbent. Biomass Convers. Biorefinery 2024, 1–16. [Google Scholar] [CrossRef]
Figure 1. BSG-to-biochar processing protocol.
Applsci 15 05525 g001
Figure 2. System boundaries for a greenhouse gas assessment on making biochar from BSG.
Applsci 15 05525 g002
Figure 3. Mass-flow diagram of BSG-to-biochar production process.
Applsci 15 05525 g003
Figure 4. GWP impact assessment.
Applsci 15 05525 g004
Table 1. Inventory of BSG-to-biochar processing inputs.
PhaseItemAmount per FUUnit
Inputs
SoakingElectricity (scale)0.018MJ
Electricity (ventilation)9.75MJ
DryingElectricity (oven)0.915MJ
GrindingElectricity (coffee grinder)0.018MJ
WeighingElectricity (scale)0.009MJ
PyrolysisNitrogen Gas137kg
Electricity71.9MJ
Outputs
SoakingWastewater (pH 5.17)1.02kg
Vented Fumes0.024kg
DryingWater Vapor0.7kg
PyrolysisBiochar0.083kg
Syngas0.018kg
Bio-oil0.192kg
Table 2. GWP impact assessment.
PhaseItem kg   C O 2 e
BSG-to-biochar ProcessInputElectricity (sum)9.81
Nitrogen Gas1 × 10−4
OutputWastewater6 × 10−7
Vented Fumes0.074
Biochar–Soil Application−8.93
Bio-Oil and Syngas Credit−0.027
TotalBSG-to-biochar GWP1.18
LandfillTotalLandfill GWP3.01
Disclaimer/Publisher’s Note: The statements, opinions and data contained in all publications are solely those of the individual author(s) and contributor(s) and not of MDPI and/or the editor(s). MDPI and/or the editor(s) disclaim responsibility for any injury to people or property resulting from any ideas, methods, instructions or products referred to in the content.

