Article

Thermography as a Method to Evaluate Temperature Changes in the Acropodial Region of a Warmblood Horse Following the Application of an Ice Boot Pack: A Pilot Study

1
Horia Cernescu Research Unit, Faculty of Veterinary Medicine, University of Life Sciences “Regele Mihai I” from Romania, 300645 Timisoara, Romania
2
Management and Rural Development Department, Faculty of Management and Rural Tourism, University of Life Sciences “Regele Mihai I” from Romania, 300645 Timisoara, Romania
*
Author to whom correspondence should be addressed.
Appl. Sci. 2025, 15(10), 5524; https://doi.org/10.3390/app15105524
Submission received: 21 April 2025 / Revised: 10 May 2025 / Accepted: 13 May 2025 / Published: 15 May 2025
(This article belongs to the Special Issue Recent Progress and Applications of Infrared Thermography)

Abstract

:
This pilot study evaluated the effectiveness of ice boots in cooling the metacarpal and coronary regions of a horse after training over 8 days (n = 8). Background: While cryotherapy is effective in managing exertional heat illness, stress fractures, and laminitis in horses, conventional methods are often costly and impractical. This pilot study assessed the efficacy of ice boots as an accessible alternative for cooling the metacarpal and coronary regions post-training. Methods: A four-year-old Warmblood mare was trained on a treadmill over 8 days. An ice boot was applied to the right thoracic limb for 20 min post-exercise. Thermographic images were captured at six time points from pre-training to 30 min post-cooling. Mean temperatures in four regions were analyzed using the FLIR Tools software v6.4.18039.1003. Results: Post-training, metacarpal temperatures increased by 10.97 ± 0.46 °C (p = 0.000). Ice boot application reduced metacarpal temperature by 20.27 ± 0.22 °C (p = 0.001) and coronary band temperature by 5.28 ± 0.30 °C (p = 0.001), with altered thermal patterns visible on the imaging. Treated regions returned to baseline within 30 min, while the control limb took 50 min. Conclusions: Ice boots provide rapid, effective cooling and distinctive thermal pattern changes, offering a practical cryotherapy alternative for equine limb care post-training. These initial findings lay the groundwork for larger studies involving more horses under varied conditions, which will be necessary to confirm the results and establish clear guidelines for the clinical use of ice boots in equine practice.

1. Introduction

Any object with a temperature above absolute zero emits radiant energy, and the total emitted power is proportional to the fourth power of the object’s absolute temperature [1]. This fundamental principle of radiative heat transfer, which relates the detected power to an object’s temperature, forms the foundation of modern infrared thermography [1,2]. Thermography is a non-invasive method for detecting the early signs of disease, confirming physical exam findings, and monitoring treatment progress by measuring heat radiated from the skin’s surface [3,4]. Thermographic imaging has been used in human and equine medicine since the 1960s [5]. In human medicine, it is applied in breast cancer screening, osteoarthritis assessment, burn healing monitoring, and muscle injury evaluation [5,6]. In equine medicine, it assists in the early detection of laminitis, tendon and ligament injuries, palmar foot pain, and thoracolumbar pain [1,7,8]. In addition to visual inspection, thermographic analysis software can process thermograms to extract valuable temperature data, such as the mean temperature within specified regions of interest [1].
Behavioral issues in horses can emerge during housing, handling, riding, and/or groundwork [9]. During exercise, horses generate heat from their working muscles and, under certain conditions, this heat can accumulate in the body [10,11]. The main mechanisms for controlling body temperature are conduction, convection, radiation, and evaporation. In hot and humid environments, horses engaging in intense exercise may produce more heat than they can effectively dissipate [11]. An excess of heat, in the absence of cooling methods, can lead to exertional heat illness (EHI), causing endotoxemia, neuronal injury, and/or heat stroke [12,13]. Endotoxemia is a significant risk factor for the onset of acute laminitis in horses undergoing hospitalization for medical or surgical conditions [14]. Acute laminitis is a frequent, debilitating complication of a systemic disease in horses and may occur even after the resolution of the primary condition, often impairing the animal’s ability to perform its intended role and, in severe cases, necessitating euthanasia [12,15].
Since Persson first implemented the treadmill for equine studies, it has become an essential instrument in equine research [16]. It facilitates controlled indoor experiments under standardized conditions, allowing for the precise regulation of temperature, wind, moisture, and locomotion speed [16,17,18]. Moreover, the treadmill enables the use of advanced measurement technologies, permitting highly accurate analyses of equine gaits [19,20]. However, to establish its validity as a model for overground locomotion, it is necessary to systematically quantify potential discrepancies between treadmill and overground movement [21]. While exertional heat illness (EHI) may develop under lower ambient temperatures and during brief exercise durations, the likelihood of its occurrence markedly increases with prolonged physical exertion [13,22]. This risk is particularly pronounced in hot and humid environments, where physiological thermoregulatory mechanisms in horses become compromised [22].
Several authors have recommended methods for preventing EHI and treating laminitis, aiming to cool the extremities of horses [12,23,24]. Pollitt [25] suggested cryotherapy as a potentially effective preventive strategy for acute laminitis. Various techniques are utilized to cool equine distal limbs, including cryotherapy, ice boots, and cold therapy packs [24,26]. Although cryotherapy studies utilizing wet application methods have not reported any complications, there are case reports indicating the occurrence of cellulitis, localized tissue necrosis, and the softening of the hoof wall, particularly in horses with concurrent systemic conditions [24,27]. Horses treated with prophylactic digital cryotherapy (ICE) exhibited significantly less lameness and their histological scores were markedly improved compared to untreated feet [28]. Cryotherapy can be applied either intermittently or continuously and to either the entire body or a specific anatomical region [12]. The precise mechanisms underlying the protective effects of cryotherapy remain unclear [25,29]; however, it has been hypothesized that digital hypothermia may exert a protective effect by inducing vasoconstriction, thereby reducing the delivery of laminitis-triggering factors to the lamina in ICE-treated feet compared to untreated feet [28].
Cryotherapy is widely employed by equine veterinarians, trainers, and owners for the management of athletic injuries [25,30]. Taylor et al. [31] conducted an evaluation of the effects of immersing equine digits in 4 °C iced water for a duration of 30 min. Their findings, as demonstrated through scintigraphic imaging, revealed a significant reduction in soft tissue perfusion [31]. Kaneps et al. applied ice water immersion and cold pack application to the equine metacarpal region for 30 min, demonstrating a greater reduction in deep tissue temperature during ice water immersion compared to cold pack application [10]. Whole-body and partial-body cryotherapy (WBC and PBC), which involve exposure to extremely low temperatures (below −100 °C), are commonly used for treating patients with rheumatic and inflammatory conditions. Additionally, these therapies are applied to healthy individuals, particularly elite athletes, for cryostimulation [32]. They are primarily used during training seasons to aid recovery, prevent injuries, and reduce stress-related lesions [27,32].
The application of cold to living tissue induces three major local effects: analgesia, hypometabolism, and a vascular response [12]. Cold directly affects peripheral nerves by reducing conduction velocity, raising the stimulation threshold, and prolonging the refractory period following stimulation [33]. The profound hypometabolic effect of cryotherapy is considered to be the primary mechanism by which cold reduces the severity of injury, as lower tissue metabolic rate and oxygen consumption enhance cell survival during ischemia and protect surrounding tissues from secondary hypoxic damage [34]. Cryotherapy induces potent local vasoconstriction, primarily mediated by sympathetic nervous control, with a direct constrictive effect on blood vessel walls at lower temperatures, leading to a significant reduction in blood flow velocity and a marked decrease in local perfusion [35].
The objective of this study was to compare local temperature changes and assess the thermal patterns in the metacarpal region and coronary area of horses following the application of an ice boot pack.
We hypothesized that the application of the ice boot pack would lead to significant changes in the local temperature and thermal patterns of the metacarpal and coronary regions, resulting in a reduction in local temperature and changes in the thermal patterns.

2. Materials and Methods

2.1. Animal

A 4-year-old Warmblood mare, weighing 568 kg and measuring 166 cm at the withers, was enrolled in this study. The mare was housed in an individual stall throughout the experimental period. During the study, she was provided with lucerne hay, divided into three meals per day, with water available ad libitum. The inclusion criteria for the study were: no lameness in the past three months, a negative orthopedic examination, and no administration of anti-inflammatory drugs in the past month. The clinical and orthopedic evaluations were conducted by a veterinarian with 12 years of experience in equine practice, both before and throughout the study, confirming that the mare was clinically healthy. Rectal temperature was measured at the start of each day, with values recorded between 37 °C and 38 °C. After training, the temperature increased to between 38.7 °C and 39.5 °C.

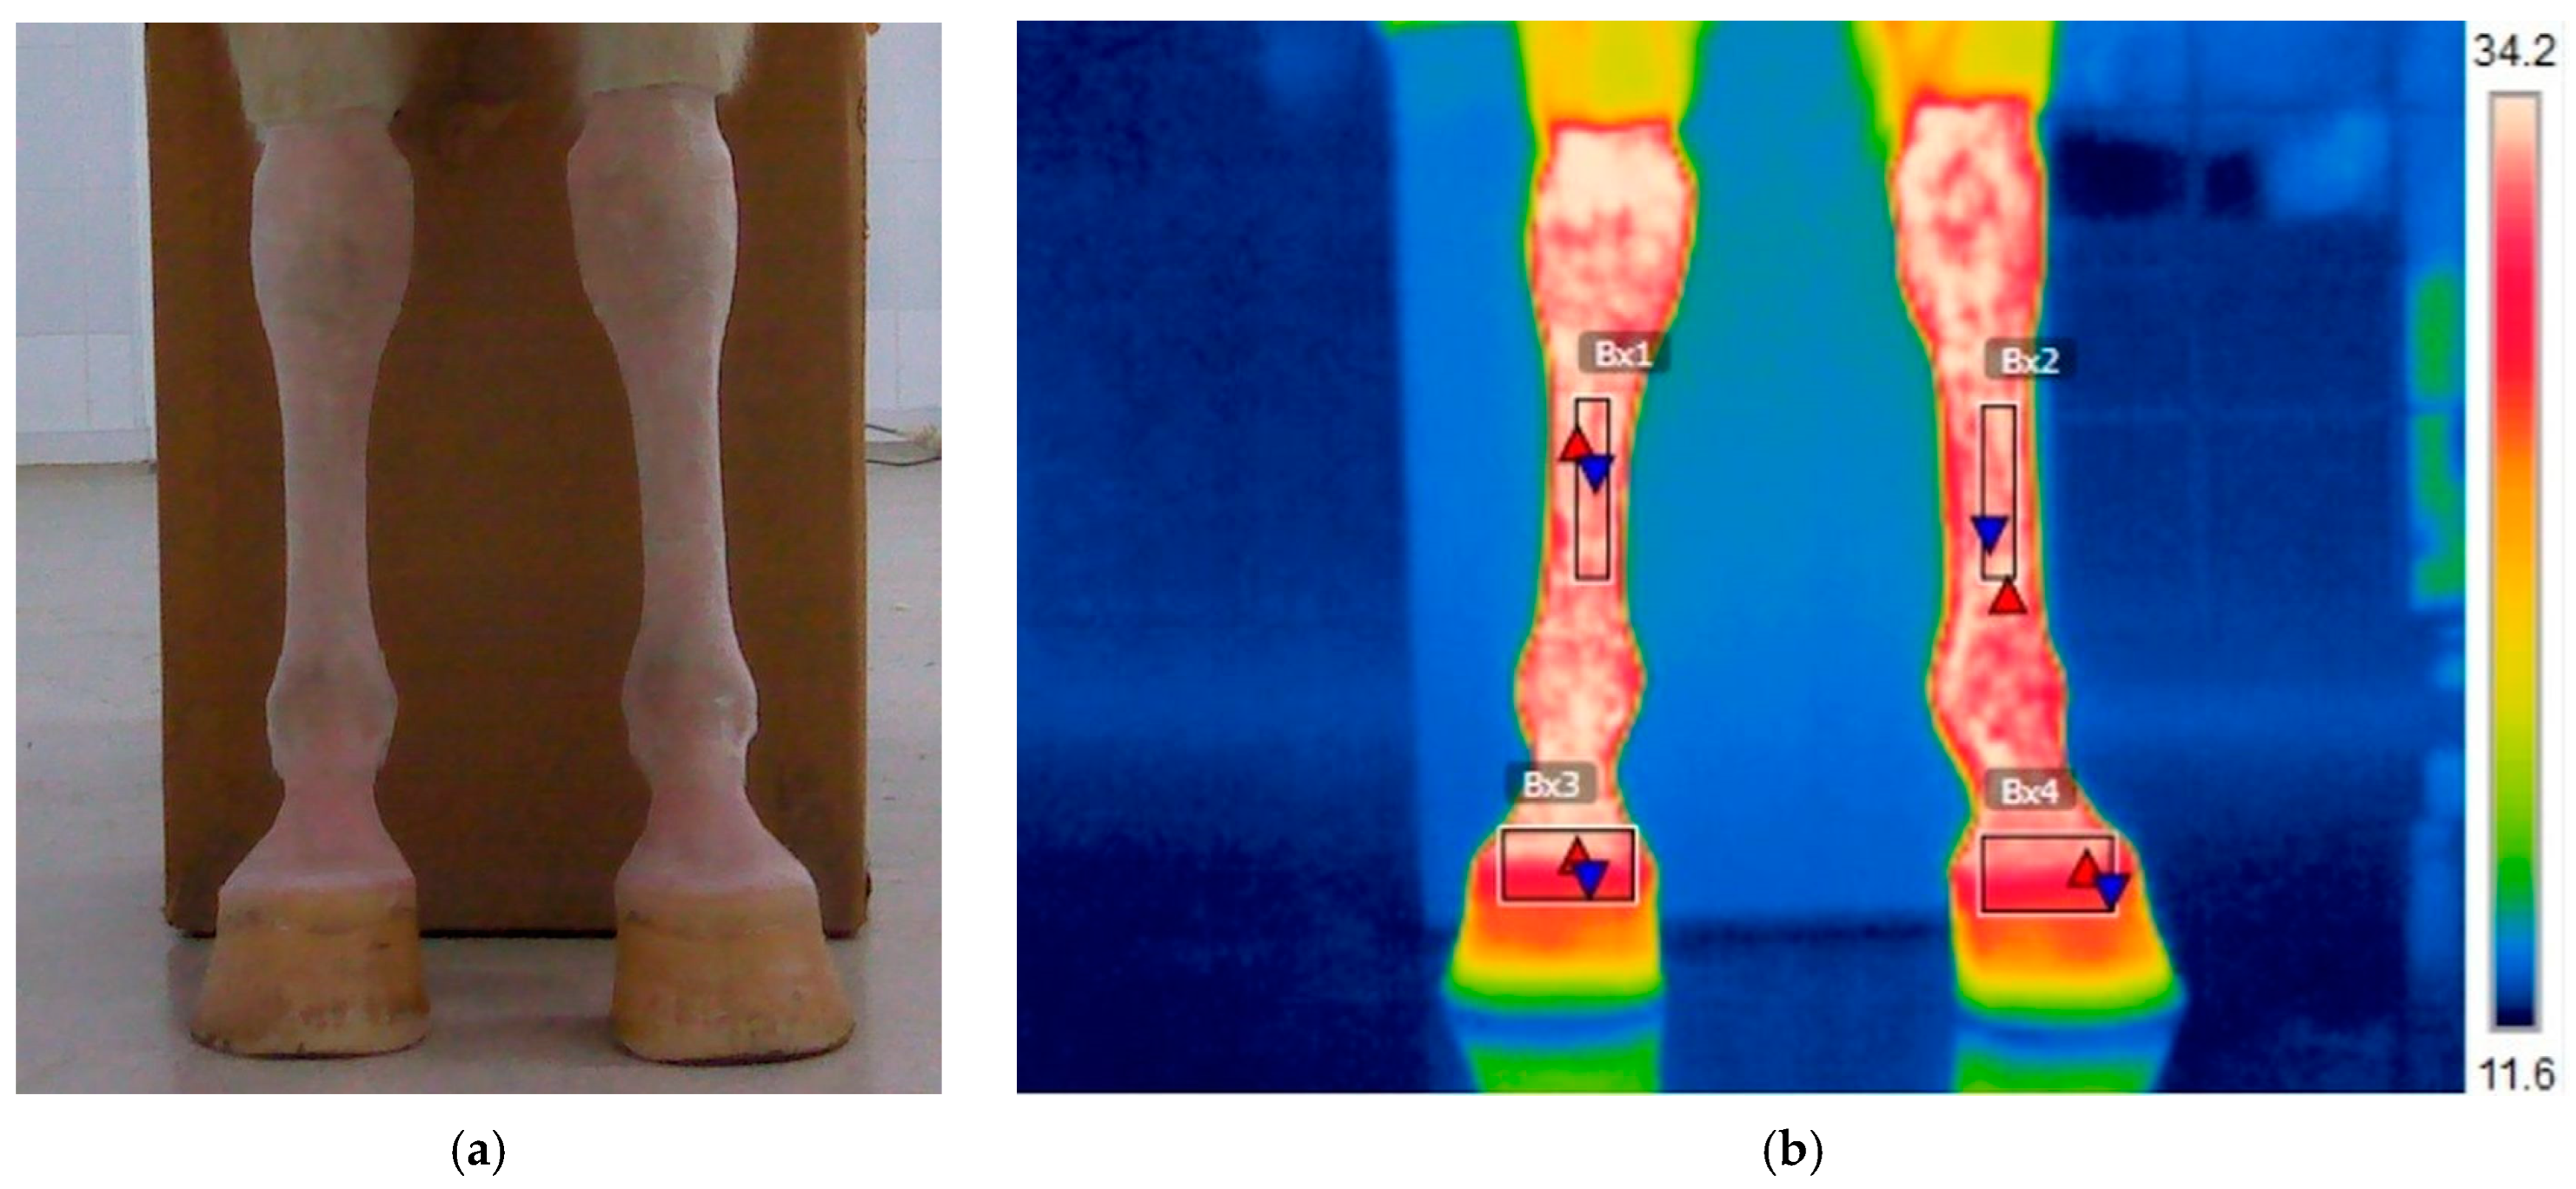
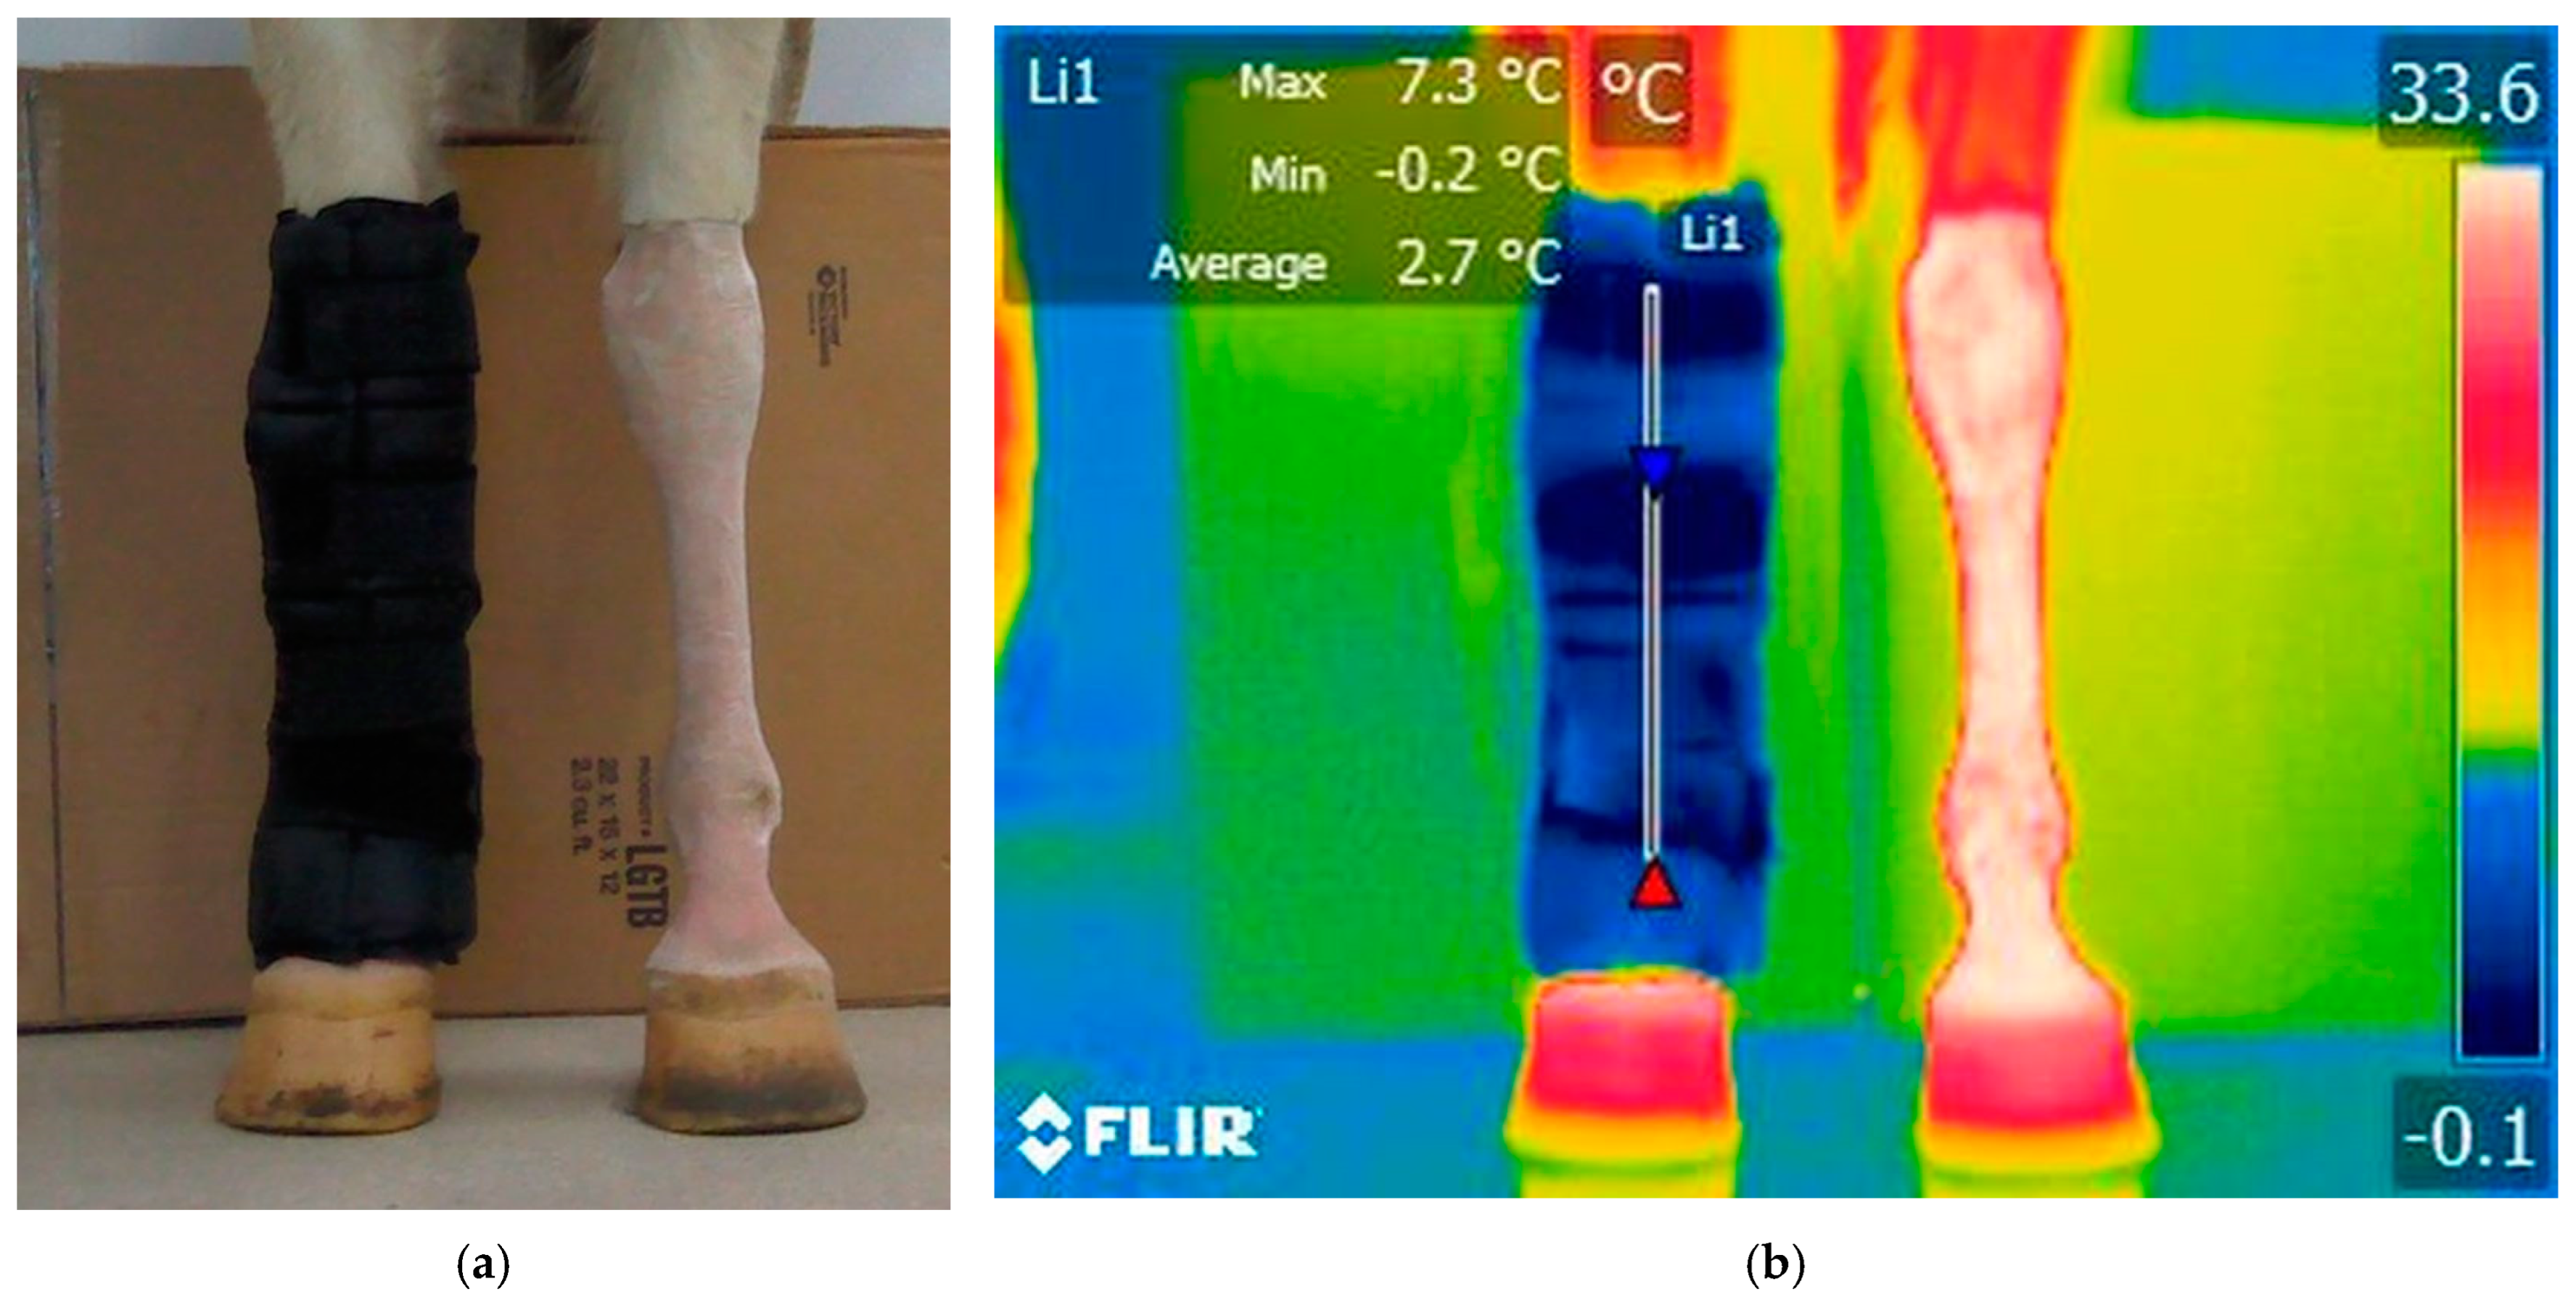
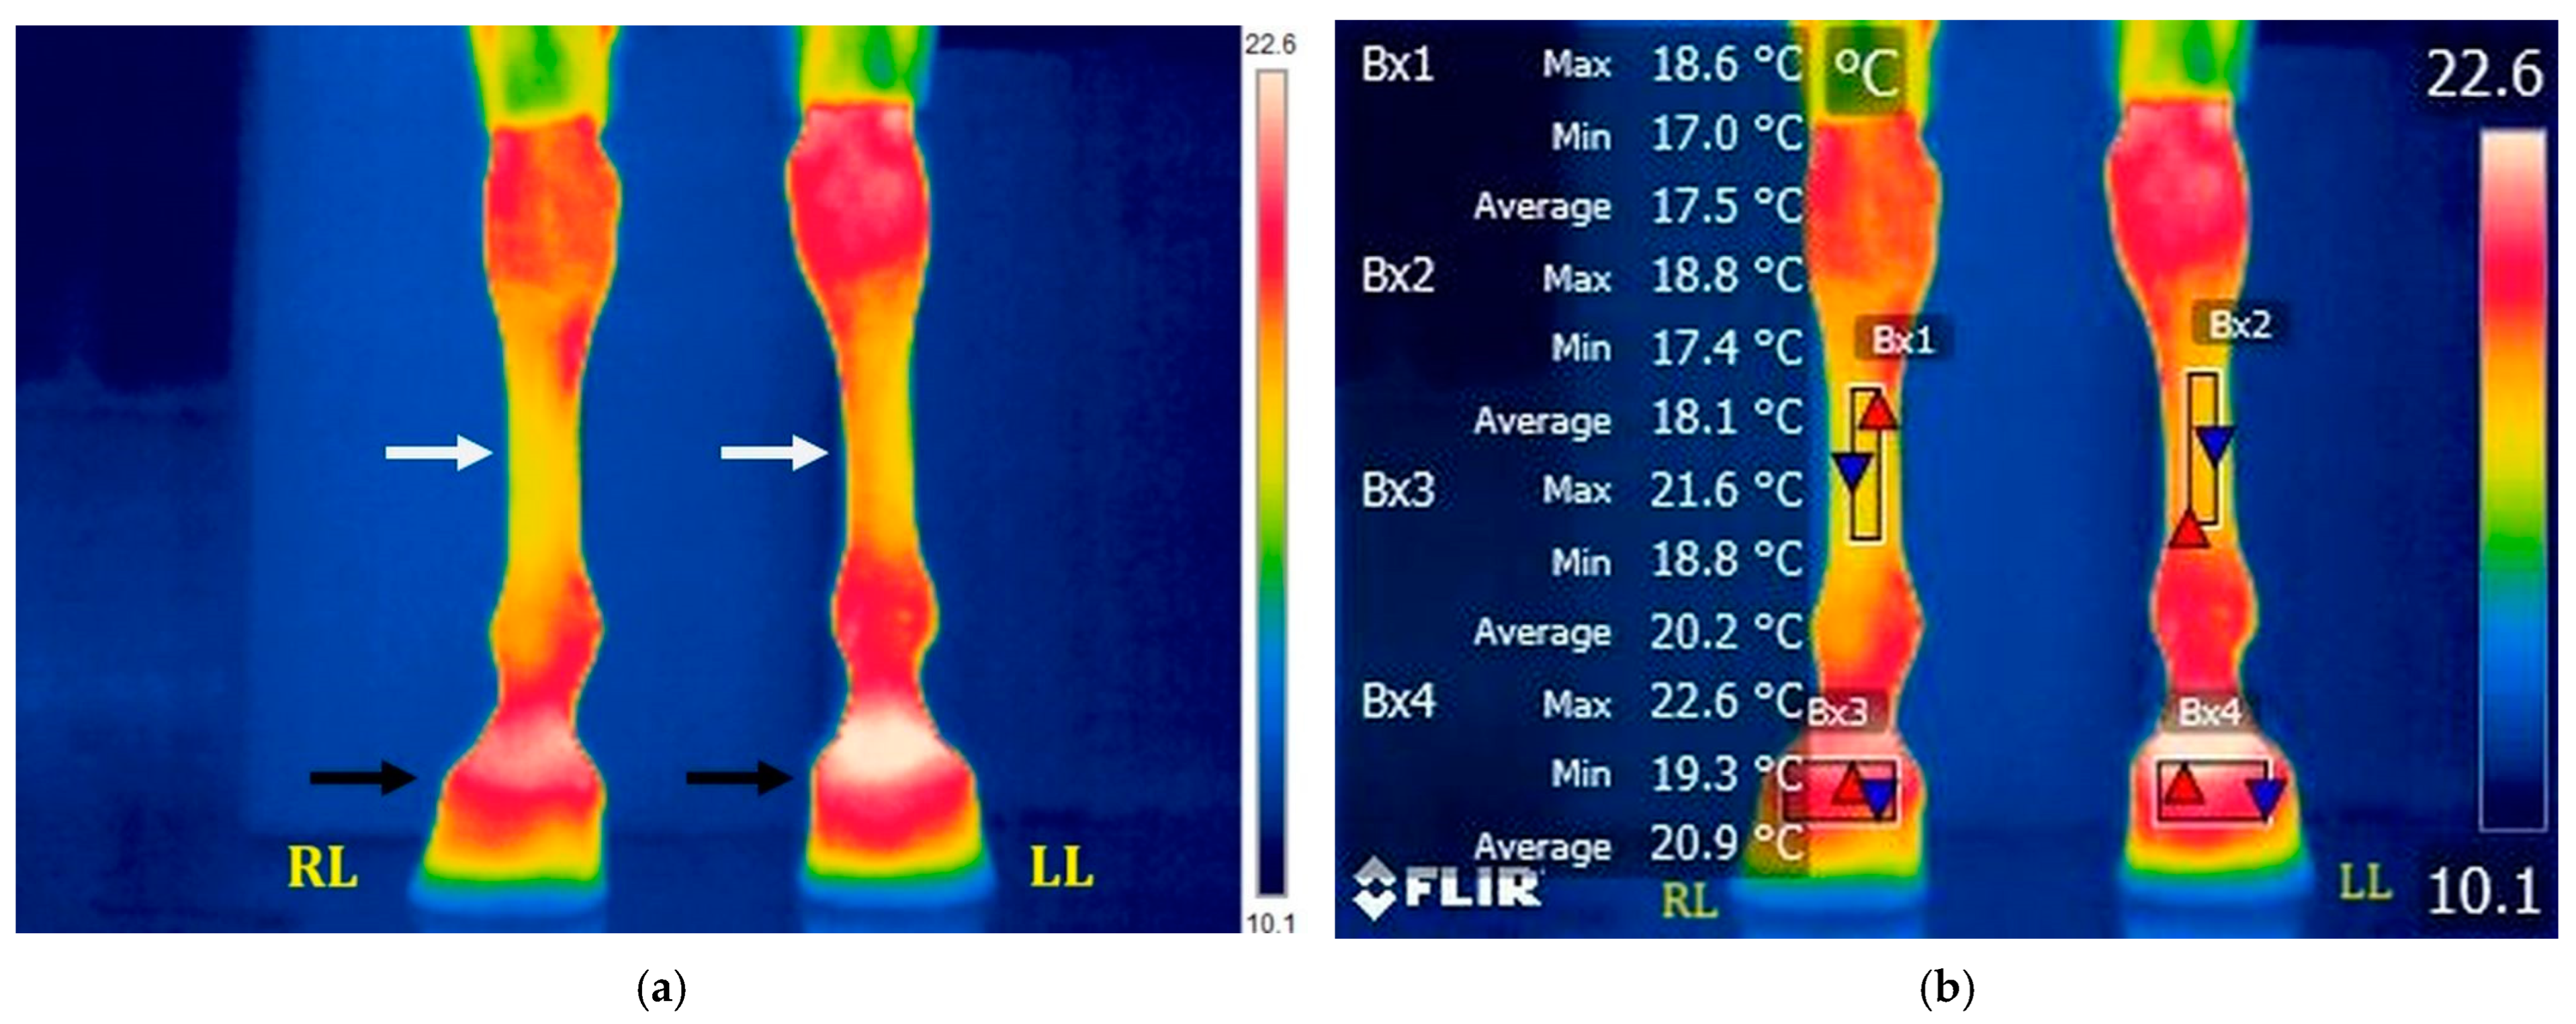
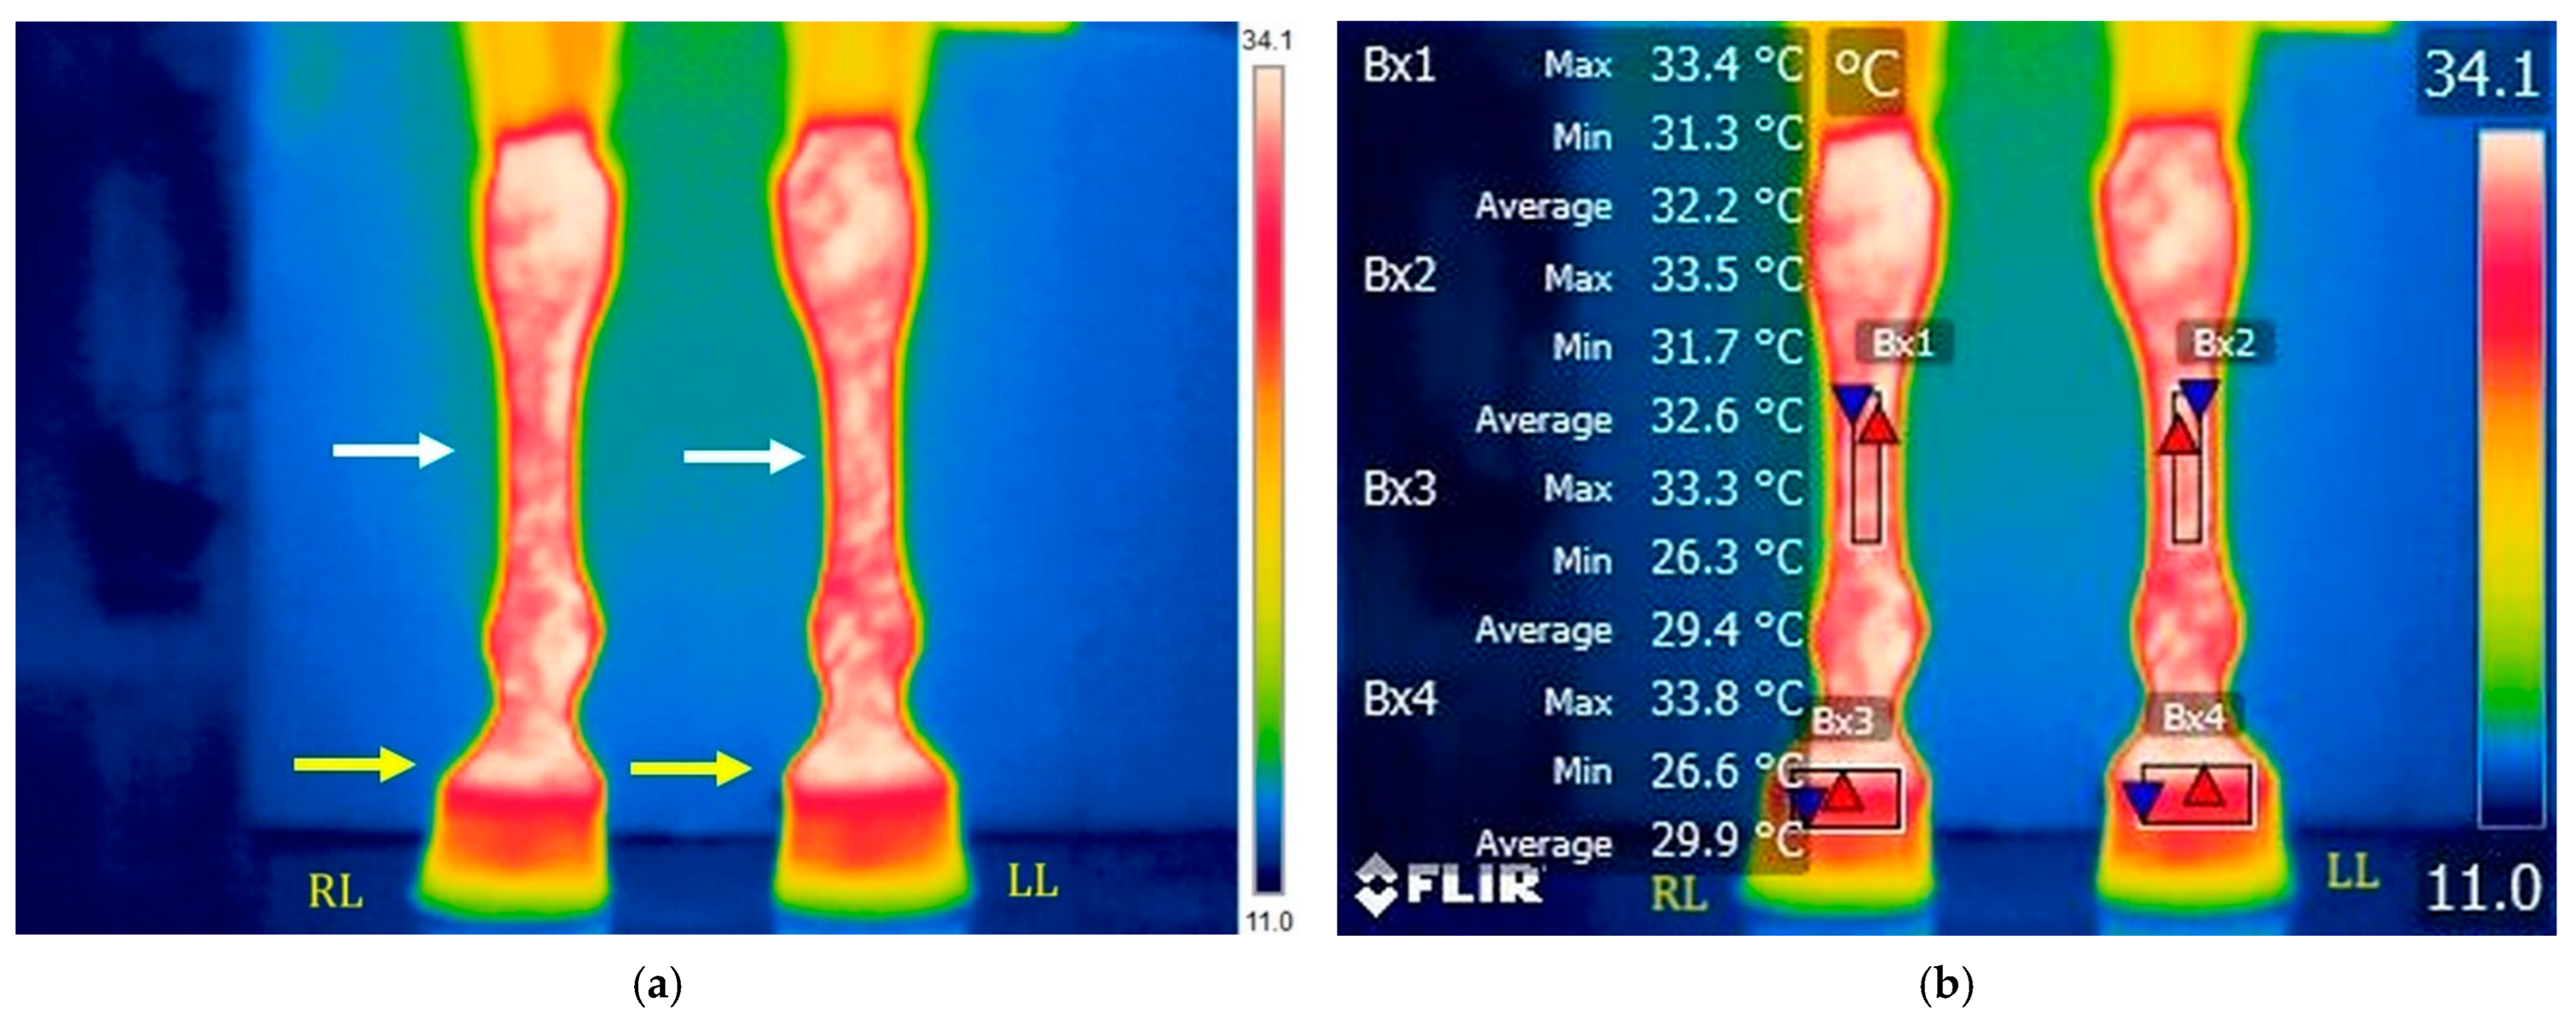
2.2. Thermal Imaging and Data Recording

We assessed the local temperature of the metacarpal and coronary regions of the hoof in a healthy horse over 8 days, considering a fixed training protocol and limb cooling using an ice boot pack. The training protocol involved exercising the horse on a Haiko treadmill 5000 (Loimaa, Finland). Prior to the training period, the horse was habituated to the protocol over 5 days. Additionally, the same person handled the horse both on the treadmill and during the thermographic measurements. The treadmill exercise involved walking at 1.2 m/s for 5 min, followed by an increase in speed to 2 m/s for another 5 min, then trotting at 4 m/s [36,37] for 20 min, and finally returning to walking at 1.25 m/s for 5 min (Video S1). After each training session, thermographic measurements of the thoracic limbs were taken. The same procedures were followed consistently throughout the 8-day study period.
Thermographic measurements of the thoracic limbs were recorded to analyze temperature differences before and after training, as well as before and after applying a cooling method to the right thoracic limb. The thermographic measurements were taken before training (T1), immediately after training (T2), after applying the cooling method (T3), and at 10 min (T4), 20 min (T5), and 30 min (T6) post-application. The areas of interest for the right thoracic limb were Bx1 and Bx3, while for the left thoracic limb, they were Bx2 and Bx4 (Figure 1a,b). All thermographic measurements were performed indoors. To assess the effectiveness of the cooling method and the associated changes in temperature and thermal patterns, the right limb was designated as the study limb, to which an ice boot pack was applied at T3, while the contralateral limb served as the control. The ice boot pack was applied for 20 min and had a mean temperature of 3.8 °C (ranging from −0.4 °C to 7.5 °C) at the time of application (Figure 2a,b).
Before the study began, the horse’s hair was clipped, starting dorsally from the carpal joint region down to the hoof. Both during the habituation period preceding the study and throughout the study, the training sessions and thermographic measurements were conducted between 9 a.m. and 2 p.m. Each training day started with a one-hour habituation period in the treadmill room, during which indoor conditions were maintained with a temperature of 21–22 °C, humidity between 70 and 75%, and no air currents. The air temperature, humidity, and air currents were measured using the Testo 435 device (Testo, Titisee-Neustadt, Germany). The thermographic images were captured by the same non-blinded operator, who positioned themselves in front of the horse, holding the FLIR E50 thermography device (East Sussex, UK) 1 m away from the horse and at a 90° angle to the thoracic limbs (Figure 1a,b). On the thermal images, the color palette indicates the following: white represents the highest temperature, red represents a moderate temperature, yellow indicates a low temperature value, and blue represents the lowest temperature value. The thermographic images were captured using the FLIR E50 thermography device (FLIR Systems Inc., Wilsonville, OR, USA) with the following settings: 0.95 emissivity and a resolution of 240 × 180 for each image. The temperature range was set from −20 °C to 650 °C, with a sensitivity of ≤0.05 °C. A cardboard box was placed 20 cm from the thoracic limbs, under the abdomen, to minimize interference with the thermographic imaging of the pelvic limbs.
After obtaining the thermographic images, they were processed and interpreted by the same non-blinded operator using FLIR Tools software v6.4.18039.1003 for image analysis. To interpret the thermographic images, two triangles measuring 100 × 30 pixels with a vertical orientation, labeled Bx1 for the right limb and Bx2 for the left limb, were positioned at the midpoint of the metacarpus. Additionally, two more triangles measuring 80 × 20 pixels with a horizontal orientation, labeled Bx3 for the right limb and Bx4 for the left limb, were placed in the coronary region of the hoof (Figure 1b). In each rectangle formed, the interpretation software identified the minimum and maximum temperatures and calculated the average temperature for the entire surface.

2.3. Statistical Analysis

To assess the evolution of temperature at the six time points (T1–T6), the Kruskal–Wallis test was used in conjunction with pairwise two-sided multiple comparison analysis (Dwass–Steel–Critchlow–Fligner method). The analysis was performed using the SAS Studio application 3.8. The Kruskal–Wallis test was applied sequentially to each analyzed area (Bx1–Bx4) and the non-parametric Mann–Whitney U-test was applied for T1–T6 time comparisons. Each group corresponding to a specific time point included 8 repetitions, representing the values recorded at the same time point over the 8 different days. Comparisons were made between the mean temperatures recorded during the 8-day period for each area. The comparison element for the evolution of temperature over the six time points was the mean of the average temperature values, referred to as m.a.t.v.

3. Results

The horse adapted well to the treadmill, and no incidents were reported during the study. Both during the acclimatization period and throughout the 8 days of study, the mare exhibited no lameness or signs of discomfort. The ice boot pack was well tolerated by the mare, and no dermatitis, tissue necrosis, cellulitis, or other issues were observed during the study. Sweating did not appear to play a significant role in heat loss at high ambient temperatures and humidity, and no impacts of sweating on the thermograms obtained in this study were observed. The intrarectal temperature before exercise ranged from 37.0 °C to 37.7 °C and increased to 37.8 °C to 39.6 °C after treadmill exercise.

3.1. Thermography Before Applying Ice Boot Pack

3.1.1. T1: Before Training on the Treadmill

A higher temperature was observed in the thermographic image of the coronary region (represented by the white area). In the mid-metacarpal region, the temperature was uniform and lower (represented by the yellow areas; Figure 3a). The m.a.t.v. was 17.99 ± 0.10 °C for Bx1, 17.99 ± 0.10 °C for Bx2, 21.48 ± 0.24 °C for Bx3, and 18.55 ± 0.30 °C for Bx4 (Figure 3b, Tables S1 and S2).

3.1.2. T2: After Training on the Treadmill

After training, the skin surface temperature increased by more than 10 °C and higher temperature values, indicated by the white color, were observed in the middle metacarpal and coronary band regions (Figure 4a). The thermal pattern of the limbs changed in shape, with an increase in white coloring across the entire skin surface compared to the thermal pattern in T1, where the middle metacarpal region appeared yellow and the coronary band showed red and white coloring (Figure 4a).
The m.a.t.v. was 32.57 ± 0.20 °C for Bx1, 32.28 ± 0.14 °C for Bx2, 28.55 ± 0.19 °C for Bx3, and 28.70 ± 0.26 °C for Bx4 (Figure 3b, Tables S1 and S2).

3.2. Thermography After Applying Ice Boot Pack

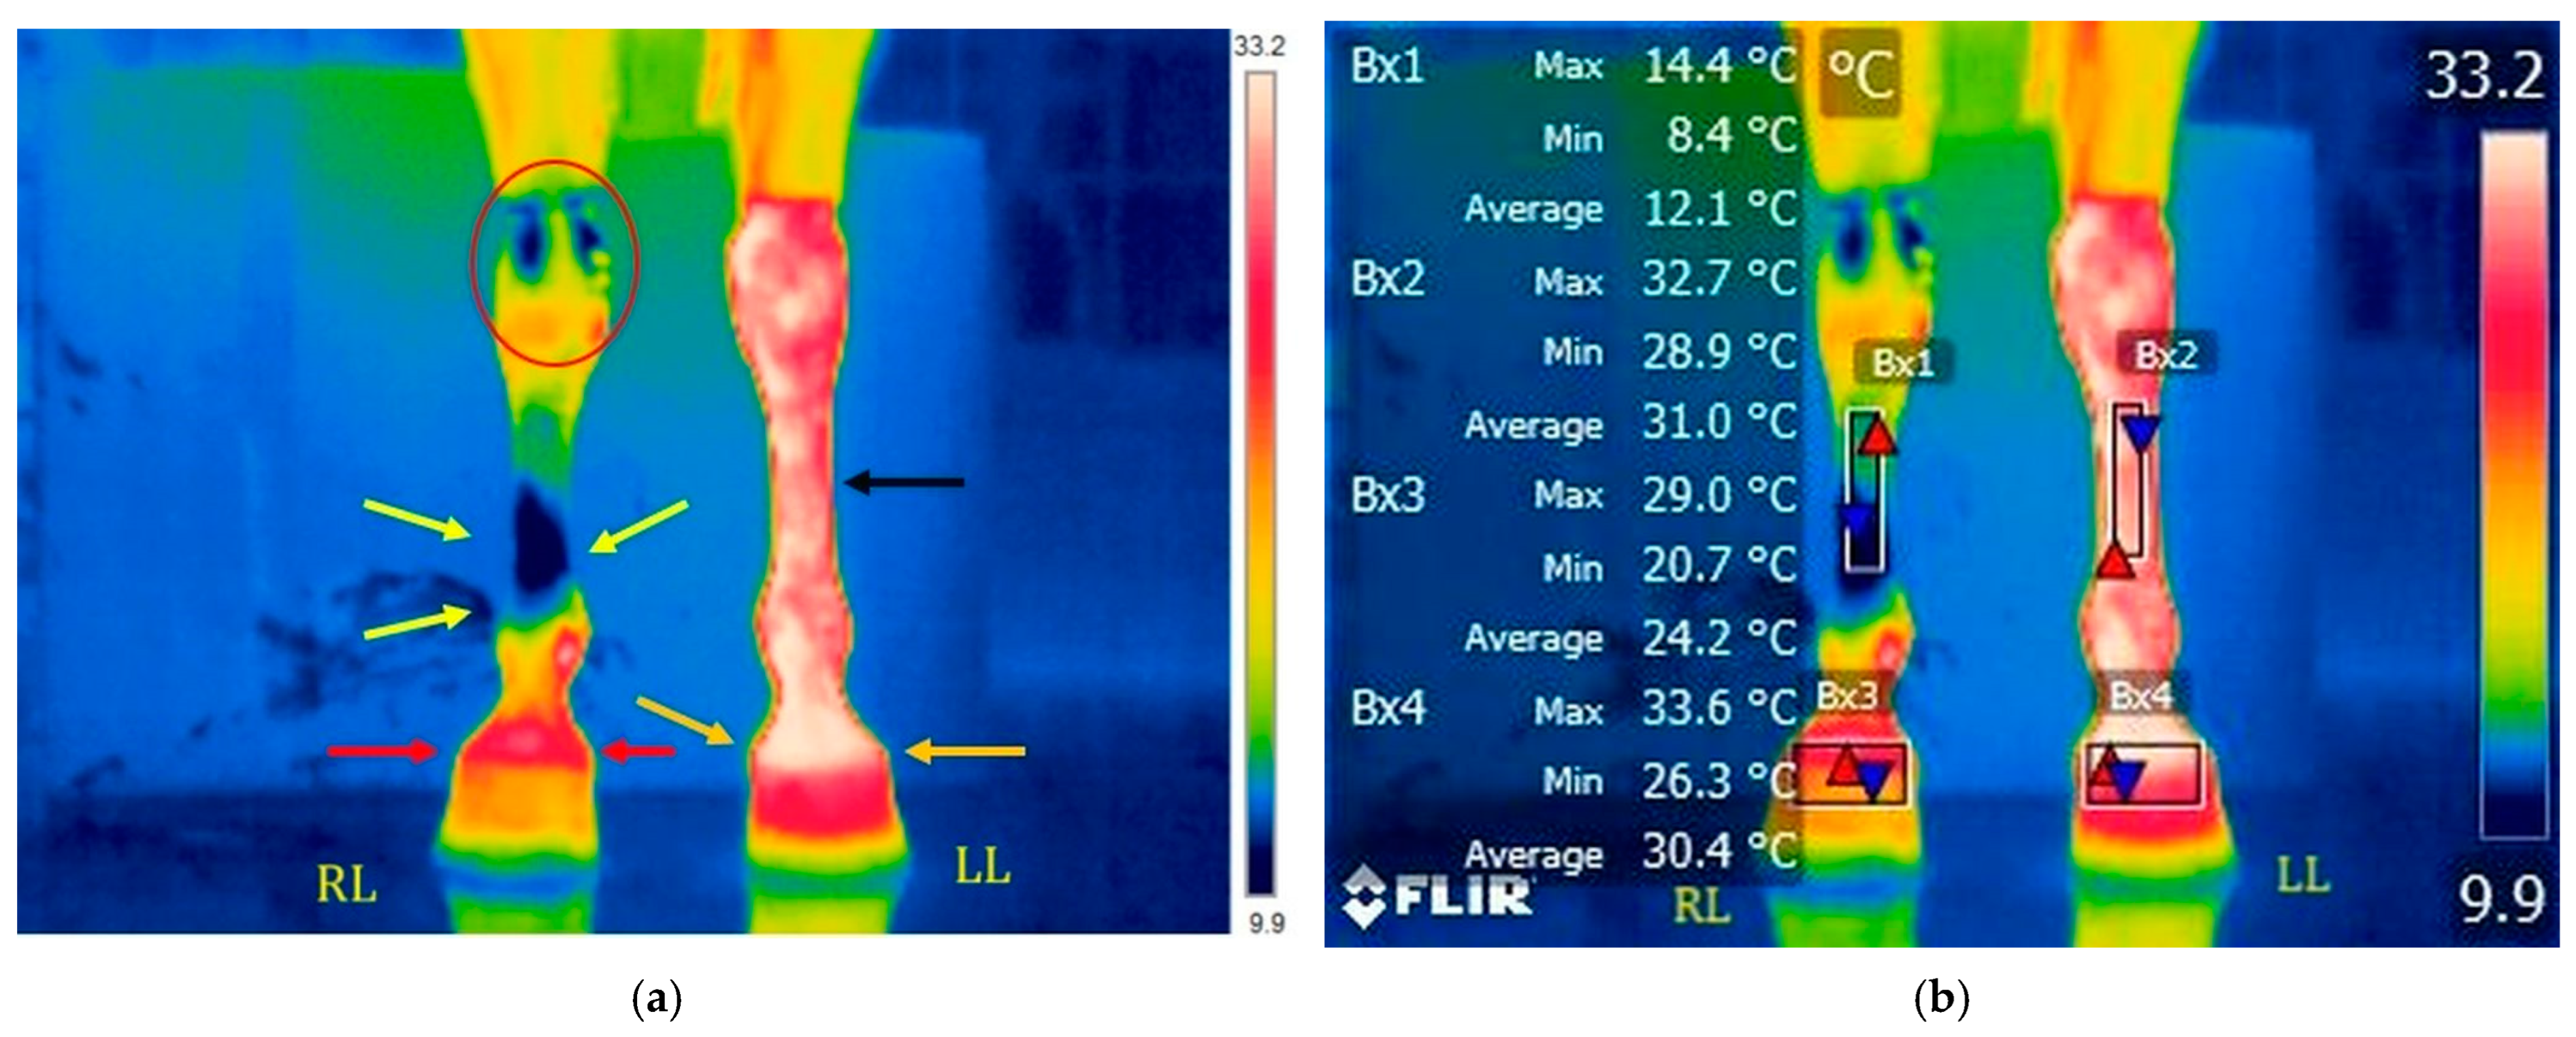
3.2.1. T3: Immediately After Ice Boot Treatment (Right Limb) and 20 Min After Treadmill Exercise (Left Limb)

The skin surface’s reaction to the ice boot pack showed differences in the thermal patterns between the right and left limbs, with a circumscribed area marked in blue at the middle of the right metacarpus (yellow arrows, Figure 5a), indicating a cold area. In the study, limb, the temperature in the middle metacarpal area decreased by 20 °C. Additionally, the coronary band also showed differences, with a decreased temperature marked in red (Figure 5a). In the contralateral limb 20 min after training, the thermal pattern still showed red and white regions in the metacarpal and coronary band areas, indicating higher temperature values.
The differences in temperature between the areas of interest in the right and left limbs were more than 15 °C (Figure 5b). The m.a.t.v. was 12.3 ± 0.09 °C for Bx1, 30.50 ± 0.10 °C for Bx2, 24.58 ± 0.16 °C for Bx3, and 29.86 ± 0.26 °C for Bx4 (Figure 5b, Tables S1 and S2).

3.2.2. T4: 10 Min After Ice Boot Pack Treatment (Right Limb) and 30 Min After Treadmill Exercise (Left Limb)

Ten minutes after removing the ice boot pack, a modification in the thermal pattern and an increase in local skin temperature were observed. In the middle of the metacarpal region, the blue-colored area decreased in size, while in the coronary region, red and white coloring appeared, indicating an increase in temperature (Figure 6a). Additionally, the color difference between the hoof walls of the left and right limbs persisted, with the left limb displaying a red and yellow color, which signified a significantly lower temperature compared to the same area of the contralateral limb (Figure 6a). In the contralateral limb, where the ice boot pack was not applied, the temperature remained high and the thermal pattern showed a mix of red and white colors in the middle of the metacarpal region (Figure 6a).
The m.a.t.v. was 14.14 ± 0.10 °C for Bx1, 29.04 ± 0.20 °C for Bx2, 26.33 ± 0.15 °C for Bx3, and 28.98 ± 0.23 °C for Bx4 (Figure 6b, Tables S1 and S2).

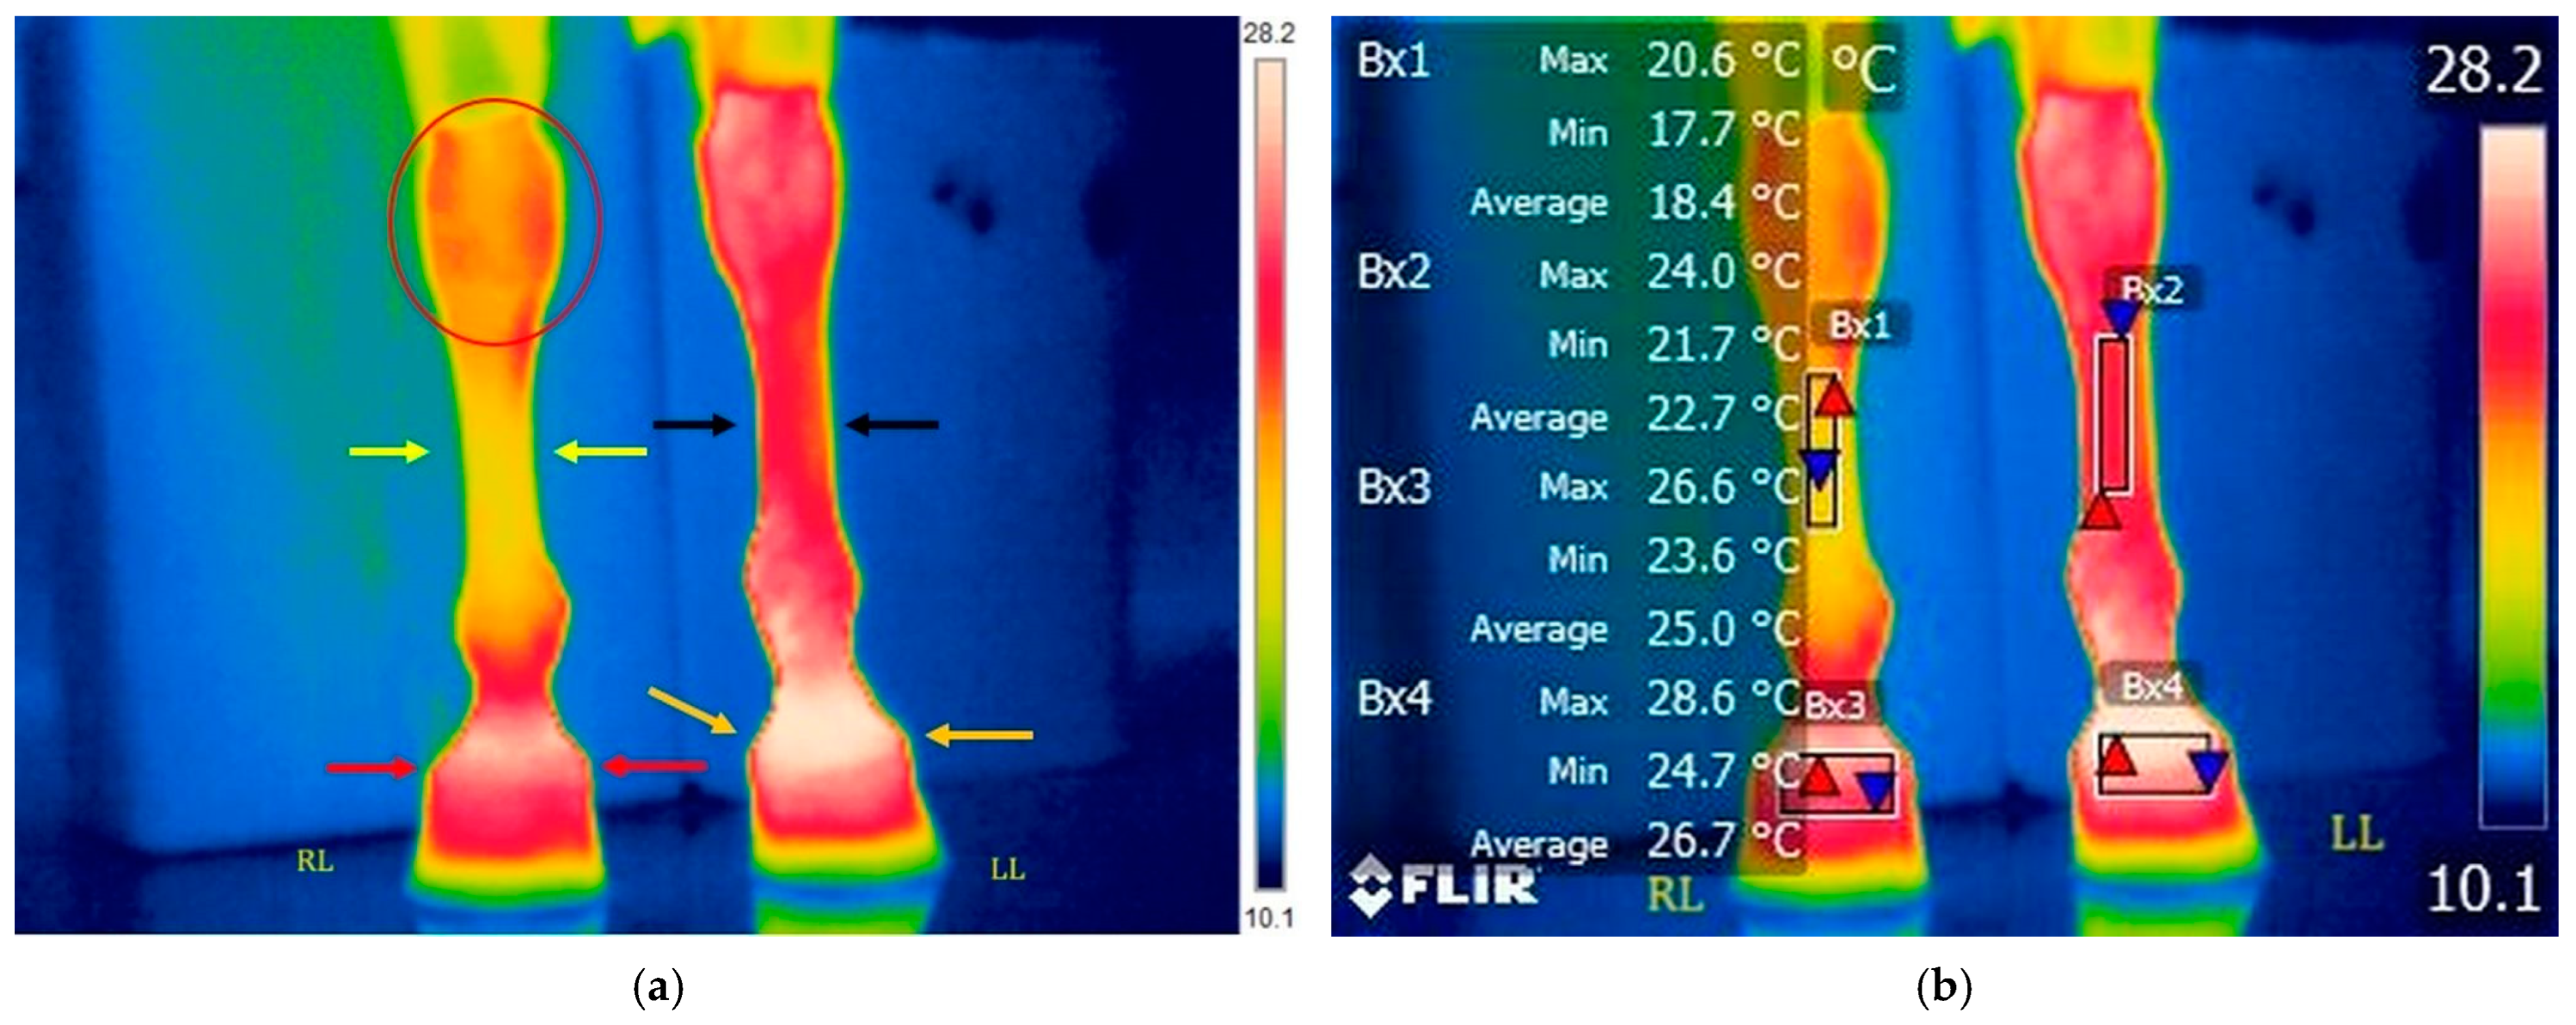
3.2.3. T5: 20 Min After Ice Boot Pack Treatment (Right Limb) and 40 Min After Treadmill Exercise (Left Limb)

Twenty minutes after the removal of the ice boot pack, the thermal pattern of the limb changed in color and an increase in skin temperature was observed. In the middle of the metacarpal region, only yellow coloring was visible on the thermal image while, in the coronary region, areas alternated between red and white (Figure 7a). Additionally, the local temperature increased in the carpal region, with a mix of red and yellow coloring, and in the hoof wall region, where a more pronounced red color was observed compared to the same region at T4 (Figure 7a). In the opposite limb, over time, the local temperature decreased, with changes in the thermal pattern (Figure 6a). The carpal joint and middle metacarpal regions showed only red coloring, representing a moderate temperature, while the coronary region showed an intense white color, indicating an increased temperature (Figure 7a).
The m.a.t.v. was 18.21 ± 0.09 °C for Bx1, 23.41 ± 0.17 °C for Bx2, 24.53 ± 0.41 °C for Bx3, and 26.24 ± 0.15 °C for Bx4 (Figure 7b, Tables S1 and S2).

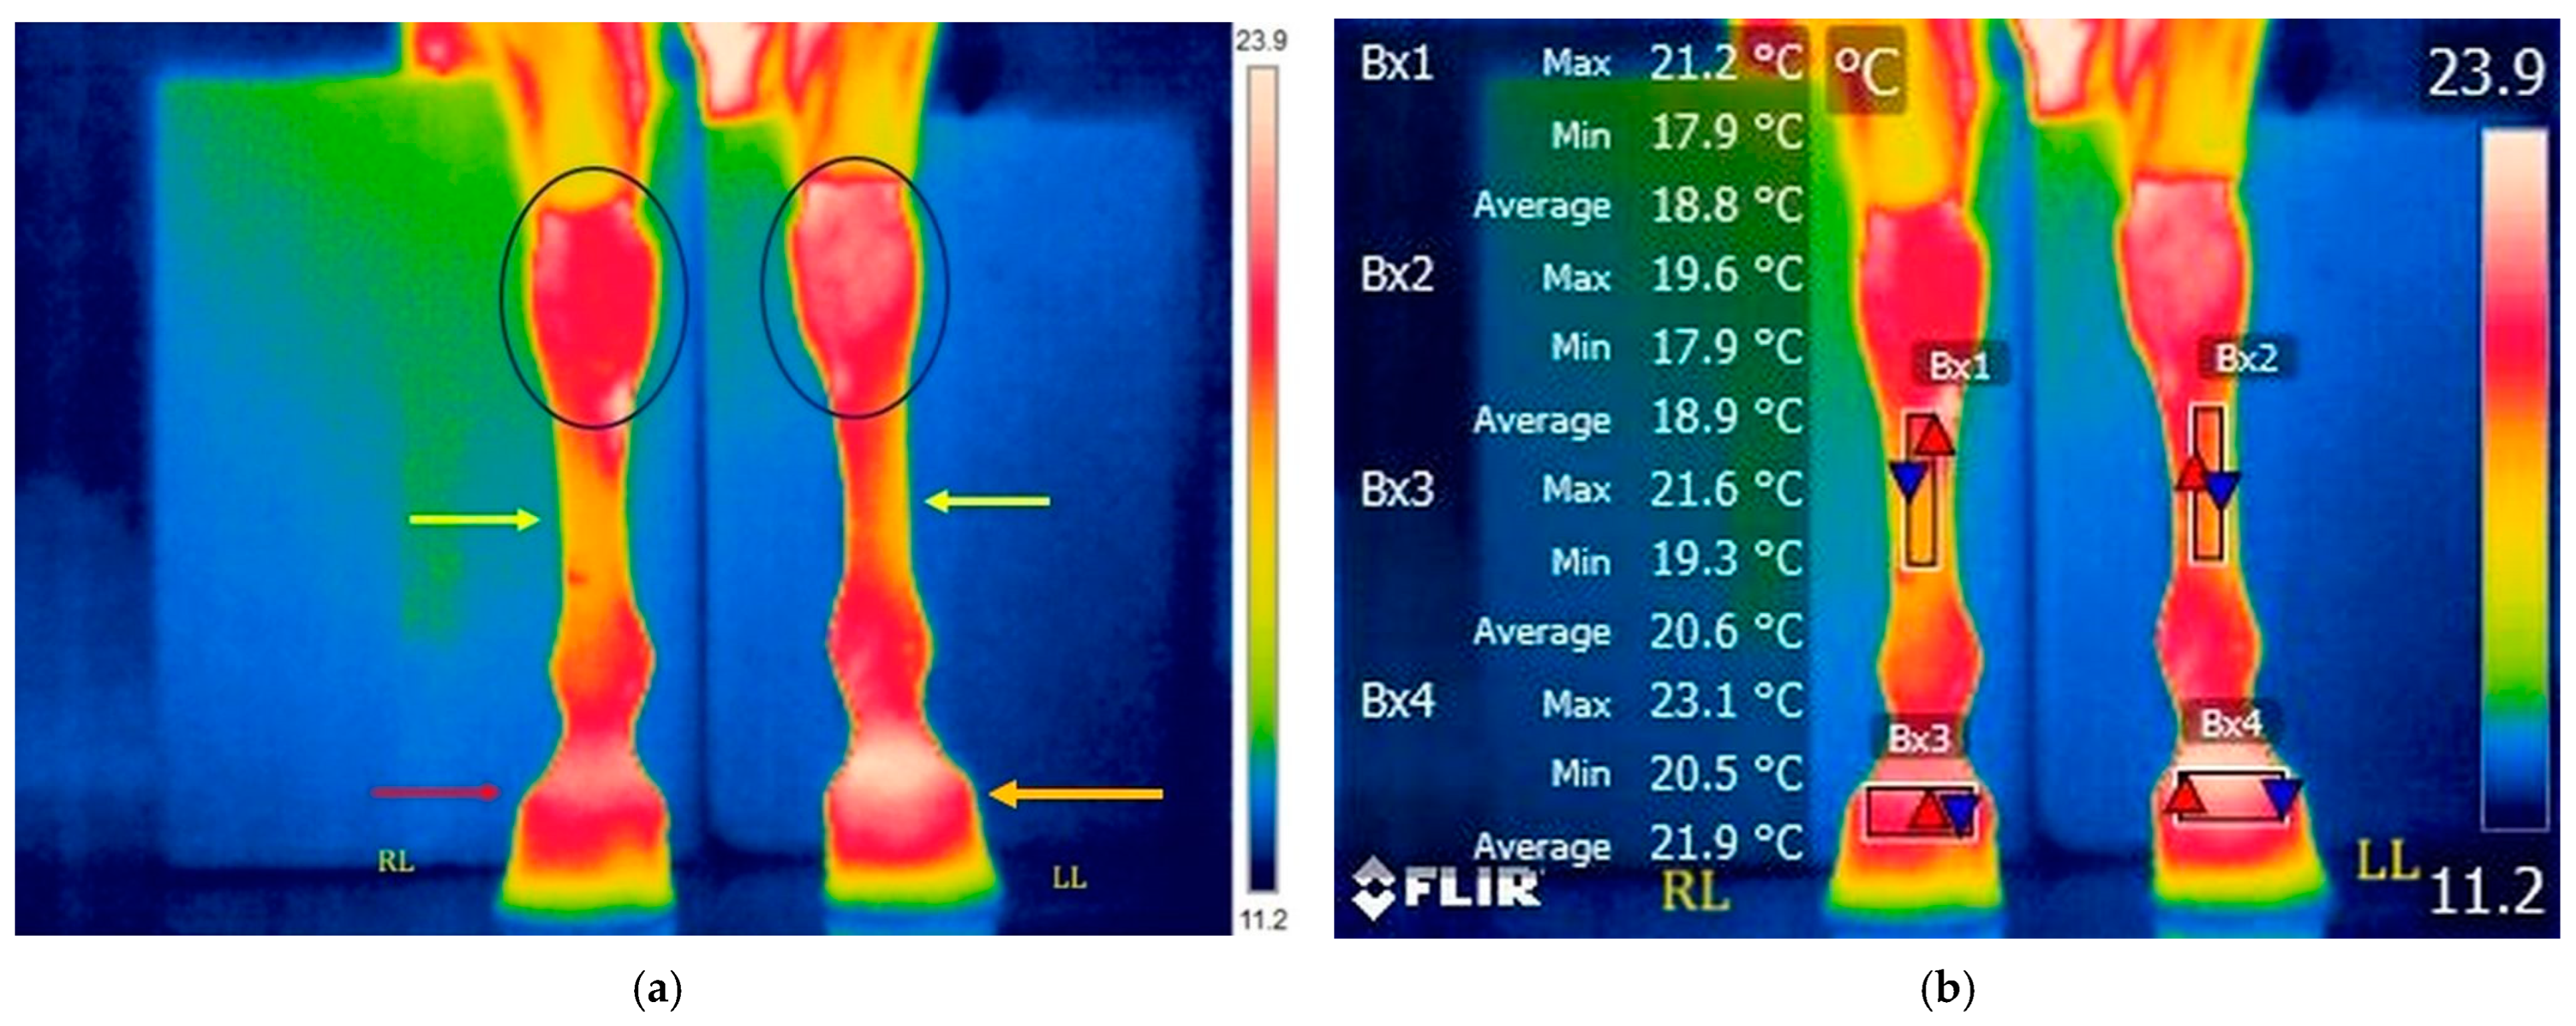
3.2.4. T6: 30 Min After Ice Boot Pack Treatment (Right Limb) and 50 Min After Treadmill Exercise (Left Limb)

Thirty minutes after removing the ice boot pack treatment, the temperature increased in the coronary band and in the middle of the metacarpus, with a change in the thermal pattern compared to T5 (Figure 7a and Figure 8a). In the metacarpal area, red coloring began to appear and in the coronary band area, white coloring appeared, indicating an increase in temperature in these regions. Additionally, the temperature in the carpal area increased and became similar to the same area in the contralateral limb (Figure 8a). The temperature of the hoof wall increased and the thermal pattern appeared red, indicating a rise in temperature value. In the contralateral limb, the temperatures in the middle of the metacarpus and coronary band decreased compared to the same areas at T2–T5 (Figure 4a, Figure 5a, Figure 6a, Figure 7a and Figure 8a). The temperature in the hoof wall reduced and the color turned redder compared to the same area at T5, showing a different thermal pattern.
The m.a.t.v. was 19.40 ± 0.18 °C for Bx1, 18.66 ± 0.08 °C for Bx2, 20.71 ± 0.30 °C for Bx3, and 21.31 ± 0.15 °C for Bx4 (Figure 8b, Tables S1 and S2).

3.3. Temperature Evolution at Diferent Time Periods (T1–T6)

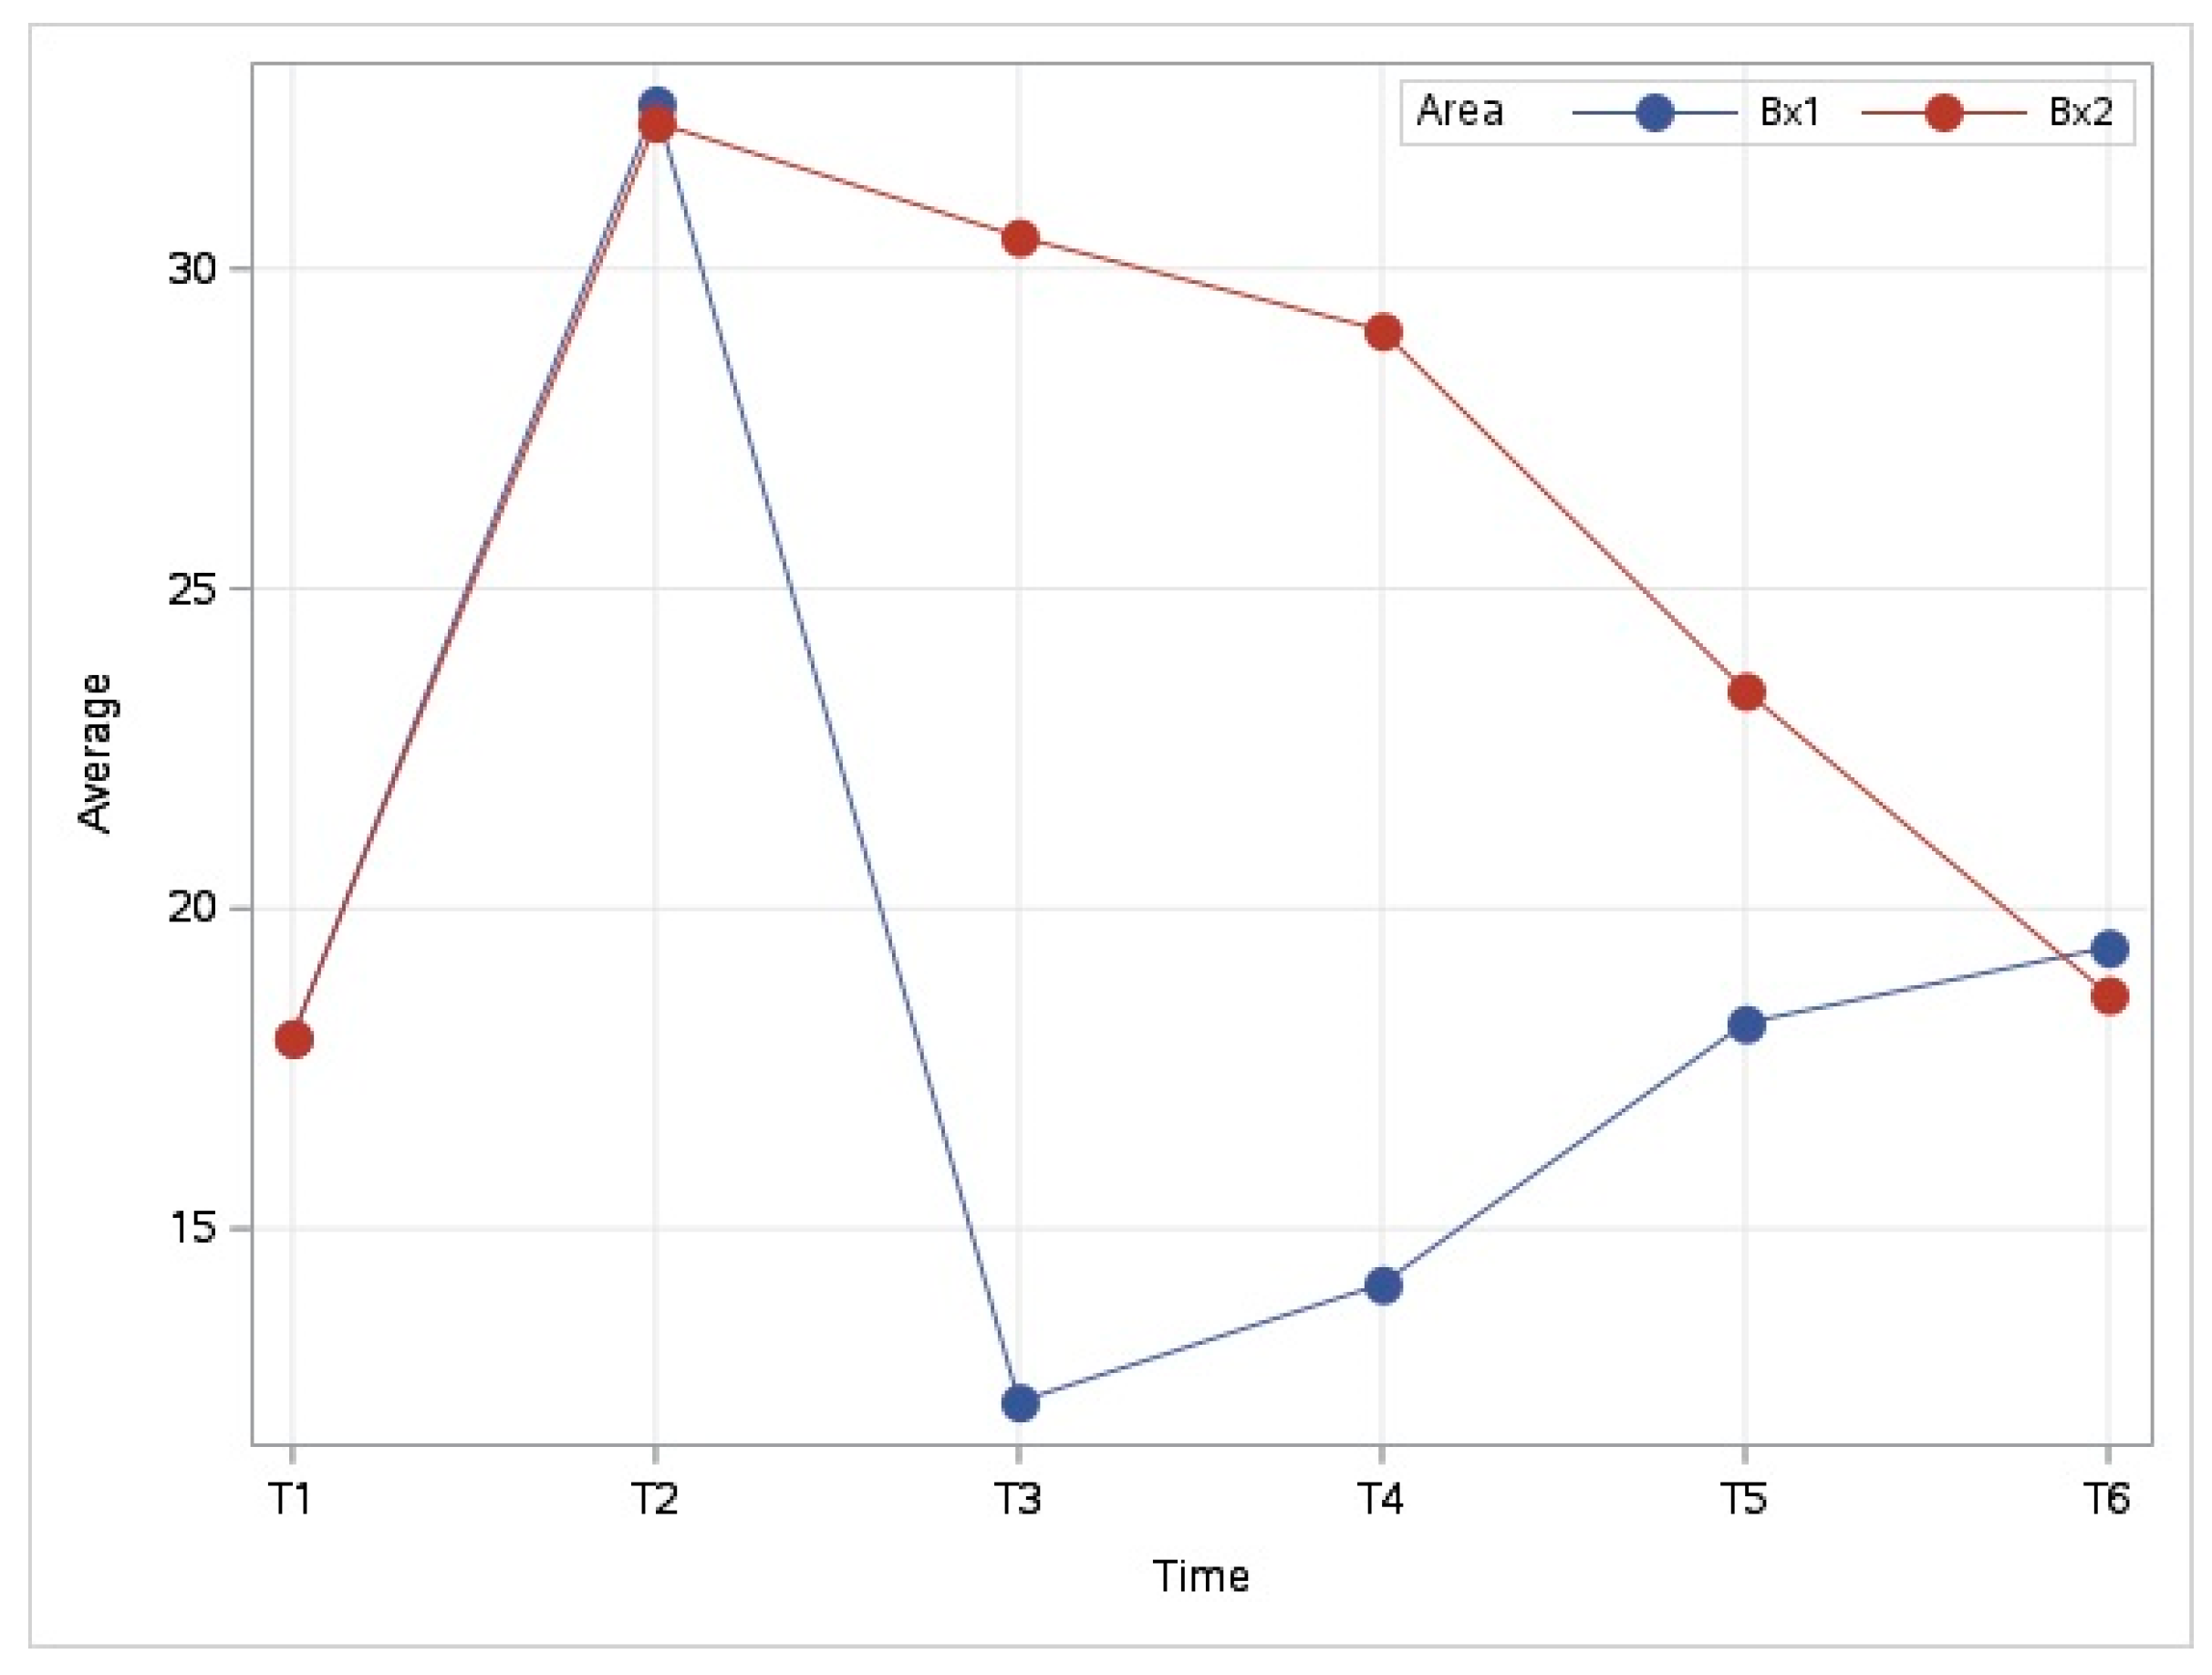
3.3.1. Evolution of Temperature in the Middle of the Metacarpal Area (Bx1–Bx2)

For both limbs, the temperature started from a mean value of 17.99 ± 0.10 °C in Bx1 and Bx2 and increased to 32.58 ± 0.20 °C in Bx1 and 32.29 ± 0.14 °C in Bx2 after training (Figure 9). After 20 min of ice boot treatment applied to the right limb, the temperature in the Bx1 area decreased significantly (Z = 3.376; p = 0.001) by 20.27 ± 0.22 °C to 12.30 ± 0.09 °C at T3. Subsequently, at T4, T5, and T6, the temperature increased to 19.40 ± 0.10 °C. In the contralateral limb (control; Bx2 area), after training, the local temperature decreased at T3, T4, T5, and T6 to a value of 18.66 ± 0.08 °C. In both cases (Figure 9), the temperature values after training and ice boot treatment began to approach the temperature observed at T1. However, although small, the differences (1.41 ± 0.21 °C for Bx1 and 0.68 ± 0.13 °C for Bx2) remained significant, according to the non-parametric Mann–Whitney U-test (Z = −3.366 and p = 0.001 for Bx1; Z = −3.114 and p = 0.002 for Bx2).

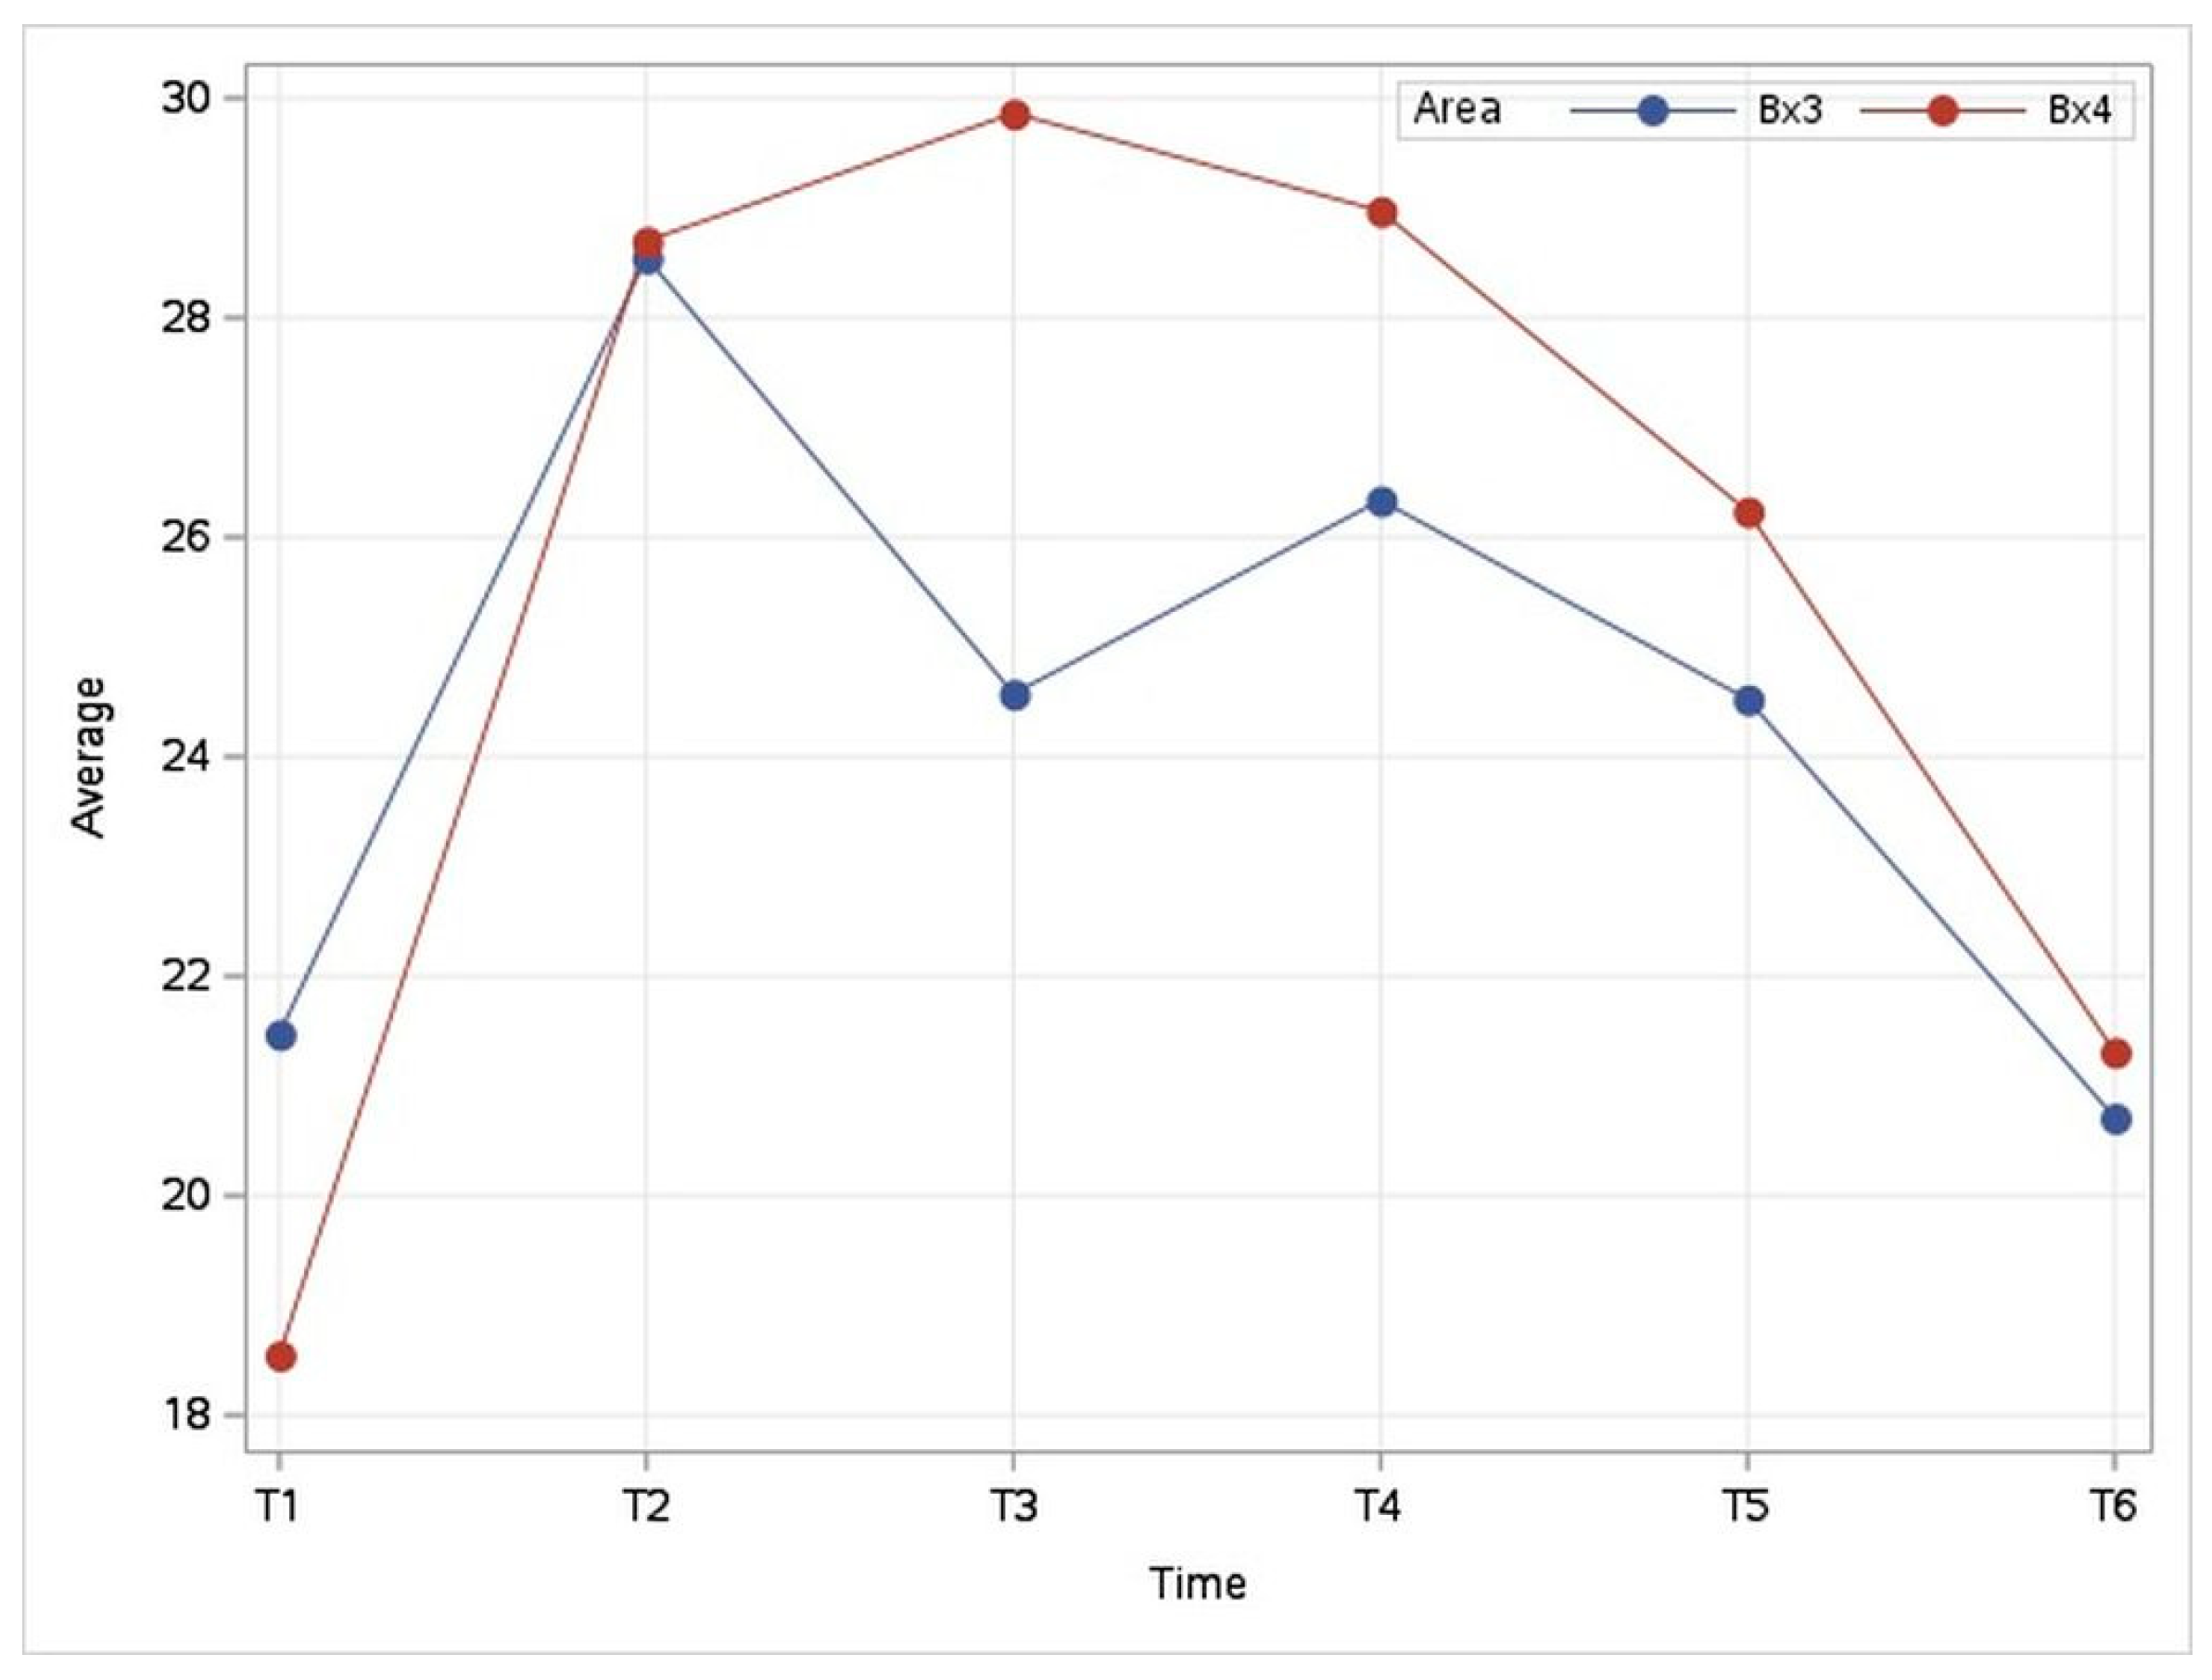
3.3.2. Evolution of Temperature in the Coronary Band Area (Bx3–Bx4)

The temperatures in the coronary bands reached values close to those observed after training (Bx3 = 28.55 ± 0.21 °C; Bx4 = 28.7 ± 0.26 °C), even though they were not similar beforehand (Figure 10). At T3, the temperature in the Bx3 area of the study limb decreased by 3.98 ± 0.25 °C (Z = −3.336; p = 0.001) after the ice boot pack treatment compared to T2. A slow increase in temperature was observed at T4, followed by a progressive decrease at T5 and T6. In the control limb (Bx4 area), the temperature continued to increase after treatment, with a small difference in temperature at T3 compared to T2 (+1.16 ± 0.37 °C; Z = +2.421; p = 0.015), and then progressively decreased at T4, T5, and T6. By T6, the temperatures for both areas (Bx3 and Bx4) were close to each other and comparable to the initial temperatures recorded at T1 (Bx3 = 21.48 ± 0.24 °C; Bx4 = 20.80 ± 0.16 °C; Figure 11). However, although small, the differences (0.76 ± 0.38 °C for Bx3 and 0.51 ± 0.22 °C for Bx4) remained near the significance threshold, according to the non-parametric Mann–Whitney U-test (Z = −1.950 and p = 0.051 for Bx3; Z = −2.055 and p = 0.040 for Bx4).
The variability in the temperature values in the metacarpal area is shown in Figure 11a,b. Similar results were observed using the Wilcoxon score for the mean, showing comparisons between time points (Figures S1 and S2).
The variability in the temperature values in the coronary band areas are shown in Figure 11c,d. In addition, box plot diagrams showed the comparative distributions of mean temperature values between the coronary band areas at different time points (Figure 11c,d). Similar results were observed using the Wilcoxon score for the mean, showing comparisons between time points (Figures S3 and S4).

4. Discussion

This pilot study investigated the effectiveness of ice boot treatment in lowering limb temperatures in a horse after exercise, revealing significant temperature differences between the limbs and noticeable variations in the observed thermal patterns, according to thermographic scans of the acropodial region. The results obtained after applying the ice boot pack confirmed the hypothesis that the application of an ice boot pack leads to a reduction in local temperature and alterations in thermal patterns.
After training, both evaluated areas showed a marked increase in temperature, with mean values rising to 30.53 ± 2.01 °C, demonstrating an increase of 10.97 ± 0.46 °C (Z = +6.878; p = 0.000). Similar post-exercise temperature increases in the metacarpal and metatarsal regions were reported by Simon et al. [38], Quintanar et al. [23], and Soroko et al. [39], who observed increases up to 33 °C. These changes reflect increased muscle activity and exercise-induced blood flow redistribution, as also noted by Yarnell et al. [40], who documented a gradual temperature increase to approximately 30 °C during treadmill exercise.
After 20 min of ice boot application, a significant temperature reduction was recorded. In the metacarpal region (Bx1), the temperature difference between T2 and T3 reached 20.27 ± 0.22 °C, while in the coronary region (Bx3), the difference was 3.98 ± 0.25 °C. Similar reductions were observed by Burke et al. [41,42], with differences of 7.2 °C and 10.8 °C, and Quintanar et al. [23], who reported a 6.3 °C drop compared to untreated limbs. Studies using ice water immersion and cold packs have demonstrated comparable or greater cooling effects, with deep tissue temperature reductions of up to 16.3 °C [10]. The mechanism is thought to involve the cooling of arterial blood in the palmar digital arteries, supporting the recommended use of this treatment in laminitis management [25,31,41].
The thermal patterns post-treatment revealed a progressive return toward baseline in the treated limb from T3 to T6, with color transitions indicating gradual rewarming. In contrast, the control limb also returned to baseline over 50 min, although it exhibited different thermal dynamics. Notably, at T6, a minimal temperature difference of 0.07 ± 0.42 °C (Z = 0.321; p = 0.748) was recorded between limbs. Simon et al. [38] observed a similar recovery within 45 min post-exercise, while Quintanar et al. [23] reported temperature equalization between 6.9 and 22.5 min. Radaelli et al. [42] found no significant post-exercise temperature variation compared to baseline. Given the variability in temperature values in the metacarpal (Figure 11a,b) and coronary band (Figure 11c,d) areas, the box plots suggested that Bx1 and Bx2 exhibited lower dispersion compared to Bx3 and Bx4, which could indicate more consistent temperature measurements following the ice boot treatment. However, in extended studies that build on this pilot research, statistical validation (such as variance comparison tests) would be necessary to confirm reliability as predictors.
The data collected over the 8 days provided consistent results for this individual horse; however, horses can vary greatly in how they respond to exercise and cooling methods. Factors such as breed, age, fitness level, coat length, and limb conformation could influence cooling effectiveness and thermal imaging patterns [43,44].
A key consideration in our study was the controlled environment (i.e., fixed temperature, no air currents, and uniform terrain), which minimized variability but failed to replicate the complexities of real-world conditions. Notably, no sweating was observed in the horse, which might have affected the results. This lack of sweating was likely influenced by the controlled temperature and air conditions. In natural environments, factors like varying temperatures, humidity, wind, and uneven terrain can greatly impact thermoregulation and overall physiological performance [45]. For instance, humidity influences evaporative heat loss, while wind speed boosts convective heat loss [46]. Similar findings have been reported by other researchers, who documented an absence of sweating in horses after treadmill exercise under controlled temperature and wind speed conditions [38,47]. During the ice boot treatment and study period, no edema, cellulitis, skin necrosis, or frostbite was observed due to the cooling method used. Similar observations have been reported by other authors regarding the use of ice boot treatment or cryotherapy [29]. The observed lesions, including dermatitis, cellulitis, alopecia, tissue necrosis, and distal limb edema, resembled frostbite, non-freezing cold injuries, and prolonged water immersion injuries and were reported in patients with multiple health conditions [30].
No signs of distress or incoordination were observed during habituation. The treadmill exercise and thermographic examinations were conducted in the same room under controlled conditions, with a restricted number of participants. The same individuals participated in both procedures. Other authors have suggested that in order to obtain reliable results, it is advisable to minimize the number of individuals present during treadmill exercise testing [18].
Before this treadmill study, there was a period of accommodation to treadmill exercise for 5 days. The horse was habituated with the treadmill by walking and trotting. Other authors have performed the same treadmill habituation process of walking horses for 5 min at a speed of 1.2 m/s and trotting at 2.6–3 m/s [48].
There are different methods that use a cooling temperature of 4 °C, such as ice water immersion and cold gel wraps, which are applied for 30 min [23,24,49]. These methods reduce the cooling time compared to cryotherapy, where the treatment period can be up to 48 h at 5 °C [24]. In our study, the ice boot pack was maintained on the study limb for 20 min immediately following the training session. At the time of application, the mean temperature of the ice boot was 3.8 °C.
For accurate thermal images, a horse’s coat and skin must be completely dry and free from sweat and excess hair, and the ambient temperature should remain constant and uniform to avoid external influences on thermographic results [1,8,22,50]. During exercise, the working muscles generate significant amounts of heat, which the body dissipates via sweating to prevent overheating [51]. In our study, the training exercise was performed in an area with a constant temperature of 22 °C, no air currents, and a humidity level of 70–75%, conditions that did not affect the quality of the thermographic images and did not influence the horse’s sweating [47].
The results obtained demonstrated a decrease in the temperatures of the metacarpus and coronary band following treatment with the ice boot pack, which was attributed to vasoconstriction induced by cooling. Further research on cooling methods is required to assess the temperature of the hoof wall, both before and after cooling treatment; evaluate the efficacy of cooling methods in horses with conditions such as hoof abscesses and laminitis; compare various cooling techniques that facilitate a rapid decrease in temperature and sustain it over extended periods; compare the temperature evolution of the palmar tendons; examine whether the responses are similar between warmblooded, hotblooded, and coldblooded horses; and include variable environmental conditions and field-based study designs to more accurately reflect real-world scenarios.
This pilot study presented several limitations that should be considered when interpreting the results. First and foremost, the sample size (n = 1) significantly restricted generalizability, as individual physiological variations may influence thermal responses. Additionally, the lack of operator blinding introduced the possibility of bias in the interpretation of the thermographic data. The study was conducted under controlled environmental conditions (fixed temperature, fixed humidity, and an absence of air currents), which might not accurately reflect real-world scenarios where external factors, such as humidity and wind, could affect thermoregulation. The short 8-day observation period also precluded the evaluation of the long-term or cumulative effects of repeated ice boot application, including potential tissue adaptations or damage. Moreover, localized surface temperature changes were not correlated with core body temperature, limiting insights into systemic thermoregulatory responses. Finally, the variation in ice boot temperature (−0.4–7.5 °C) might have introduced inconsistencies in cooling efficacy across sessions.

5. Conclusions

Ice boot packs provide rapid and effective cooling, producing distinct thermal pattern changes that suggest their practical value for equine limb care after exercise. These findings highlight the potential for ice boot packs to become a convenient, accessible tool within equine rehabilitation protocols, aiming to reduce inflammation and support recovery.
These initial findings lay the groundwork for larger studies involving more horses under real-world scenarios, which will be necessary to confirm the results and establish clear guidelines for the clinical use of ice boot packs in equine practice.

Supplementary Materials

The following supporting information can be downloaded at https://www.mdpi.com/article/10.3390/app15105524/s1: Figure S1: Distribution of Wilcoxon score for the mean in Bx1, Figure S2: Distribution of Wilcoxon score for the mean in Bx2, Figure S3: Distribution of Wilcoxon score for the mean in Bx3, Figure S4: Distribution of Wilcoxon score for the mean Bx4, Video S1: Exercise on the treadmill at 2 m/s, Table S1: Mean temperatures in the Bx1 and Bx2 areas, Table S2: Mean temperatures in the Bx3 and Bx4 areas.

Author Contributions

Conceptualization, methodology, and study supervision, C.Z. and R.D.; data collection, manuscript preparation, design, and writing, C.Z., A.C. and L.S.; data collection and investigation, V.C., T.C., I.S. and I.T.; statistical analysis and data interpretation, C.R. and I.H.; data acquisition and manuscript review, I.H. and J.D. All authors have read and agreed to the published version of the manuscript.

Funding

The publication of the present paper was supported by the University of Life Sciences “Regele Mihai I” in Timisoara, Romania.

Institutional Review Board Statement

The study was conducted in accordance with the code of the Romanian Veterinary College (protocol number 34/1.12.2012), the procedures of the University Veterinary Clinics of the Faculty of Veterinary Medicine in Timișoara, and with the approval of the Bioethics Commission of the University of Life Sciences “Regele Mihai I” in Timișoara, Romania (approval number 51/07.06.2021).

Informed Consent Statement

Informed consent was obtained from the horse’s owner.

Data Availability Statement

The original contributions presented in the study are included in the article/Supplementary Material, further inquiries can be directed to the corresponding author.

Acknowledgments

The authors would like to express their sincere gratitude to the horse owner, the horse handler, and the students who contributed to the successful completion of this study.

Conflicts of Interest

The authors declare no conflicts of interest.

References

  1. Soroko, M.; Howell, K. Infrared Thermography: Current Applications in Equine Medicine. J. Equine Vet. Sci. 2016, 60, 90–96.e2. [Google Scholar] [CrossRef]
  2. Casas-Alvarado, A.; Martinez-Burnez, J.; Mora-Medina, P.; Hernandez-Avalos, I.; Dominguez-Olivia, A.; Lezama-Garcia, K.; Gomez-Prado, J.; Mota-Rojas, D. Thermal and Circulatory Changes in Diverse Body Regions in Dogs and Cats Evaluated by Infrared Thermography. Animals 2022, 12, 789. [Google Scholar] [CrossRef]
  3. Soroko-Dubrovina, M.; Śniegucka, M.; Dobrowolski1, M.; Dudek, K. Application of thermography in the assessment of physical effort on body surface temperature distribution in racehorses. Pol. J. Vet. Sci. 2024, 27, 221–227. [Google Scholar] [CrossRef]
  4. Zaha, C.; Schuszler, L.; Dascalu, R.; Nistor, P.; Florea, T.; Rujescu, C.; Sicoe, B.; Igna, C. Thermographic Image of the Hoof Print in Leisure and Cross-Country Warmblood Horses: A Pilot Study. Vet. Sci. 2023, 10, 470. [Google Scholar] [CrossRef]
  5. Repac, J.; Alvarez, L.X.; Lamb, K.; Gillette, R.L. Evaluation of Thermographic Imaging in Canine Hindlimb Muscles After 6 min of Walking—A Pilot Study. Front. Vet. Sci. 2020, 7, 224. [Google Scholar] [CrossRef]
  6. Casas-Alvarado, A.; Mota-Rojas, D.; Hernandez-Avaloz, I.; Mora-Medina, P.; Olmos-Hernandez, A.; Verduzco-Mendoza, A.; Reyes-Sotelo, B.; Martinez-Brunes, J. Advances in infrared thermography: Surgical aspects, vascular changes, and pain monitoring in veterinary medicine. J. Term. Biol. 2020, 92, 102664. [Google Scholar] [CrossRef]
  7. Soroko, M.; Howell, K.; Dudek, K.; Henklewski, R.; Ska, P.Z.N. The influence of breed, age, gender, training level and ambient temperature on forelimb and back temperature in racehorses. Anim. Sci. J. 2015, 88, 347–355. [Google Scholar] [CrossRef]
  8. Zaha, C.; Schuszler, L.; Dascalu, R.; Nistor, P.; Florea, T.; Imre, K.; Rujescu, C.; Sicoe, B.; Igna, C. Evaluation of thermal changes of the sole surface in horses with Palmar Foot Pain: A pilot Study. Biology 2023, 12, 423. [Google Scholar] [CrossRef]
  9. Masko, M.; Domino, M.; Lewczuk, D.; Jasinski, T. Horse Behavior, Physiology and Emotions during. Animals 2020, 10, 921. [Google Scholar] [CrossRef]
  10. Kaneps, A.J. Tissue Temperature Response to Hot and Cold Therapy in the Metacarpal Region of a Horse. Proc. Annu. Conv. AAEP Am. Assoc. Equine Pract. 2000, 46, 208–213. [Google Scholar]
  11. Guitart, A.S. The Use of Percutaneous Thermal Sensing Microchips for Body Temperature Measurements in Horses Prior to, during and after Treadmill Exercise. Animals 2020, 10, 2274. [Google Scholar] [CrossRef] [PubMed]
  12. Van Eps, A.W.; Pollitt, C.C. Equine laminitis: Cryotherapy reduces the severity of the acute lesion. Equine Vet. J. 2004, 36, 255–260. [Google Scholar] [CrossRef]
  13. Kang, H.; Zsoldos, R.R.; Skinner, J.E.; Gaughan, J.B.; Mellor, V.A.; Sole-Guitart, A. The Use of Percutaneous Thermal Sensing Microchips to Measure Body Temperature in Horses during and after Exercise Using Three Different Cool-Down Methods. Animals 2022, 12, 1267. [Google Scholar] [CrossRef] [PubMed]
  14. Morris, D.D. Endotoxemia in Horses A Review of Cellular and Humoral Mediators Involved in its Pathogenesis. J. Vet. Intern. Med. 1999, 5, 167–181. [Google Scholar] [CrossRef]
  15. Parsons, C.S.; Orsini, J.A.; Krafty, R.; Capewell, L.; Boston, L. Risk factors for development of acute laminitis in horses during hospitalization: 73 cases (1997–2004). J. Am. Vet. Med. Assoc. 2007, 230, 885–889. [Google Scholar] [CrossRef]
  16. Gomez Alvares, C.B.; Rhodin, M.; Bystrom, A.; Back, W.; Rene van Weeren, P. Back kinematics of healthy trotting horses during treadmill versus over ground locomotion. Equine Vet. J. 2009, 41, 297–300. [Google Scholar] [CrossRef] [PubMed]
  17. Nankervis, K.J.; Launder, E.J.; Murray, R.C. The use of Treadmills within the Rehabilitation of Horses. J. Equine Vet. Sci. 2017, 53, 108–115. [Google Scholar] [CrossRef]
  18. King, C.M.; Evans, D.L.; Roset, R.J. Acclimation to treadmill exercise. Equine Vet. J. 2006, 18, 453–456. [Google Scholar] [CrossRef]
  19. Schamhardt, H.C.; Merkens, H.W. Kinematics of treadmill versus overground locomotion in horses. Equine Vet. J. 2016, 27, 453–456. [Google Scholar] [CrossRef]
  20. Fredricson, I.; Drevemo, S.; Dalin, G.; Hjerten, G.; Bjorne, K.; Rynge, R.; Franzen, G. Treadmill for equine locomotion analysis. Equine Vet. J. 1983, 15, 111–115. [Google Scholar] [CrossRef]
  21. Buchner, H.H.F.; Savelberg, H.H.C.M.; Schamhardt, H.C.; Merkens, H.W.; Barneveld, A. Habituation of horses to treadmill locomotion. Equine Vet. J. 1994, 26, 13–15. [Google Scholar] [CrossRef]
  22. Verdegaal, E.J.M.M.; Howarth, G.S.; Mcwhorter, T.J.; Delesalle, C.J.G. Thermoregulation during Field Exercise in Horses Using Skin Temperature Monitoring. Animals 2023, 14, 136. [Google Scholar] [CrossRef]
  23. Quintanar, M.N.; Pu, T.; Burd, M.A. Thermodynamic effects of commercially available ice boots. Open Vet. J. 2018, 8, 5–8. [Google Scholar] [CrossRef] [PubMed]
  24. Van Eps, A.W.; Walters, L.J.; Baldwin, G.I.; McGarry, M.; Pollit, C.C. Distal Limb Cryotherapy for the Prevention of Acute Laminitis. Clin. Tech. Equine Pract. 2004, 3, 64–70. [Google Scholar] [CrossRef]
  25. van Eps, A.W.; Pollitt, C.C. Equine laminitis model: Cryotherapy reduces the severity of lesions evaluated seven days after induction with oligofructose. Equine Vet. J. 2009, 41, 741–746. [Google Scholar] [CrossRef]
  26. Van Eps, A.W. Therapeutic Hypothermia to Prevent and Treat Acute Laminitis. Vet. Clin. North Am. Equine Pract. 2010, 26, 125–133. [Google Scholar] [CrossRef] [PubMed]
  27. Ziemann, E.A.; Olek, R.A.; Kujach, S.; Grzywacz, T.; Garsztka, T. Five-Day Whole-Body Cryostimulation, Blood Inflammatory Markers, and Performance in High- Ranking Professional Tennis Players. J. Athl. Train. 2012, 47, 664–672. [Google Scholar] [CrossRef]
  28. Kullmann, A.; Holcombe, S.J.; Hurcombe, S.D.; Roessner, H.A.; Hauptman, J.C.; Geor, R.J. Prophylactic digital cryotherapy is associated with decreased incidence of laminitis in horses diagnosed with colitis. Equine Vet. J. 2014, 46, 554–559. [Google Scholar] [CrossRef]
  29. Morgan, J.; Stefanovski, D.; Lenfest, M.; Chatterjee, S. Novel dry cryotherapy system for cooling the equine digit. Vet. Rec. Open 2018, 5, e000244. [Google Scholar] [CrossRef]
  30. Proctor-Brown, L.; Hicks, R.; Colmer, S.; Guilfoyle, D.; Dallap-Schaer, B.; Johnson, A.J.; Tomlinson, J. Research in Veterinary Science Distal limb pathologic conditions in horses treated with sleeve-style digital cryotherapy (285 cases). Res. Vet. Sci. 2018, 121, 12–17. [Google Scholar] [CrossRef]
  31. Taylor, P.; Worster, A.A.; Gaughan, E.M.; Hoskinson, J.J.; Sargeant, J.; Erb, J.H. Effects of external thermal manipulation on laminar temperature and perfusion scintigraphy of the equine digit Effects of external thermal manipulation on laminar temperature and perfusion scintigraphy of the equine digit. N. Z. Vet. J. 2014, 48, 37–41. [Google Scholar] [CrossRef]
  32. Roszkowska, K.; Witkowska-Pilaszewicz, O.; Przewozny, M.; Cywinska, A. Whole body and partial body cryotherapies—Lessons from human practice and possible application for horses. BMC Vet. Res. 2018, 14, 394. [Google Scholar] [CrossRef]
  33. Algafly, A.A.; George, K.P. The effect of cryotherapy on nerve conduction velocity, pain threshold and pain tolerance. Br. J. Sports Med. 2007, 41, 365–369. [Google Scholar] [CrossRef] [PubMed]
  34. Wiecek, M.; Szymura, J.; Sproull, J.; Szygula, Z. Whole-Body Cryotherapy Is an Effective Method of Reducing Abdominal Obesity in Menopausal Women with Metabolic Syndrome. J. Clin. Med. 2020, 9, 2797. [Google Scholar] [CrossRef] [PubMed]
  35. Mawhinney, C.; Low, D.A.; Jones, H.; Green, D.J.; Costello, J.T.; Gregson, W. Cold Water Mediates Greater Reductions in Limb Blood Flow than Whole Body Cryotherapy. Med. Sci. Sports Exerc. 2017, 49, 1252–1260. [Google Scholar] [CrossRef]
  36. Takahashi, T.; Matsui, A.; Mukai, K.; Ohmura, H.; Hiraga, A.; Aida, H. The Effects of Inclination (Up and Down) of the Treadmill on the Electromyogram Activities of the Forelimb and Hind limb Muscles at a Walk and a Trot in Thoroughbred Horses. JEVS 2014, 25, 73–77. [Google Scholar] [CrossRef]
  37. Weishaupt, M.A.; Wiestner, T.; Hogg, H.P.; Jordan, P.; Auer, J.A. Compensatory load redistribution of horses with induced weightbearing hindlimb lameness trotting on a treadmill. Equine Vet. J. 2004, 36, 727–733. [Google Scholar] [CrossRef]
  38. Simon, E.L.; Gaughan, E.M.; Epp, T.; Spire, M. Influence of exercise on thermographically determined surface temperatures of thoracic and pelvic limbs in horses. J. Am. Vet. Assoc. 2006, 229, 1940. [Google Scholar] [CrossRef]
  39. Soroko, M.; Górniak, W.; Godlewska, M.; Howell, K. The effect of training on infrared thermographic images of the forelimb and hindlimb joints of healthy racehorses. Pol. J. Vet. Sci. 2022, 25, 83–92. [Google Scholar] [CrossRef]
  40. Yarnell, K.; Fleming, J.; Stratton, T.D.; Brassington, R. Monitoring changes in skin temperature associated with exercise in horses on a water treadmill by use of infrared thermography. J. Therm. Biol. 2014, 45, 110–116. [Google Scholar] [CrossRef]
  41. Burke, M.J.; Tomlinson, J.E.; Blikslager, A.T.; Johnson, A.L.; Dallap-Schaer, B.L. Evaluation of digital cryotherapy using a commercially available sleeve style ice boot in healthy horses and horses receiving i.v. endotoxin. Equine Vet. J. 2018, 50, 848–853. [Google Scholar] [CrossRef] [PubMed]
  42. Redaelli, V.; Bergero, D.; Zucca, E.; Ferrucci, F.; Costa, L.N.; Crosta, L.; Das, F.L. Journal of Equine Veterinary Science Use of Thermography Techniques in Equines: Principles and Applications. J. Equine Vet. Sci. 2014, 34, 345–350. [Google Scholar] [CrossRef]
  43. Hodgson, D.R.; Davis, R.E.; McConaghy, F.F. Thermoregulation in the horse in response to exercise. Br. Vet. J. 1994, 150, 219–235. [Google Scholar] [CrossRef]
  44. McKeever, K.H.; Eaton, T.L.; Kearns, C.F.; Lehnhard, R.A. Age related decreased in thermoregulation and cardiovascular function in horses. Equine Vet. J. 2010, 42, 220–227. [Google Scholar] [CrossRef]
  45. Mota-Rojas, D.; Titto, C.G.; Orihuela, A.; Martínez-Burnes, J.; Gómez-Prado, J.; Torres-Bernal, F.; Flores-Padilla, K.; Carvajal-de la Fuente, V.; Wang, D. Physiological and Behavioral Mechanisms of Thermoregulation in Mammals. Animals 2021, 11, 1733. [Google Scholar] [CrossRef] [PubMed]
  46. Periard, J.D.; Eijsvogels, T.M.H.; Daanen, H.A.M. Exercises under heat stress: Thermoregulation, hydration, performance implications and mitigation strategies. Physiol. Rev. 2021, 101, 1873–1979. [Google Scholar] [CrossRef]
  47. Marlin, D.J.; Scott, C.M.; Schroter, R.C.; Harris, R.C.; Harris, P.A.; Roberts, C.A.; Millis, P.A. Physiological responses of horses to a treadmill simulated speed and endurance test in high heat and humidity before and after humid heat acclimation. Equine Vet. J. 1999, 31, 31–42. [Google Scholar] [CrossRef] [PubMed]
  48. Crook, T.K.; Wilson, A. The effect of treadmill speed and gradient on equine hindlimb muscle activity. Equine Vet. J. 2010, 42, 412–416. [Google Scholar] [CrossRef]
  49. Pollitt, C.C.; Van Eps, A.W. Prolonged, continuous distal limb cryotherapy in the horse. Equine Vet. J. 2004, 36, 216–220. [Google Scholar] [CrossRef]
  50. Turner, T.A. Thermography as an Aid to the Clinical Lameness Evaluation. Vet. Clin. North Am. Equine Pract. 1991, 7, 311–338. [Google Scholar] [CrossRef]
  51. Mccarthy, R.N.; Jeffcott, L.B.; Clinical, E. Effects of treadmill exercise on cortical bone in the third metacarpus of young horses. Res. Vet. Sci. 1992, 52, 28–37. [Google Scholar] [CrossRef] [PubMed]
Figure 1. The forelimbs of the Warmblood mare: (a) normal image captured using the FLIR E50 camera; (b) thermographic image captured using the FLIR E50 camera. The red triangles indicate the maximum temperatures recorded in the areas of interest, while the blue triangles represent the lowest temperatures recorded in the same regions.
Applsci 15 05524 g001
Figure 2. The forelimbs at T3: (a) normal image captured using the FLIR E50 camera; (b) thermographic image captured using the FLIR E50 (Li1 represents the area of temperature measurement, the red triangle indicates the maximum temperature recorded in the area of interest, and the blue triangle represents the lowest temperature recorded in the same region).
Applsci 15 05524 g002
Figure 3. Thermographic images of the thoracic limbs at T1: (a) the white arrows identify the mid-metacarpal region, showing low values of temperature (yellow) and the black arrows identify the coronary band area, showing higher values of temperature (white color); (b) the red triangles indicate the maximum temperatures recorded in the area of interest, while the blue triangles represent the lowest temperatures recorded in the same areas. RL, right limb; LL, left limb.
Applsci 15 05524 g003
Figure 4. Thermographic images of the thoracic limbs at T2: (a) the white arrows indicate the middle metacarpal region, showing an increase in temperature (white) and the yellow arrows highlight the expansion of the white color intensity, representing higher temperature values; (b) the red triangles indicate the maximum temperatures recorded in the areas of interest, while the blue triangles represent the lowest temperatures recorded in the same areas. RL, right limb; LL, left limb.
Applsci 15 05524 g004
Figure 5. Thermographic images of the thoracic limbs at T3: (a) the yellow arrows indicate a cold area in the middle of the metacarpus, the red arrows indicate moderate temperature values, the red circle indicates a low temperature value, the black arrow indicates a high temperature value, and the orange arrows indicate high temperature values in the coronary area; (b) the red triangles indicate the maximum temperatures recorded in the areas of interest, while the blue triangles represent the lowest temperatures recorded in the same areas. RL, right limb; LL, left limb.
Applsci 15 05524 g005
Figure 6. Thermographic images of the thoracic limbs at T4: (a) the yellow arrows indicate the cold areas in the middle of the metacarpus (which reduced in intensity and dimension compared to the image from T3), the red arrows indicate moderate temperature values, the red circle indicates a decrease in temperature at the carpal joint, the black arrow indicates the high temperature in the middle of the metacarpus, and the orange arrows indicate high temperatures in the coronary area; (b) the red triangles indicate the maximum temperatures recorded in the areas of interest, while the blue triangles represent the lowest temperatures recorded in the same areas. RL, right limb; LL, left limb.
Applsci 15 05524 g006
Figure 7. Thermographic images of the thoracic limbs at T5: (a) the yellow arrows indicate areas of reduced temperature in the middle of the metacarpus (with no sign of blue coloring), the red arrows indicate an increased temperature in the coronary area, the red circle shows an increased temperature at the carpal joint, the black arrows indicate moderate temperature values in the middle of the metacarpus, and the orange arrows indicate a high temperature in the coronary area; (b) the red triangles indicate the maximum temperatures recorded in the areas of interest, while the blue triangles represent the lowest temperatures recorded in the same areas. RL, right limb; LL, left limb.
Applsci 15 05524 g007
Figure 8. Thermographic images of the thoracic limbs at T6: (a) the yellow arrows at the middle of the metacarpus indicate moderate temperatures in both limbs, the red arrow shows an increased temperature compared to the same area at T5, the orange arrow shows a reduced temperature compared to the same area at T5, and the blue circles indicates identical moderate temperatures in both limbs; (b) the red triangles indicate the maximum temperatures recorded in the areas of interest, while the blue triangles represent the lowest temperatures recorded in the same areas. RL, right limb; LL, left limb.
Applsci 15 05524 g008
Figure 9. Evolution of the local average temperature (y axis) in the middle of the metacarpal area over time (x axis). Bx1, right (study) limb; Bx2, left (control) limb; T1, before training; T2, immediately after training; T3, after applying the cooling method; T4, 10 min after training; T5, 20 min after training; T6, 30 min after training.
Applsci 15 05524 g009
Figure 10. Evolution of the local average temperature (y axis) in the coronary band area over time (x axis). Bx1, right (study) limb; Bx2, left (control) limb; T1, before training; T2, immediately after training; T3, after applying the cooling method; T4, 10 min after training; T5, 20 min after training; T6, 30 min after training.
Applsci 15 05524 g010
Figure 11. Value and variability of temperatures in the metacarpal (a,b) and coronary band (c,d) areas: boxplot distributions for the (a) Bx1 area; (b) Bx2 area; (c) Bx3 area; (d) Bx4 area.
Applsci 15 05524 g011
Disclaimer/Publisher’s Note: The statements, opinions and data contained in all publications are solely those of the individual author(s) and contributor(s) and not of MDPI and/or the editor(s). MDPI and/or the editor(s) disclaim responsibility for any injury to people or property resulting from any ideas, methods, instructions or products referred to in the content.

