Abstract
As additive manufacturing technologies continue to gain ground in industrial applications, the need for the accurate metrological evaluation of parts produced with advanced materials becomes increasingly critical. In this context, non-contact metrology plays a key role. This research investigates the performance of conoscopic holography as an optical metrology technique for the inspection of ceramic parts manufactured by stereolithography. However, its reliability needs to be validated, especially as factors such as material properties, surface finish, and color can significantly affect measurement accuracy. Spherical artifacts in alumina were chosen as mathematically well-defined reference elements, and a representative series was produced with the best values for the printing, debinding, and sintering parameters. These spheres were first measured via contact with a coordinate measuring machine (CMM) to establish dimensional (diameter) and geometrical (form error) reference values. These parameters were then compared with measurements obtained via conoscopic holography and optimized by means of Gaussian filters. The results indicated significant dimensional (up to 60 µm) and geometrical (up to 280 µm) deviations from the CMM reference data. The investigation shows that conoscopic holography does not ensure an accurate measurement method for this additive process and ceramic material, making it impossible to achieve power and frequency settings that would allow signal-to-noise ratios above 50%.
1. Introduction
Additive manufacturing (AM) offers numerous advantages for the production of parts with complex geometries and those made of materials other from traditional polymers, such as ceramics, metals, or composites. Furthermore, advancements in the development of these technologies are enabling the elimination of molds and tools required by traditional methods, allowing parts to be manufactured layer by layer with these materials [1,2,3,4,5]. However, many challenges remain, and improvements are needed; mechanical properties and the precision of parts produced by additive manufacturing are two key areas under current intensive research [6,7,8,9,10,11,12].
Among the materials most actively studied in additive manufacturing (AM) are ceramics [9,13,14,15], with alumina being a notable example. This material is ideal for applications where temperature resistance and biocompatibility are critical factors. Its characteristics—such as resistance, wear, hardness, stability, and lightness—are also leveraged in other fields, such as precision metrology. One AM technology under investigation employs the ultraviolet laser photopolymerization of alumina paste. Commonly known as stereolithography (SLA) [15,16,17], this process is referred to by the acronym VPP-UVL/C, according to ISO 52900:2021 [18]. The manufacturing process involves four distinct stages: the 3D printing of the parts, cleaning of unpolymerized material, removal of the substrate or binder, and sintering of the part. The final product is thermally stable and lightweight, making it attractive, as noted, in the field of precision metrology. In this domain, it is essential to validate the capability of optical inspection systems to generate data (point clouds) that can be used to assess whether the measured dimensions deviate from nominal or reference values and to determine the magnitude of such deviations, typically obtained using coordinate measuring machines (CMMs).
Conoscopic holography (CH), as an optical inspection system, offers certain advantages compared to other technologies, such as simplicity, stability, and precision [19,20,21]. In 1985, Sirat and Psaltis developed this interferometric technique using incoherent light based on the birefringence properties of uniaxial crystals. With appropriate calibration, this method calculates the original distance to the light-emitting point by analyzing the frequency of one of the signal lines. This technology enables the recording of three-dimensional information about the inspected object, which, when properly processed, allows for the evaluation of measurement accuracy.
There is no doubt that other metrological evaluation techniques exist that offer effective solutions for measuring complex parts, such as those produced by additive manufacturing—especially when internal or hard-to-access geometries need to be characterized. Computed tomography (CT) is one such technique, capable of providing both dimensional and geometrical data simultaneously while also offering insight into potential internal defects within the parts’ structure [22,23]. Studies on this technology have focused on surface determination in order to achieve sub-voxel accuracy (i.e., below tenths of a millimeter) in the identification of both internal and surface points [23,24]. However, the high cost of CT systems compared to CH limits their accessibility, particularly when research requirements are restricted to surface data rather than internal features.
Numerous studies support the effectiveness of conoscopic holography as an optical measurement system in various industrial settings [20] and across different materials. However, the emergence of new manufacturing technologies, such as ultraviolet light stereolithography applied to the production of alumina parts, necessitates the validation of this system given the distinct structural configuration of the final part (density, porosity, roughness, etc.). Using ceramic spheres manufactured via SLA in alumina as reference elements for the calibration of medium- and high-range optical sensors is a potential application worth considering.
In this study, alumina spherical artifacts [25] produced by stereolithography were evaluated using a candidate measuring technique: conoscopic holography. The spheres were first measured by contact with a coordinate measuring machine (CMM) to obtain reference values for diameter and form error. These parameters were also recorded from point clouds generated through digitalization using the conoscopic holography sensor, and the results were compared with the reference values. This comparison, between contact (CMM) and HC, will allow us to obtain the overall feasibility of this measurement technique in measurements of this type of ceramic material when it is manufactured with this new additive manufacturing process (SLA).
The following sections first describe the equipment and materials used in the study, as well as the methodology for assessing the obtained measurements. Subsequently, the results for the evaluated parameters—diameter and form error—are presented, compared, and discussed in relation to the reference values. The final section summarizes the conclusions drawn from the data presented in the previous sections.
2. Materials and Methods
In this study, the metrological behavior of alumina is investigated as a high-performance technical material, based on parts produced by stereolithography. Through this additive manufacturing technique, parts are obtained and measured via contact to record the reference parameters. Subsequently, these parts are scanned and mathematically processed to derive parameters that can be compared with the reference values. The research methodology is schematically presented in Figure 1, where the different phases undertaken can be clearly observed.
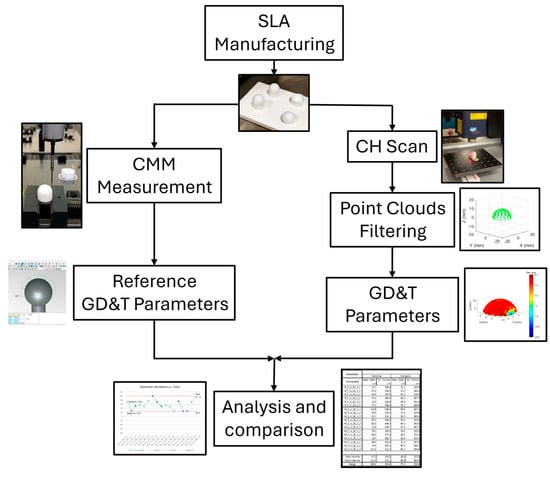
Figure 1.
Methodology. The left branch shows the reference measurement of the manufactured artifacts. The right branch shows the measurement with CH.
First, the parts under study were manufactured using the ultraviolet laser stereolithography process with Al2O3. These parts, spherical objects with a diameter of 20 mm, were initially measured via contact using a coordinate measuring machine (CMM). Then, they were scanned with a conoscopic holography system. The point clouds obtained from the second system enabled the evaluation of parameters such as diameter and form error, using specific scripts and available software for metrology and reverse engineering. Prior to this, spurious points that distorted the scanned geometry were removed through a filtering process. Additionally, a standard deviation-based filter, validated in previous research [26], was applied to the point clouds. In the final phase, the values obtained through contact (CMM) and non-contact (CH) methods were compared and analyzed.
The ultraviolet laser stereolithography manufacturing process for alumina ceramic parts involved the use of three pieces of equipment as follows [11]:
- -
- The C900 Flex printer (3DCeram, Bonnac-la-Côte, France): This device allows for the fabrication of parts with a layer thickness of 50 µm and a maximum working volume of 300 mm × 300 mm × 100 mm.
- -
- The Ceradel PTF 16/130/610 furnace (3DCeram, Bonnac-la-Côte, France): This furnace reaches a maximum temperature of 1300 °C in a nitrogen atmosphere and is primarily used for the debinding phase (removal of the binder from the ceramic paste).
- -
- The HTL 20/17 sintering furnace (Thermoconcept, Merignac, France): This furnace is capable of achieving a maximum temperature of 1750 °C in a working chamber of 200 mm × 250 mm × 200 mm.
To ensure reliable results, 18 spheres were manufactured using SLA technology from 3DMIX ALUMINA AL-F02 paste (3DCeram, Bonnac-la-Côte, France), supplied by the manufacturer of the printing equipment. The process was completed with the cleaning, debinding, and sintering phases [11].
For the measurement stage, the DEA Global Image 09158 coordinate measuring machine (Hexagon) was used to obtain reference measurements. It was equipped with a PH10MQ indexing head and a ceramic stylus with a Ø4 mm ruby sphere end. Its maximum permissible error is 2.2 + 0.003 L µm (L in mm), and its maximum radial error is 2.2 µm (in repeatability).
The data generated by this CMM were processed using the machine’s proprietary control software, PC-DMIS 2019 R2. Over 100 contact points were recorded for each sphere, adhering to the criteria defined in ISO 10360-5 [27]. The evaluation of the point clouds to determine the diameter and form error values was conducted using routines specifically developed in MATLAB 2024b for this study. These routines provided the reference values used in the comparative analysis.
On the other hand, the measurements analyzed in this study were obtained using the Conoscan 4000 3D conoscopic holography system (Optimet, Jerusalem, Israel), which integrates the Conopoint-10 sensor (Figure 2).
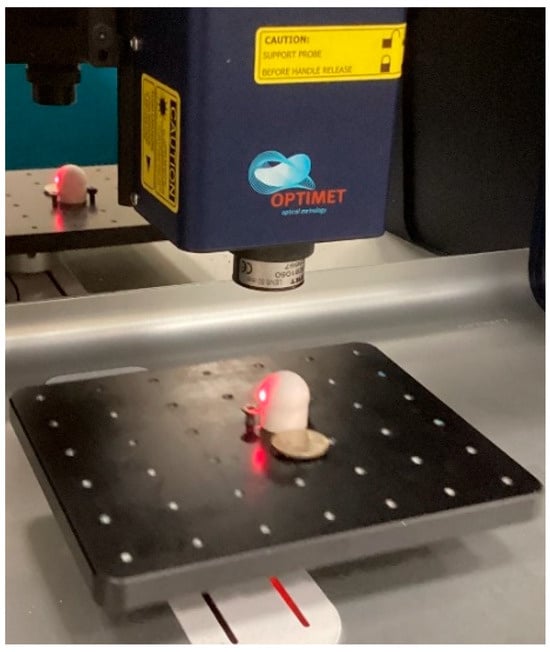
Figure 2.
Ø18 mm sphere scanned with Conoscan 4000.
For the study, the 25 Gold lens (25 mm) was used, featuring a depth of field (DOF) of 1.8 mm and a stand-off distance of 1.4 mm. The remaining specifications of the equipment are listed in Table 1.

Table 1.
Features of the conoscopic holography equipment (Conoscan 4000).
To obtain the diameter and form error values from the point clouds generated by the HC sensor, the Geomagic Control (v.X) software was initially used to manually remove spurious points. Subsequently, specific MATLAB scripts were employed to fit the point cloud to a sphere (the best-fit sphere) using the least squares method [28]. These routines also allowed for the application of two filters: a filter to exclude points outside the sensor’s maximum angle coverage (152°) and a coverage-based filter (k) to eliminate outlier points using a factor applied to the standard deviation (k·σ) [6], a method commonly used in reverse engineering software. Both contact measurements (CMM) and non-contact measurements (CH) were conducted under controlled temperature conditions (20 ± 0.5 °C).
The measurement procedure using the CH sensor required the consideration of two parameters: the laser beam’s power or energy level and the operating frequency, which indicates the data acquisition speed.
Based on these two parameters, the goal is to ensure signal quality through the “SNR” (signal-to-noise ratio) metric, which can range from 0 to 1024 (0% to 100%) and is calculated from the signal power and the noise power of the signal. The higher the value, the better the signal, with it being advisable to achieve signals exceeding 50% [29]. Additionally, the “Total” parameter, representing the amount of light detected by the sensor in each measurement, must have acceptable values within the range of 1200 to 21,000.
3. Results and Discussion
In Table 2, the mean values of diameters (Ø) and form errors (Fe) of the 18 spheres are presented, as measured using the coordinate measuring machine after applying the encompassed angle filter (<152°). These values correspond to the application of the coverage factor k for k = 1, 2, 3.
Table 2.
Mean values of diameter (Ø) and form error (Fe) obtained with the CMM.
Based on the results, the mean diameter of the theoretical 20 mm sphere shows the same deviation (1 µm) regardless of whether no coverage filter is applied (k = 0) to the standard deviation (σ) or if the filter corresponds to k = 1 or k = 3. However, when k = 2 is applied, the deviation increases slightly to 3 µm, suggesting that the mean diameter is largely independent of the application of this filter.
On the other hand, this is not the case for the form error, which shows significant dependence on the level of filtering. The form error increases as the factor k rises, with the largest form error observed when no filter is applied. As an example, Figure 3 illustrates the spatial distribution of the point cloud obtained by contact with the CMM (a) and by the CH sensor (b) for sphere no. 6, using a filter of k = 1 and a coverage angle of less than 152°. In this case, a diameter value of 20.003 mm and a form error of 39.5 µm were recorded.
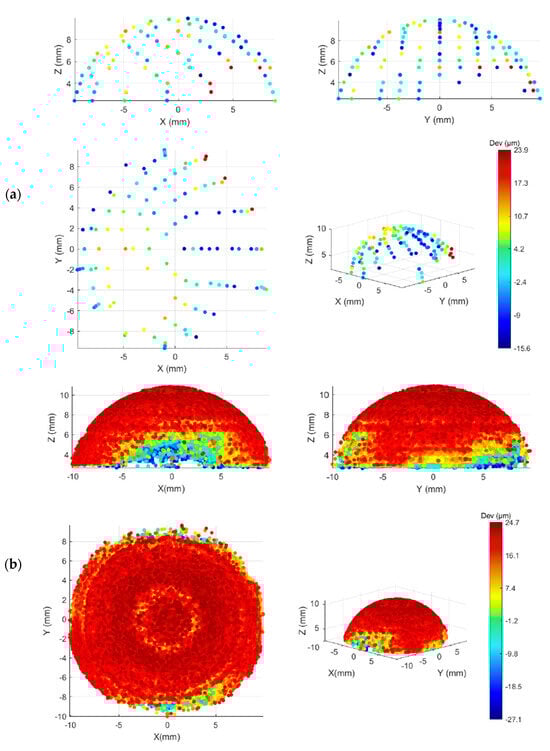
Figure 3.
Two-dimensional and 3D views of the distribution of points on sphere no. 6 for k = 1 and the angle covered of (a) 151.9° with CMM and (b) 147.6° with Conoscan.
On the other hand, Table 3 presents the diameter and form error values obtained using the conoscopic holography sensor after applying both filters. Although, in this case, the recorded data exhibit greater deviation from the nominal value, at around 50 µm, the same trend observed with contact measurements is also evident, as the differences between values do not exceed 3 µm in any case. Additionally, it can be noted that the form error clearly depends on the applied filter, decreasing as the level of filtering increases (i.e., as the factor k decreases). It is worth mentioning that as the coverage factor increases, the number of filtered points decreases.
Table 3.
Mean values of diameter (Ø) and form error (Fe) obtained with the CH sensor.
To perform a more detailed analysis of the results obtained in terms of diameter (dimensional quality of the point cloud) and form error (geometric quality of the point cloud), Table 4 and Table 5 present the deviation values for both parameters across all spheres. These deviations are calculated with respect to the reference values obtained via contact measurements using the coordinate measuring machine.
Table 4.
Deviation of the diameters [mm] of the 18 spheres measured with the CH sensor with respect to the reference values (CMM).
Table 5.
Deviation of the form error [mm] of the 18 spheres measured with the CH sensor with respect to the reference values (CMM).
According to Table 4, the measurement ranges (difference between the maximum and minimum diameter deviations) for the different filters vary between 48 µm (0.075–0.027) for the 3·σ filter and 69 µm (0.082–0.013) for the 1·σ filter. Figure 4, presented below, illustrates more clearly that for each of the three filters (σ, 2·σ, and 3·σ) and for the unfiltered point clouds, both the absolute deviation values and the ranges exhibit the same trend. This indicates that measurements obtained with the conoscopic holography sensor show little dependence on the filtering level, with the mean deviation consistently falling between 50 and 52 µm, as detailed further below.
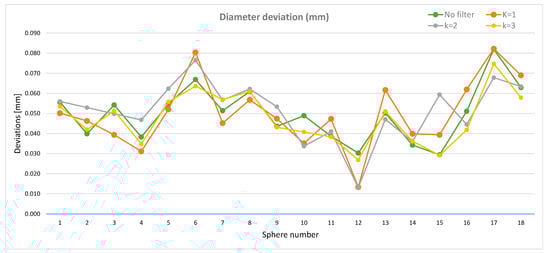
Figure 4.
Deviation of the diameters measured with the CH sensor with respect to the diameters measured with the CMM according to the different k filters.
According to Table 5, the measurement ranges for form error deviations differ substantially depending on the applied filter. This difference is most pronounced when no filter is applied to the point cloud (k = 0). While the ranges for k = 1, k = 2, and k = 3 are 38 µm, 74 µm, and 95 µm, respectively, the difference between the minimum and maximum deviation without filtering rises to 242 µm.
Regarding the form error, Figure 5 clearly illustrates the influence of applying a coverage filter to the standard deviation in improving the geometric quality of the point cloud. The form error deviations without filter application (green plot) are substantially higher compared to the rest.
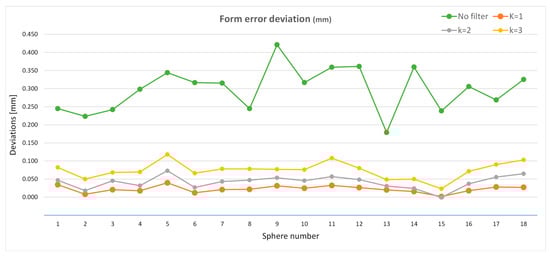
Figure 5.
Deviation of the form error measured with the CH sensor with respect to the form error measured with the CMM according to the different k filters.
In summary, Table 6 presents the mean deviation values for diameter and form error alongside the number of points comprising the point cloud for each applied filter. It is observed that the dimensional quality of the point cloud, defined by the diameter (Ø), is unaffected, as previously mentioned, while the geometric quality, defined by the form error (Fe), improves with k = 1, despite a more notable reduction in the number of points. This indicates that there are many spurious points, therefore indicating the poor quality of the point cloud.
Table 6.
Mean diameter (Ø) and form error (Fe) deviations with CH sensor.
As noted earlier, all recorded values used to construct the various point clouds for the 18 spheres were obtained using specific signal quality parameters of the CH sensor. In this investigation, conducted on alumina spheres fabricated through ultraviolet light stereolithography, it was not possible to establish a frequency–intensity combination that would achieve a signal-to-noise ratio (SNR) exceeding 50%.
4. Conclusions
This work aims to analyze the feasibility of non-contact measurement with the conoscopic holography (CH) technique in the measurement of ceramic parts manufactured by SLA. Originally, this study arose from the need to manufacture lightweight and customizable versions of ceramic reference spheres, widely used for the verification and calibration of non-contact metrology and reverse engineering equipment.
The feasibility study of the CH measurement has been established in terms of dimensional and geometrical accuracy, thus by studying the dimensional (diameters) and geometrical deviations (form errors) made by the CH over the surface finish of ceramic spheres.
This study involves measurements of the diameters and form errors of 18 spheres using a CH sensor. The spheres were fabricated through an additive manufacturing process (SLA) based on the ultraviolet laser photopolymerization of alumina (Al2O3) particles. The objective was to evaluate the optical performance of these components using conoscopic holography.
From the presented data, it is observed that the dimensional quality, determined by the diameters of the spheres scanned from the point clouds, shows deviations of approximately 50 µm relative to the reference values obtained by contact measurements. This value can be considered a threshold for determining the precision level suitable for potential industrial applications of different optical sensors [9]. However, it is evident that this dimensional quality is independent of the filtering level applied to the point cloud, as the mean deviations in diameters vary by only about 2 µm.
On the other hand, applying a filter to the standard deviation effectively improves the values obtained for form error, with this geometric parameter decreasing as the level of filtering increases. The form error reaches 22 µm for a σ filter (the most extensive filtering performed in this study). However, it is worth noting a qualitative leap in the number of points removed when this filter is applied (25%), even though the most substantial improvement in the point cloud’s quality is achieved with a 3·σ filter (reducing the form error by 75%).
A final conclusion is that, unfortunately, with the methodology followed and the rigorous experimentation carried out, this non-contact measurement technology does not offer sufficient quality for the parts manufactured with this process (SLA) and this material (alumina) due to the impossibility of achieving a signal-to-noise ratio parameter higher than 50%. This leads precisely to the need to analyze the feasibility of other non-contact technologies. An additional conclusion, which is inferred directly from the most accurate measurement data (by contact, with the CMM), is that the SLA ceramic process is not suitable for the manufacturing of high-precision parts that can be used as reference elements, unless mid-range or high-range optical equipment is used.
In any case, work remains to be completed for future research on the use of equipment with other optical metrology technology (laser triangulation, structured light, etc.) given that, even with the application of filters, stereolithography (SLA) is not valid in reference elements for low-range precision optics if the system chosen is conoscopic holography. It would also be of interest to explore more advanced metrology technologies, such as computed tomography, in order to subsequently discuss the results related to the accuracy of the conoscopic holography technique.
Author Contributions
Conceptualization, V.M. and E.C.; methodology, V.M., L.M. and E.C.; formal analysis: L.M. and P.F.; validation: G.V., P.F. and L.M.; writing—original draft preparation, L.M. and V.M.; writing—review and editing, E.C., G.V. and B.J.Á.; visualization, B.J.Á. and L.M.; supervision, V.M. and G.V.; project administration, V.M. and E.C. All authors have read and agreed to the published version of the manuscript.
Funding
This research was part of a project funded by University Institute of Industrial Technology of Asturias (IUTA), grant number SV-23-GIJON-1-01, also by MICIU/AEI/10.13039/501100011033 and, as appropriate, by “ERDF A way of making Europe”, by “ERDF/EU”, by the European Union; grant number PID2021–125992OB-I00.
Institutional Review Board Statement
Not applicable.
Informed Consent Statement
Not applicable.
Data Availability Statement
The original contributions presented in this study are included in the article. Further inquiries can be directed to the corresponding author.
Conflicts of Interest
The authors declare no conflicts of interest.
References
- Chadha, U.; Abrol, A.; Vora, N.P.; Tiwari, A.; Shanker, S.K.; Selvaraj, S.K. Performance evaluation of 3D printing technologies: A review, recent advances, current challenges, and future directions. Prog. Addit. Manuf. 2022, 7, 853–886. [Google Scholar] [CrossRef]
- Tofail, S.A.M.; Koumoulos, E.P.; Bandyopadhyay, A.; Bose, S.; O’Donoghue, L.; Charitidis, C. Additive manufacturing: Scientific and technological challenges, market uptake and opportunities. Mater. Today 2017, 1, 22–37. [Google Scholar] [CrossRef]
- Vora, H.D.; Sanyal, S. A comprehensive review: Metrology in additive manufacturing and 3D printing technology. Prog. Addit. Manuf. 2020, 5, 319–353. [Google Scholar] [CrossRef]
- Revilla-León, M.; Sadeghpour, M.; Özcan, M. An update on applications of 3d printing technologies used for processing polymers used in implant dentistry. Odontology 2020, 108, 331–338. [Google Scholar] [CrossRef]
- Dadkhah, M.; Mosallanejad, M.H.; Iuliano, L.; Saboori, A. A comprehensive overview on the latest progress in the additive manufacturing of metal matrix composites: Potential, challenges, and feasible solutions. Acta Metall. Sin. 2021, 34, 1173–1200. [Google Scholar] [CrossRef]
- Ding, Y.; Muñiz-Lerma, J.; Trask, M.; Chou, S.; Walker, A.; Brochu, M. Microstructure and mechanical property considerations in additive manufacturing of aluminum alloys. MRS Bull. 2016, 41, 745–751. [Google Scholar] [CrossRef]
- Lewandowski, J.J.; Seifi, M. Metal Additive Manufacturing: A Review of Mechanical Properties. Annu. Rev. Mater. Res. 2016, 46, 151–186. [Google Scholar] [CrossRef]
- Wang, J.-C.; Dommati, H.; Hsieh, S.-J. Review of additive manufacturing methods for high-performance ceramic materials. Int. J. Adv. Manuf. Technol. 2019, 103, 2627–2647. [Google Scholar] [CrossRef]
- Dadkhah, M.; Tulliani, J.M.; Saboori, A.; Iuliano, L. Additive manufacturing of ceramics: Advances, challenges, and outlook. J. Eur. Ceram. Soc. 2023, 43, 6635–6664. [Google Scholar] [CrossRef]
- Senin, N.; Thompson, A.; Leach, R.K. Characterisation of the topography of metal additive surface features with different measurement technologies. Meas. Sci. Technol. 2017, 28, 095003. [Google Scholar] [CrossRef]
- Bešić, I.; Van Gestel, N.; Kruth, J.-P.; Bleys, P.; Hodolič, J. Accuracy improvement of laser line scanning for feature measurements on CMM. Opt. Lasers Eng. 2011, 49, 1274–1280. [Google Scholar] [CrossRef]
- Cuesta, E.; Giganto, S.; Alvarez, B.; Barreiro, J.; Martínez-Pellitero, S.; Meana, V. Laser line scanner aptitude for the measurement of Selective Laser Melting parts. Opt. Lasers Eng. 2021, 138, 106406. [Google Scholar] [CrossRef]
- Bove, A.; Calignano, F.; Galati, M.; Iuliano, L. Photopolymerization of Ceramic Resins by Stereolithography Process: A Review. Appl. Sci. 2022, 12, 3591. [Google Scholar] [CrossRef]
- Scheithauer, U.; Schwarzer, E.; Moritz, T.; Michaelis, A. Additive Manufacturing of Ceramic Heat Exchanger: Opportunities and Limits of the Lithography-Based Ceramic Manufacturing (LCM). J. Mater. Eng. Perform. 2018, 27, 14–20. [Google Scholar] [CrossRef]
- Sangeetha, N.; Monish, P.; Brathikan, V.M. Review on various materials used in Additive Manufacturing. IOP Conf. Ser. Mater. Sci. Eng. 2022, 1228, 012015. [Google Scholar] [CrossRef]
- Chen, H.; Chen, B.; Li, J.; Yan, H.; Cheng, L.; Chen, J.; Zeng, Y. The influence of SLA process parameters on the property of alumina. J. Phys. Conf. Ser. 2021, 1965, 012112. [Google Scholar] [CrossRef]
- Meana, V.; Zapico, P.; Cuesta, E.; Giganto, S.; Meana, L.; Martínez-Pellitero, S. Additive Manufacturing of Ceramic Reference Spheres by Stereolithography (SLA). Appl. Sci. 2024, 14, 7530. [Google Scholar] [CrossRef]
- ISO/ASTM 52900:2021; Additive Manufacturing—General Principles—Fundamentals and Vocabulary. International Organization for Standardization (ISO): Geneva, Switzerland, 2021.
- Giganto, S.; Martínez-Pellitero, S.; Cuesta, E.; Meana, V.M.; Barreiro, J. Analysis of Modern Optical Inspection Systems for Parts Manufactured by Selective Laser Melting. Sensors 2020, 20, 3202. [Google Scholar] [CrossRef]
- Álvarez, I.; Enguita, J.M.; Frade, M.; Marina, J.; Ojea, G. On-Line Metrology with Conoscopic Holography: Beyond Triangulation. Sensors 2009, 9, 7021–7037. [Google Scholar] [CrossRef] [PubMed]
- Rico, J.C.; Valiño, G.; Fernández, P.; Zapico, P.; Blanco, D.; Mateos, S. Adjustment recommendations of a conoscopic holography sensor for a reliable scanning of surfaces with roughness grades obtained by different processes. Precis. Eng. 2015, 42, 335–345. [Google Scholar] [CrossRef]
- Dewulf, W.; Bosse, H.; Carmignato, S.; Leach, R. Advances in the metrological traceability and performance of X-ray computed tomography. CIRP Ann. 2022, 71, 693–716. [Google Scholar] [CrossRef]
- Holgado, I.; Ortega, N.; Yagüe-Fabra, J.A.; Plaza, S.; Villarraga-Gómez, H. Metrological evaluation and classification of porosity in metal additive manufacturing using X-ray computed tomography. Mater. Des. 2025, In press, 114057. [Google Scholar] [CrossRef]
- Pirillo, F.; Shao, H.; Petrò, S.; Moroni, G. A Surface Determination Technique for Dimensional and Geometrical Analysis in Industrial X-ray Computed Tomography. Nanomanuf. Metrol. 2024, 7, 20. [Google Scholar] [CrossRef]
- Falegnami, A.; Tomassi, A.; Gunella, C.; Amalfitano, S.; Corbelli, G.; Armonaite, K.; Fornaro, C.; Giorgi, L.; Pollini, A.; Caforio, A.; et al. Defining conceptual artefacts to manage and design simplicities in complex adaptive systems. Heliyon 2024, 10, e41033. [Google Scholar] [CrossRef] [PubMed]
- Giganto, S.; Martínez-Pellitero, S.; Meana, V.; Cuesta, E.; Barreiro, J. Influence of point cloud filtering on optical inspection of additive manufactured metal parts. Precis. Eng. 2024, 90, 12–20. [Google Scholar] [CrossRef]
- ISO 10360-5:2010; Geometrical Product Specifications (GPS)—Acceptance and Reverification Tests for Coordinate Measuring Systems (CMS)—Part 5: Coordinate Measuring Machines (CMMs) Using Single and Multiple Stylus Contacting Probing Systems Using Discrete Point and/or Scanning Measuring Mode. International Organization for Standardization (ISO): Geneva, Switzerland, 2010.
- Zapico, P.; Meana, V.; Cuesta, E.; Mateos, S. Optical Characterization of Materials for Precision Reference Spheres for Use with Structured Light Sensors. Materials 2023, 16, 5443. [Google Scholar] [CrossRef]
- Valiño, G.; Rico, J.; Zapico, P.; Fernández, P.; Mateos, S. Influence of Surface Location within Depth of Field on Measuring by a Conoscopic Holography Sensor Integrated in a Machining Centre. Procedia Eng. 2015, 132, 832–839. [Google Scholar] [CrossRef][Green Version]
Disclaimer/Publisher’s Note: The statements, opinions and data contained in all publications are solely those of the individual author(s) and contributor(s) and not of MDPI and/or the editor(s). MDPI and/or the editor(s) disclaim responsibility for any injury to people or property resulting from any ideas, methods, instructions or products referred to in the content. |
© 2025 by the authors. Licensee MDPI, Basel, Switzerland. This article is an open access article distributed under the terms and conditions of the Creative Commons Attribution (CC BY) license (https://creativecommons.org/licenses/by/4.0/).