Article

Assessing the Impact of Exposure to PM2.5 Air Pollution on the Academic Performance of Schoolchildren in Chile

by
Andrea González-Rojas
1,*,
Hanns de la Fuente-Mella
2,
Sonnia Parra
3,
Fernando Cancino-Haas
1,
Catalina Coiro-Nicolas
1,
Javiera Godoy-Saavedra
1,
Melanie Pastén-Torres
1,
Elizabeth Verdejo-Zamora
1,
Agustín Dotte-González
1,
Paulo Salinas
4,
Martina Valencia-Narbona
1,
Oscar Achiardi
1,
Felipe Granada-Granada
1,
Pablo A. Lizana
5 and
Manuel A. Bravo
3
1
Escuela de Kinesiología, Pontificia Universidad Católica de Valparaíso, Avenida Universidad 330, Valparaíso 2373223, Chile
2
Instituto de Estadística, Facultad de Ciencias, Pontificia Universidad Católica de Valparaíso, Valparaíso 2340031, Chile
3
Grupo de Quimiometría Aplicada, Laboratorio de Química Analítica y Ambiental, Instituto de Química, Pontificia Universidad Católica de Valparaíso, Avenida Universidad 330, Valparaíso 2340025, Chile
4
Laboratory of Animal & Experimental Morphology, Institute of Biology, Faculty of Sciences, Pontificia Universidad Católica de Valparaíso, Avenida Universidad 330, Valparaíso 2340025, Chile
5
Laboratory of Epidemiology and Morphological Sciences, Instituto de Biología, Pontificia Universidad Católica de Valparaíso, Valparaíso 2373223, Chile
*
Author to whom correspondence should be addressed.
Appl. Sci. 2025, 15(10), 5474; https://doi.org/10.3390/app15105474
Submission received: 21 March 2025 / Revised: 27 April 2025 / Accepted: 9 May 2025 / Published: 13 May 2025
(This article belongs to the Special Issue Air Quality in Indoor Environments, 3rd Edition)

Abstract

:
Air pollution from particulate matter 2.5 (PM2.5) may negatively impact students’ learning due to its neurotoxic effects. Therefore, we ask: What is the effect of PM2.5 air pollution on the academic performance of Chilean eighth-grade students? Objective: To compare the academic performance of eighth-grade students living in the three most PM2.5-polluted areas of Chile with those living in the three least polluted areas. Additionally, we compared the academic performance of schools in the most and least polluted areas according to their administrative dependency. Methodology: Academic performance was assessed using the results of the 2019 SIMCE test (mathematics, and language score). The most and least polluted areas were determined based on the three-year average PM2.5 levels reported by the Chilean Ministry of the Environment. Results: The mathematics and language scores were lower in schools located in areas with higher pollution PM2.5 with a small effect size. When analyzing the scores by administrative dependency, students from subsidized schools in highly polluted areas obtained lower scores in all tests compared to those in less polluted areas, a pattern not observed in private or municipal schools. Conclusion: These findings suggest that PM2.5 pollution alone may not fully explain variations in academic performance, highlighting the need to explore additional contributing factors.

1. Introduction

Air pollution is defined as high levels of chemical substances or toxic compounds in the air, increasing health risks [1]. According to the World Health Organization, air pollution primarily affects low- and middle-income countries, with 9 out of 10 people exposed to air pollution levels exceeding WHO-established limits [2].
As in other cities in developing countries, air pollution in Chile is prevalent in areas with a high concentration of industries, heavy vehicular traffic, and widespread use of wood-burning heating [3]. Despite existing regulations, pollution persists in some areas, producing significant environmental and health impacts for local communities. To date, environmental pollution control measures have been implemented in Chile, leading to a progressive improvement in air quality; however, these efforts remain insufficient.
Air pollution is closely associated with atmospheric particulate matter (PM), PM2.5 refers to fine particulate matter with an aerodynamic diameter ≤ 2.5 μm, capable of penetrating deep into the respiratory system and crossing the blood-brain barrier, posing significant health risks, particularly to children. PM10, or coarse particulate matter with a diameter ≤ 10 μm, primarily affects the up-per respiratory tract but is less likely to reach systemic circulation. This study focuses exclusively on PM2.5 due to its established neurotoxic effects and relevance to cognitive development [1]
The main components of PM2.5 include sulfates, nitrates, ammonium, organic carbon, elemental carbon, and mineral dust, with metals (e.g., copper, lead) and polycyclic aromatic hydrocarbons (PAHs) present in smaller proportions. Regarding size, PM10 and PM2.5 have aerodynamic diameters of 10 μm and 2.5 μm and are referred to as coarse and fine particles, respectively. PM2.5 has been observed to contain organic and inorganic components from various anthropogenic sources, such as copper (Cu) and high-molecular-weight polycyclic aromatic hydrocarbons (PAHs), which are generated from the incomplete combustion of fossil fuels, among others [1]. The relevance of PM2.5 lies in the fact that the pollutants it contains have been identified as toxic, especially for development in children [4].
Children are particularly vulnerable to air pollution due to their developing respiratory and immune systems, lower body mass, and specific breathing patterns, which increase pollutant absorption [5,6]. Air quality in schools is an emerging concern, potentially posing even greater health risks than outdoor pollution [7]. Exposure during this critical developmental stage can negatively affect children’s respiratory, cardiovascular, and cognitive systems [8,9], with studies reporting lower neurobehavioral and IQ test scores, as well as neurological impairments, among exposed children [3,10,11].
PM2.5 can penetrate deep into the lungs, enter systemic circulation, and cross the blood-brain barrier, producing neurotoxic effects during childhood [12,13]. Chronic exposure has been associated with neuroinflammation and oxidative stress, particularly in the hippocampus and prefrontal cortex—regions critical for memory and learning [14,15,16]. Both human and animal studies have shown that PM2.5 exposure alters neuronal function and morphology through mechanisms like microglial activation and disrupted metabolism in key brain areas [17,18,19].
Persistent neuroinflammation and disruption of neuronal homeostasis due to PM2.5 exposure can impair synaptic circuits, negatively impacting cognitive abilities such as working memory, reasoning, and concentration—key skills for academic performance. These effects have been linked to lower scores in language and mathematics among schoolchildren exposed to high levels of PM2.5, as observed in both third-grade students and broader school environments like those in California [20,21]. A critical mechanism behind this neurotoxicity is PM2.5’s capacity to carry heavy metals (e.g., lead, mercury, cadmium) and persistent organic compounds, which enhance their absorption into the central nervous system [13]. Research in rats shows that these metals can accumulate in the cerebral cortex via PM2.5 transport, increasing neuronal toxicity and contributing to neurodegenerative processes and cognitive decline in children [13,22,23].
It is known that learning and, consequently, academic performance (AP) in children depend on their cognitive functions [5], which could be affected by exposure to environmental pollution [7]. Additionally, children with low socioeconomic status (SES), as well as those belonging to ethnic minorities, may show diminished cognitive functions when exposed to environmental pollution in schools [6]. In this context, Wu et al. (2006) in Detroit found that students attending schools near high-traffic roads or highly polluted industrial areas are more likely to be African American or Hispanic and to live in a low-income area of the city [6]. Pastor et al. (2006) evaluated children from impoverished communities in California exposed to environmental pollution, finding low results on standardized AP tests [8]. Another study, conducted by Moahi et al. in 2011, showed that the majority of children exposed to high levels of air pollution in public schools in Michigan performed poorly on standardized academic achievement tests [9].
Regarding air pollution in Chile, a study by Álamos et al. (2022) found that the residential sector is responsible for over 90% of PM2.5 and PM10 emissions. Overall, air pollution and CO2 emissions from human activities in northern Chile are primarily driven by mining operations and thermoelectric power plants, whereas in central and southern Chile, the main sources are residential heating and transportation [3].
About academic performance, it is assessed in the country through the Education Quality Measurement System (SIMCE), which is conducted annually under the framework of Law No. 20.529. SIMCE serves as a national assessment tool for measuring student learning outcomes across the country [10]. Relating both topics, in a recently published study by our research group [11], we determined the effects of environmental pollution on health risk and the AP of Chilean children attending six schools located in the Quintero and Puchuncaví area one of the country’s sacrifice zones. In this study, we also consider mineral dust, metals (e.g., copper, lead), and polycyclic aromatic hydrocarbons (PAHs) due to their relevance in the Chilean context, where mining, industrial activities, and wood combustion are prevalent emission sources, particularly in areas like Puchuncaví and Quintero, where heavy metal exposure has been linked to adverse health and cognitive effects [12]. This approach ensures consistency with international literature while addressing region-specific pollution pro-files and their documented neurotoxic impacts. Our results indicated that the levels of heavy metals inside and outside the schools influence the AP of eighth-grade students. In conclusion, children in this area are exposed to high levels of environmental pollution by heavy metals, which may pose a health risk and impact their AP [11].
Given the importance of air pollution on children’s learning and AP, we asked: What is the effect of PM2.5 air pollution on the AP of Chilean eighth-grade children? Our objective was to compare the AP of eighth-grade children living in the three most PM2.5-polluted areas of Chile with those living in the three least polluted areas of the country. Additionally, we compared the AP of schools in the most and least polluted areas according to the administrative department and we determined the effect size. Accordingly, this study contributes novel evidence on the association between PM2.5 exposure and academic performance using large-scale standardized educational data in Chile, offering new insights from a Latin American context where such research remains scarce.

2. Materials and Methods

2.1. Study Desing

A cross-sectional study was conducted using data from the 2019 SIMCE test administered to Chilean eighth-grade students. This cross-sectional design was chosen due to the immediate availability of standardized nationwide data, allowing for the assessment of associations between variables at a specific point in time. However, it limits the ability to establish causal relationships compared to longitudinal or cohort designs, which can track changes over time.
Population-level data were analyzed, including test results in Language and Communication and Mathematics. To minimize the impact of confounding variables, such as the socioeconomic level of the analyzed areas—which could influence both exposure to environmental pollution (e.g., PM2.5) and academic performance—analyses were adjusted by considering the schools’ administrative dependency in the SIMCE database.

2.2. Participants

From the total population assessed by the 2019 SIMCE test in 8th grade—which included 222.353 students across 5.953 Chilean schools—a subset of 10.119 students was selected for this study. These students attended schools located in the three most polluted and the three least polluted geographic areas of Chile. This was based on data reported in the “Sixth State of the Environment Report 2021” by the Chilean Ministry of the Environment, in its section on air quality [13]. The selection criterion based on the pollution levels of the municipalities where the analyzed schools are located was clearly defined; however, the sample was not randomized due to the nature of the study design, which could introduce biases. To minimize this risk, analyses were adjusted for relevant sociodemographic variables, such as the type of educational institution, which could influence academic performance, using data available in the SIMCE database.

2.3. Academic Performance

The data were requested from the Agency for Quality Education (MINEDUC) through the official platform, following the agency’s established protocol. The information, delivered within 30 business days, included school-level scores in mathematics and language for eighth-grade students, along with municipality and administrative dependency, without access to individual student data. The SIMCE test administration and analysis are regulated by Chilean Law No. 20,529, with a stratified sampling design based on region and school administrative type, excluding hard-to-reach areas [14].
The SIMCE system is a standardized, nationwide learning assessment tool established in 1968. Its purpose is to improve the quality and equity of education by recording information on students’ learning achievements, promoting transparency and a commitment to continuous learning [10,15,16]. According to national and international learning assessments from the period 2004–2018, Chile’s SIMCE derives information from tests administered biennially at different levels, such as 4th, 6th, and 8th grade and second year of high school. The subjects evaluated in SIMCE include language and communication, mathematics, natural sciences, and history, geography, and social sciences, depending on the students’ grade level [10,15,16].
In the language assessment for all levels, three skill axes are distinguished: locating, interpreting and relating, and reflecting. Similarly, the mathematics tests for all evaluated levels present three skill axes to be assessed: knowledge, application, and reasoning. In the 8th-grade mathematics test, four thematic axes or content areas are identified: numbers, algebra and functions, geometry, and probability and statistics [16].

2.4. Areas of Higher and Lower Air Pollution by PM2.5

The three areas with the highest air pollution and the three with the lowest were determined using data from the Sixth State of the Environment Report 2021 by the Chilean Ministry of the Environment (Section: Air Quality, p. 245), following the methodology described in [13].
The PM2.5 data used in this study were obtained from the National Air Quality Monitoring Network. These stations measure hourly PM2.5 concentrations using automated instruments approved by the U.S. EPA, including Beta Attenuation Monitors (BAM) and Tapered Element Oscillating Microbalance (TEOM) devices, as specified in Decree D.S. N°12/2011. The stations used are located in areas of high population density, typically near residential zones and schools, and are classified as having population representativeness, making them appropriate for assessing chronic exposure in school-age populations.
According to Decree D.S. N°12/2011, the monitoring network processes the data as follows to determine annual PM2.5 concentrations:
-
Hourly measurements are collected and used to calculate daily averages, which are valid if at least 18 h of data are available.
-
From valid daily averages, monthly means are calculated, requiring at least 75% of valid daily averages in a month.
-
Annual averages are computed using at least 9 valid months; if only 9 or 10 are available, missing months are filled with the highest values from the preceding 12 months to reach 11 months.
-
Finally, a three-year arithmetic average is calculated and compared to the national standard of 20 μg/m3 [13].
Based on this methodology, we identified the three most and least polluted areas in Chile (Figure 1) [13]:
-
Most polluted areas (40–45 μg/m3): Coyhaique, Padre Las Casas, and Osorno.
-
Least polluted areas (<15 μg/m3): Punta Arenas, Huasco, and Antofagasta.
Figure 1. Map of Chile showing the 3 areas with the highest (in blue) and the 3 areas with the lowest (in red) PM2.5 air pollution in 2019.
Applsci 15 05474 g001

2.5. Statistical Analysis

The normality of the data for each variable was determined using the Kolmogorov-Smirnov test. Descriptive statistical analyses were performed, and statistical differences between the two study groups were determined using the student’s t-test with the statistical software. The level of statistical significance was p < 0.05 with a 95% confidence interval. The results are presented through graphics comparative tables to facilitate the synthesis, understanding, and interpretation of the data obtained. Additionally, the effect size was assessed using Cohen’s d to assess the magnitude of the difference between high pollution and low pollution educational establishments, with cutoff points classified as 0.2 for small, 0.5 for medium, and 0.8 for large effect sizes. The software used to analyze data was Stata/SE.

3. Results

3.1. General Characteristics of the Sample

A total of 251 educational institutions were included, of which 46.8% were located in the three least polluted areas, distributed as follows: Punta Arenas (30.5%), Huasco (3.4%), and Antofagasta (66.1%). Meanwhile, 53.2% of the institutions were in the three most polluted areas, distributed as follows: Coyhaique (16.4%), Padre Las Casas (34.3%), and Osorno (49.3%).
Table 1 details the educational institutions in areas with higher or lower PM2.5 air pollution, classified by administrative dependency (private, subsidized private, and public schools).

3.2. SIMCE Results According to Areas with Higher and Lower Air Pollution

When analyzing the schools included in this study, located in areas with lower versus higher PM2.5 pollution, the results indicate that those situated in more polluted areas show lower performance in mathematics, and language (Figure 2). In addition, the effect size for the comparison between high and low pollution schools indicates a small effect (0.31 in the math SIMCE and 0.27 in the language SIMCE).
Subsequently, we analyzed the results according to the administrative dependency of the schools. Regarding the Language and Mathematics scores of the eighth-grade SIMCE test, no differences were found when comparing private schools with each other and public schools with each other in areas with higher and lower air pollution (Table 2). However, in subsidized private schools, it was observed that in each SIMCE test, areas with lower air pollution obtained higher scores compared to areas with higher air pollution (Table 2).

4. Discussion

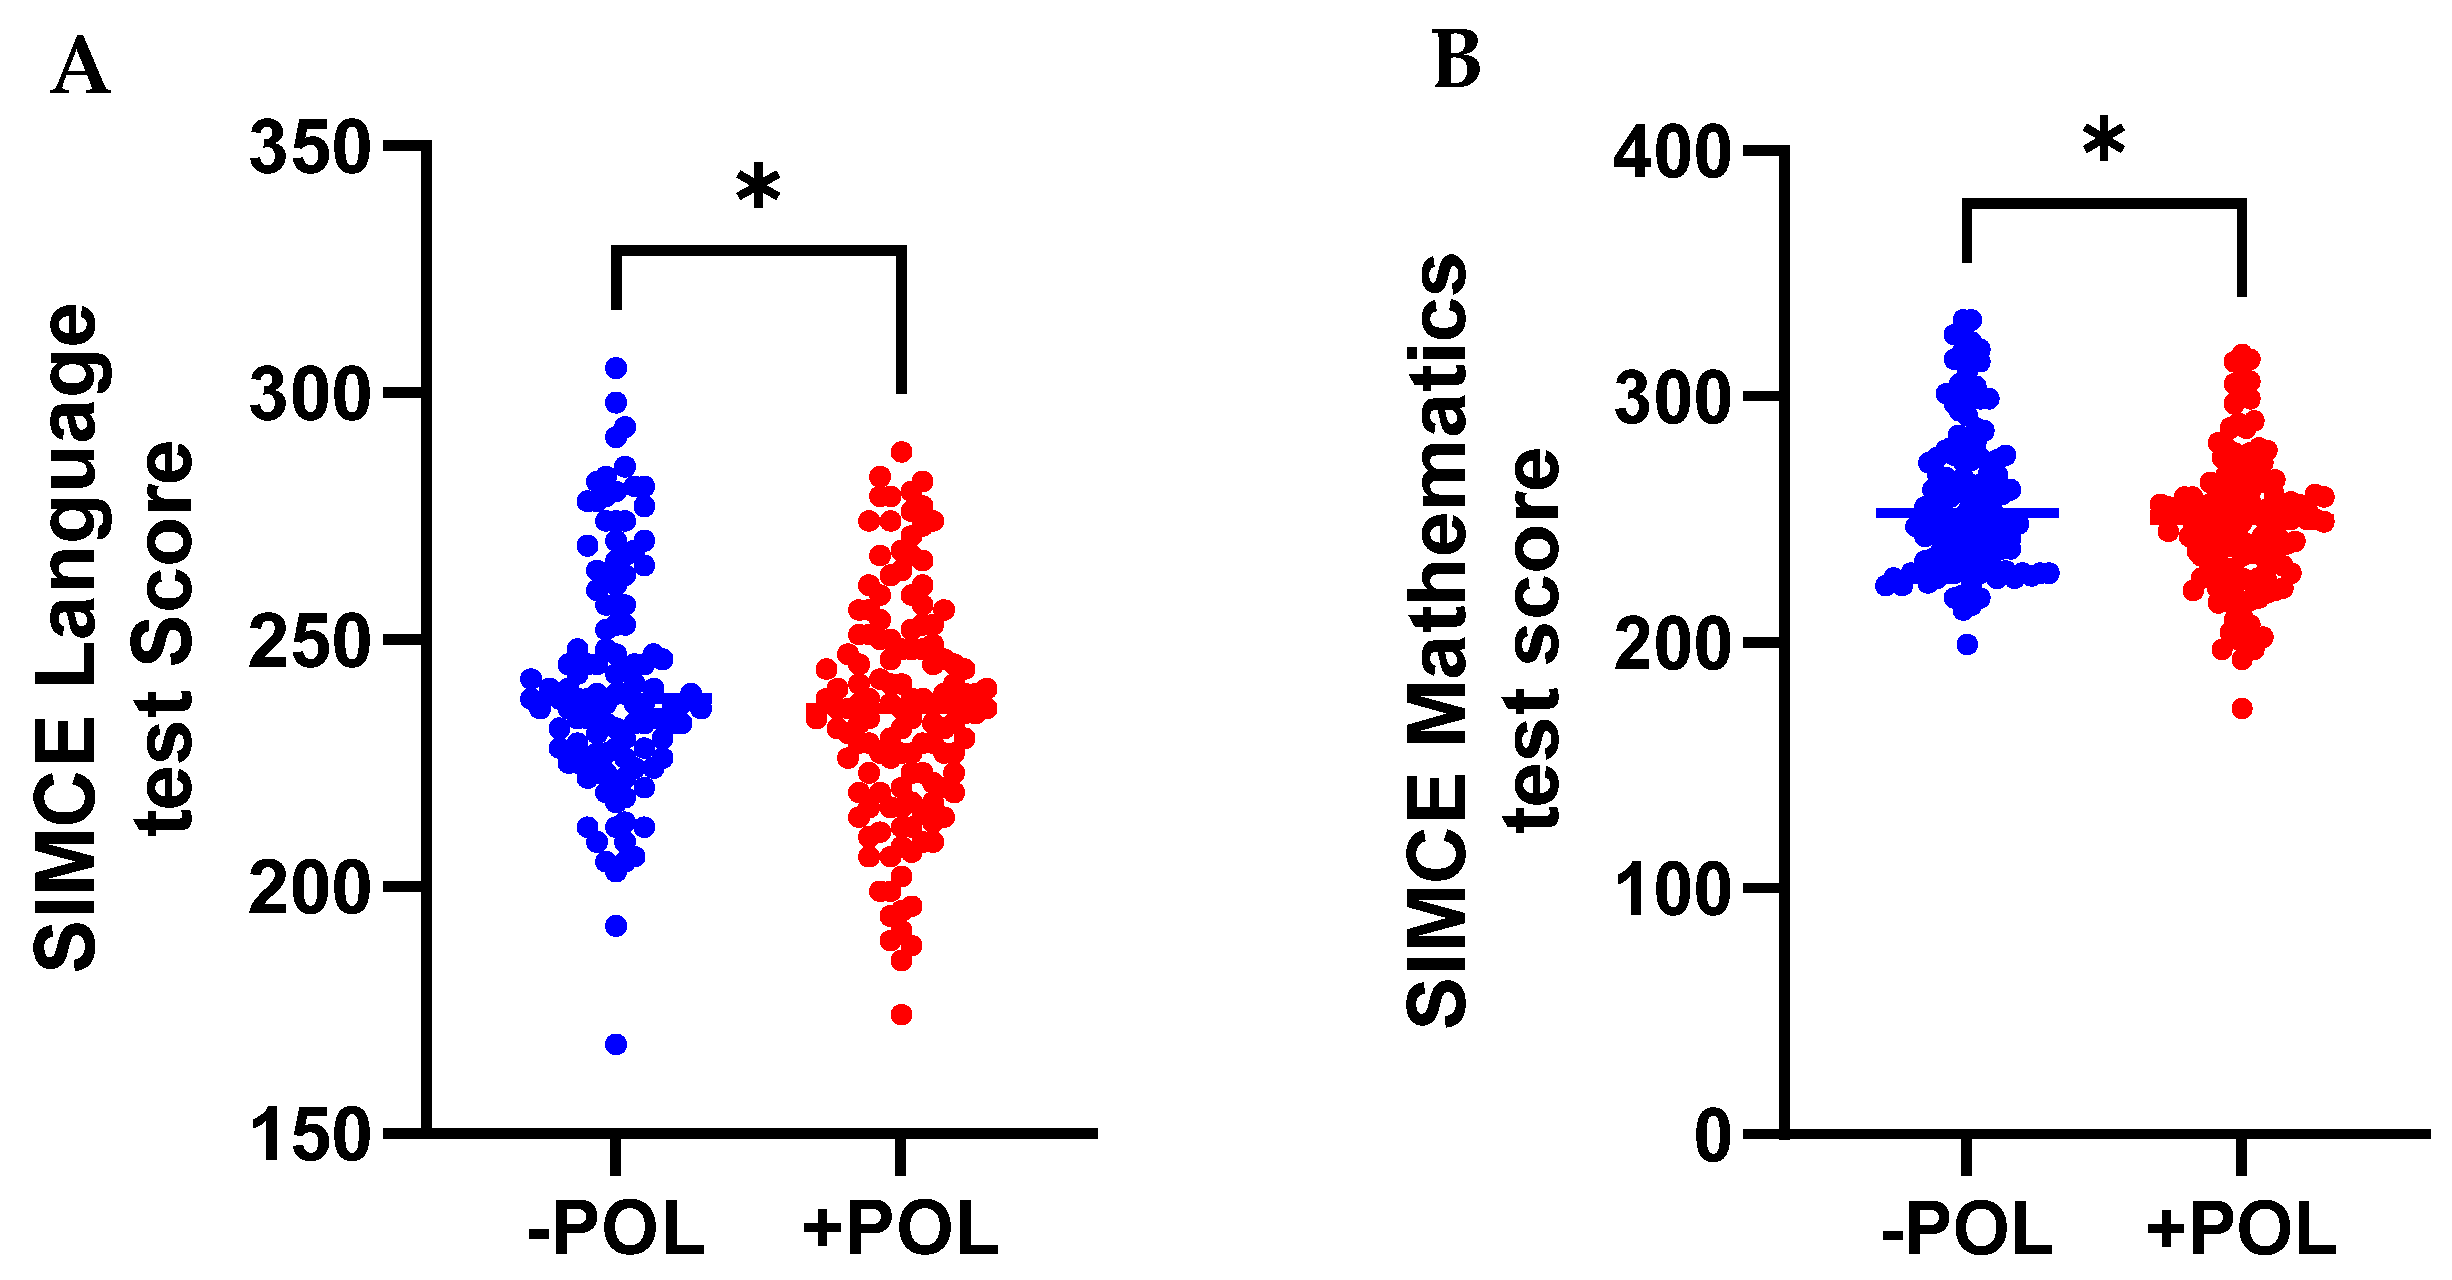
Using the 2019 SIMCE database, we compared the academic performance in mathematics and language of 8th-grade students attending schools in the three highest and three least PM2.5-polluted geographic areas. The results indicate lower academic performance in the SIMCE mathematics and language tests among schools located in the three most PM2.5-polluted areas compared to those in the three least polluted areas of the country. Subsequently, the SIMCE test results were compared according to the administrative dependency of the schools (private, subsidized, and municipal). Data revealed that the AP of 8th-grade students in private and municipal schools is similar when their schools are located in the three zones with the highest and lowest air pollution. In contrast, students attending subsidized private schools in the most polluted zones demonstrated significantly lower SIMCE scores compared to their counterparts in the least polluted zones. On the other hand, the effect size for the comparison between high and low pollution schools indicates a small effect (0.31 in the math SIMCE and 0.27 in the language SIMCE).
Critically elevated levels of PM2.5 represent a serious risk to both environmental and public health, with documented impacts in various regions of Chile. Previous research has shown a strong association between chronic exposure to PM2.5 and increased mortality, higher hospitalization rates, and a rise in respiratory and cardiovascular diseases in cities with high pollution levels [3]. In this context, the findings of our study reinforce the evidence that the adverse effects of PM2.5 pollution are not limited to physical health alone but also affect the academic performance of students, suggesting an even broader impact on child well-being and educational equity. Specifically, our results show that eighth-grade students attending schools in municipalities with higher PM2.5 concentrations have lower scores on the SIMCE tests compared to those in less polluted areas. These findings highlight the need to integrate air quality as a key variable in the formulation of public policies aimed at improving educational and health conditions in communities highly exposed to air pollution.
In this context, and considering the Sixth Report on the State of the Environment in Chile, we observe that the three communes most polluted with PM2.5 are in the southern part of the country, where there is a high residential demand for wood combustion for heating and cooking. Specifically, in the city of Coyhaique, characterized by frequent episodes of environmental pre-emergency, the geographic configuration of a semi-closed mountainous valley and large-scale atmospheric conditions also play a role, as they are natural forces that modulate lower ventilation in the basin [17]. An interesting aspect is that the maximum concentrations of PM2.5 established by the WHO (annual concentration of 5 µg/m3 and 24-h concentration of 15 µg/m3) and the national standard (annual concentration of 20 µg/m3 and 24-h concentration of 50 µg/m3) show a significant difference in values, demonstrating that Chile far exceeds the established standards for both annual and daily concentrations. Related to this, in terms of morbidity, an average of 3007 hospitalizations for respiratory causes could have been avoided in people of all ages if Chile adhered to the WHO standard, and 1069 if it followed the national standard, which unfortunately is sometimes also not met [18].
Regarding AP, our results indicate that it is lower in more polluted areas across all SIMCE tests. This suggests a possible effect of PM2.5 air pollution on student learning. In this context, Balakrishnan et al. (2021) studied the impact of air pollution on AP in language and mathematics among children aged 5 to 16 in India. Their findings indicated that high levels of air pollution significantly reduce language and mathematics scores, and that this performance decline worsens with age [19].
As previously mentioned, prolonged exposure to PM2.5 poses significant neurotoxic risks to children due to the ongoing development of their brains, particularly affecting the hippocampus and prefrontal cortex [20,21], which may result in diminished short-term memory and impaired cognitive functions, such as mathematical reasoning and critical thinking [22]. Therefore, as the SIMCE test is based on the assessment of cognitive functions, these brain-level changes could be reflected in a decrease in AP. In this regard, schools located in areas with higher air pollution showed lower scores in mathematics, indicating reduced quantitative skills. Language were also negatively affected, possibly due to their reliance on cognitive skills related to memory and critical analysis, which may be more vulnerable to the neurotoxic effects of pollution [23]. The findings of this research are consistent with studies conducted in other areas of Chile, such as Puchuncaví and Quintero, known as “sacrifice zones”, due to their high concentration of environmental pollutants. Parra et al. (2024) demonstrate how exposure to heavy metals from industrial pollution and traffic is associated with lower AP. In these areas, a correlation has been found between increased levels of suspended elements such as arsenic, lead, and manganese, and decreased scores in AP tests like SIMCE among eighth-grade students [11]. This correlation highlights the importance of considering environmental factors when studying student performance in areas affected by pollution.
On the other hand, it is interesting that no significant differences in SIMCE scores were observed between private and municipal schools when comparing institutions located in zones with higher versus lower air pollution. In this regard, it is possible that not only the level of PM2.5 pollution is influencing the AP, but also other internal and/or external variables affecting the student. One of these variables that could partially explain these differences is the SES. In this regard, when analyzing this variable in subsidized private schools, we found that in the three most polluted areas, 67.5% have low and lower-middle SES, 21.5% middle, and 9.25% upper-middle and high SES. In contrast, in the three least polluted areas, the SES distribution was 2.5% lower-middle, 32.5% middle, and 65% upper-middle SES. These differences in terms of SES found in subsidized private schools are not present in private schools, both in more and less polluted areas, where 100% of them are in the upper-middle and high SES. In municipal schools in the most polluted areas, 14% are in the middle SES, 45% in the lower-middle SES, and 20% in the low SES. Meanwhile, in the less polluted areas, 7.7% are in the upper-middle SES, 52.3% in the middle SES, and 40% in the lower-middle SES. In this regard, Lu et al. (2021) showed that higher air pollution within a specific socioeconomic group is associated with lower AP among children. The authors suggest that further improvements in air quality could enhance children’s overall AP and contribute to greater socioeconomic achievement throughout their lives [24]. Cheeseman et al. (2022) discuss the connection between SES and pollution in their study on U.S. schools. They note that students from marginalized ethnic or racial groups attending public schools in the U.S. are more likely to be exposed to higher levels of air pollution. Public schools with higher poverty rates are also linked to increased concentrations of air pollutants. Furthermore, even within urban public schools, disparities in air pollution exposure remain across different racial and ethnic groups [25]. In 2024, Bernardi et al. researched whether exposure to poor air quality affects AP differently among Italian students from high and low socioeconomic backgrounds. Their findings reveal a modest but consistent negative impact of PM2.5 on math and language test scores, with the most significant effects observed in students from lower socioeconomic levels [26]. These results suggest that the interaction between socioeconomic vulnerability and exposure to air pollutants could have additive or synergistic effects on academic performance, highlighting the need for comprehensive public policies that jointly consider environmental and social aspects in educational contexts.
Private schools (regardless of their location in areas with high or low PM2.5 pollution) predominantly include students from middle-upper and high socioeconomic levels. Municipal schools, on the other hand, mostly have students from middle, lower-middle, or low SES. Subsidized schools, meanwhile, show a wide variability in SES, which could be related to the varying degree of access to resources and tools that might complement and enhance AP. Although this study compared SIMCE results between schools in areas with higher and lower air pollution from PM2.5 within the same administrative category to control SES as a potential influencing factor, it is important to consider this aspect when analyzing AP data in students.
Regarding the differences in the 2019 SIMCE scores for eighth grade between schools with different administrative dependencies, the highest average score was observed in a private school in a polluted area, with a weighting of 290.06 points, while the lowest score was in a municipal school in a non-polluted area, with a total of 235.50 points. These differences in scores between private and municipal schools can be explained, as proposed by Ahumada et al. in 2020, based on differences in SES. Private schools are generally associated with higher socioeconomic strata than municipal schools. Factors such as access to higher-quality education, opportunities to participate in academic skill development workshops and personal development programs, learning additional languages, and better infrastructure in educational institutions may all contribute to better AP in private schools compared to schools whose students belong to middle or lower SES levels [14].
Another phenomenon that could influence the AP of students, and which we do not know about as this information was not included in the databases we worked with, is school absenteeism. School absenteeism is a relevant quality indicator for the educational trajectory of children and youth in the country [27]. Students who repeatedly miss classes disrupt this process, which results in a loss of continuity in the development of learning objectives covered in class. This leads to an academic lag that is reflected in lower grades [28]. According to the Ministry of Education’s Center for Studies (MINEDUC), there is a higher percentage of students with severe absenteeism in urban areas (28% to 38%) compared to rural areas (19% to 32%), as well as a significant increase in private subsidized schools (22% to 34%) with students experiencing severe absenteeism [27]. In this research, we found that in private subsidized schools in more polluted areas, 27% were in rural areas, while in less polluted areas, no private subsidized schools were in rural zones. In municipal schools in more polluted areas, 49% are rural, compared to only 4% in less polluted areas. As for private schools, both in more and less polluted areas, all of them are in urban zones.
Despite the significant differences reported in this research between schools with high pollution and low pollution, the results should be interpreted with caution, as the effect size was small, indicating potential limitations that may be associated with variables such as socioeconomic level, gender, vulnerability, and the lack of an individual-level analysis, which should be incorporated into future studies.
Limitations of the Study: Although it was expected that the sample of private institutions would be smaller compared to subsidized and municipal schools, a significant difference was found between the number of private schools in less contaminated areas versus those in more contaminated areas. Focusing only on private schools in the most contaminated regions [28], the data consists of only five schools, which is a very small sample size. This could be considered a limitation of the study, as having more private schools could provide greater variability in scores, like what is observed in less contaminated areas. Nevertheless, the limited number of private schools is representative of what occurs in the country, as according to information available from the National Congress Library of Chile, in 2019 there were a total of 11,148 educational institutions in the country, of which 4879 were municipal schools (43.76%), 5599 were subsidized private schools (50.22%), and 670 were private schools (6.01%) [29]. It is also a limitation of this study that the database does not include information on Personal and Social Development Indicators (IDPS), which would allow for an analysis of factors such as parental education, self-esteem, motivation, school climate, self-perception, and academic self-assessment, all of which can influence students’ academic performance (AP). Access to this information would help us better understand the personal and social context of the students and their families and to determine whether a relationship exists between these factors and student learning. Furthermore, the database did not include gender-specific information. If this data had been available, we could have conducted a more in-depth individual analysis to explore whether gender influences AP. The absence of gender-related data prevents the exploration of potential differences in vulnerability to PM2.5 pollution. Investigating gender differences would be of particular interest, as evidence suggests that females tend to perform better in language, while males excel in mathematics. Additionally, the data did not provide information about students’ length of residence in the studied geographic areas, exposure to noise pollution [12,30,31], or whether their mothers were exposed to environmental pollutants during pregnancy.”. This information would be very useful for analyzing exposure duration and its potential effects on learning and, consequently, on students’ AP [18].
Lastly, this study focused exclusively on PM2.5 due to its recognized neurocognitive impact and the availability of reliable nationwide data. The inclusion of other environmental factors—such as exposure to other air pollutants or water quality indicators—was beyond the scope of this study but represents an important direction for future research.

5. Conclusions

Exposure to high concentrations of PM2.5 can lead to physical health issues in children, as well as influence other aspects of their development, such as learning and, consequently, AP. Our results indicate that eighth-grade students from subsidized Chilean schools located in areas with higher PM2.5 pollution showed lower SIMCE scores compared to their counterparts in geographic areas with lower exposure to PM2.5. In terms of comparing private schools with each other and municipal schools with each other in both zones, we did not observe differences in AP. These results suggest a potential association between PM2.5 pollution and academic performance, particularly in vulnerable educational contexts. However, the small effect size and the ecological nature of the data highlight the need for further research using individual-level data and more comprehensive control of confounding factors. On the other hand, the effect size of air pollution by PM2.5 on academic performance was small, so the results should be interpreted with caution.
It would be interesting to investigate other variables that may be affecting learning, such as physical condition, contamination of soil and water, as well as conducting an individual analysis of students, considering their family characteristics, parental education, healthy lifestyle habits, duration of residency in geographic areas, and whether mothers were exposed to environmental pollution during pregnancy. This would provide a broader perspective and consider the multiple variables that could influence school learning.

Author Contributions

Data curation, A.G.-R. and H.d.l.F.-M.; formal analysis, S.P., H.d.l.F.-M., A.G.-R., S.P., O.A., F.G.-G., P.S., P.A.L. and M.A.B.; investigation, A.G.-R., F.C.-H., C.C.-N., J.G.-S., M.P.-T., E.V.-Z., A.D.-G., M.V.-N., O.A., F.G.-G. and H.d.l.F.-M.; methodology, H.d.l.F.-M., P.S., P.A.L. and A.G.-R.; writing—original draft, A.G.-R., S.P., A.D.-G., M.V.-N., O.A., F.G.-G., P.S., P.A.L. and M.A.B.; writing—review and editing, A.G.-R. All authors have read and agreed to the published version of the manuscript.

Funding

The research work of H. de la Fuente-Mella was partially supported by Proyecto FONDECYT Regular. Código del Proyecto: 1230881. Agencia Nacional de Investigación y Desarrollo de Chile.

Institutional Review Board Statement

Not applicable.

Informed Consent Statement

Not applicable.

Data Availability Statement

The data used to support the findings of this study are available from the corresponding author upon request.

Acknowledgments

The authors acknowledge the schools that allowed them to conduct this research at their facilities and the Pontifical Catholic University of Valparaíso, and National Education Agency of the Ministry of Health of Chile. The authors also acknowledge the Proyecto FONDECYT de Iniciación of Paulo Salinas, código11200775, Agencia Nacional de Investigación y Desarrollo de Chile.

Conflicts of Interest

The authors declare no conflicts of interest.

References

  1. Castagna, A.; Mascheroni, E.; Fustinoni, S.; Montirosso, R. Air Pollution and Neurodevelopmental Skills in Preschool- and School-Aged Children: A Systematic Review. Neurosci. Biobehav. Rev. 2022, 136, 104623. [Google Scholar] [CrossRef] [PubMed]
  2. World Health Organization. WHO Global Air Quality Guidelines: Particulate Matter (PM2. 5 and PM10), Ozone, Nitrogen Dioxide, Sulfur Dioxide and Carbon Monoxide; World Health Organization: Geneva, Switzerland, 2021. [Google Scholar]
  3. Álamos, N.; Huneeus, N.; Opazo, M.; Osses, M.; Puja, S.; Pantoja, N.; Denier Van Der Gon, H.; Schueftan, A.; Reyes, R.; Calvo, R. High-Resolution Inventory of Atmospheric Emissions from Transport, Industrial, Energy, Mining and Residential Activities in Chile. Earth Syst. Sci. Data 2022, 14, 361–379. [Google Scholar] [CrossRef]
  4. Cory-Slechta, D.; Sobolewski, M.; Oberdörster, G. Air Pollution-Related Brain Metal Dyshomeostasis as a Potential Risk Factor for Neurodevelopmental Disorders and Neurodegenerative Diseases. Atmosphere 2020, 11, 1098. [Google Scholar] [CrossRef]
  5. Aronen, E.T.; Vuontela, V.; Steenari, M.-R.; Salmi, J.; Carlson, S. Working Memory, Psychiatric Symptoms, and Academic Performance at School. Neurobiol. Learn. Mem. 2005, 83, 33–42. [Google Scholar] [CrossRef] [PubMed]
  6. Wu, Y.-C.; Batterman, S.A. Proximity of Schools in Detroit, Michigan to Automobile and Truck Traffic. J. Expo. Sci. Environ. Epidemiol. 2006, 16, 457–470. [Google Scholar] [CrossRef]
  7. Sunyer, J.; Esnaola, M.; Alvarez-Pedrerol, M.; Forns, J.; Rivas, I.; López-Vicente, M.; Suades-González, E.; Foraster, M.; Garcia-Esteban, R.; Basagaña, X.; et al. Association between Traffic-Related Air Pollution in Schools and Cognitive Development in Primary School Children: A Prospective Cohort Study. PLoS Med. 2015, 12, e1001792. [Google Scholar] [CrossRef]
  8. Pastor, M.; Morello-Frosch, R.; Sadd, J.L. Breathless: Schools, Air Toxics, and Environmental Justice in California. Policy Stud. J. 2006, 34, 337–362. [Google Scholar] [CrossRef]
  9. Mohai, P.; Kweon, B.-S.; Lee, S.; Ard, K. Air Pollution Around Schools Is Linked to Poorer Student Health and Academic Performance. Health Aff. 2011, 30, 852–862. [Google Scholar] [CrossRef]
  10. Agencia de Calidad de la Educación. Características de las Pruebas y de los Cuestionarios de Calidad y Contexto de la Educación; Mnisterio de Educación, Gobierno de Chile: Santiago, Chile, 2023; pp. 1–20.
  11. Parra, S.; De La Fuente-Mella, H.; González-Rojas, A.; Bravo, M.A. Exposure to Environmental Pollution in Schools of Puchuncaví, Chile: Characterization of Heavy Metals, Health Risk Assessment, and Effects on Children’s Academic Performance. Sustainability 2024, 16, 2518. [Google Scholar] [CrossRef]
  12. Magloire Kaumbu Nsapu, I.; Okitundu Luwa E-Andjafono, D.; Matanda Nzanza, R.; Nyembue Tshipukane, D.; Kenda Makopa, I.; Sokolo Gedikondele, J.; Mambueni Thamba, C. Effects of Environmental Noise on School Performance among Hearing-Impaired Students. Int. J. Otolaryngol. Head Neck Surg. 2022, 11, 242–257. [Google Scholar] [CrossRef]
  13. Ministerios del Medio Ambiente de Chile. Sexto Reporte Del Estado Del Medio Ambiente 2021; Ministerios del Medio Ambiente de Chile: Santiago, Chile, 2021.
  14. Ahumada-Padilla, E.; Villarroel Del Pino, L.; Bustamante-Ara, N. Condición Física de Escolares Chilenos de 8° Año Básico y Su Relación Con El Rendimiento Académico. Rev. Chil. Pediatr. 2020, 91, 58. [Google Scholar] [CrossRef] [PubMed]
  15. MINEDUC. SIMCE; MINEDUC: Santiago, Chile, 2024.
  16. Agendia de Calidad d ela Educación del MINEDUC. Informe Técnico: Evaluaciones Nacionales Estandarizadas 2017; Agendia de Calidad d ela Educación del MINEDUC: Santiago, Chile, 2017.
  17. Flores Romero, R.; Arias Velandia, N.; Julia Guzmán, R. El Aprendizaje En La Escuela: El Lugar de La Lectura y La Escritura. Educ. Educ. 2006, 9, 117–133. [Google Scholar]
  18. Huneeus, N.; Urquiza, A.; Gayó, E.; Osses, M.; Arriagada, R.; Valdés, M.; Álamos, N.; Amigo, C.; Arrieta, D.; Basoa, K.; et al. El Aire Que Respiramos: Pasado, Presente y Futuro–Contaminación Atmosférica Por MP2,5 En El Centro y Sur de Chile; ANID/FONDAP/15110009; Centro de Ciencia Del Clima y La Resiliencia (CR)2: Santiago, Chile, 2020; 102p. [Google Scholar]
  19. Balakrishnan, U.; Tsaneva, M. Air Pollution and Academic Performance: Evidence from India. World Dev. 2021, 146, 105553. [Google Scholar] [CrossRef]
  20. Lin, C.-H.; Nicol, C.J.B.; Wan, C.; Chen, S.-J.; Huang, R.-N.; Chiang, M.-C. Exposure to PM2.5 Induces Neurotoxicity, Mitochondrial Dysfunction, Oxidative Stress and Inflammation in Human SH-SY5Y Neuronal Cells. NeuroToxicology 2022, 88, 25–35. [Google Scholar] [CrossRef]
  21. Gui, J.; Liu, J.; Han, Z.; Yang, X.; Ding, R.; Yang, J.; Luo, H.; Huang, D.; Chen, H.; Cheng, L.; et al. The Dysfunctionality of Hippocampal Synapses May Be Directly Related to PM-Induced Impairments in Spatial Learning and Memory in Juvenile Rats. Ecotoxicol. Environ. Saf. 2023, 254, 114729. [Google Scholar] [CrossRef]
  22. Lim, Y.-H.; Bilsteen, J.F.; Mortensen, L.H.; Lanzky, L.R.M.; Zhang, J.; Tuffier, S.; Brandt, J.; Ketzel, M.; Flensborg-Madsen, T.; Wimmelmann, C.L.; et al. Lifetime Exposure to Air Pollution and Academic Achievement: A Nationwide Cohort Study in Denmark. Environ. Int. 2024, 185, 108500. [Google Scholar] [CrossRef]
  23. Zhang, X.; Chen, X.; Zhang, X. The Impact of Exposure to Air Pollution on Cognitive Performance. Proc. Natl. Acad. Sci. USA 2018, 115, 9193–9197. [Google Scholar] [CrossRef]
  24. Lu, W.; Hackman, D.A.; Schwartz, J. Ambient Air Pollution Associated with Lower Academic Achievement among US Children: A Nationwide Panel Study of School Districts. Environ. Epidemiol. 2021, 5, e174. [Google Scholar] [CrossRef] [PubMed]
  25. Cheeseman, M.J.; Ford, B.; Anenberg, S.C.; Cooper, M.J.; Fischer, E.V.; Hammer, M.S.; Magzamen, S.; Martin, R.V.; Van Donkelaar, A.; Volckens, J.; et al. Disparities in Air Pollutants Across Racial, Ethnic, and Poverty Groups at US Public Schools. GeoHealth 2022, 6, e2022GH000672. [Google Scholar] [CrossRef]
  26. Bernardi, F.; Keivabu, R.C. Poor Air Quality at School and Educational Inequality by Family Socioeconomic Status in Italy. Res. Soc. Stratif. Mobil. 2024, 91, 100932. [Google Scholar] [CrossRef]
  27. Centro de Estudios del MINEDUC. Situación de La Desvinculación y La Asistencia, Año 2022; Centro de Estudios del MINEDUC: Santiago, Chile, 2023.
  28. División de Educación General MINEDUC. Abordaje Del Ausentismo Crónico; División de Educación General MINEDUC: Santiago, Chile, 2020.
  29. Biblioteca del Congreso Nacional de Chile. SIIT Estadísticas Territoriales; Biblioteca del Congreso Nacional de Chile: Santiago, Chile, 2019. [Google Scholar]
  30. Buchari; Matondang, N. The Impact of Noise Level on Students’ Learning Performance at State Elementary School in Medan. AIP Conf. Proc. 2017, 1855, 040002. [Google Scholar]
  31. Fretes, G.; Palau, R. The Impact of Noise on Learning in Children and Adolescents: A Meta-Analysis. Appl. Sci. 2025, 15, 4128. [Google Scholar] [CrossRef]
Figure 2. Comparison of scores on the SIMCE test of eighth-grade children living in areas with higher and lower PM2.5 pollution: (A) in language and (B) in mathematics. It is seen from the figure that students from high-polluted regions show lower scores in both language and mathematics. Values are expressed as mean ± standard deviation. Data normality was determined using the Kolmogorov-Smirnov test. Group comparisons were conducted using the t test; (*) p < 0.05. -POL: Least polluted areas; +POL: Most polluted areas.
Applsci 15 05474 g002
Table 1. Educational institutions in areas with higher or lower air pollution classified by administrative dependency.
Administrative Dependency Higher Air Pollution
(n = 134)
Lower Air Pollution
(n = 117)
Private schools5 (3.7%)24 (20.5%)
Subsidized private schools80 (59.7%)37 (31.6%)
Public schools49 (36.6%)56 (47.8%)
Data expressed as the number of schools and percentages (%) relative to the total of each group.
Table 2. Eighth-grade academic results in language and mathematics in private, subsidized private, and public schools in areas with higher and lower air pollution.
Higher Air PollutionLower Air Pollutionp Value
Language
Private schools280.8 ± 5.2255.6 ± 30.20.08
Subsidized private schools234.0 ± 21.4251.4 ± 20.1<0.0001
Public schools234.1 ± 23231.6 ± 17.30.52
Mathematics
Private schools303.4 ± 12.2282.2 ± 36.50.21
Subsidized private schools247.6 ± 26.7272.1 ± 23.0<0.0001
Public schools246.5 ± 24.2238.6 ± 17.20.05
SIMCE scores expressed as means ± standard deviation. Normality of the data was determined using the Kolmogorov-Smirnov test. Differences between groups were assessed using Student’s t-test with a p-value < 0.05 and a 95% confidence interval.
Disclaimer/Publisher’s Note: The statements, opinions and data contained in all publications are solely those of the individual author(s) and contributor(s) and not of MDPI and/or the editor(s). MDPI and/or the editor(s) disclaim responsibility for any injury to people or property resulting from any ideas, methods, instructions or products referred to in the content.

