Article

Experimental Study on Shear Mechanical Properties of Pile–Soil Interface Under Freezing Conditions

1
State Key Laboratory of Intelligent Construction and Healthy Operation and Maintenance of Deep Underground Engineering, China University of Mining and Technology, Xuzhou 221116, China
2
School of Mechanics and Civil Engineering, China University of Mining and Technology, Xuzhou 221116, China
3
College of Transportation Engineering, Nanjing Tech University, Nanjing 210009, China
*
Author to whom correspondence should be addressed.
Appl. Sci. 2025, 15(10), 5457; https://doi.org/10.3390/app15105457
Submission received: 11 April 2025 / Revised: 30 April 2025 / Accepted: 6 May 2025 / Published: 13 May 2025

Abstract

:
In order to explore the rules for the variation in the adfreeze shear strength at the interface between frozen soil and a pile foundation, and their influencing factors, a measuring system was developed to estimate the freezing strength at the interface by utilizing a pile-pressing method under a cryogenic environment. Experimental results demonstrate that the maximum vertical pressure on the pile top increased significantly with the decrease in temperature under the same moisture content. The shear stress–shear displacement curves, at the bottom part of the interface, presented strain-softening characteristics, while the strain-hardening phenomenon was observed at the upper part of the interface. The strength parameters of the interface decreased with the increase in the pile depth. Moreover, the influence of temperature on the shear strength of the interface was more significant compared with that of the moisture content. The research results can provide references for the construction of pile foundations, structural design optimization, and for frozen damage prevention and treatment in permafrost regions.

1. Introduction

The Qinghai–Tibet Plateau is the world’s highest and largest permafrost region in low- and middle-latitude regions [1]. With the implementation of national strategies, such as “the Belt and Road” construction and the new round of China Western Development, more and more engineering projects will be carried out in cold areas [2]. Under the background of permafrost degradation caused by climate warming and human activities, pile foundations have inestimable application prospects and will play an increasingly crucial role in permafrost engineering, due to their advantages of a high bearing capacity, small pile top settlement, and strong adaptability [3]. The vertical bearing capacity of a single pile in a permafrost area is mainly provided by the freezing strength of the frozen soil–concrete interface, which can be characterized by the interface shear strength along the pile [4]. However, the formation mechanism, the distribution, and the law of evolution of the freezing strength at the interface along the pile still need to be further studied, which limits the design and verification of pile foundations in cold regions. Therefore, the experimental and analytical investigation of the shear strength and influencing factors is a prerequisite for ensuring the security and stability of pile foundations, which has a certain guiding significance for the design, construction, and maintenance of pile foundations in cold regions.
According to Tratovich’s definition, the freezing strength of the frozen soil–concrete interface can be measured as shear strength [5]. In 1981, the freezing strength between piles and soils was successfully measured through experimental techniques [6,7]. Since then, many investigations on the shear properties of the soil–structure interface under frozen conditions have been conducted. Shi et al. [8] performed a shear test on an artificially frozen sand–structure interface during the freezing process, observing that the ice crystal content at the interface and the cementation of the interface increase with decreasing temperature. Wen et al. [9] performed direct shear tests on a frozen soil–concrete interface and reported that the freezing strength increases slightly with decreasing temperature. Chang et al. [10] investigated the development of shear strength, ice-cementation, and shear displacement/stress–shear of sand–concrete interfaces through a serious of frozen sand–concrete interface direct shear tests. He et al. [11] investigated the freeze–thaw cycling impact on the shear behavior of a frozen soil–concrete interface by direct shear tests. Wang et al. [12] presented an experimental study of the shear stress response, shear strength, and shear strength indexes of a soil–structure interface under frozen conditions by utilizing an improved roughness algorithm. Tang et al. [13] analyzed the shear strength characteristics of the frozen soil–structure interface during the thawing process. Sun et al. [14] conducted the orthogonal direct shear test considering the water content, freezing temperature, and freezing time. Liu et al. [15] performed a series of the shear tests for concrete piles, steel piles, and wood piles embedded in the silty clay at different freezing temperatures by using the static pressed-pile method. He et al. [16] performed direct shear tests of the contact surface between frozen silt and concrete under various temperatures and moisture contents by using a large stress-control shear apparatus. Lin et al. [17] performed a series of laboratory direct shear tests to evaluate the shear characteristics of wood–soil, concrete–soil, and steel–soil interfaces.
Most of the existing studies have focused on the strength mechanism of the frozen soil–structure interface at different temperatures, and the characteristics of the temperature and changes in the interface freezing strength have been obtained. The influence of factors (such as normal stress, moisture content, roughness, and boundary conditions) on the soil–structure interface has been analyzed. Although the shear mechanical properties and deformation mechanism of the unfrozen soil–structure interface have been extensively investigated, we still lack a thorough understanding of the distribution and evolution of the freezing strength at the soil–pile interface along the pile. This study focused on the shear mechanical properties of the pile–soil interface under freezing conditions. A measuring system for determining the freezing strength was developed and a series of experimental studies on the freezing strength at the interface were carried out under different temperature and water content conditions. Then, the mechanical behavior of the interface was discussed and the strength parameters for along the pile–soil interface in permafrost regions were proposed.

2. Equipment and Methods

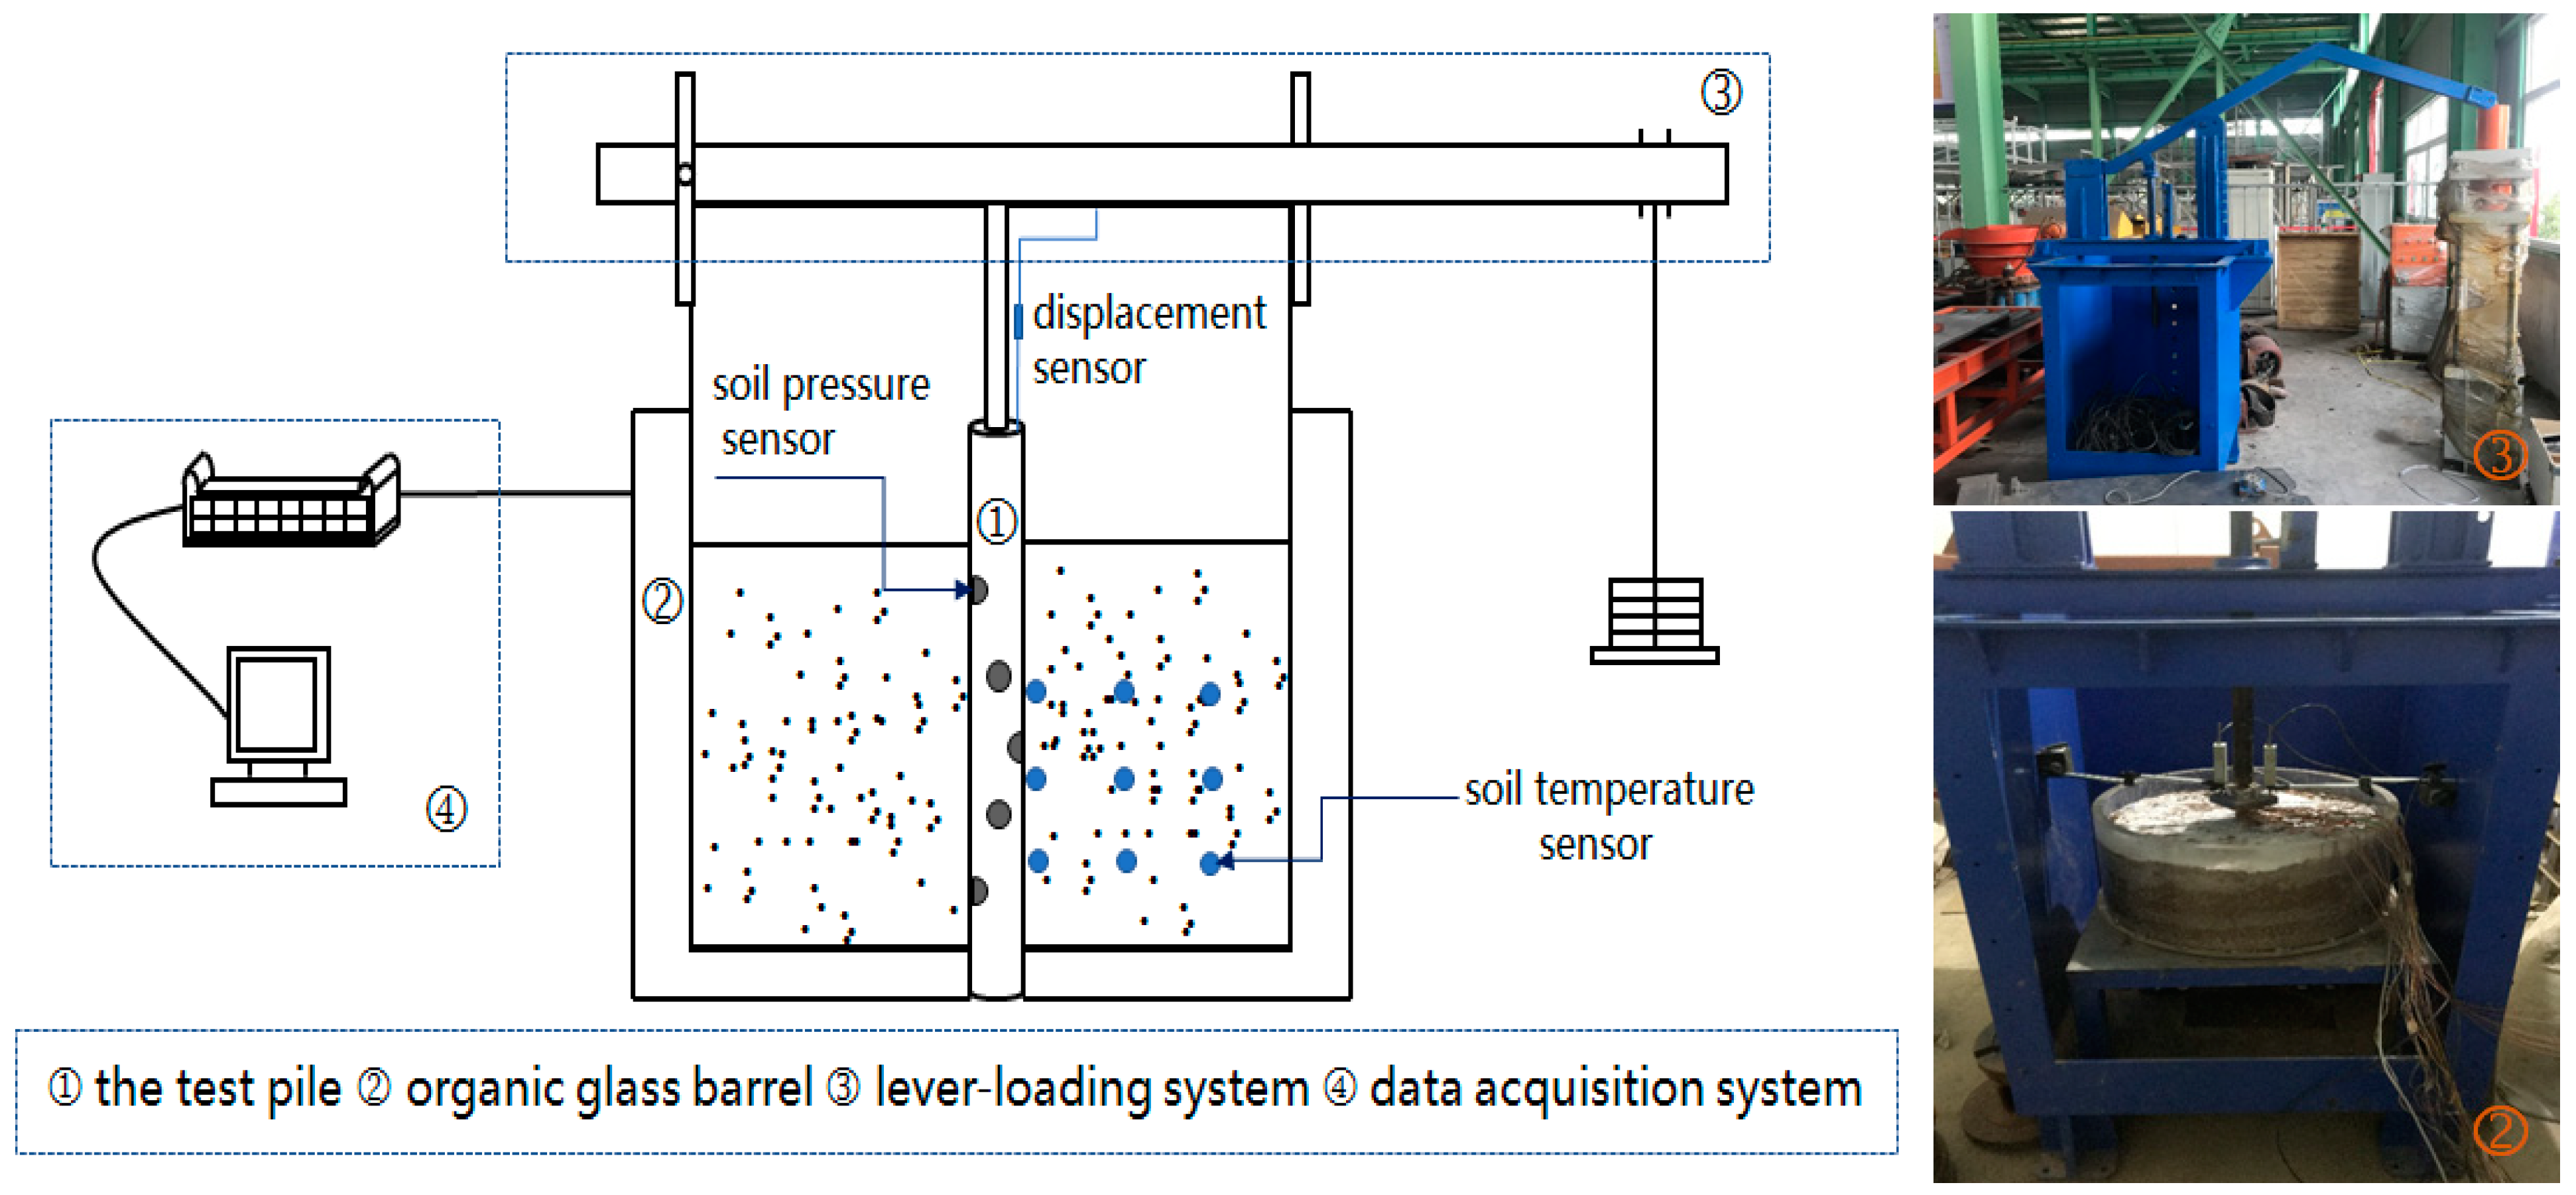
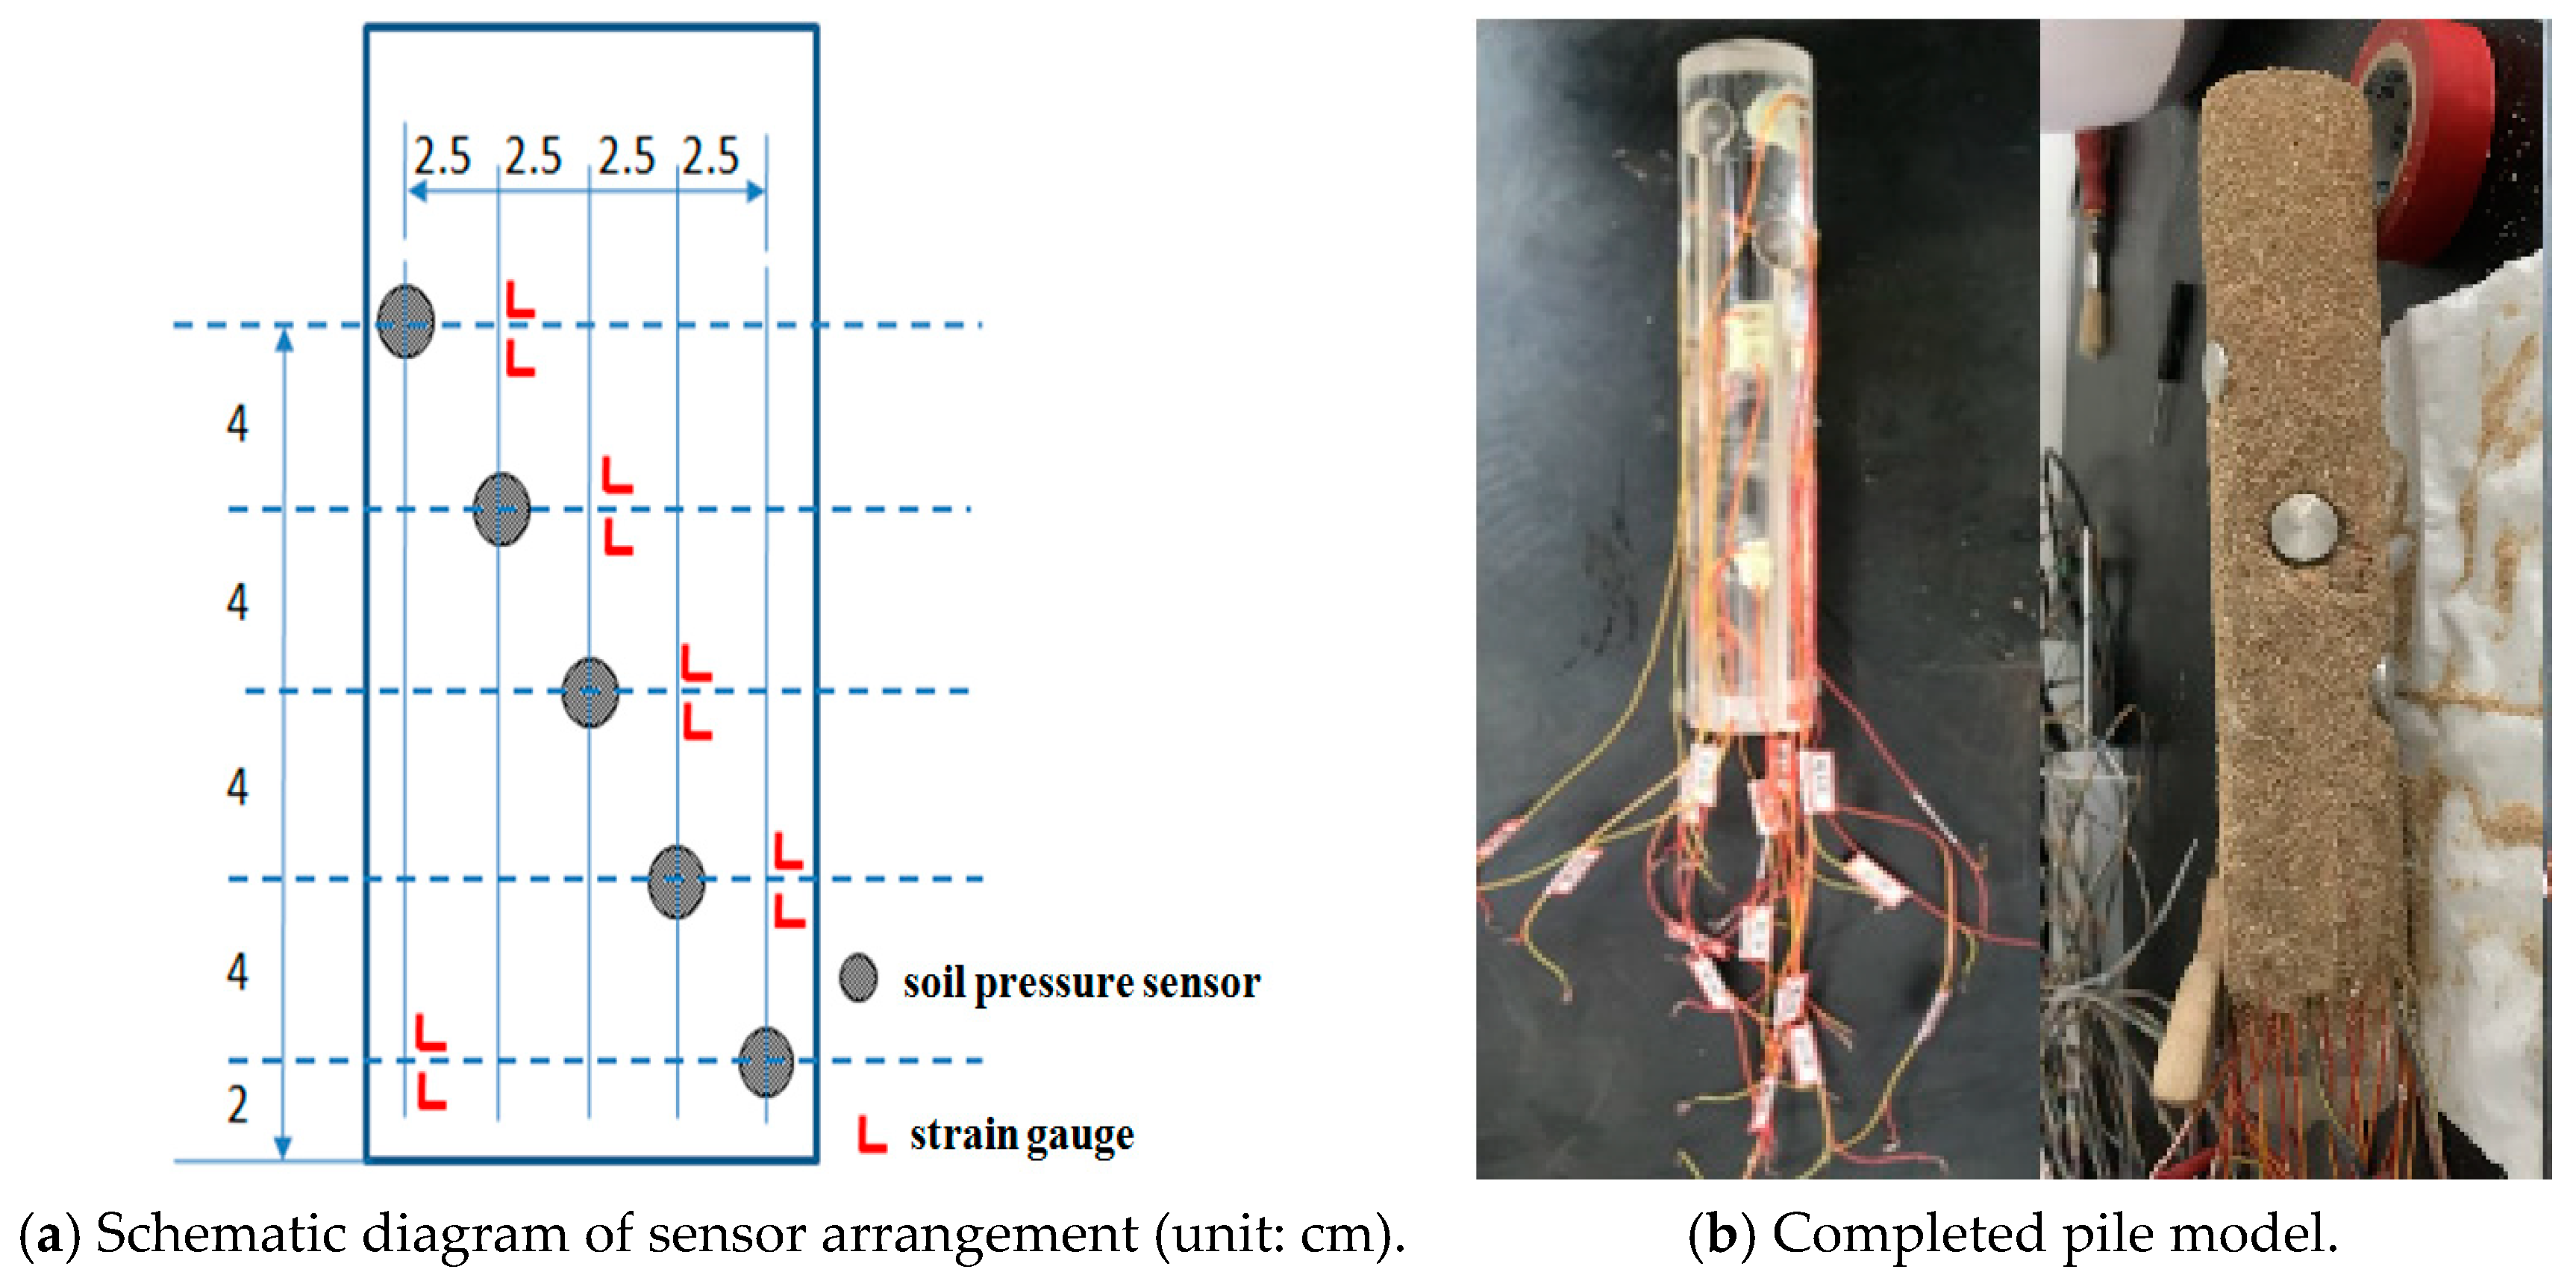
2.1. Experimental Instruments

A pile-pressing test system for freezing strength under low-temperature environments is developed, and the structure diagram of the test system is illustrated in Figure 1. The system mainly included four parts: a test bench, temperature control system, loading system, and a data acquisition system. The test bench included a soil container and the test pile. A transparent organic glass barrel with a height of 270 mm and an inner diameter of 640 mm was utilized to contain the soil, and a circular hole (geometric diameter: 44 mm) was drilled at the center of the bottom surface. The test pile fixed in the center of the container was threaded through the hole, with a diameter of 40 mm and a length of 250 mm. A series of micro soil pressure sensors and strain gauges were installed along the pile. Additionally, some soil-temperature sensors were installed in the soil at 5 cm, 10 cm, and 15 cm depth, respectively. At each depth, three soil temperature sensors were positioned at 0 cm, 8 cm, and 16 cm away from the pile side.
The pile-pressing test was conducted in the low-temperature laboratory where the temperatures were controlled by a constant temperature refrigeration system. The temperatures of the soil around the pile were monitored in real time using thermocouples and a data logger. A reasonable design of a lever-loading system was utilized to apply axial stress. The shear stress on the contact surface was calculated from the strain measured by the strain gauge, and then the shear strength was determined as well.

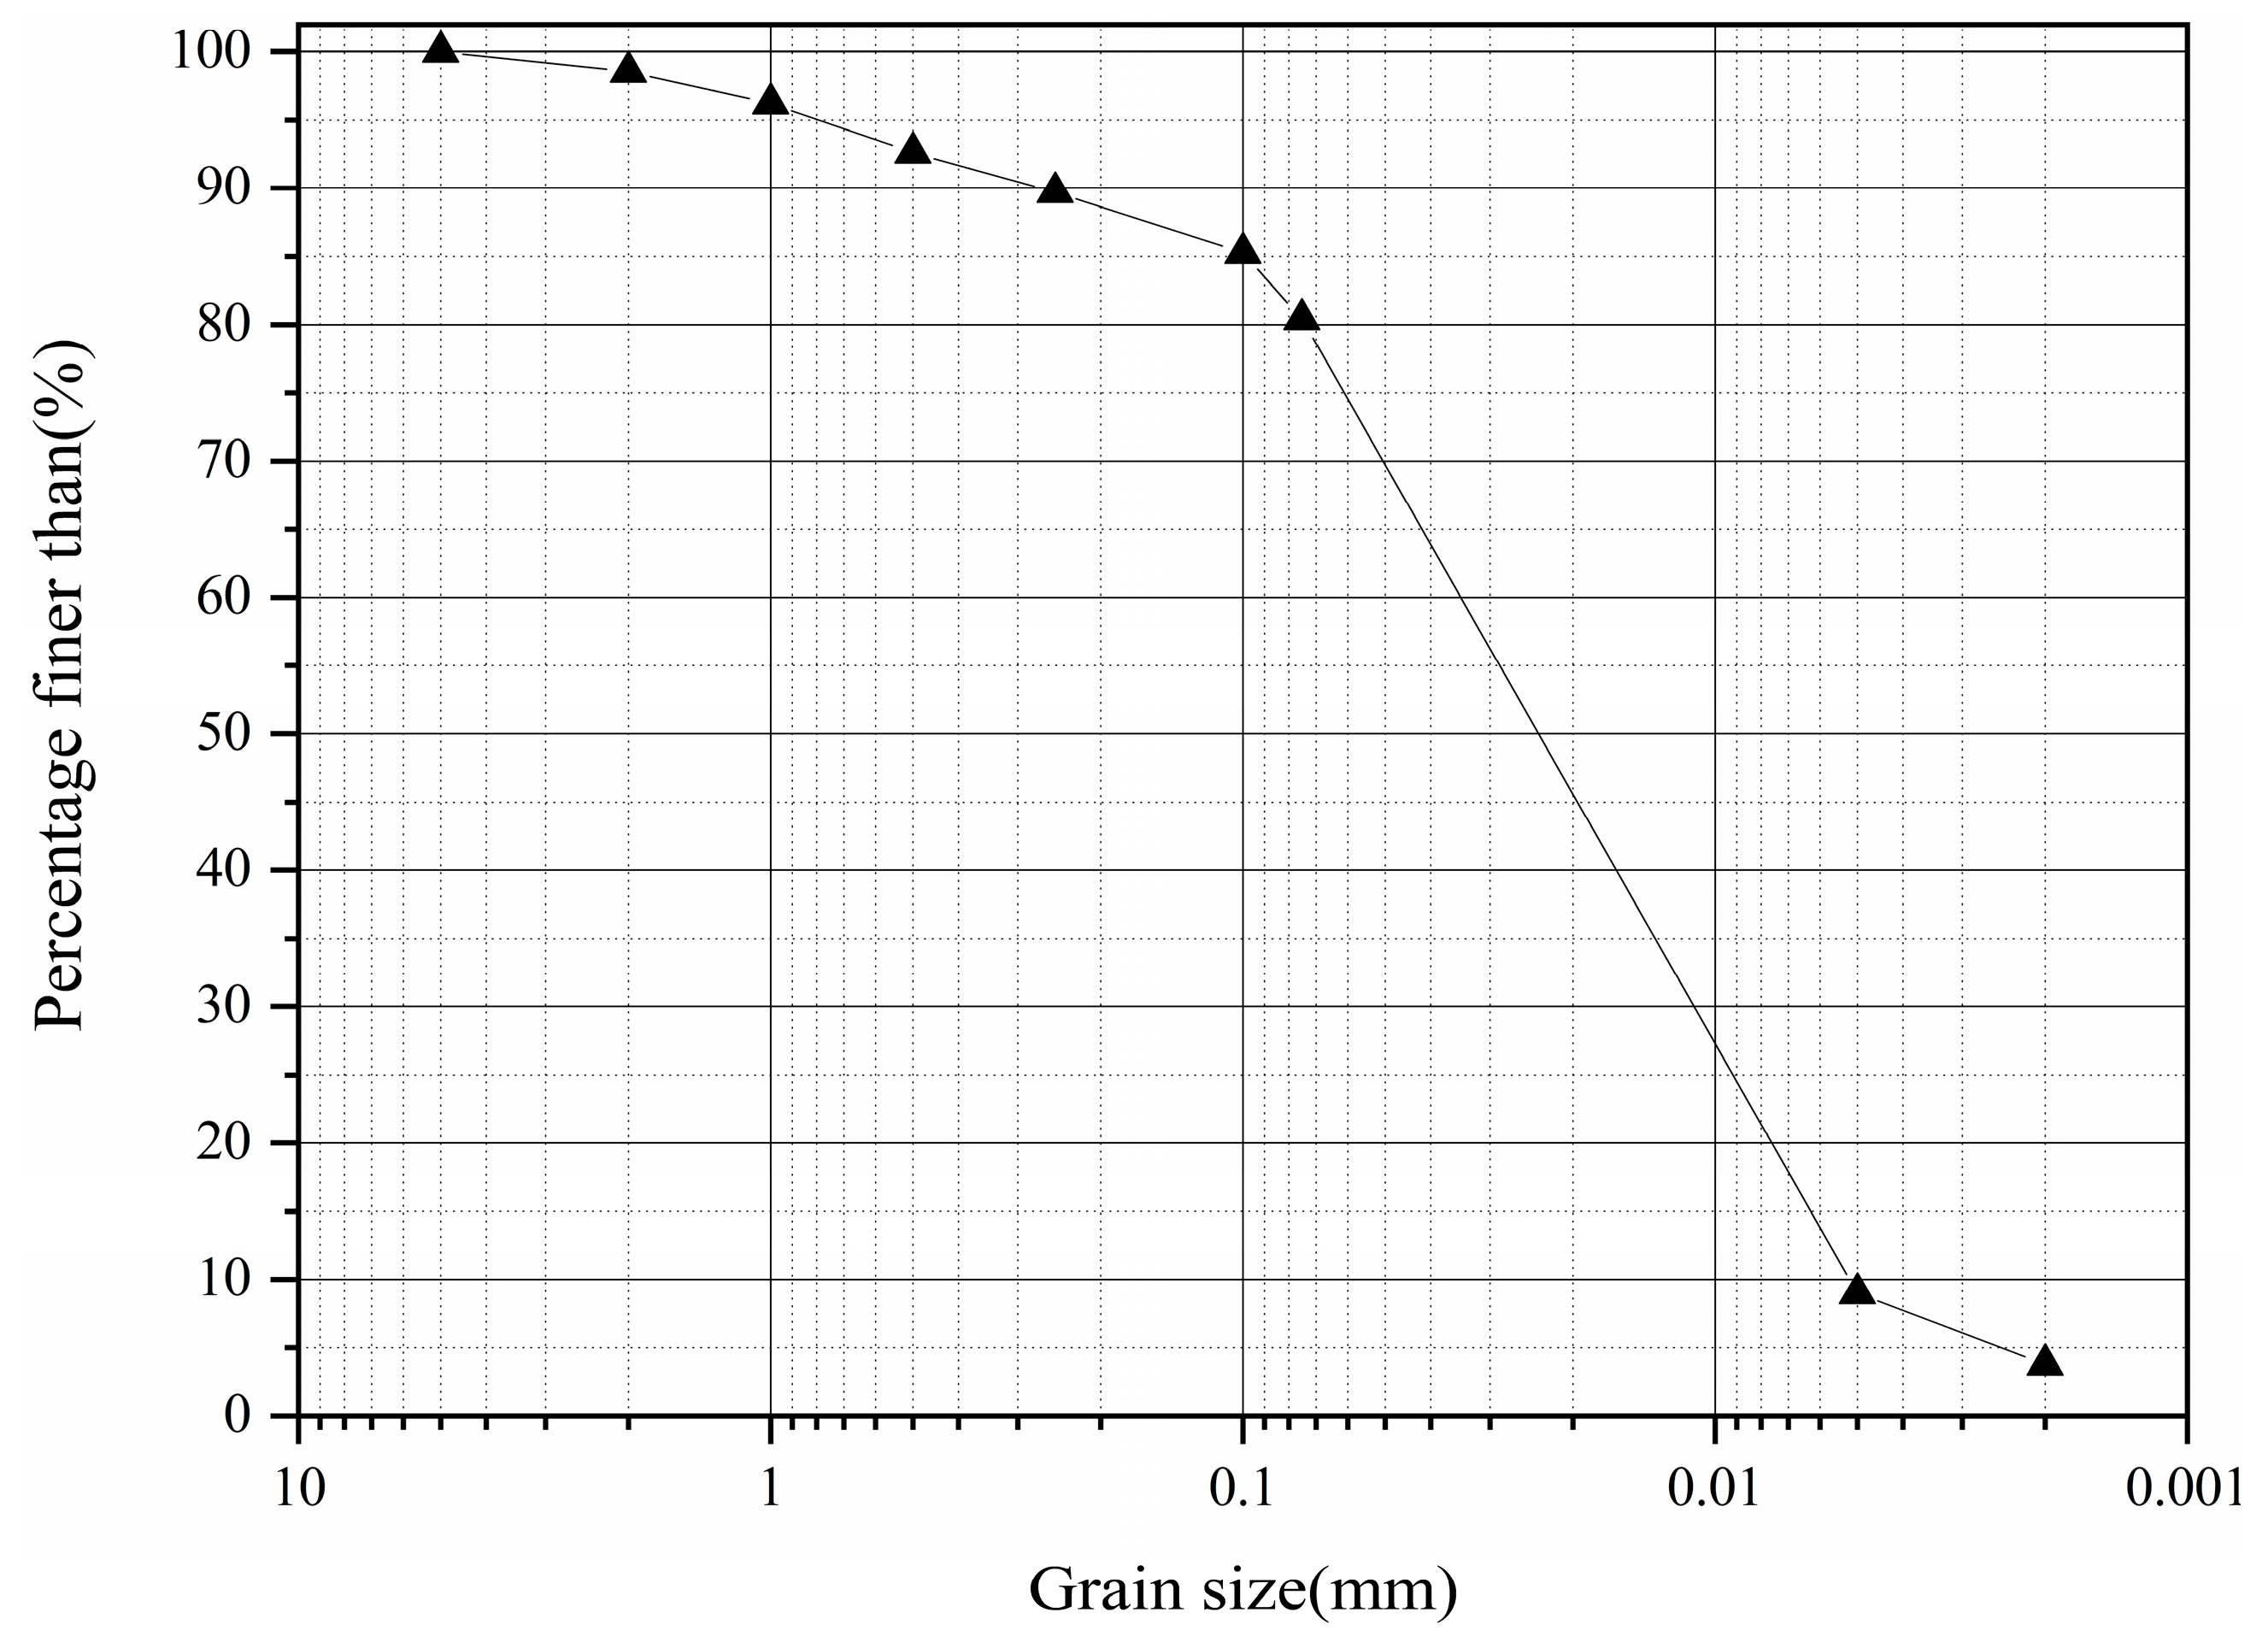
2.2. Materials and Methods

The soil samples selected from the permafrost regions along the Beilu River of Qinghai–Tibet Railway are mainly composed of silty clay. According to the standard soil test method (GB/T 50123-2019) [18], a series of tests including the liquid–plastic limit combined test, unit weight test, and proctor compaction test were conducted. Thus, the physical properties of soil samples were defined. The grain size distribution curve of the soil sample is displayed in Figure 2. The physical property indexes of the soil sample are presented in Table 1.
According to the existing results of the pile model tests, organic glass pipe can be regarded as an ideal model pile due to its excellent uniformity; this is incredibly beneficial for test design and data analysis [19]. In our pile-pressing test, an organic glass pipe with an elastic modulus E of about 3.17 GPa was selected as the substitute material for the model pile. Thermal conductivity and specific heat capacity of this material, as shown in Table 2, were investigated using a quasi-steady-state method.
The sensors and gauges were installed along the length of the pile and their arrangement is illustrated in Figure 3a. The micro soil pressure sensors with a diameter of 16 mm and a thickness of 4 mm had a wide test range of 0–1.5 MPa and achieved a testing accuracy of 0.01 MPa. The soil pressure sensors were embedded at different positions of the pile, presenting a spiral configuration. The distance of the lowest sensor to the bottom of the pile was 2 cm and each sensor was spaced 4 cm apart. Meanwhile, the strain gauges were mounted at the same height as the soil pressure sensors. Strain gauges were also used in a half-bridge configuration to measure the strain. Considering the surface of the organic glass pile was relatively smooth, the epoxy resin coating was evenly distributed on the surface of the pile after all sensors had been installed, and then a fine sand layer was adhered outside the pile in order to simulate the friction coefficients between the pile and soil [20]. The completed pile model is shown in Figure 3b.

3. Experimental Scheme and Testing Process

3.1. Experimental Scheme

Under the strict control of key experimental factors including soil temperature and water content, four sets of pile-pressing tests were designed. Considering the soil water content and the annual mean ground temperature in permafrost regions, the water content was controlled at 15 and 20%, and the soil temperature was controlled at −2 °C and −5 °C, respectively, in the model test. The test conditions are given in Table 3.
According to the technical Code for Testing of Building Foundation Piles, the pile-pressing test adopts the slow maintenance loading method. The staged load was about 1/10 to 1/15 of the maximum test load, i.e., 0.2 kN. Each subsequent load was added after measurement stability of the previous stage had been achieved. During the loading process of each stage, the experimental data, which included the displacement of the pile, the temperature of the soil, the normal pressure and tangential strain of the pile–soil interface, and the vertical load on the top of the pile, were collected by a DT85G data acquisition instrument, and the acquisition frequency was set to 2 Hz.

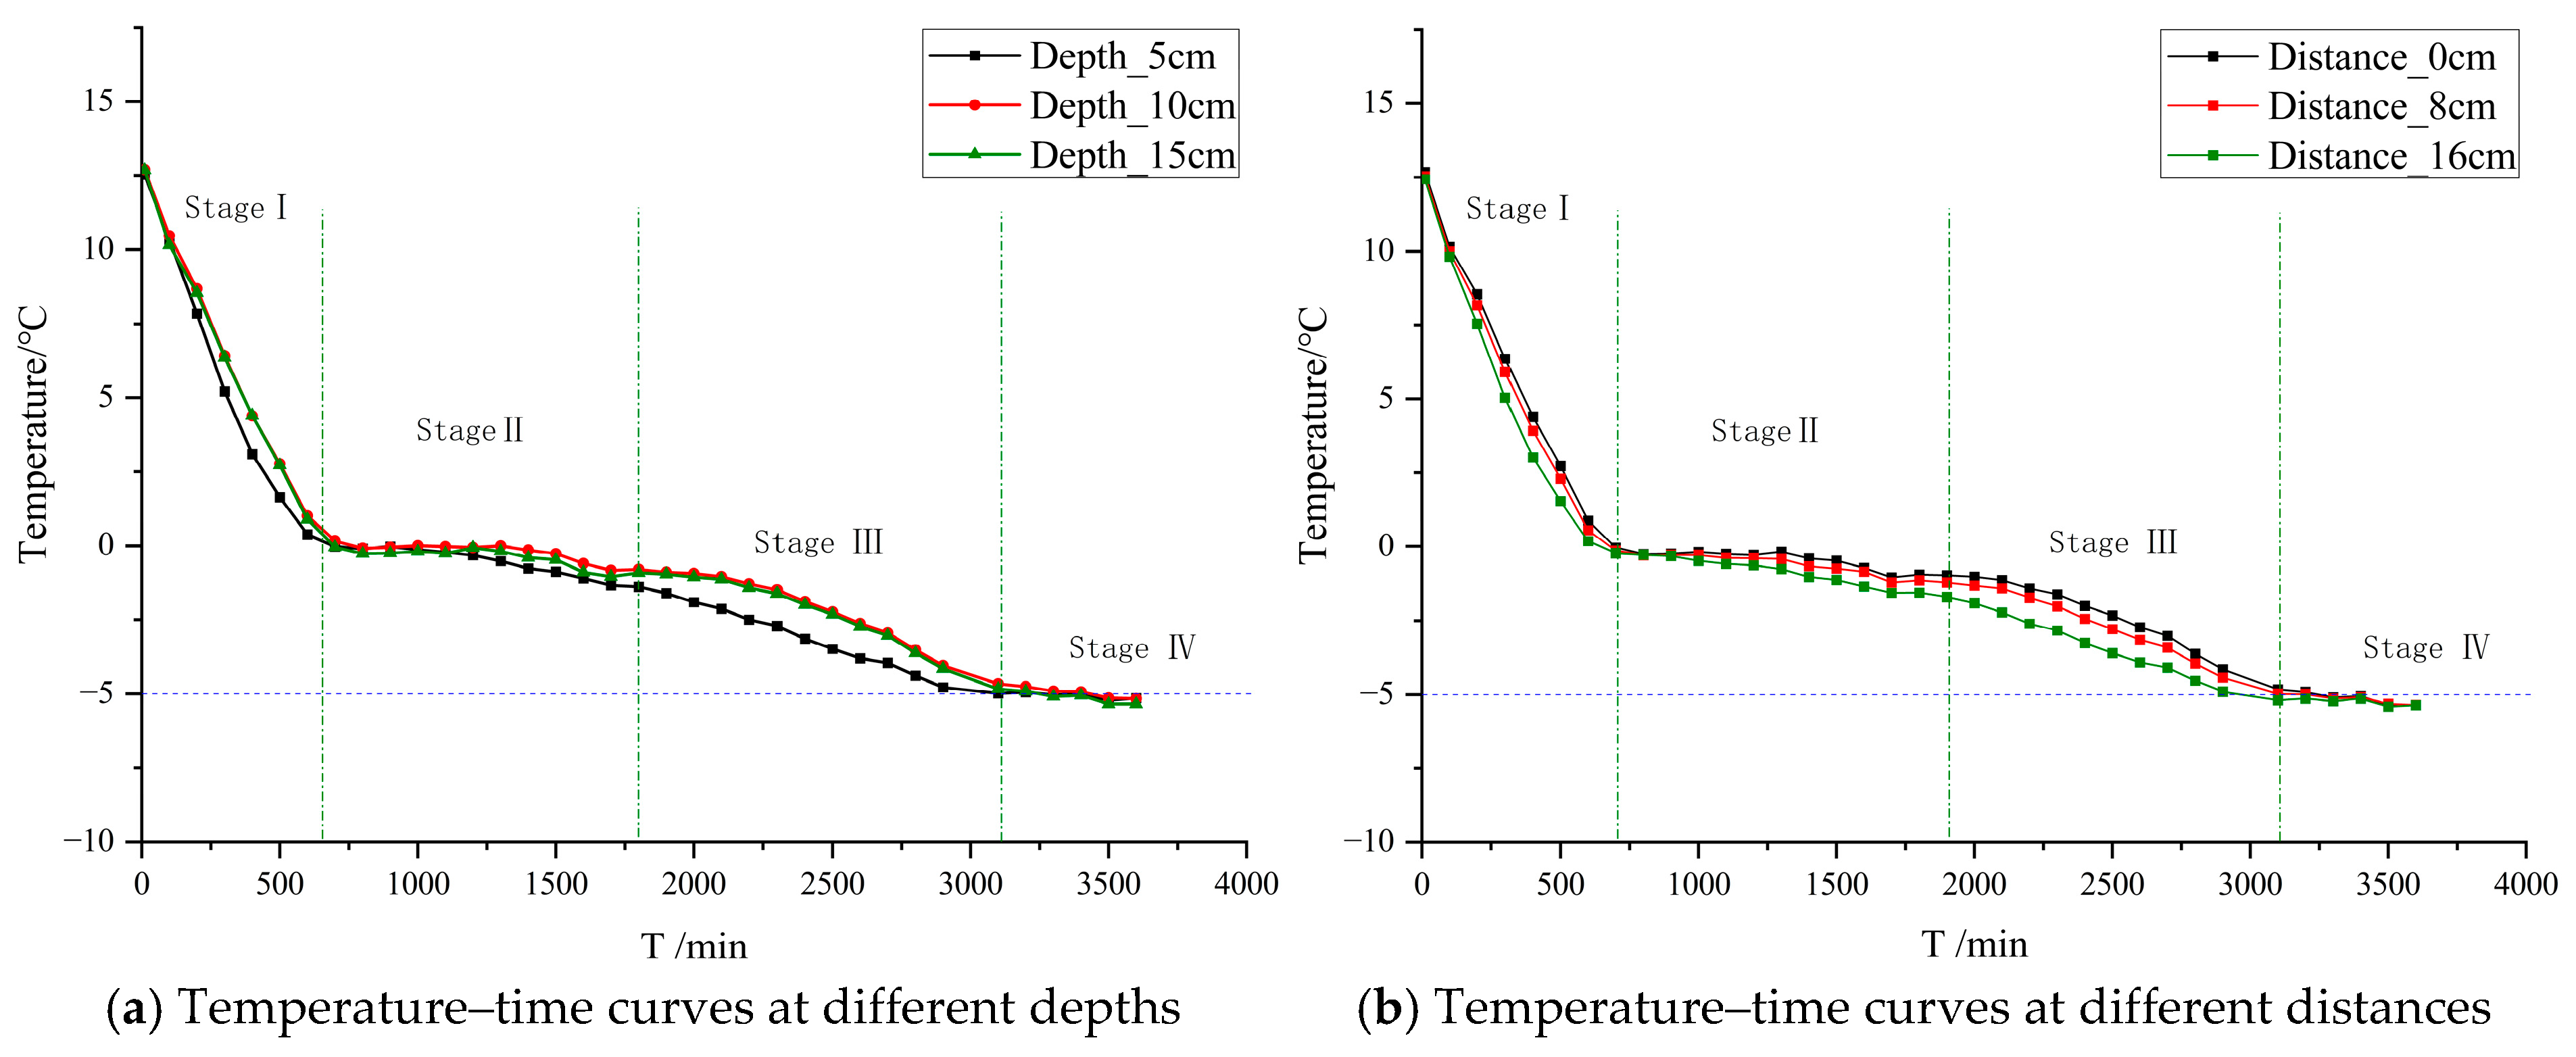
3.2. Testing Process

In order to study the variation characteristics of temperature and water content in the process of the pile-pressing test, the soil temperature and water content were monitored at different locations and the data were analyzed. Take a specific test condition (soil temperature −5 °C, water content 15%) as an example to illustrate the process. Figure 4a shows the temperature–time curves at different depths along the pile–soil interface. Figure 4b shows the temperature–time curves at burial depths of 15 cm, with different distances from the pile.
During the process of soil freezing, the variation trends of soil temperature could be divided into four stages, including the precipitous drop stage, stable phase transformation stage, soil freezing stage, and stable stage, respectively. It was observed that the cooling of the soil was characterized by a top-down process, and the soil started to freeze from the periphery inward. When the freezing time exceeded around 50 h, the temperature of the pile and surrounding soil varied little and stabilized near the target temperature.
As shown in Table 4, the final stable temperatures at each measuring point were compared, and the deviation of each value was within ±0.2 °C. The loading could not be implemented until the temperature at different positions of the organic glass barrel reached a steady state.
In this paper, moisture content before and after a pile-pressing test was compared. The remolded soil samples were prepared according to the target moisture content, then the initial moisture content of the soil was measured before the soil was packed in the organic glass barrel. Soil was placed in four layers, each 50 cm deep. After the pile-pressing test had been completed, three groups of soil samples were collected around the pile at 5 cm, 10 cm, and 15 cm depths, respectively. Then, the moisture content was re-measured and the comparison with the initial moisture content was conducted. Table 5 shows the comparison of soil moisture content at different depths before and after pile-pressing test, under the condition of −5 °C and a moisture content of 15%. With the decrease in temperature, the soil experienced an in situ freezing process. The water content in the soil varied from 1.62% to 7.25% and the average value was 4.85%, which indicated that the water migration during the soil freezing process in this experiment can be ignored.

4. Analysis of Test Results

In this study, four different experimental schemes were designed. In each experiment, several test trials were conducted to obtain the reliable data. Before the analysis of the test results, we first analyzed the available experimental data under different test conditions to ensure the reliability of the data. Subsequently, the analysis of experimental results, especially under different test conditions, was conducted.

4.1. P-S Curve Measured from Test

Figure 5 shows the P-S (axial pressure–vertical displacement) curves of the pile from the pile-pressing test and the field test. The field test was conducted in permafrost regions on the Chumar’he High Plain between the Kunlun and Tanggula mountains [21]. From the comparison, it was found that the results obtained from the pile-pressing test have a good agreement with the field test, which indicated that the observations from the laboratory-scale tests have a certain practical significance for actual pile systems in permafrost.
The P-S curve obtained from the pile-pressing test was consistent with the data taken directly from field tests. When the load was small, the vertical displacement at the top of the pile gradually increased with the increasing load, presenting a rising trend in the ascending stage. At the initial stage of loading, the pile–frozen soil interface was well cemented, and the bond structure of ice crystal was not destroyed. Therefore, the shear strength of the pile–soil interface was great, which indicated that the vertical displacement could be produced only after multi-stage loading. When the load reached a certain value, the P-S curve showed an apparent steep drop, which meant that the frozen state of the pile–frozen soil interface appeared to be damaged. Subsequently, the shear strength of the interface began to decline.
With the complete destruction of the frozen state between the interface, there existed a shear failure at the pile–frozen soil interface. At that moment, the pile continuously moved downward when the load was kept constant. In this case, the axial load on the top of the pile was entirely provided by the adfreezing strength at the interface between frozen soil and pile. The vertical bearing capacity of piles and the average adfreezing strength of the interface, under different test conditions, are given in Table 6. The average adfreezing strength increased with increasing moisture content, and this value also increased with the decreasing temperature. When moisture content varied from 15 to 20%, the average adfreezing strength increased from 50.76 kPa to 67.59 kPa under the test condition of a −2 °C temperature, and this value increased from 75.58 kPa to 86.31 kPa under the test condition of a −5 °C temperature. The variation in adfreezing strength change rate with temperature reached 8.27 kPa/°C under the test condition of a 15% moisture content, and this variation was 6.24 kPa/°C under the test condition of a 20% moisture content. Through a comparison of the adfreezing strength change rate, it was found that the temperature had a more significant impact on adfreezing strength.

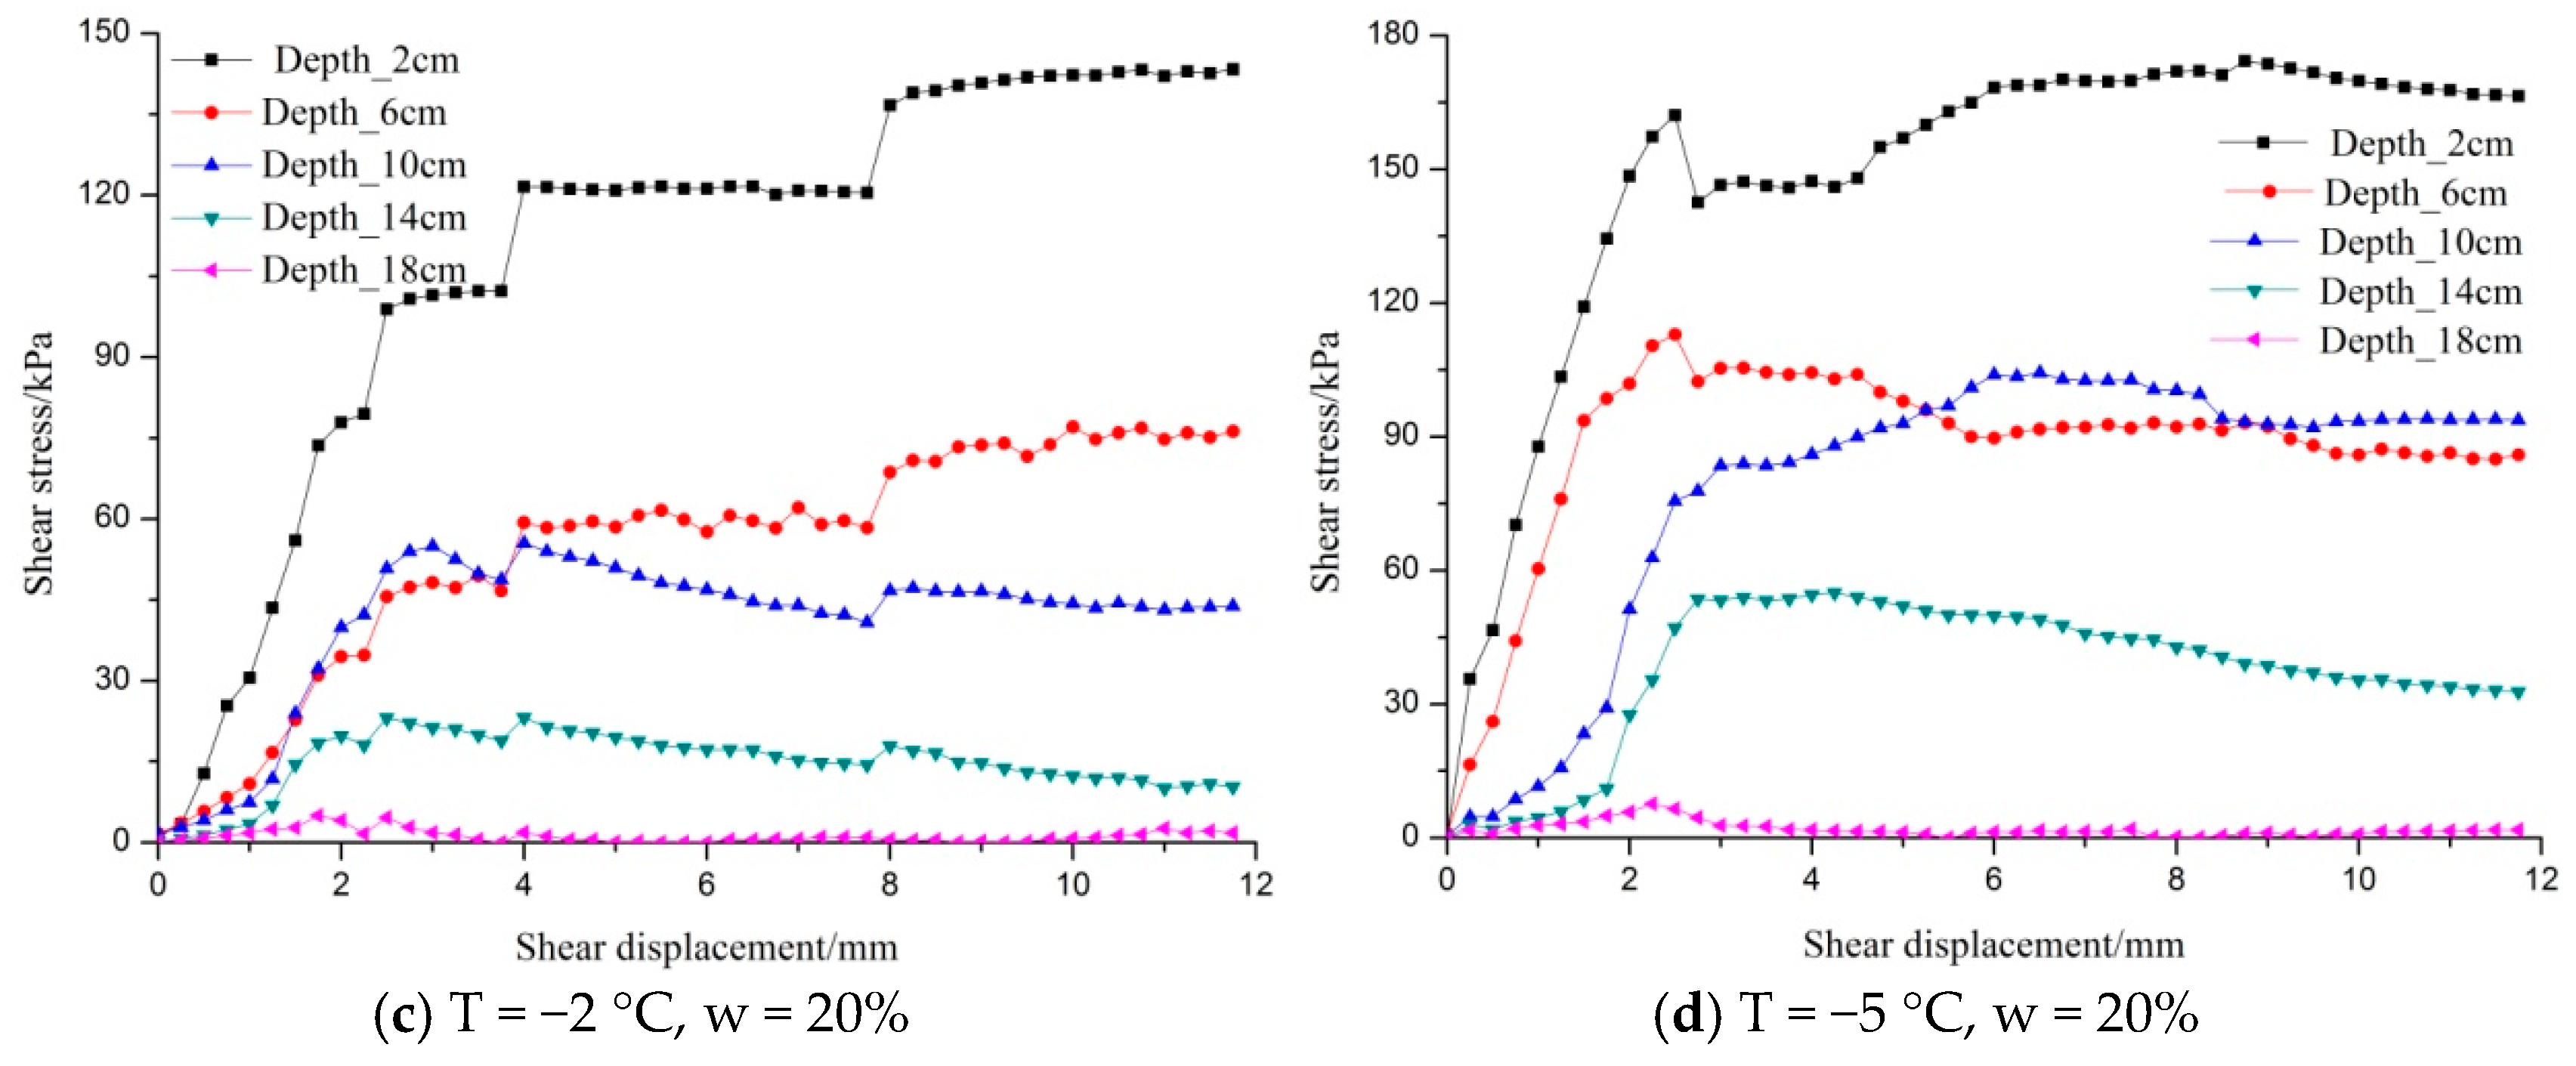
4.2. Relation Curves of Shear Stress and Shear Displacements

According to the load transfer method, Hooke’s Law is employed to calculate the axial force at the measured point based on the measured strain. Then, the average shear stress of the pile–soil interface can be determined, as the axial force of the pile can be balanced by the shear stress of the pile–soil interface [22]. Figure 6 shows the relation curves of shear stress–shear displacement of the pile side at different depths.
Under different test conditions, the shear stress–shear displacement curves at the lower part of the pile had obvious strain-softening characteristics. These curves could be categorized into three stages—an elastic deformation stage, a yield failure stage, and a residual stage. The shear stress at the pile–soil interface was different at different locations, showing that the shear stress decreased with the increase in depth under the same shear displacement condition. Moreover, the peak and residual shear strength also decreased with the increase in depth. For this type of curve, the peak value of shear stress is defined as the interface shear strength.
With the change in test conditions, the shear stress–shear displacement curves at the upper part of the pile had significant strain-hardening characteristics [23]. One of the premier causes of this is that the soil experienced a top-down cooling process, and thus the near-surface temperature was much lower. With the decrease in the temperature and increase in moisture content, the cementation between the ice in the frozen soil and pile were further enhanced. According to the provisions of the “Standard for Geotechnical Test Methods” (GB/T50123-2019, China) [18], for this type of stress–strain relation curve, when the shear displacement reaches 4 mm, its corresponding shear stress can be termed as the interface shear strength.
The shear strength at the interface between the frozen soil and pile, under different test conditions, is presented in Table 7. The interface shear strength attained the maximum value at the upper part of the pile, which decreased with the increasing pile depth. The results demonstrated that the interface shear strength increases with the increase in water content and the decrease in temperature. Under the test condition of a 15% moisture content, the interface shear strength reached its maximum value of 65.17 kPa at the temperature of −2 °C, while this increased to 145.88 kPa when the temperature dropped to −5 °C, with an increasing rate of 124%. Under the test condition of a 20% moisture content, the interface shear strength reached its maximum value of 121.62 kPa at the temperature of −2 °C, while this increased to 178.85 kPa when the temperature dropped to −5 °C, with an increasing rate of 47%. Under the test condition of a −2 °C temperature, the increasing rate of the interface shear strength reached 87% when the moisture content increased from 15% to 20%. While under the test condition of a −5 °C temperature, the increasing rate of interface shear strength reached 23% when the moisture content increased from 15% to 20%. Using the growth rate of interface shear strength as the evaluation index, it is indicated that the temperature change has a more significant impact on interface shear strength compared to the moisture content.

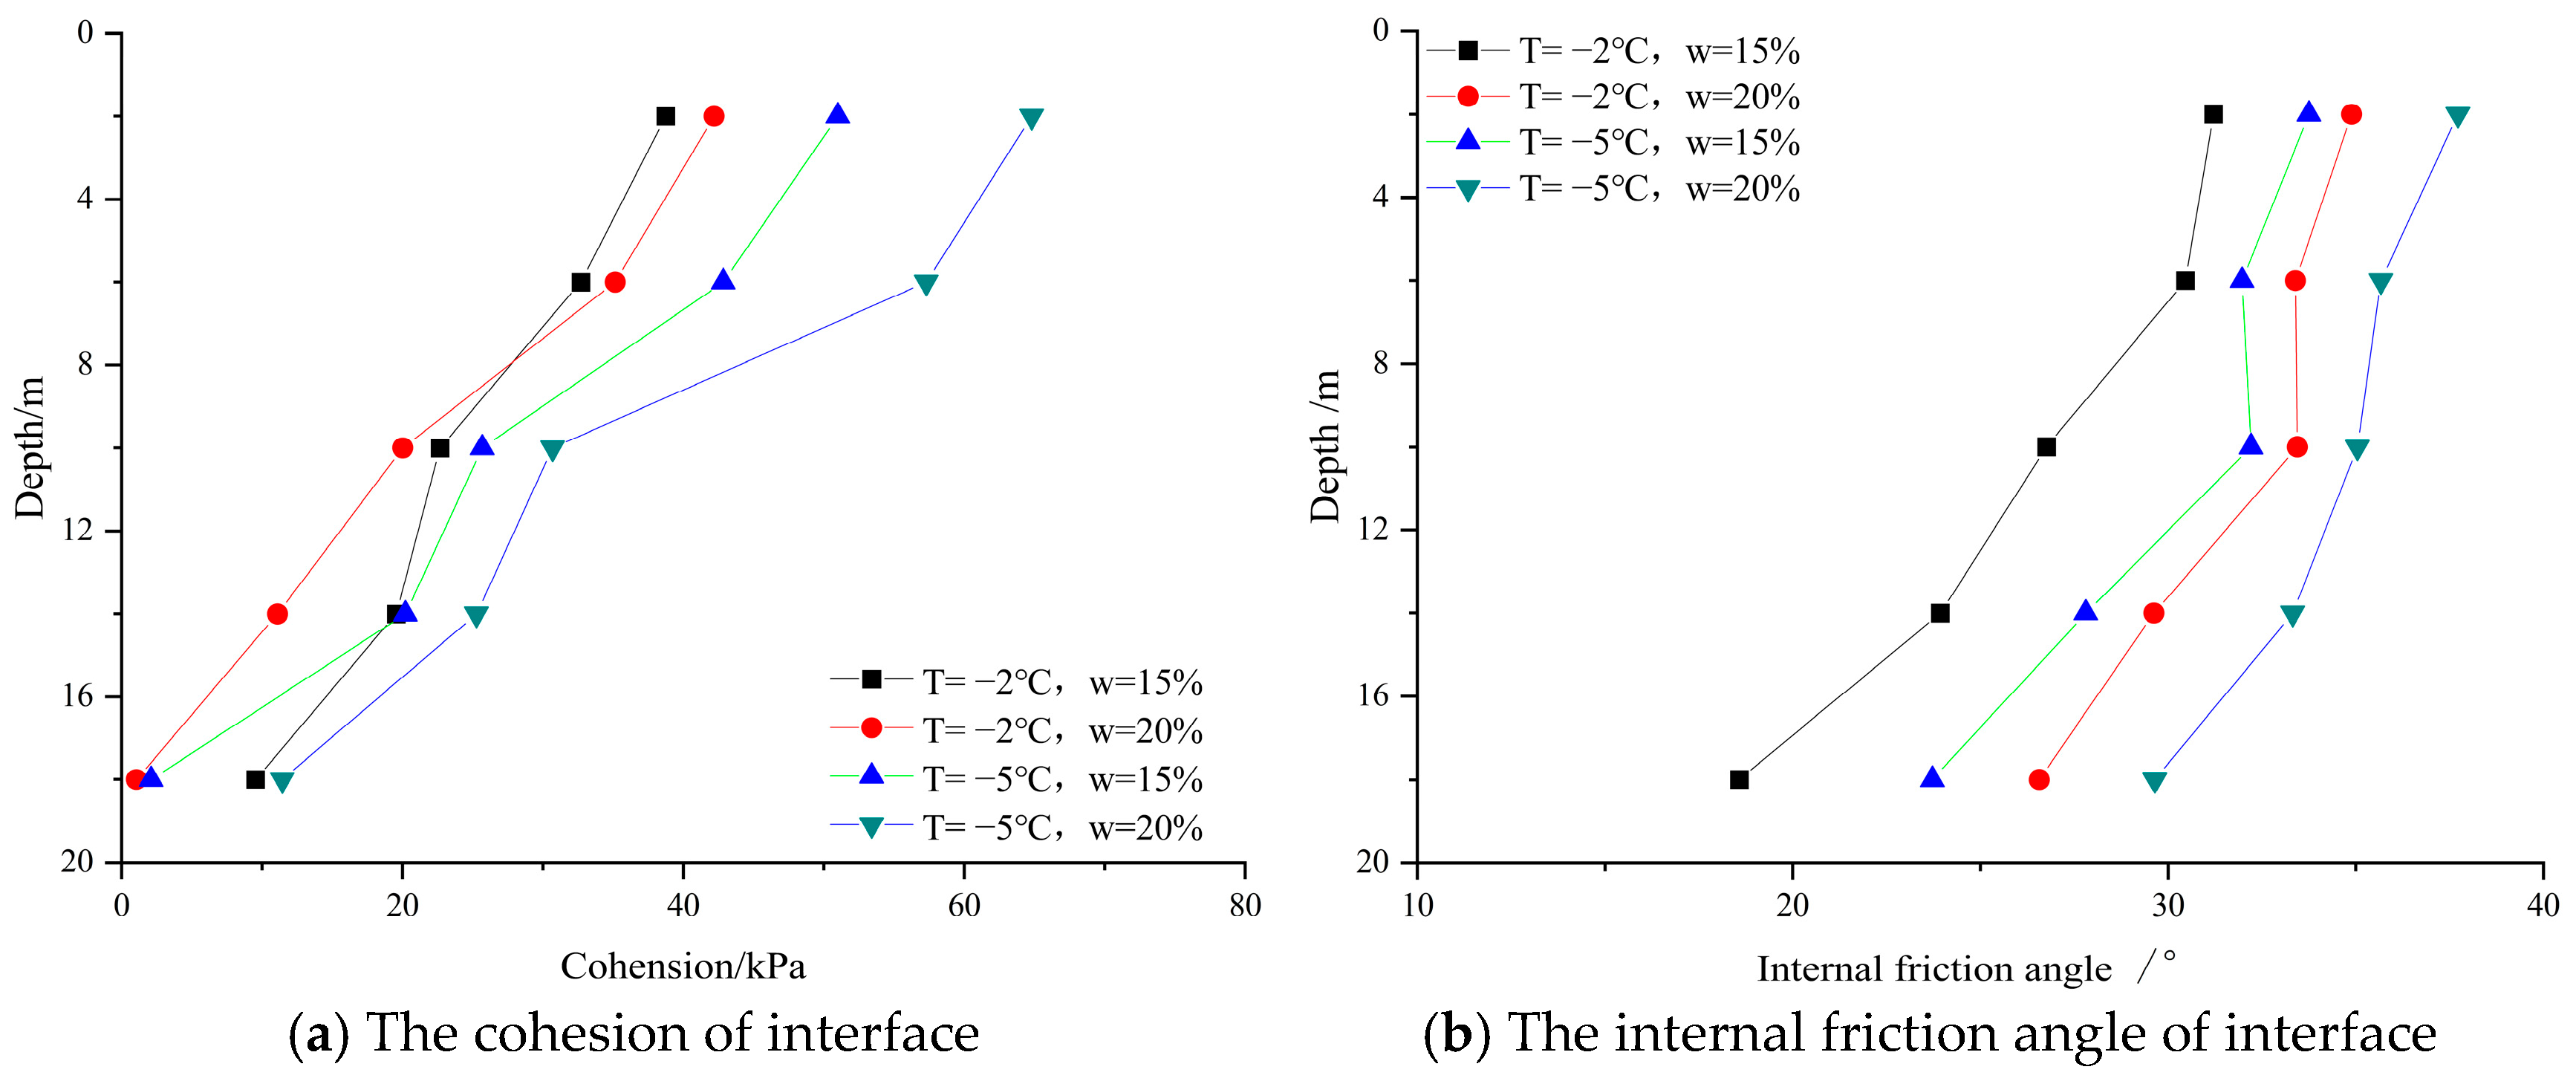
4.3. Variation in Strength Parameters of the Pile–Soil Interface

In the process of pile pressing, the shear strains of the pile at different positions were measured by the strain gauges, and the interface shear stresses at the corresponding positions were further calculated. Simultaneously, the normal pressure on the side surface of the pile at different positions, under different loading levels, was obtained through the micro-earth pressure box embedded in the pile. Then, the peak interface shear stress at different positions along the pile was approximately regarded as the interface shear strength, and the parameters were analyzed in combination with the average normal pressures. The results demonstrate that the interface shear strength at different positions along the pile has a good linear relationship with the average normal pressure, which can be described well by using the Mohr–Coulomb criterion. The variation characteristics of interface strength parameters at different positions along the pile are shown in Figure 7.
As shown in Figure 7, the interface strength parameters at different positions along the pile proved to have a decreasing tendency with the increase in the pile depth. The cohesion and internal friction angle of the interface at the upper part of the pile were greater than those at the lower part. Under the test condition of a −5 ° C temperature and 20% moisture content, the maximum interface strength parameters C and φ at the upper part were 64.8 kPa and 35.7°, respectively, while these parameters at the lower part decreased to 11.5 kPa and 29.6°. Under the same moisture content, the interface strength parameters increased with the decreasing temperature. Moreover, the interface strength parameters increased with the increasing moisture content while under the same temperature condition. Based on the comparison of the level of changes in the interface strength parameters with temperature and moisture content, it is concluded that the temperature has a more significant impact on interface strength parameters.

5. Conclusions

Based on the experimental studies on the freezing strength at the interface, the distribution and evolution of the interface shear strength along the pile were studied, and then the influence of temperature and moisture on the interface shear strength was elucidated. The main conclusions are summarized as follows:
(1) The shear stress–shear displacement curves at the lower part of the pile had obvious strain-softening characteristics, while the shear stress–shear displacement curves at the upper part of the pile had significant strain-hardening characteristics. The peak and residual shear strength decreased with the increase in depth.
(2) The temperature change had a more significant impact on interface shear strength, compared with the moisture content. Under the test condition of a 15% moisture content, the interface shear strength reached its maximum value of 65.17 kPa at the temperature of −2 °C, while this increased to 145.88 kPa when the temperature dropped to −5 °C, with an increasing rate of 124%.
(3) The cohesion and internal friction angle of the interface at the upper part of the pile were greater than those at the lower part. The interface strength parameters increased with the decreasing temperature. Moreover, the interface strength parameters increased with the increasing moisture content while under the same temperature.
In this study, only four parameters for moisture and temperature were controlled during the experiments; the preliminary experimental results indicate the shear mechanical properties of the pile–soil interface and the variation in the strength parameters, and a broader parametric study including the parameter sensitivity analysis would more firmly support conclusions that generalize.

Author Contributions

Conceptualization, T.C.; methodology, T.C. and J.W.; validation, Q.S.; formal analysis, Z.W.; writing—review and editing, Q.S.; funding acquisition, T.C. All authors have read and agreed to the published version of the manuscript.

Funding

This project is financially supported by the National Natural Science Foundation of China (No. 42371134), and the Open Fund of State Key Laboratory of Frozen Soil Engineering (No. SKLFSE201704).

Institutional Review Board Statement

Not applicable.

Informed Consent Statement

Not applicable.

Data Availability Statement

The original contributions presented in this study are included in the article. Further inquiries can be directed to the corresponding author.

Acknowledgments

We would like to express our sincere thanks to the anonymous reviewers for their valuable suggestions and constructive comments which greatly improved the presentation of this paper.

Conflicts of Interest

The authors declare no conflict of interest.

References

  1. Zhao, L.; Wu, T.; Xie, C.; Li, R.; Wu, X.; Yao, J.; Yue, G.; Xiao, Y. Support geoscience research, environmental management, and engineering construction with investigation and monitoring on permafrost in the qinghai-tibet plateau, China. Bull. Chin. Acad. Sci. 2017, 32, 1159–1168. [Google Scholar]
  2. Cheng, G.; Zhao, L.; Li, R.; Li, R.; Wu, X.; Sheng, Y.; Hu, G.; Zou, D.; Jin, H.; Li, X.; et al. Characteristic, changes and impacts of permafrost on Qinghai-Tibet Plateau. Chin. Sci. Bull. 2019, 64, 2783–2795. (In Chinese) [Google Scholar]
  3. Wu, Q.; Cheng, G.; Ma, W.; Niu, F. Technical approaches on permafrost thermal stability for Qinghai-Xizang Railroad. Geomech. Geoengin. 2006, 1, 119–128. [Google Scholar] [CrossRef]
  4. Liu, J.; Wang, T.; Tai, B.; Peng, L.V. A Method for Frost Jacking Prediction of Single Pile in Permafrost. Acta Geotech. 2020, 15, 455–470. [Google Scholar] [CrossRef]
  5. Tsytovich, N.A. Mechanics of Frozen Soil; Zhang, C.; Zhu, Y., Translators; Science Press: Beijing, China, 1985; pp. 178–183. [Google Scholar]
  6. Morgenstern, N.R.; Weaver, J.S. Pile design in permafrost. Can. Geotech. J. 1981, 18, 357–370. [Google Scholar]
  7. Aksenov, V.I.; Kistanov, O.G. Estimation of Resistance Components to an Axial Load on Piles Embedded in Permafrost. Soil Mech. Found. Eng. 2008, 45, 71–75. [Google Scholar] [CrossRef]
  8. Shi, Q.; Yang, P.; Wang, G. Experimental research on adfreeze strengths at the interface between frozen fine sand and structures. Sci. Iran. 2018, 25, 663–674. [Google Scholar]
  9. Wen, Z.; Yu, Q.; Zhang, J.; Dong, S. Experimental study on adfreezing bond strength of interface between silt and foundation of Qinghai-Tibetan transmission line. Chin. J. Geotech. Eng. 2013, 35, 2262–2267. [Google Scholar]
  10. Chang, J.; Liu, J.; Li, Y.; Wang, Q.; Hao, Z. Elastoplastic behavior of frozen sand—Concrete interfaces under cyclic shear loading. J. Zhejiang Univ.-Sci. A (Appl. Phys. Eng.) 2022, 23, 683–703. [Google Scholar] [CrossRef]
  11. He, P.-F.; Mu, Y.-H.; Ma, W.; Huang, Y.-T.; Dong, J.-H. Testing and modeling of frozen clay–concrete interface behavior based on large-scale shear tests. Adv. Clim. Change Res. 2021, 12, 83–94. [Google Scholar] [CrossRef]
  12. Wang, T.; Wang, H.; Hu, T.; Song, H.-F. Experimental study on the mechanical properties of soil-structure interface under frozen conditions using an improved roughness algorithm. Cold Reg. Sci. Technol. 2019, 158, 62–68. [Google Scholar] [CrossRef]
  13. Tang, L.; Du, Y.; Liu, L.; Jin, L.; Yang, L.; Li, G. Effect mechanism of unfrozen water on the frozen soil-structure interface during the freezing-thawing process. Geomech. Eng. 2020, 22, 245–254. [Google Scholar]
  14. Sun, F. Study on the Influence of Mechanical Properties of Frozen Soil on Bearing Capacity of Pile Under Freeze-Thaw Cycles and Temperature. Master’s Thesis, Xi’an University of Science Technology, Xi’an, China, 2017. [Google Scholar]
  15. Liu, Q.; Wang, Y.; Xu, X.; Zhao, Y.; Li, G.; Zhang, W. Experimental study on shear characteristics of the interface between the frozen silty clay and the pipe foundation. J. Glaciol. Geocryol. 2020, 42, 491–498. [Google Scholar]
  16. He, F.; Wang, X. Experimental research on the freezing strength of catenary foundation in electrification reconstruction project. J. Railw. Eng. Soc. 2023, 1, 5–12. [Google Scholar]
  17. Lin, C.; Wang, G.; Guan, C.; Feng, D.; Zhang, F. Experimental study on the shear characteristics of different pile-soil interfaces and the influencing factors. Cold Reg. Sci. Technol. 2023, 206, 103739. [Google Scholar] [CrossRef]
  18. GB/T 50123-2019; Soil Test Method Standard. Ministry of Housing and Urban-Rural Development of the People’s Republic of China; China Planning Press: Beijing, China, 2019.
  19. Yin, Z.; Shi, L. Pile behaviour in sand through experiments. Chin. J. Geotech. Eng. 1998, 20, 85–89. [Google Scholar]
  20. Huang, F.; Huang, W.-f.; Li, G.-x.; Lu, H. Study on the shaft fraction of single pile under compressive and tensile loading. Chin. J. Geotech. Eng. 1998, 20, 10–14. [Google Scholar]
  21. Jiang, D.J. Study on Pile-soil Interface Property and Vertical Bearing Behavior of Pile Foundation in Permafrost. Ph.D. Thesis, Lanzhou Jiaotong University, Lanzhou, China, 2019. [Google Scholar]
  22. Wang, R.; Wang, W.; Cheng, Y.-F. Model study of tensile bearing capacity of a single pile under frozen condition. J. Glaciol. Geocryol. 2006, 28, 766–771. [Google Scholar]
  23. Sun, Z.; Bian, H.; Wang, C.; Lu, X.; Qiu, X. Significance analysis of factors of freezing strength between silty clay and concrete lining. J. Glaciol. Geocryol. 2020, 42, 508–514. [Google Scholar]
Figure 1. Schematic diagram of test system.
Applsci 15 05457 g001
Figure 2. Grain size distribution curve.
Applsci 15 05457 g002
Figure 3. The organic glass pile model.
Applsci 15 05457 g003
Figure 4. Temperature–time curve during cooling process.
Applsci 15 05457 g004
Figure 5. The vertical pressure–pile displacement curve: (a) pile-pressing test and (b) field test.
Applsci 15 05457 g005
Figure 6. Relation curves of shear stress–shear displacement of pile side at different depths.
Applsci 15 05457 g006aApplsci 15 05457 g006b
Figure 7. The variation in interface strength parameters with depth.
Applsci 15 05457 g007
Table 1. Physical properties of soil samples.
Soil SampleWL/%WP/%IPWater Content/%Optimum Water Content/%Maximum Dry Density/(g/cm3)
Silty clay30.9014.7016.2020231.709
Table 2. Physical properties of plexiglass pile.
MaterialDensity
/kg·m−3
Elastic Modulus/GPaPoisson’s RatioThermal Conductivity/W·(m·K)−1Specific Heat Capacity/kJ·(kg·°C)−1
Plexiglass pile11802080.370.181530
Table 3. Test conditions.
Test NumberExperimental Factors
Water Content/%Soil Temperature/°C
115−2
215−5
320−2
420−5
Table 4. Comparison of soil temperatures at different measuring points (unit: °C).
Distance
/cm
0816
Depth
/cm
5−5.18−5.24−5.33
10−5.16−5.18−5.27
15−5.14−5.17−5.23
Table 5. Comparison of soil moisture content before and after test.
Location Depth
/cm
Moisture Content
Before Test
Moisture Content
After Test
Rate of Change
520.81%19.30%7.25%
1019.13%18.82%1.62%
1518.57%17.51%5.7%
Table 6. The maximum vertical pressure on the pile top under different test conditions.
Test ConditionVertical Bearing Capacity/NAverage Adfreezing Strength/kPa
T = −2 °C, ω = 15%1275.1750.76
T = −2 °C, ω = 20%1697.9667.59
T = −5 °C, ω = 15%1898.5675.58
T = −5 °C, ω = 20%2167.9986.31
Table 7. The interface shear strength under different test conditions (kPa).
Measured LocationsT = −2 °C, ω = 15%T = −5 °C, ω = 15%T = −2 °C, ω = 20%T = −5 °C, ω = 20%
Depth_2 cm65.17145.88121.62178.75
Depth_6 cm51.55102.9359.30121.71
Depth_10 cm27.9084.2355.4784.96
Depth_14 cm26.1555.0023.1837.04
Depth_18 cm7.6516.624.9919.69
Disclaimer/Publisher’s Note: The statements, opinions and data contained in all publications are solely those of the individual author(s) and contributor(s) and not of MDPI and/or the editor(s). MDPI and/or the editor(s) disclaim responsibility for any injury to people or property resulting from any ideas, methods, instructions or products referred to in the content.

