
Crack Identification for Bridge Condition Monitoring Combining Graph Attention Networks and Convolutional Neural Networks

Abstract
1. Introduction
2. Methodology
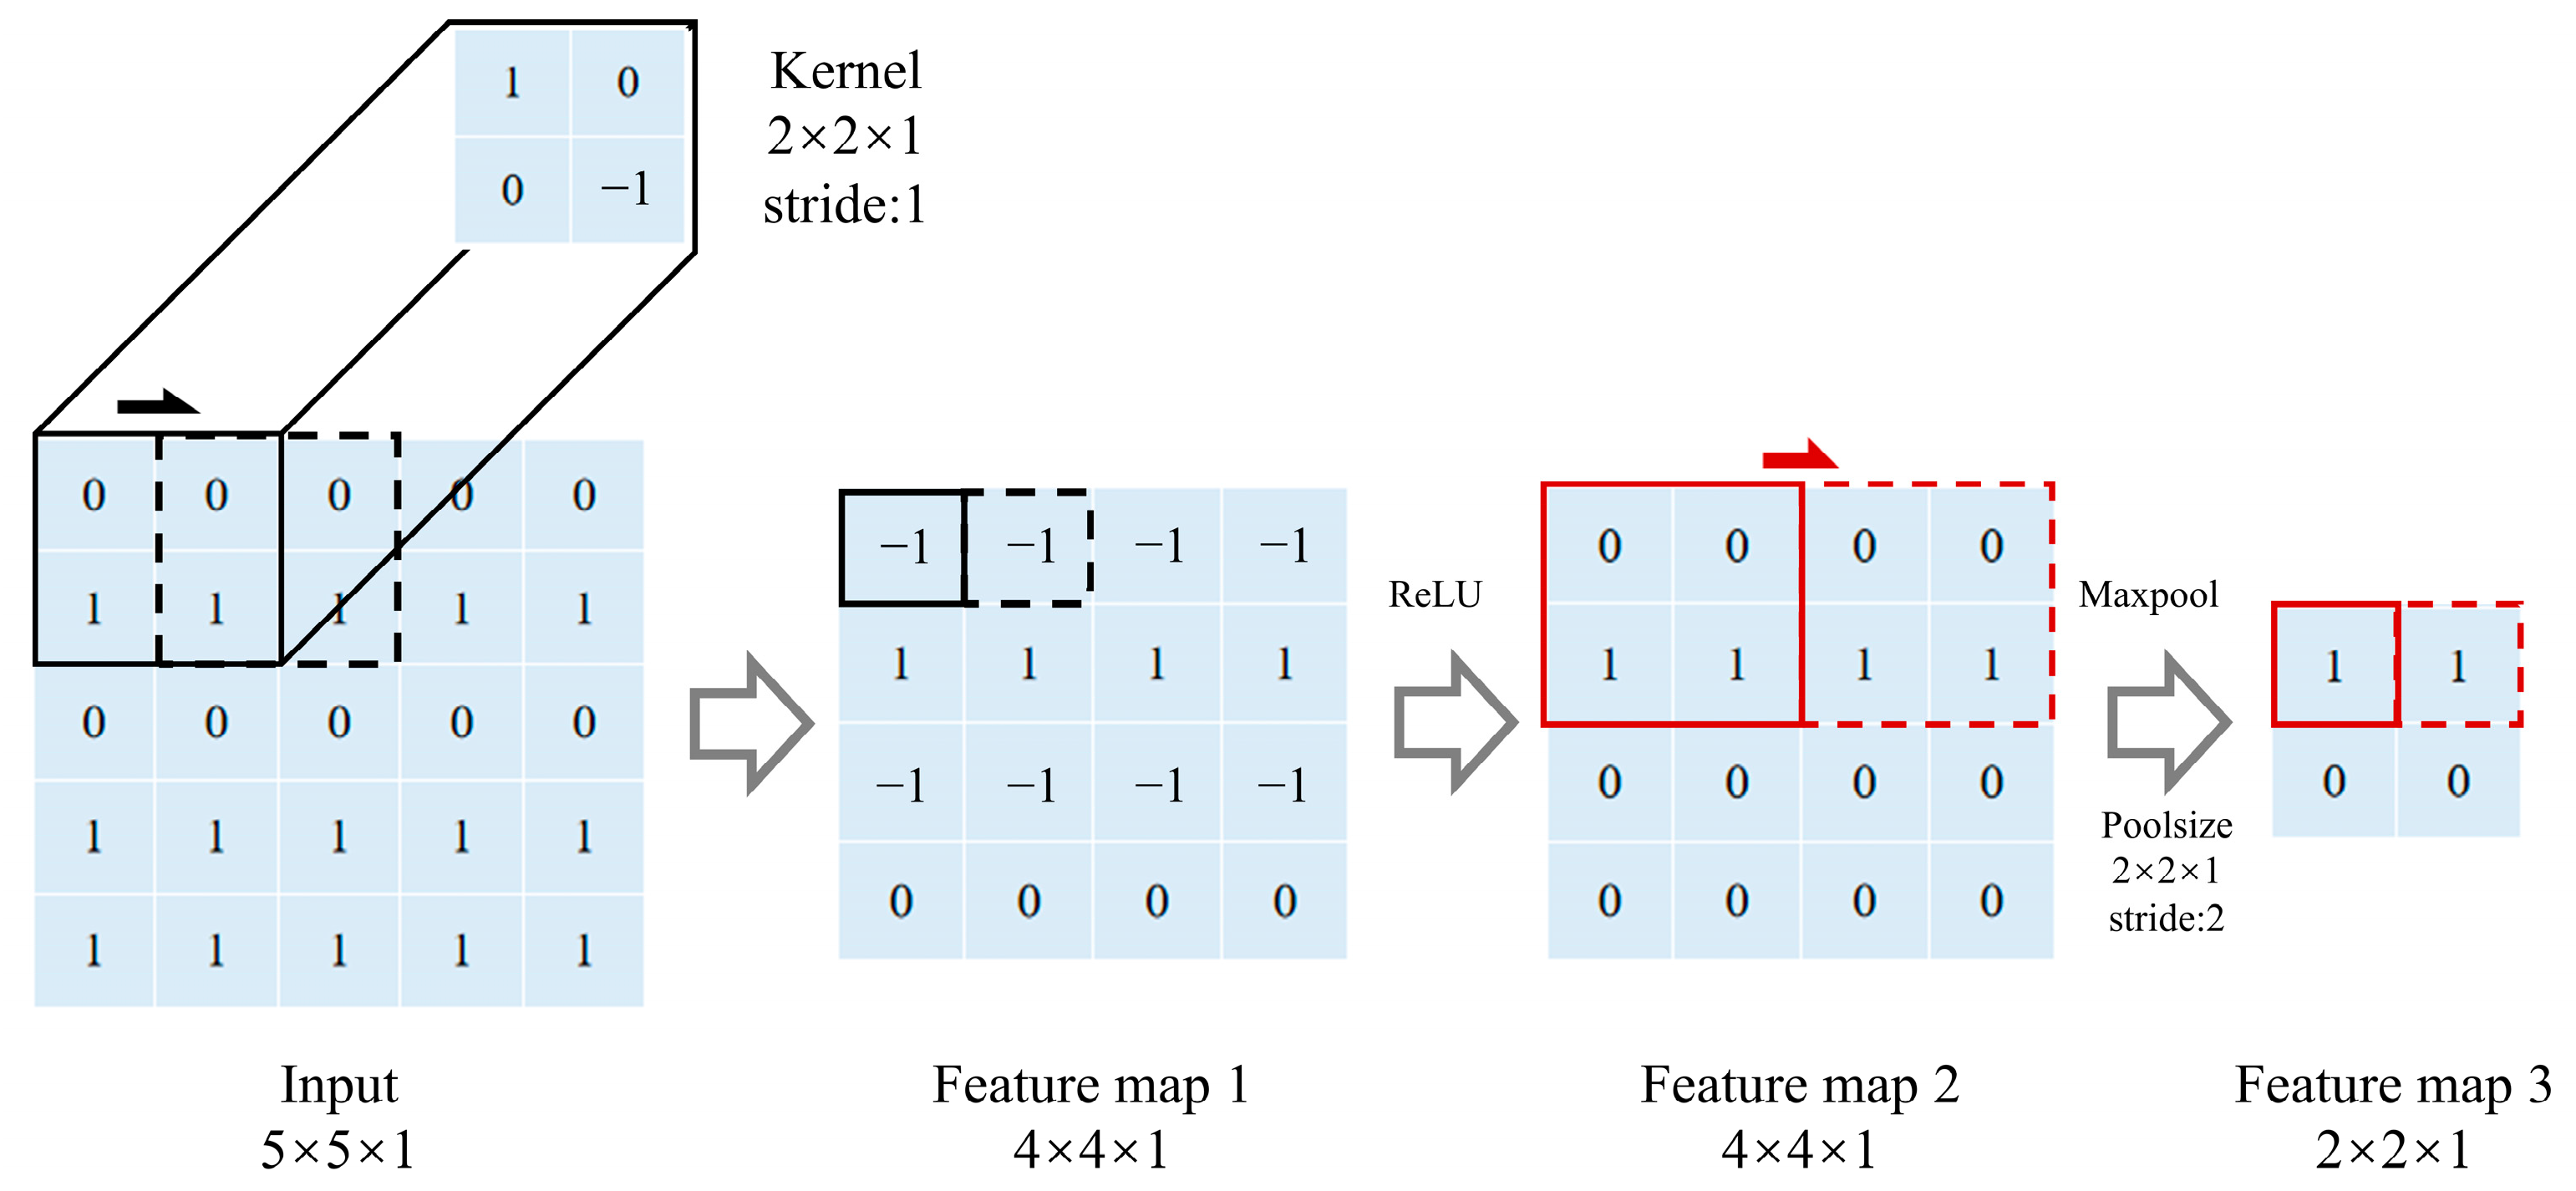
2.1. CNN
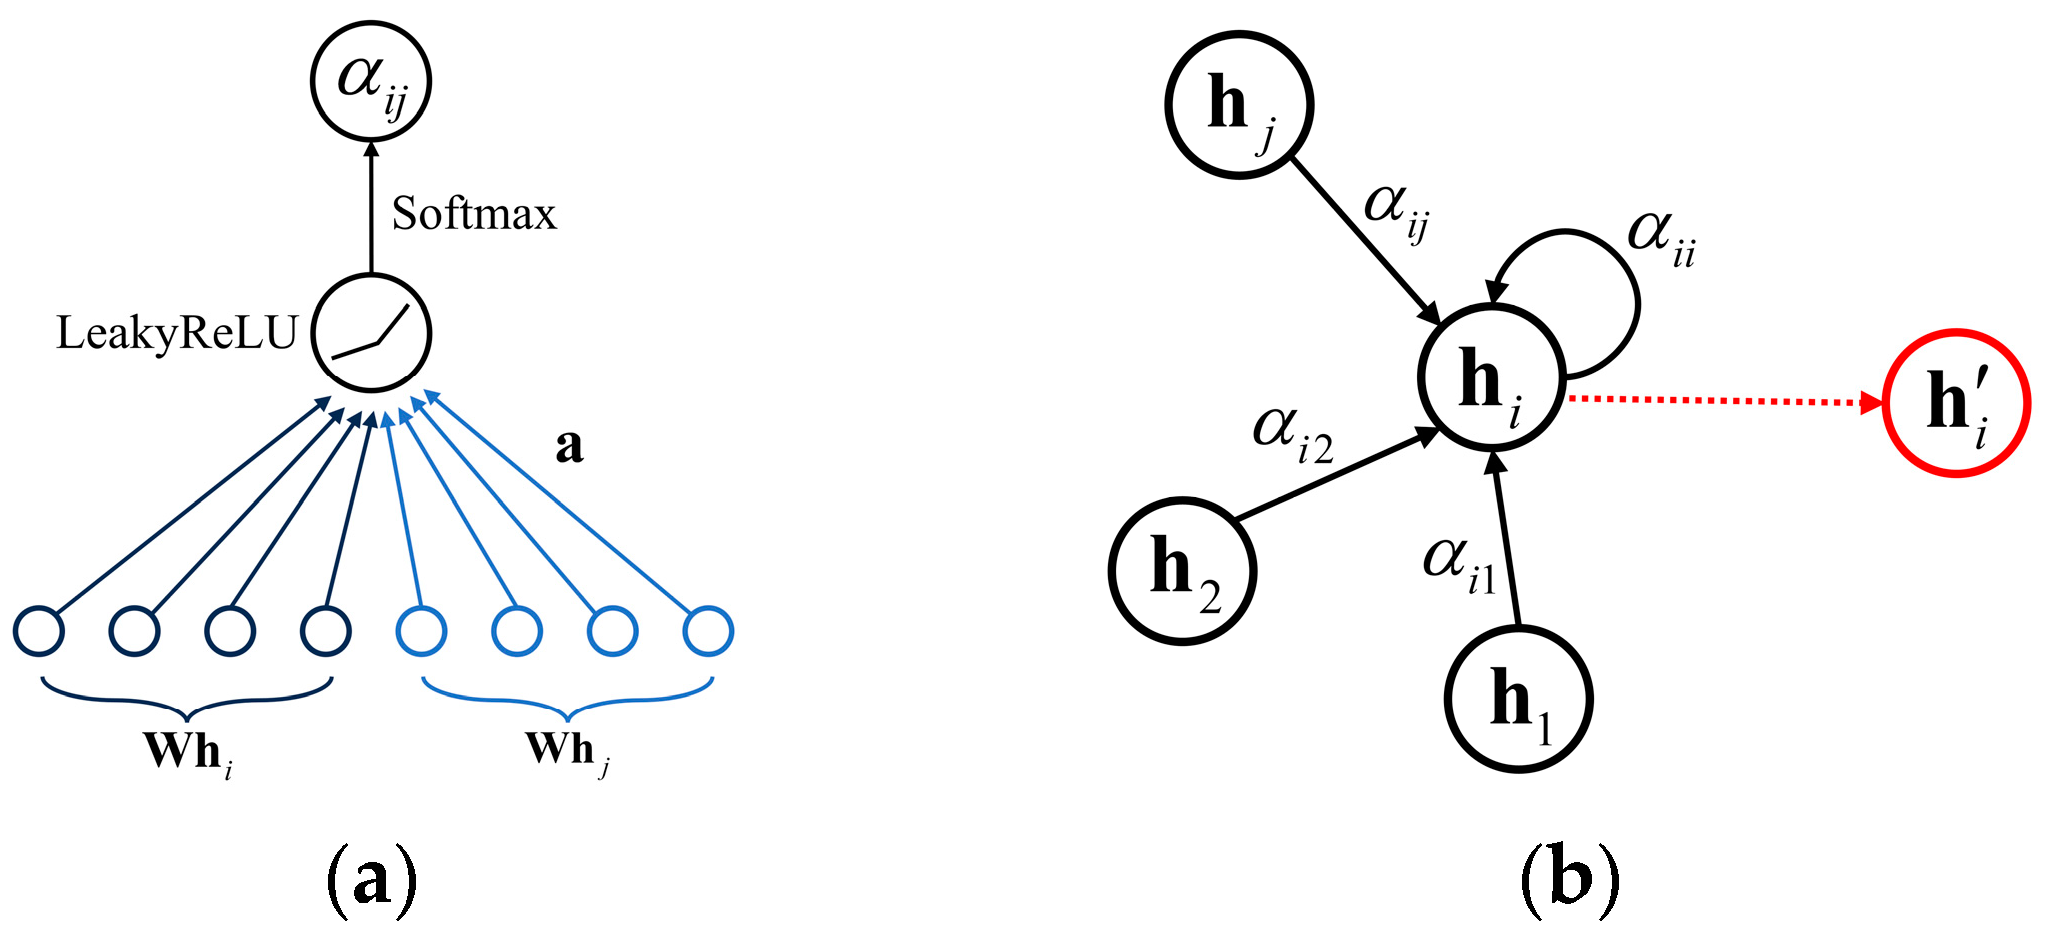
2.2. GAT
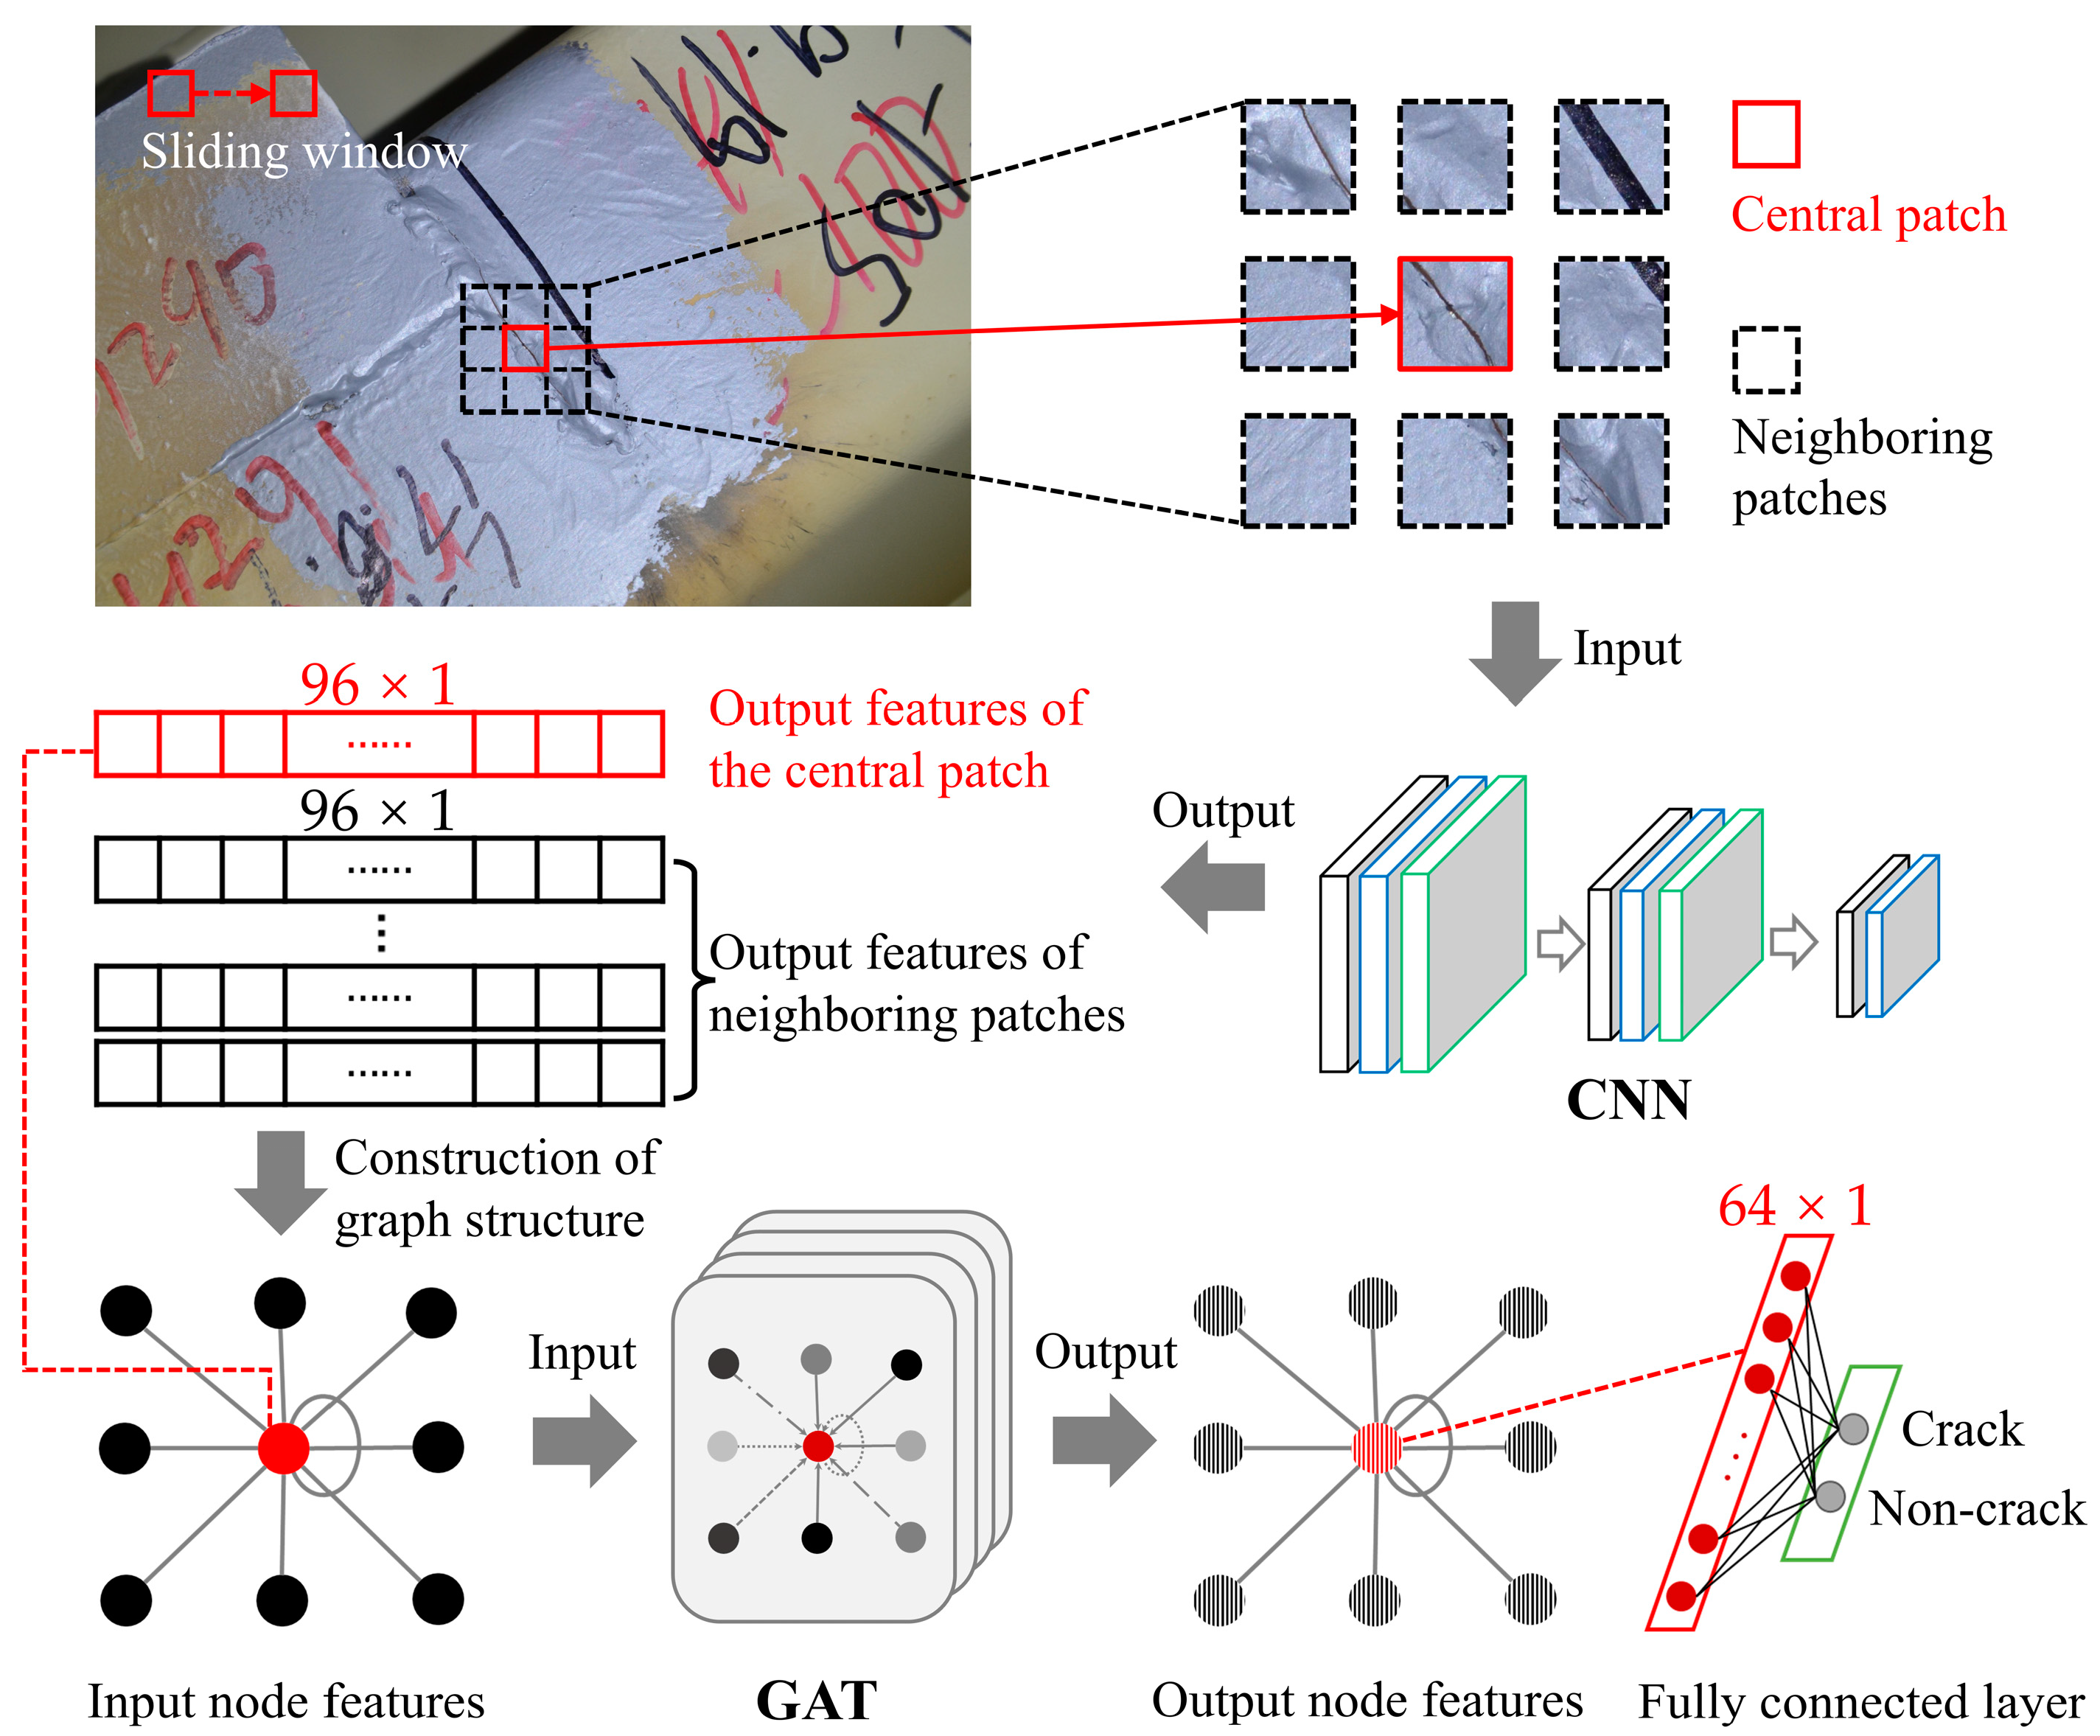
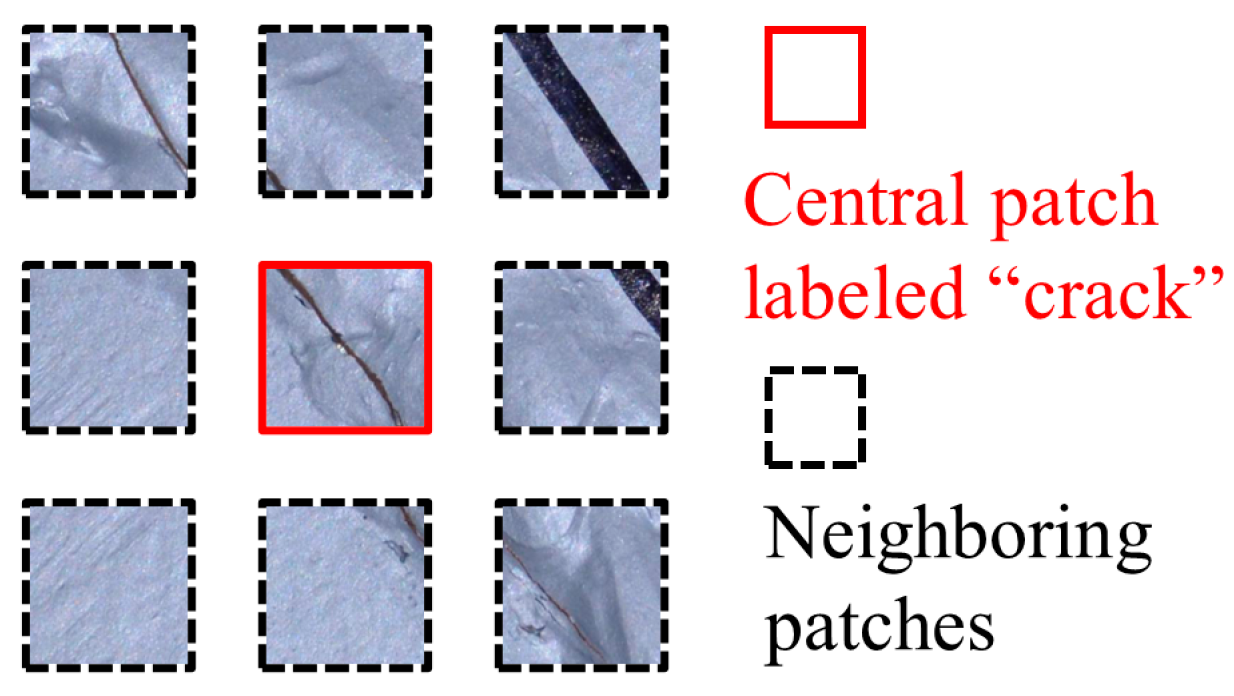
2.3. Framework of the Proposed Method
3. Case Study
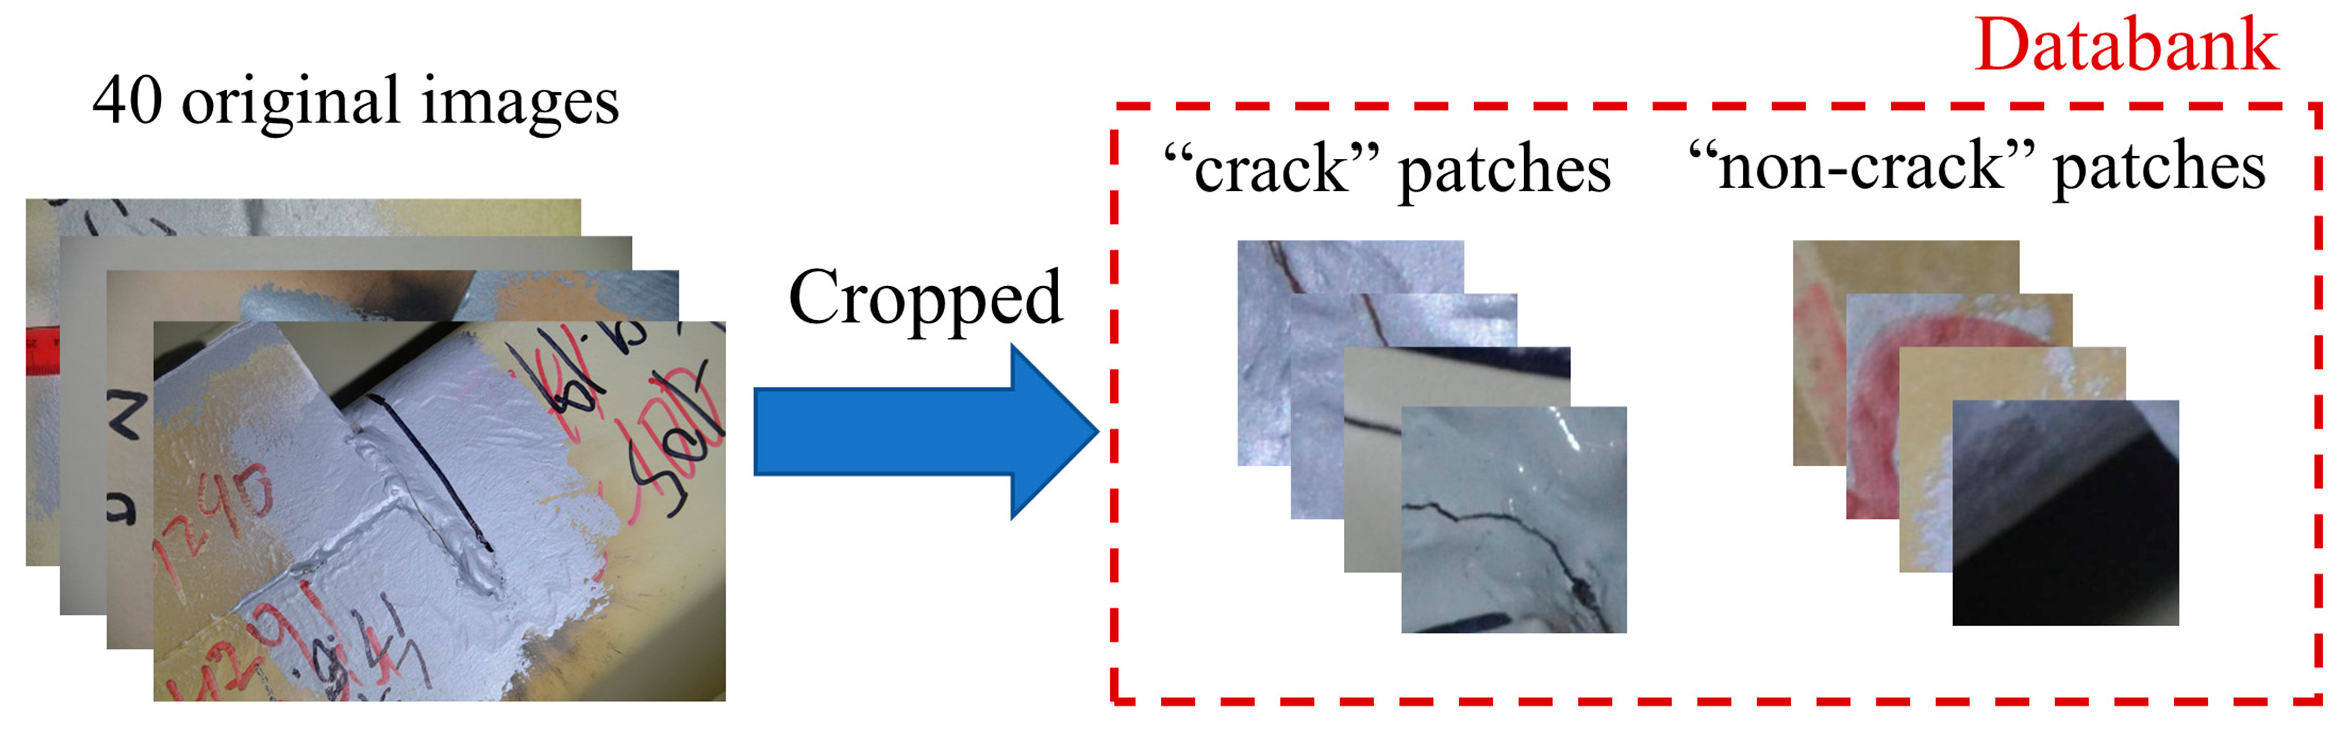
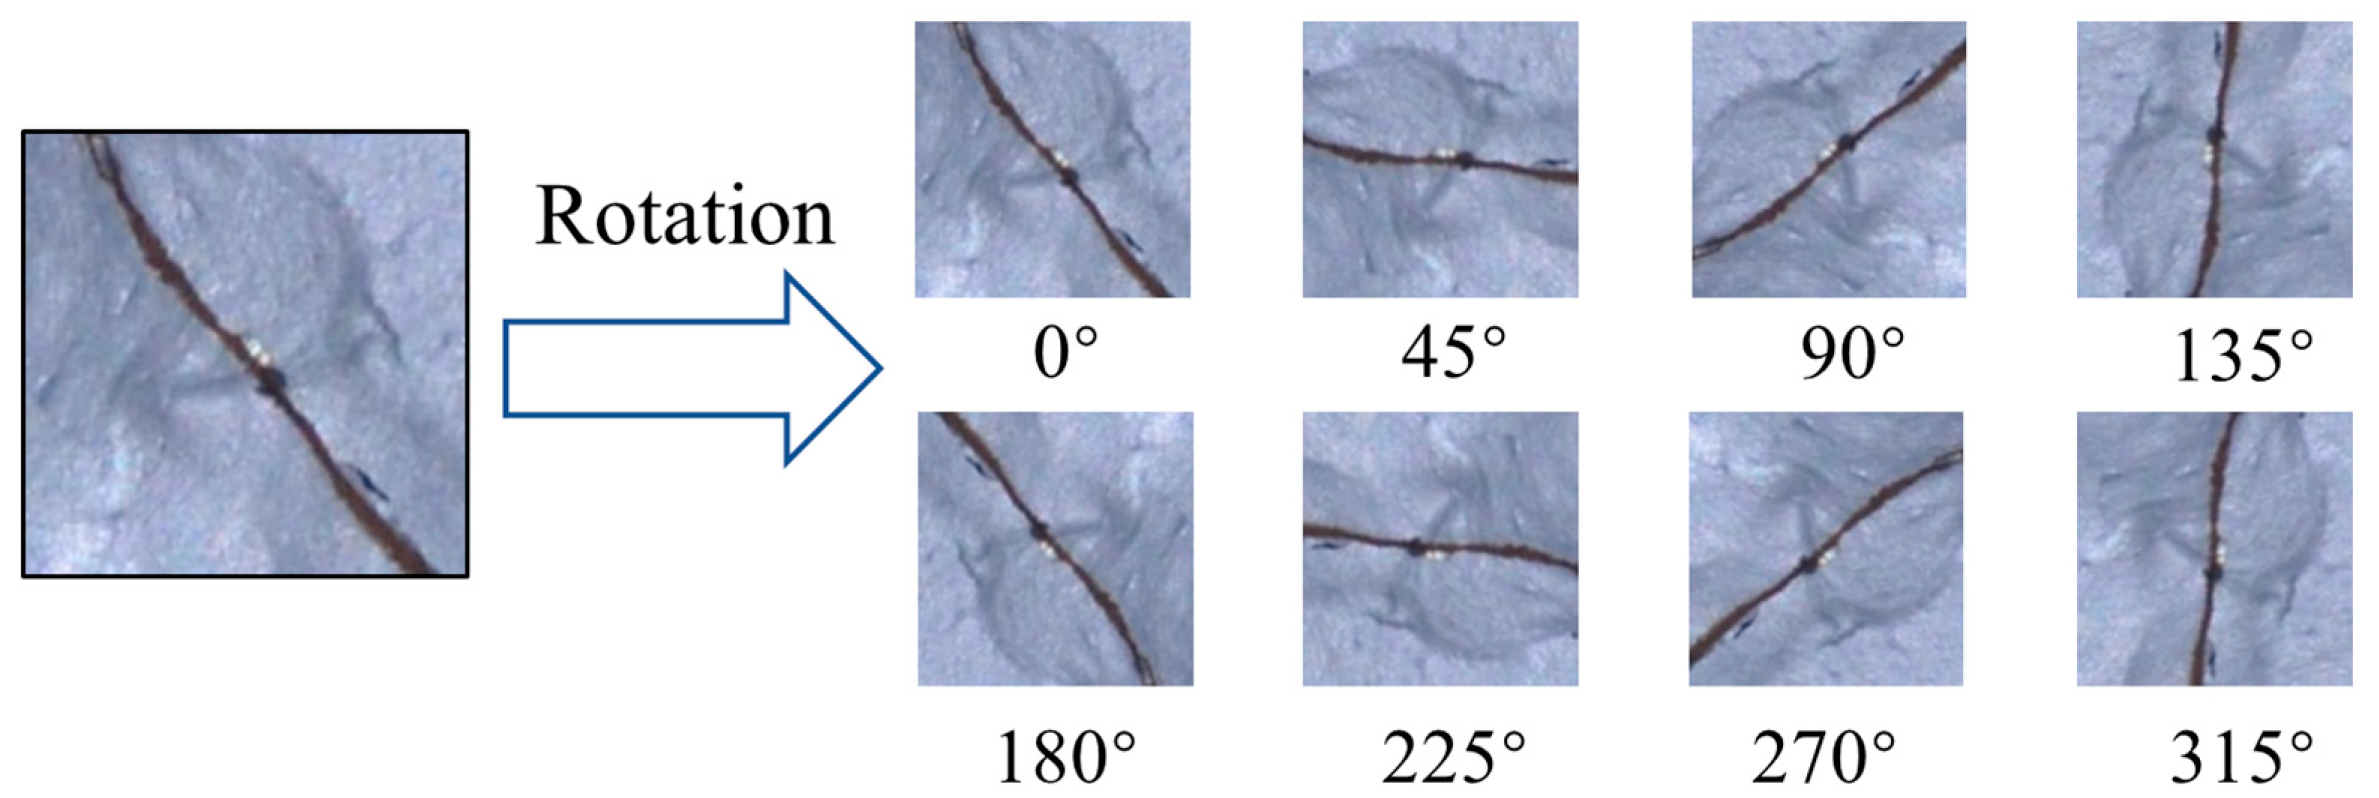
3.1. Dataset
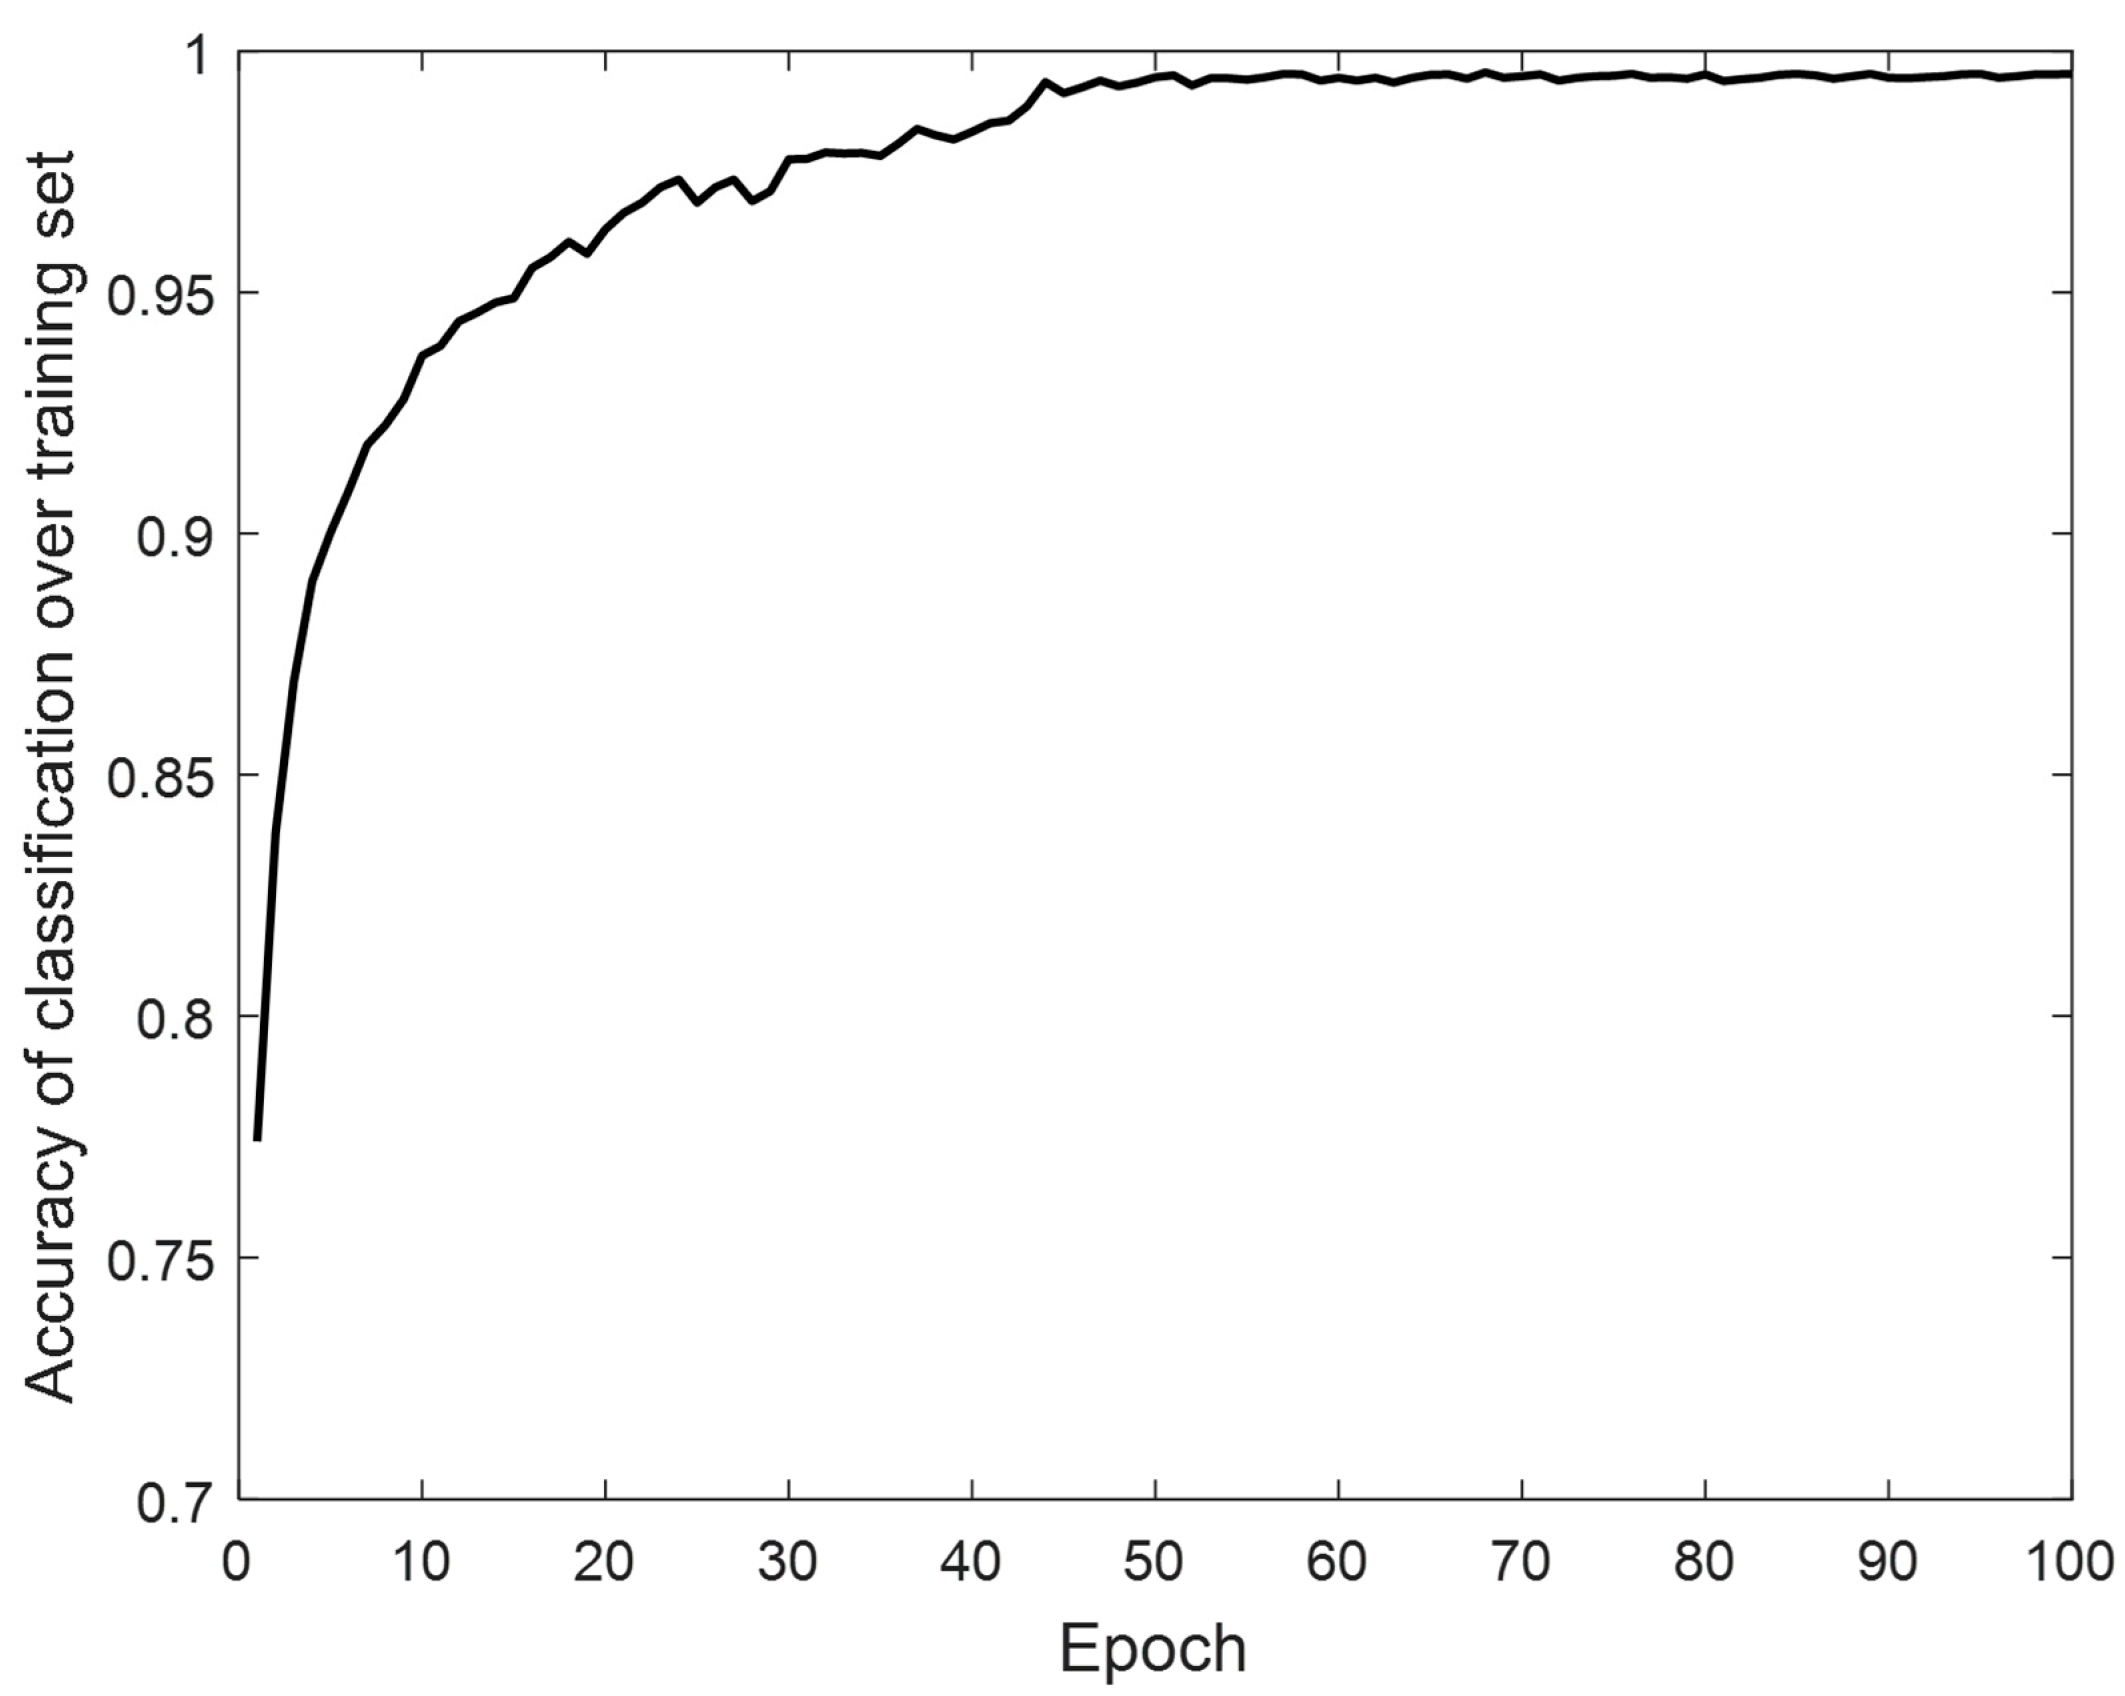
3.2. Pre-Training of CNN Model
3.3. Training of the Whole CNN-GAT Model
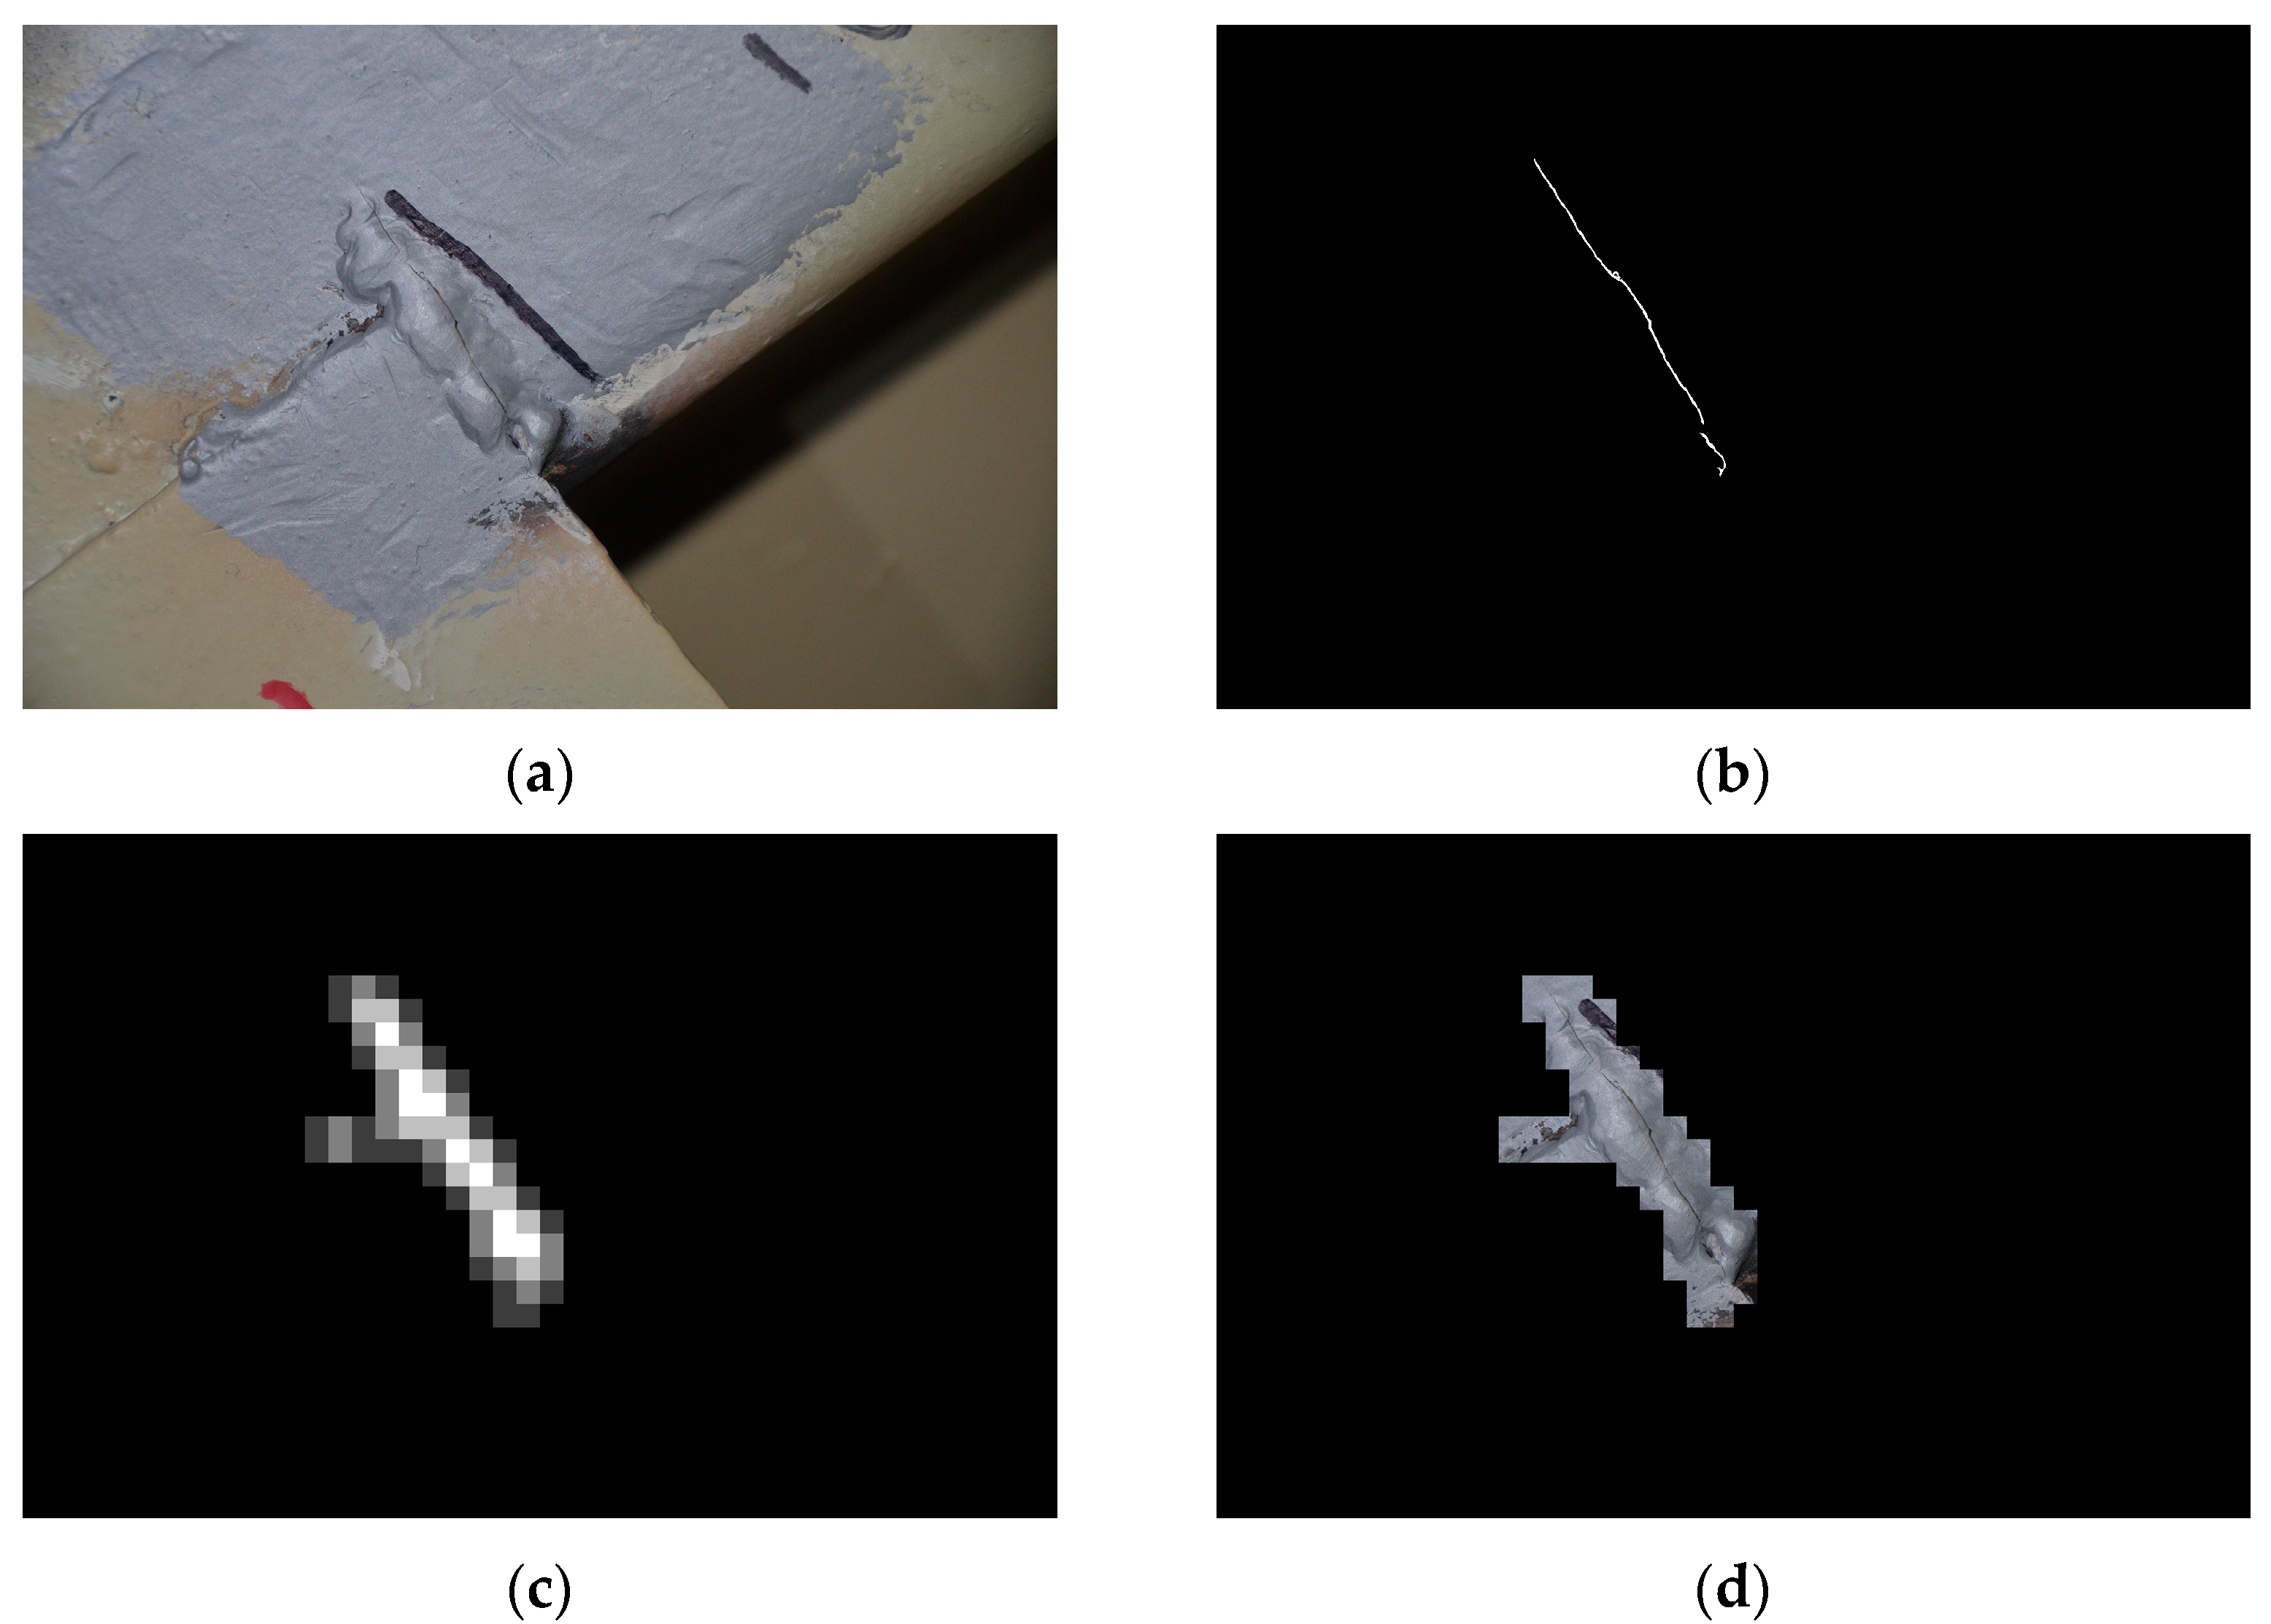
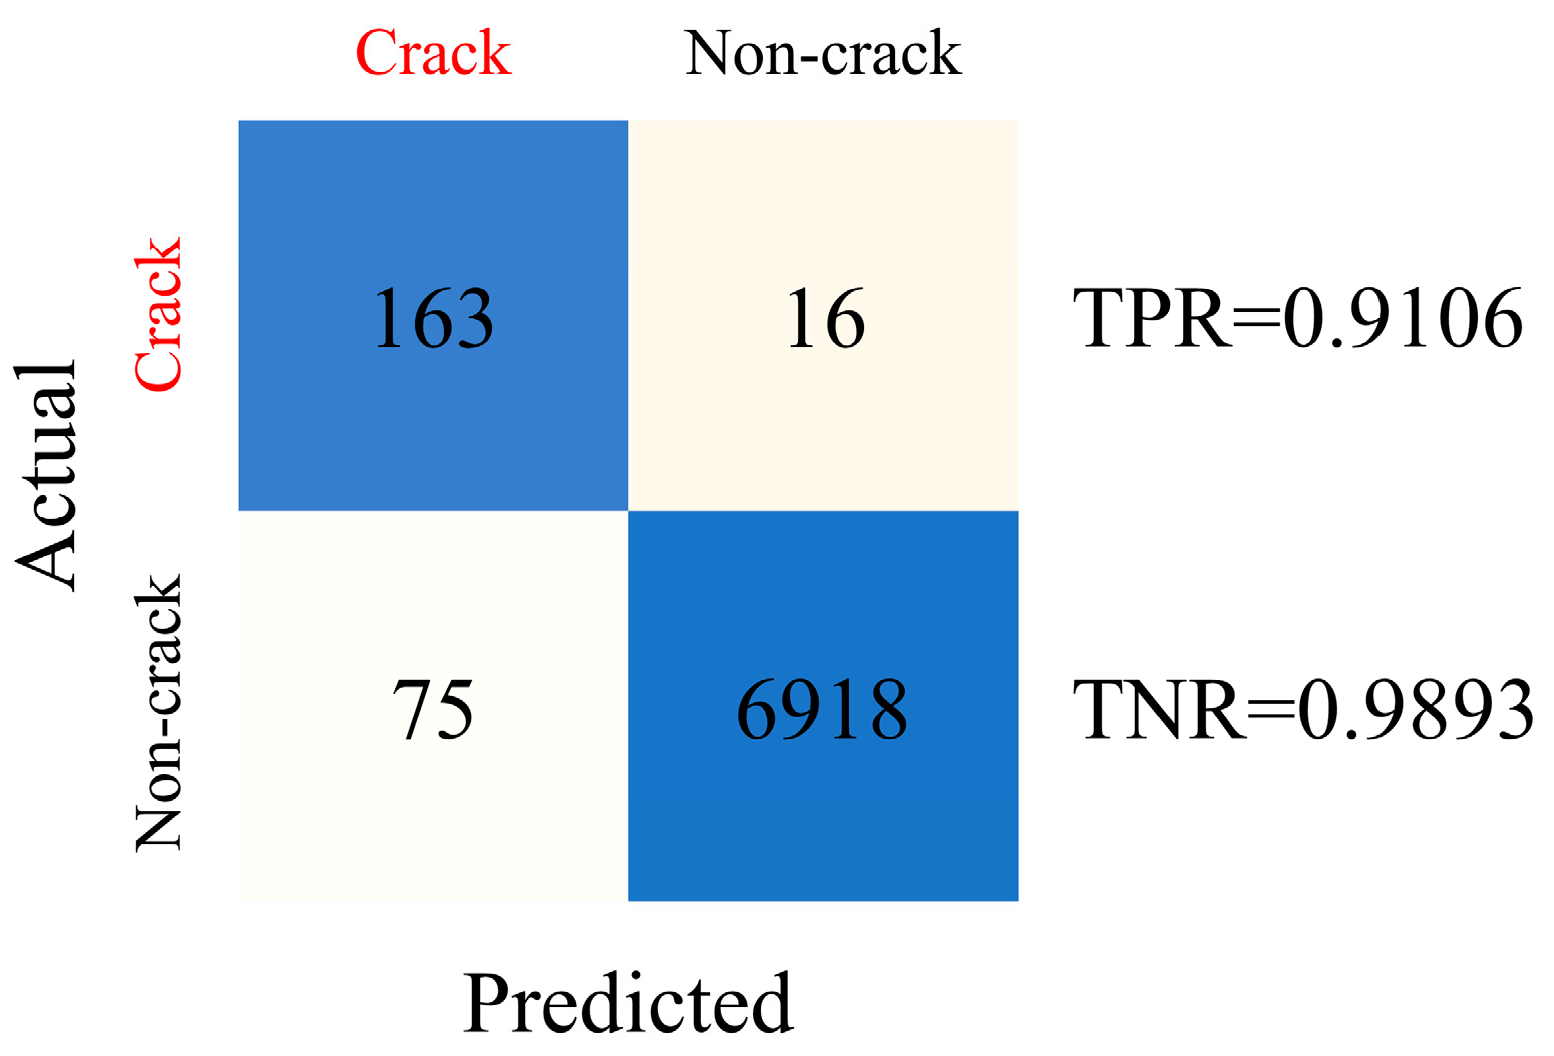
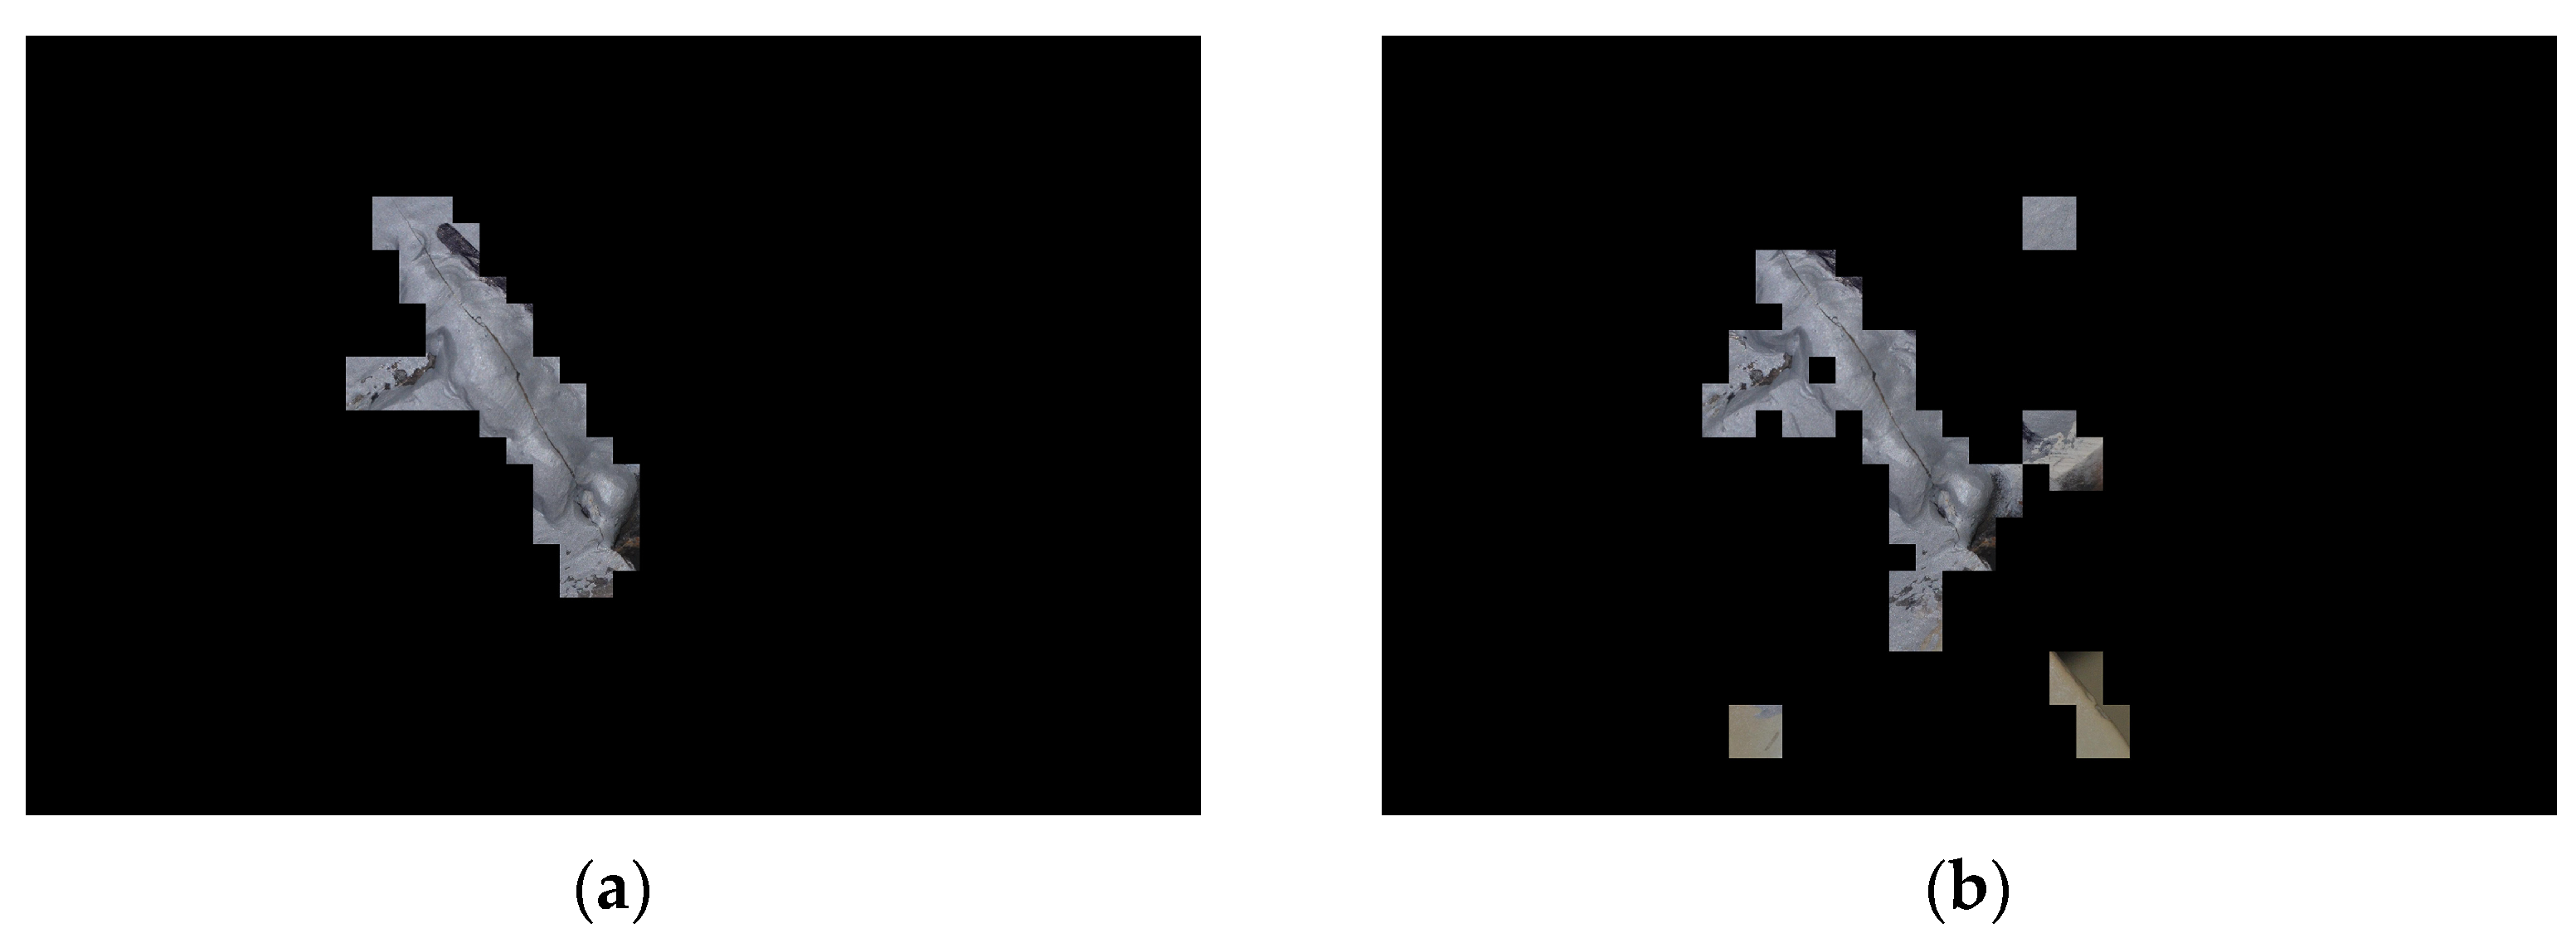
3.4. Results and Discussions
4. Conclusions
Author Contributions
Funding
Institutional Review Board Statement
Informed Consent Statement
Data Availability Statement
Conflicts of Interest
References
- Tong, T.; Hua, J.; Gao, F.; Zhang, H.; Lin, J. Disbond Contour Estimation in Aluminum/CFRP Adhesive Joint Based on the Phase Velocity Variation of Lamb Waves. Smart Mater. Struct. 2022, 31, 095020. [Google Scholar] [CrossRef]
- Ya, S.; Yamada, K.; Ishikawa, T. Fatigue Evaluation of Rib-to-Deck Welded Joints of Orthotropic Steel Bridge Deck. J. Bridg. Eng. 2011, 16, 492–499. [Google Scholar] [CrossRef]
- Tong, T.; Hua, J.; Lin, J.; Zhang, H. Disbond Contours Evaluation in Aluminum/CFRP Adhesive Joint Based on Excitation Recovery of Lamb Waves. Compos. Struct. 2022, 294, 115736. [Google Scholar] [CrossRef]
- Abdel-Qader, I.; Abudayyeh, O.; Kelly, M.E. Analysis of Edge-Detection Techniques for Crack Identification in Bridges. J. Comput. Civ. Eng. 2003, 17, 255–263. [Google Scholar] [CrossRef]
- Yamaguchi, T.; Hashimoto, S. Fast Crack Detection Method for Large-Size Concrete Surface Images Using Percolation-Based Image Processing. Mach. Vis. Appl. 2010, 21, 797–809. [Google Scholar] [CrossRef]
- Yeum, C.M.; Dyke, S.J. Vision-Based Automated Crack Detection for Bridge Inspection. Comput. Civ. Infrastruct. Eng. 2015, 30, 759–770. [Google Scholar] [CrossRef]
- Li, L.; Wang, Q.; Zhang, G.; Shi, L.; Dong, J.; Jia, P. A Method of Detecting the Cracks of Concrete Undergo High-Temperature. Constr. Build. Mater. 2018, 162, 345–358. [Google Scholar] [CrossRef]
- Tong, T.; Hua, J.; Gao, F.; Lin, J. Identification of Bolt State in Lap Joint Based on Propagation Model and Imaging Methods of Lamb Waves. Mech. Syst. Signal Process. 2023, 200, 110569. [Google Scholar] [CrossRef]
- Cha, Y.J.; Choi, W.; Büyüköztürk, O. Deep Learning-Based Crack Damage Detection Using Convolutional Neural Networks. Comput. Civ. Infrastruct. Eng. 2017, 32, 361–378. [Google Scholar] [CrossRef]
- Modarres, C.; Astorga, N.; Droguett, E.L.; Meruane, V. Convolutional Neural Networks for Automated Damage Recognition and Damage Type Identification. Struct. Control Health Monit. 2018, 25, e2230. [Google Scholar] [CrossRef]
- Xu, Y.; Bao, Y.; Zhang, Y.; Li, H. Attribute-Based Structural Damage Identification by Few-Shot Meta Learning with Inter-Class Knowledge Transfer. Struct. Health Monit. 2021, 20, 1494–1517. [Google Scholar] [CrossRef]
- Gopalakrishnan, K.; Khaitan, S.K.; Choudhary, A.; Agrawal, A. Deep Convolutional Neural Networks with Transfer Learning for Computer Vision-Based Data-Driven Pavement Distress Detection. Constr. Build. Mater. 2017, 157, 322–330. [Google Scholar] [CrossRef]
- Laxman, K.C.; Tabassum, N.; Ai, L.; Cole, C.; Ziehl, P. Automated Crack Detection and Crack Depth Prediction for Reinforced Concrete Structures Using Deep Learning. Constr. Build. Mater. 2023, 370, 130709. [Google Scholar] [CrossRef]
- Yu, Y.; Samali, B.; Rashidi, M.; Mohammadi, M.; Nguyen, T.N.; Zhang, G. Vision-Based Concrete Crack Detection Using a Hybrid Framework Considering Noise Effect. J. Build. Eng. 2022, 61, 105246. [Google Scholar] [CrossRef]
- Li, R.; Yu, J.; Li, F.; Yang, R.; Wang, Y.; Peng, Z. Automatic Bridge Crack Detection Using Unmanned Aerial Vehicle and Faster R-CNN. Constr. Build. Mater. 2023, 362, 129659. [Google Scholar] [CrossRef]
- Gwon, G.H.; Lee, J.H.; Kim, I.H.; Jung, H.J. CNN-Based Image Quality Classification Considering Quality Degradation in Bridge Inspection Using an Unmanned Aerial Vehicle. IEEE Access 2023, 11, 22096–22113. [Google Scholar] [CrossRef]
- Waseem Khan, M.; Obaidat, M.S.; Mahmood, K.; Batool, D.; Muhammad Sanaullah Badar, H.; Aamir, M.; Gao, W. Real-Time Road Damage Detection and Infrastructure Evaluation Leveraging Unmanned Aerial Vehicles and Tiny Machine Learning. IEEE Internet Things J. 2024, 11, 21347–21358. [Google Scholar] [CrossRef]
- Cai, R.; Li, J.; Tan, Y.; Shou, W.; Butera, A. Automated Geometric Quantification of Building Exterior Wall Cracks Based on Computer Vision. J. Perform. Constr. Facil. 2024, 38, 04024015. [Google Scholar] [CrossRef]
- Sandric, I.; Chitu, Z.; Ilinca, V.; Irimia, R. Using High-Resolution UAV Imagery and Artificial Intelligence to Detect and Map Landslide Cracks Automatically. Landslides 2024, 21, 2535–2543. [Google Scholar] [CrossRef]
- Lu, W.; Jiang, N.; Jin, D.; Chen, H.; Liu, X. Learning Distinct Relationship in Package Recommendation With Graph Attention Networks. IEEE Trans. Comput. Soc. Syst. 2023, 10, 3308–3320. [Google Scholar] [CrossRef]
- Wang, C.; Yang, K.; Yang, W.; Li, R.; Qiang, H.; Lu, B.; Su, B.; Yang, Z. Assessment of the Urban Habitat Quality Service Functions and Their Drivers Based on the Fusion Module of Graph Attention Network and Residual Network. Int. J. Digit. Earth 2024, 17, 2306310. [Google Scholar] [CrossRef]
- Li, H.; Han, Z.; Sun, Y.; Wang, F.; Hu, P.; Gao, Y.; Bai, X.; Peng, S.; Ren, C.; Xu, X.; et al. CGMega: Explainable Graph Neural Network Framework with Attention Mechanisms for Cancer Gene Module Dissection. Nat. Commun. 2024, 15, 5997. [Google Scholar] [CrossRef] [PubMed]
- Wang, S.H.; Govindaraj, V.V.; Górriz, J.M.; Zhang, X.; Zhang, Y.D. COVID-19 Classification by FGCNet with Deep Feature Fusion from Graph Convolutional Network and Convolutional Neural Network. Inf. Fusion 2021, 67, 208–229. [Google Scholar] [CrossRef] [PubMed]
- Yuan, W.; He, K.; Guan, D.; Zhou, L.; Li, C. Graph Kernel Based Link Prediction for Signed Social Networks. Inf. Fusion 2019, 46, 1–10. [Google Scholar] [CrossRef]
- Veličković, P.; Cucurull, G.; Casanova, A.; Romero, A.; Liò, P.; Bengio, Y. Graph Attention Networks. arXiv 2017, arXiv:1710.10903. [Google Scholar]
- Ren, Y.; Huang, J.; Hong, Z.; Lu, W.; Yin, J.; Zou, L.; Shen, X. Image-Based Concrete Crack Detection in Tunnels Using Deep Fully Convolutional Networks. Constr. Build. Mater. 2020, 234, 117367. [Google Scholar] [CrossRef]


| Layer | Layer Size | Operation | Kernel Size | No. | Stride |
|---|---|---|---|---|---|
| Input | 224 × 224 × 3 | Convolution | 20 × 20 × 3 | 24 | 2 |
| Layer1 | 103 × 103 × 24 | ReLU | - | - | - |
| Layer 2 | 103 × 103 × 24 | Max-pooling | 7 × 7 | - | 2 |
| Layer 3 | 49 × 49 × 24 | Convolution | 15 × 15 × 24 | 48 | 2 |
| Layer 4 | 18 × 18 × 48 | ReLU | - | - | - |
| Layer 5 | 18 × 18 × 48 | Max-pooling | 4 × 4 | - | 2 |
| Layer 6 | 8 × 8 × 48 | Convolution | 8 × 8 × 48 | 96 | 1 |
| Layer 7 | 1 × 1 × 96 | ReLU | - | - | - |
| Epoch | Learning Rate |
|---|---|
| 1–20 | 0.01 |
| 21–40 | 0.001 |
| 41–60 | 0.0001 |
| 61–80 | 0.00001 |
| 81–100 | 0.000001 |
Disclaimer/Publisher’s Note: The statements, opinions and data contained in all publications are solely those of the individual author(s) and contributor(s) and not of MDPI and/or the editor(s). MDPI and/or the editor(s) disclaim responsibility for any injury to people or property resulting from any ideas, methods, instructions or products referred to in the content. |
© 2025 by the authors. Licensee MDPI, Basel, Switzerland. This article is an open access article distributed under the terms and conditions of the Creative Commons Attribution (CC BY) license (https://creativecommons.org/licenses/by/4.0/).
Share and Cite
Chen, F.; Tong, T.; Hua, J.; Cui, C. Crack Identification for Bridge Condition Monitoring Combining Graph Attention Networks and Convolutional Neural Networks. Appl. Sci. 2025, 15, 5452. https://doi.org/10.3390/app15105452
Chen F, Tong T, Hua J, Cui C. Crack Identification for Bridge Condition Monitoring Combining Graph Attention Networks and Convolutional Neural Networks. Applied Sciences. 2025; 15(10):5452. https://doi.org/10.3390/app15105452
Chicago/Turabian StyleChen, Feiyu, Tong Tong, Jiadong Hua, and Chun Cui. 2025. "Crack Identification for Bridge Condition Monitoring Combining Graph Attention Networks and Convolutional Neural Networks" Applied Sciences 15, no. 10: 5452. https://doi.org/10.3390/app15105452
APA StyleChen, F., Tong, T., Hua, J., & Cui, C. (2025). Crack Identification for Bridge Condition Monitoring Combining Graph Attention Networks and Convolutional Neural Networks. Applied Sciences, 15(10), 5452. https://doi.org/10.3390/app15105452