
A Review of Neuro-ML Breakthroughs in Addressing Neurological Disorders


Abstract
1. Introduction
- RQ1: What ML methods are used to diagnose neurodegenerative diseases?
- RQ2: What are the performances achieved by using ML methods compared to traditional ones in diagnosing neurodegenerative diseases?
- RQ3: What are the main challenges of ML algorithms used in the field of neurological diseases (Neuro-ML)?
- RQ4: What are the main limitations of Neuro-ML?
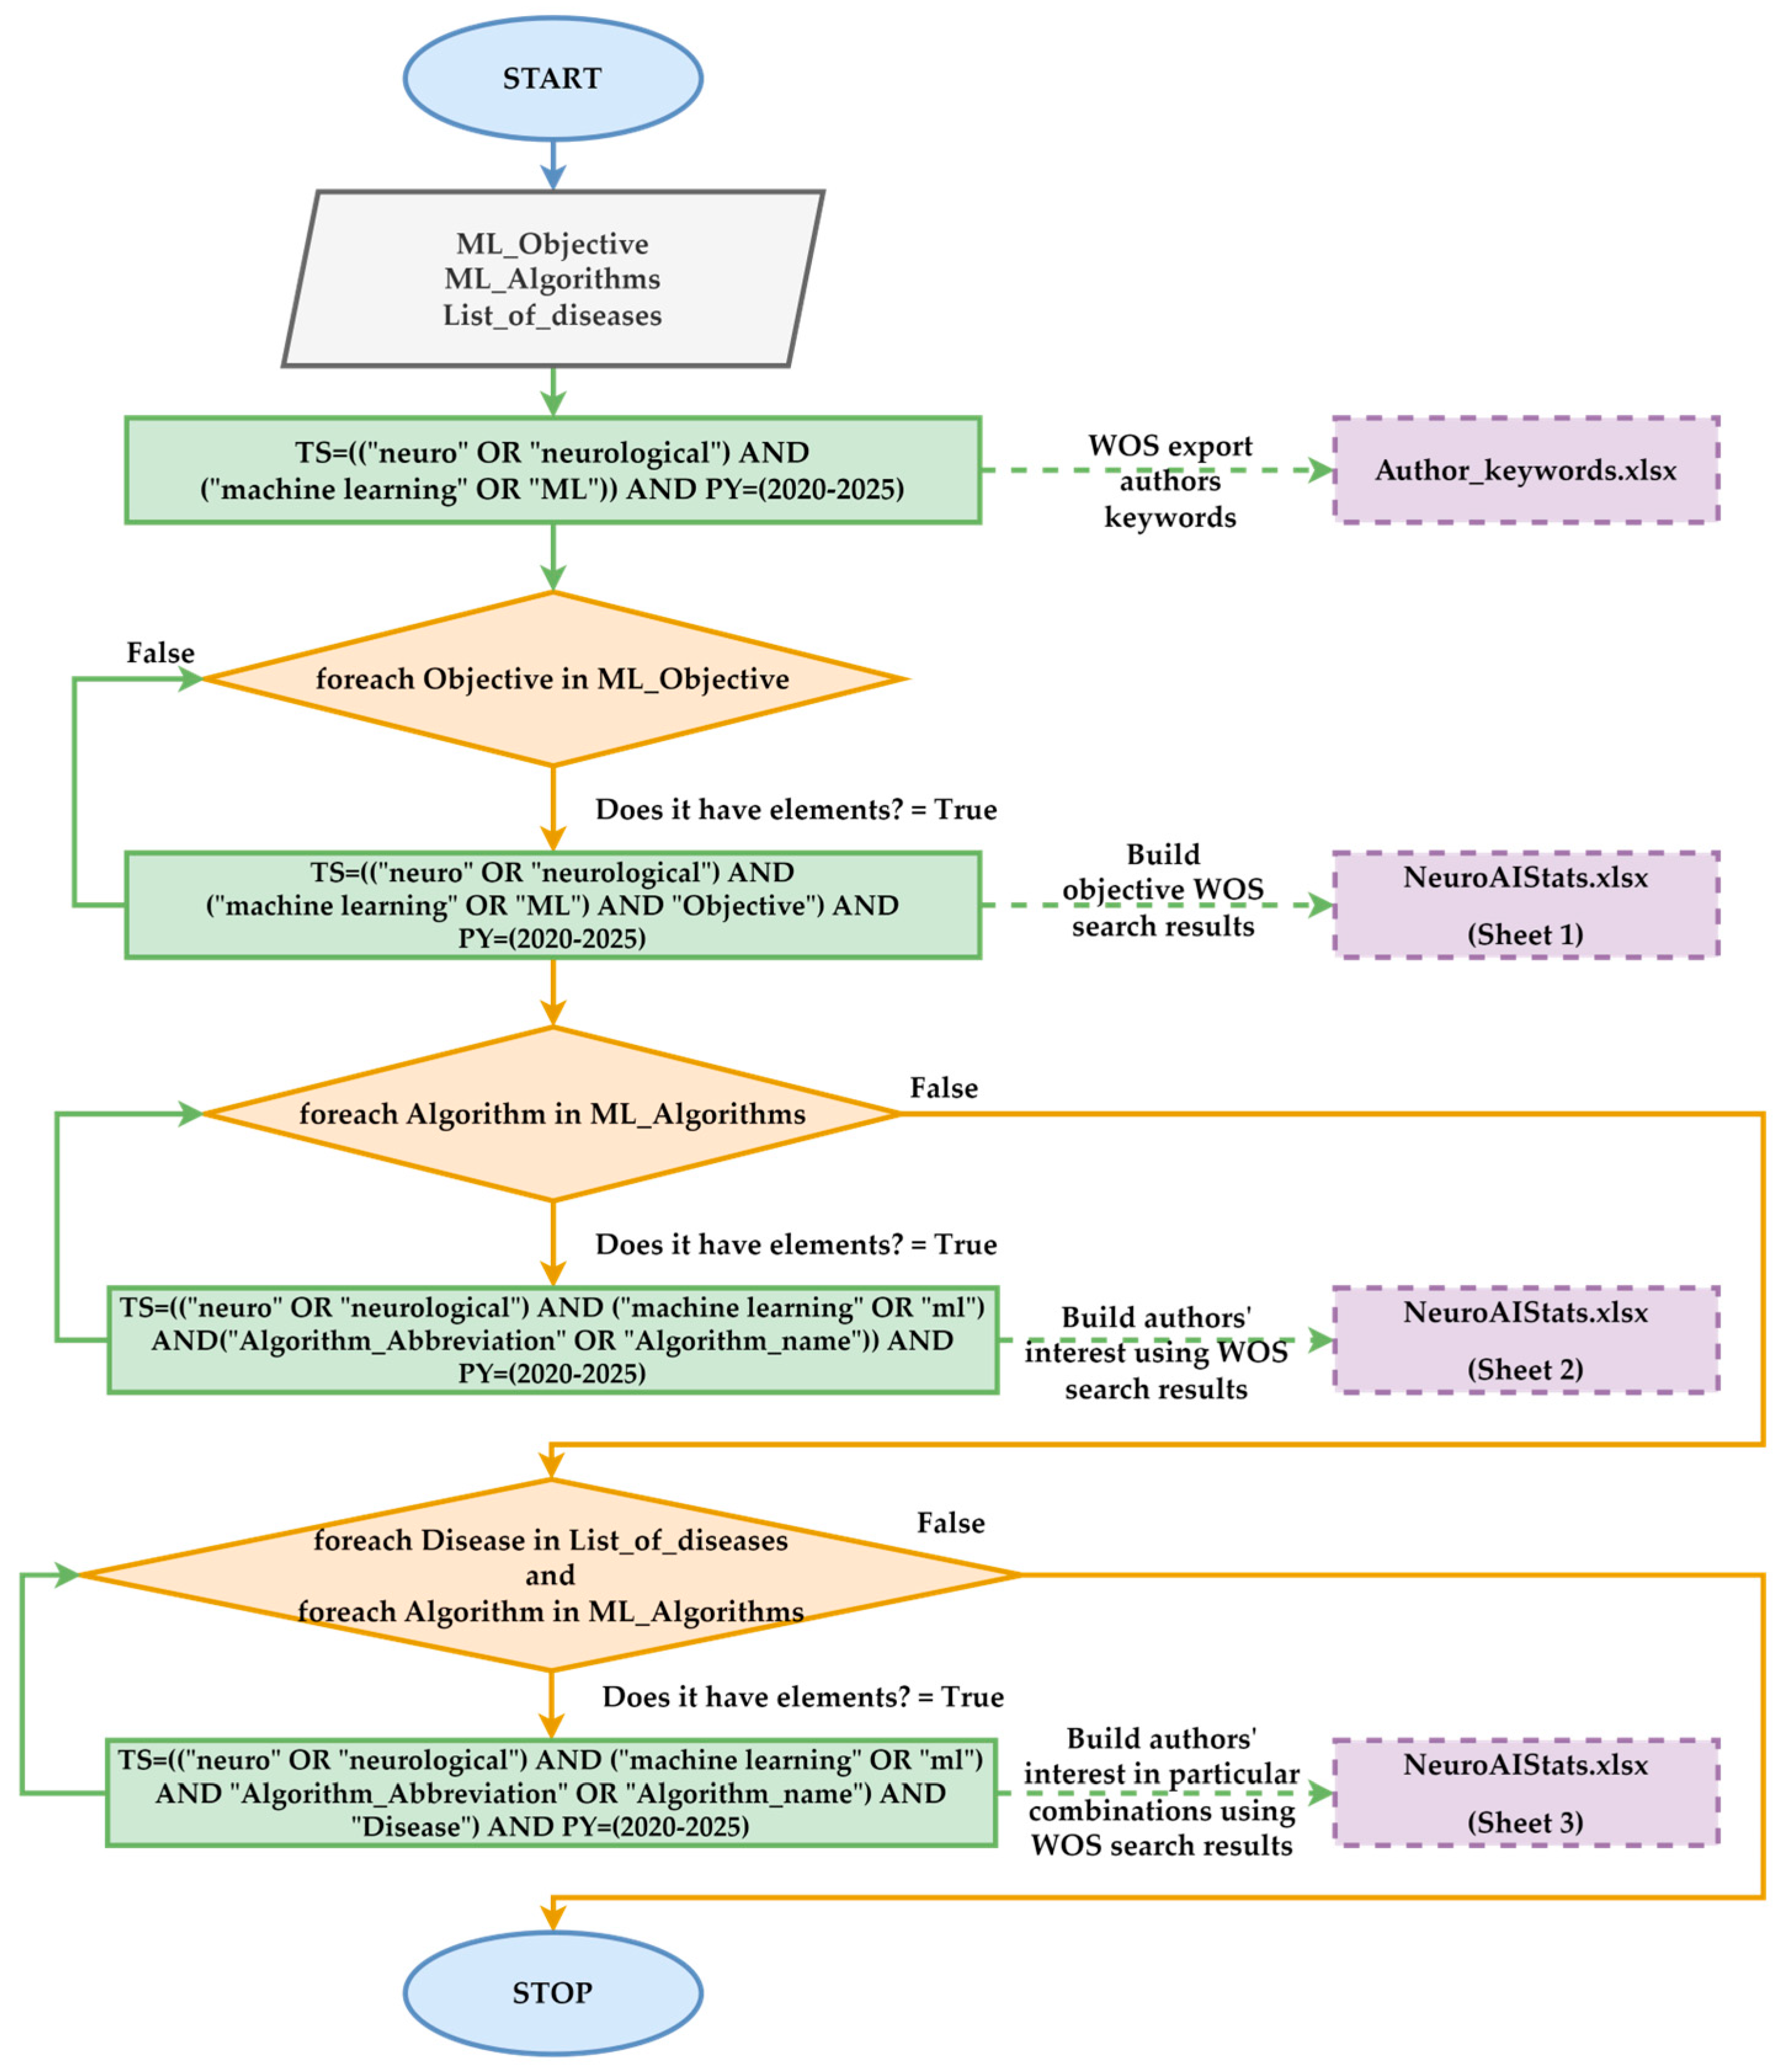
- For RQ1, the authors extensively analyzed the specialized literature using WOS. The search results focused on the degree of use of ML algorithms in diagnosing neurological diseases. Thus, the ML models were classified based on their frequency of use and the performance reported in various studies. Subsequently, the distributions of these algorithms were compared based on customized procedures and data provided by WOS.
- For RQ2, the methodology aimed at evaluating the performance of the ML algorithms. Therefore, the authors analyzed accuracy, sensitivity, F1-Score, and area under the curve (AUC). These metrics were compared with the results reported in traditional studies. The analysis was conducted based on Alzheimer’s, Parkinson’s, and MS diseases, emphasizing the ability of ML models to reduce diagnostic errors and accelerate the diagnostic process.
- For RQ3, the challenges identified in the critical literature analysis were highlighted by the low standardization level in evaluating ML models’ performance. Unbalanced or limited datasets and the difficulty of implementing complex algorithms have led to the under-analysis of rare diseases and the exploration of underutilized algorithms in the literature.
- For RQ4, the limitations highlighted that the comparative analyses between the customized methods and the results provided by WOS are similar. Thus, it was found that some articles include vaguely irrelevant terms. This aspect can lead to incorrect interpretations. Additionally, this research identifies gaps in the literature regarding rare diseases and the lack of standardized protocols for validating ML models.
2. Literature Review
2.1. Neurological Disease Classification
- AD is a form of dementia through which the subject loses their memory, exhibits cognitive decline, and experiences behavioral changes. AD is marked by progressive cognitive decline generated by the accumulation of beta-amyloid and tau tangles in the brain. Thus, memory deterioration occurs gradually, and behavioral changes often accompany these changes in language and daily functions. In ref. [15], it is mentioned that genetic clinical examinations identify specific loci associated with the rapid progression of this disease.
- PD is a disorder that predominantly affects motor function. This function is lost due to the dopaminergic neurons in the substantia nigra. In this class, there are forms with early-onset and late-onset symptoms. The pathological features include Lewy bodies, which consist of aggregated alpha-synuclein [16]. PD is classified based on its clinical characteristics, including tremor, rigidity, and bradykinesia [17].
- Amyotrophic lateral sclerosis (ALS) is a disease that leads to the degeneration of mo-tor neurons. The result of this disease is paralysis [18]. The degeneration of upper and lower motor neurons leads to muscle atrophy and, ultimately, respiratory failure. This condition is linked to genetic components represented by mutations in the SOD1 gene [19].
- Frontotemporal dementia (FTD) is a progressive dementia that degenerates the frontal and temporal lobes of the brain. FTD encompasses several forms, including behavioral variant FTD and semantic variant primary progressive aphasia. These are differentiated by clinical presentation and underlying pathology. Genetic mutations, particularly in the MAPT and GRN genes, further classify the familial forms of FTD [20].
- Huntington’s disease (HD) is a hereditary condition characterized by motor dysfunction and cognitive decline. This disease is an autosomal dominant neurodegenerative disorder. It is primarily associated with the expansion of CAG repeats in the HTT gene. This leads to progressive motor dysfunction, cognitive decline, and psychiatric symptoms [21]. To prevent this disease, genetic testing is necessary for early diagnosis [22].
- Lewy body dementia (LBD) is a form of dementia that involves the accumulation of Lewy bodies in the brain. It is classified as a synucleinopathy, primarily characterized by the presence of alpha-synuclein aggregates [23]. It has symptoms similar to Alzheimer’s and PDs.
- Prion diseases are a unique category of transmissible neurodegenerative disorders. It includes conditions such as Creutzfeldt–Jakob disease (CJD). CJD genetic variants involve specific prion protein (PRNP) gene mutations and are associated with distinct phenotypic subtypes [24]. The disease is characterized by spongiform changes in brain tissue and an abnormal prion protein [25].
- Spinocerebellar ataxia (SCA) is a reference disease in this class of neurodegenerative diseases. This represents a group of genetic disorders characterized by the degeneration of the part of the brain responsible for coordinating movements [26,27]. SCA represents a diverse group of inherited neurodegenerative disorders. It is characterized by progressive ataxia caused by the degeneration of the cerebellum and its connections. These diseases are classified into hereditary ataxias associated with specific genetic mutations or sporadic forms without a clear genetic basis [28].
- Multiple sclerosis (MS) is not a degenerative disease. It is an inflammatory disease that affects the central nervous system. It is characterized by the presence of lesions and inflammation, leading to chronic neurodegeneration. MS is stratified into clinical subcategories, including relapsing–remitting and progressive forms, reflecting the spectrum of disease behavior [29,30].
2.2. Machine Learning Classification
2.3. Machine Learning Models Related to Neurological Diseases

2.4. ML Models Accuracy
- Capacity for generalization based on a large volume of data;
- Reducing diagnostic errors;
- The ability to make medical decisions based on past experiences;
- Preventing overtraining.
3. Methodology
- The representativeness of neurological diseases is determined by the number of articles identified through WOS queries or customized keyword analysis. If the result returned by WOS was extremely low or nonexistent, it was considered an “underexplored disease”. The quantitative criterion was based on a limit of 5 articles published in the period 2020–2025.
- The degree of utilization of ML algorithms classifies advanced algorithms as “underexplored” if they appear in fewer than 20 relevant studies or are not frequently used with the analyzed diseases. This quantitative criterion is based on the thresholds set by the WOS platform and customized analysis.
- Standardization of evaluation metrics is necessary due to the lack of direct comparability between studies, which was identified when the analyzed articles did not report the same indicators (precision, AUC, sensitivity, specificity). This aspect complicates the cross-sectional evaluation of model performance.
- Analysis 1: The distribution of papers based on the authors’ keywords in Neuro-ML aims to identify the main themes based on research clusters in the field of Neuro-ML.
- Analysis 2: The distribution of papers by country in the Neuro-ML field evaluates the level of interest grouped by country for research in the field of neurological diseases.
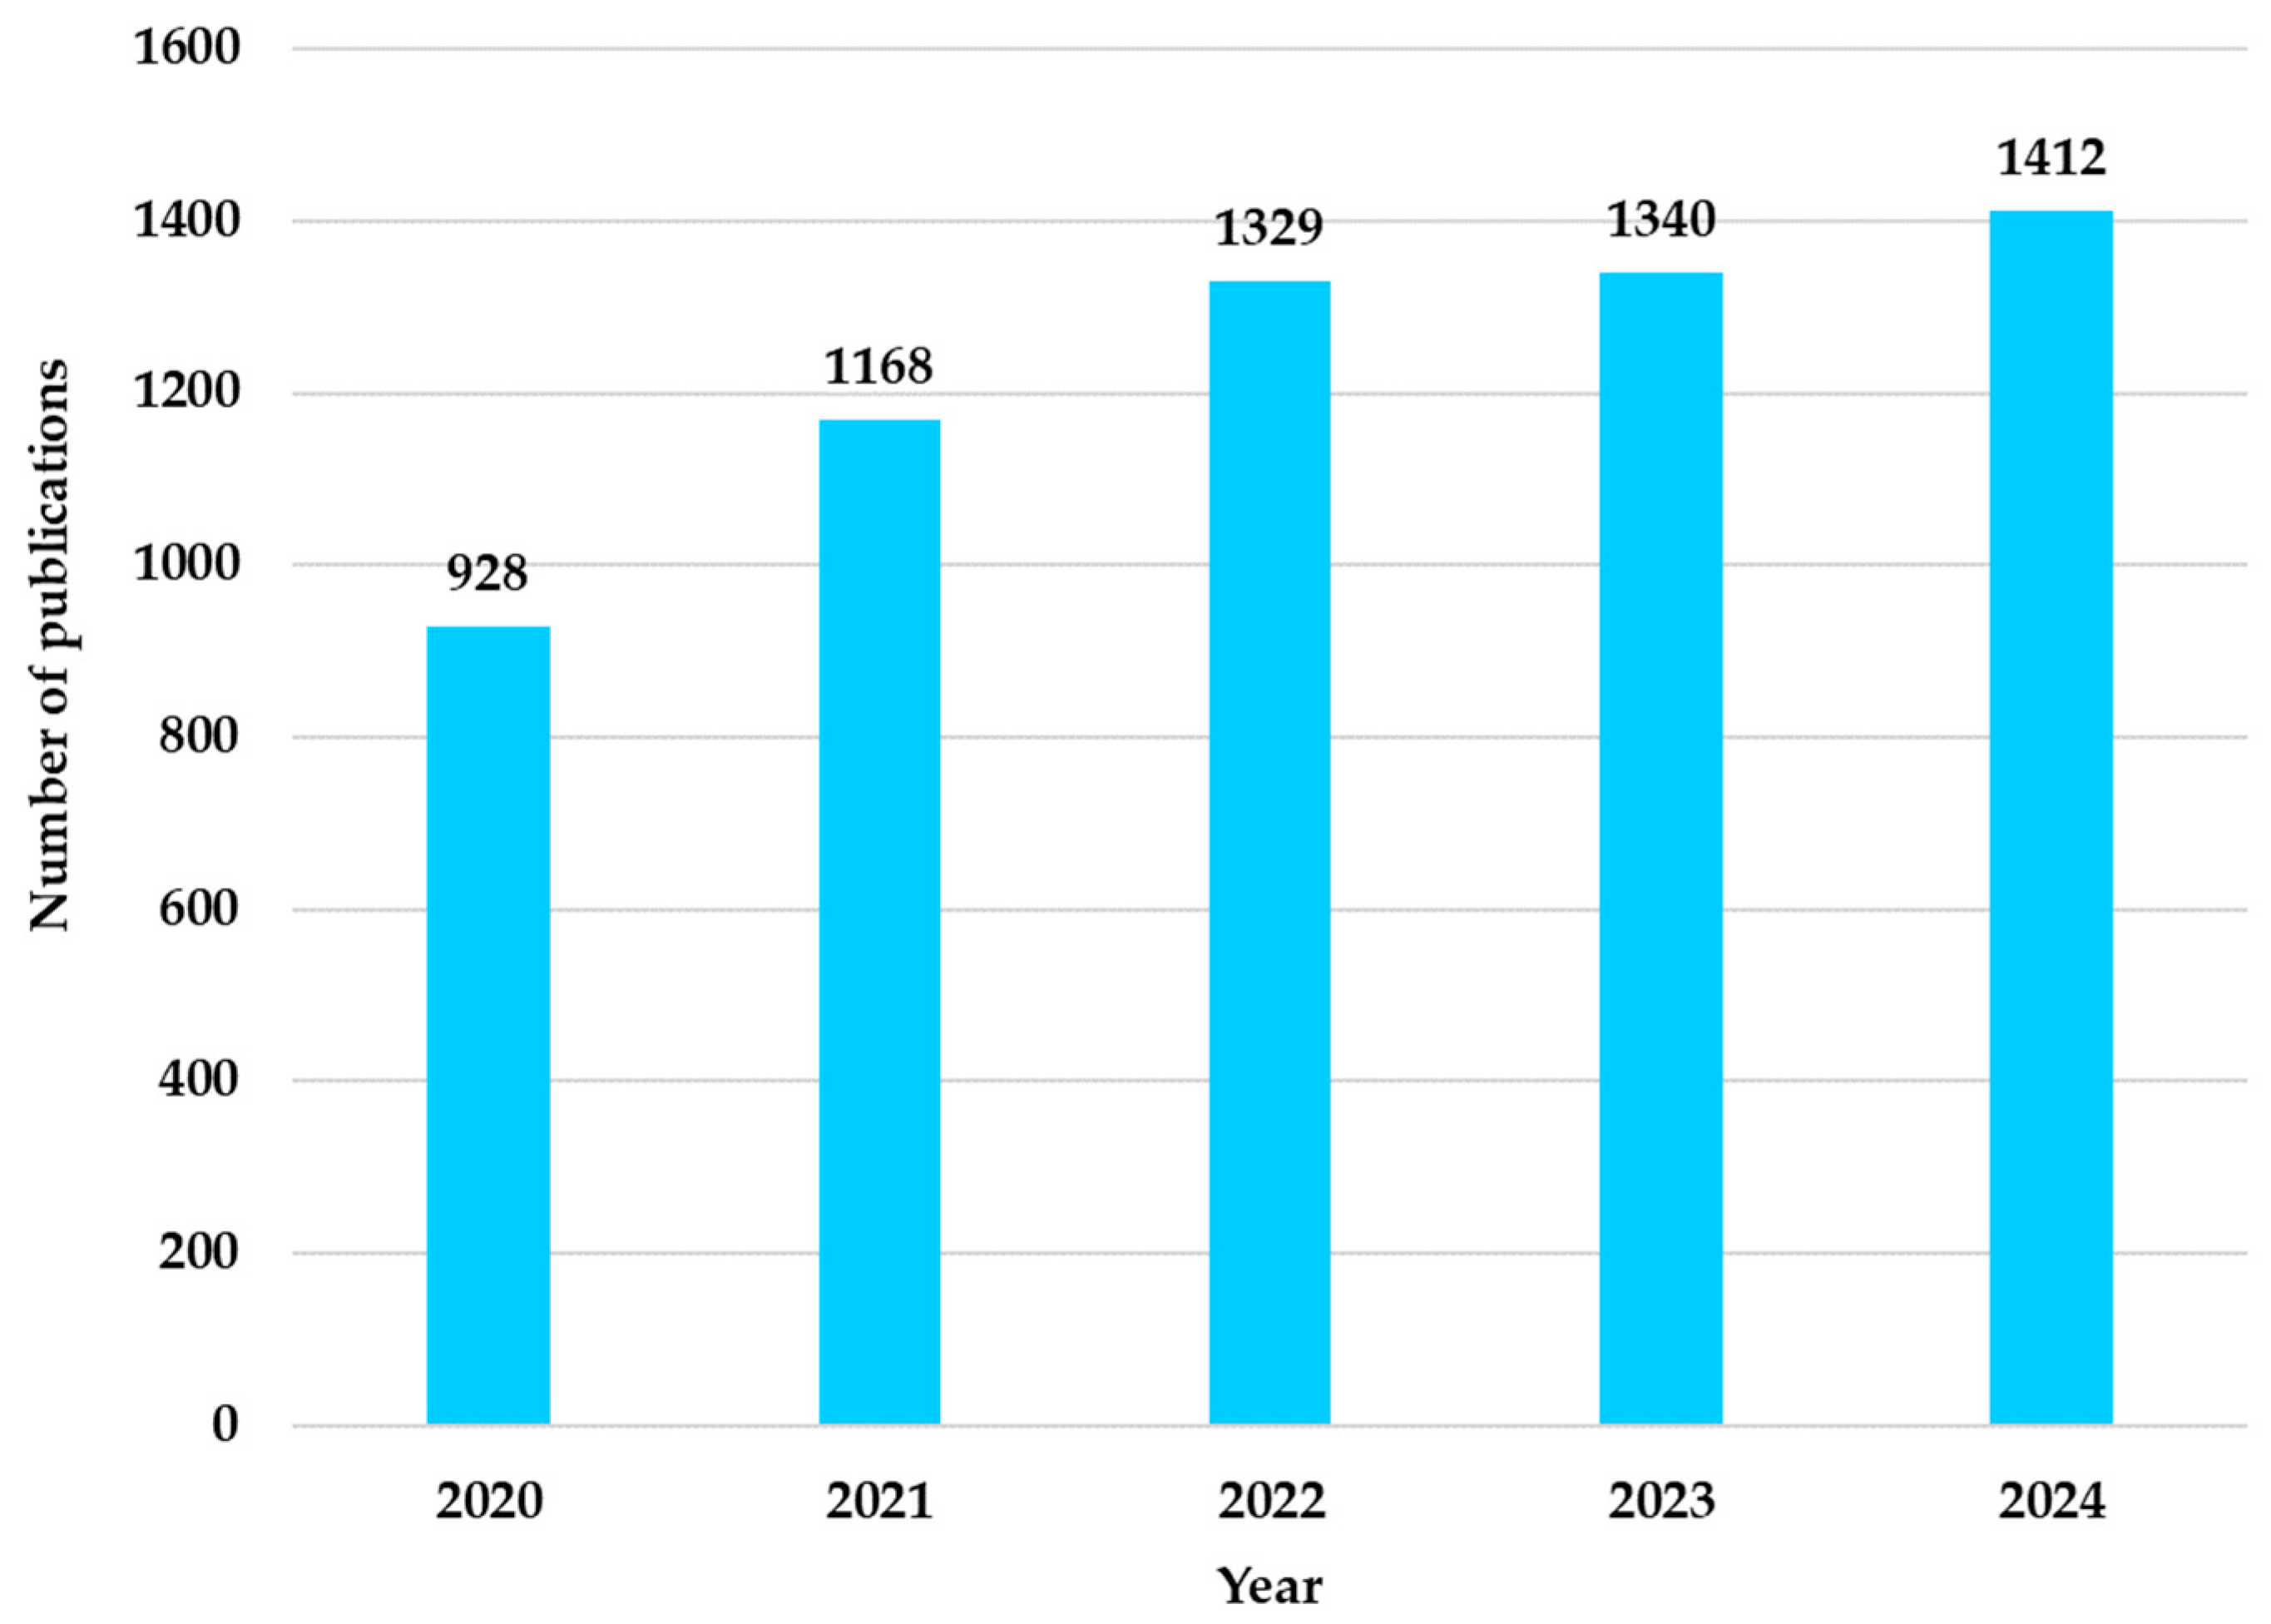
- Analysis 3: The distribution of papers by year in the Neuro-ML field (2020–2024) analyzes the temporal trends of researchers’ interest in applying ML in neurology.
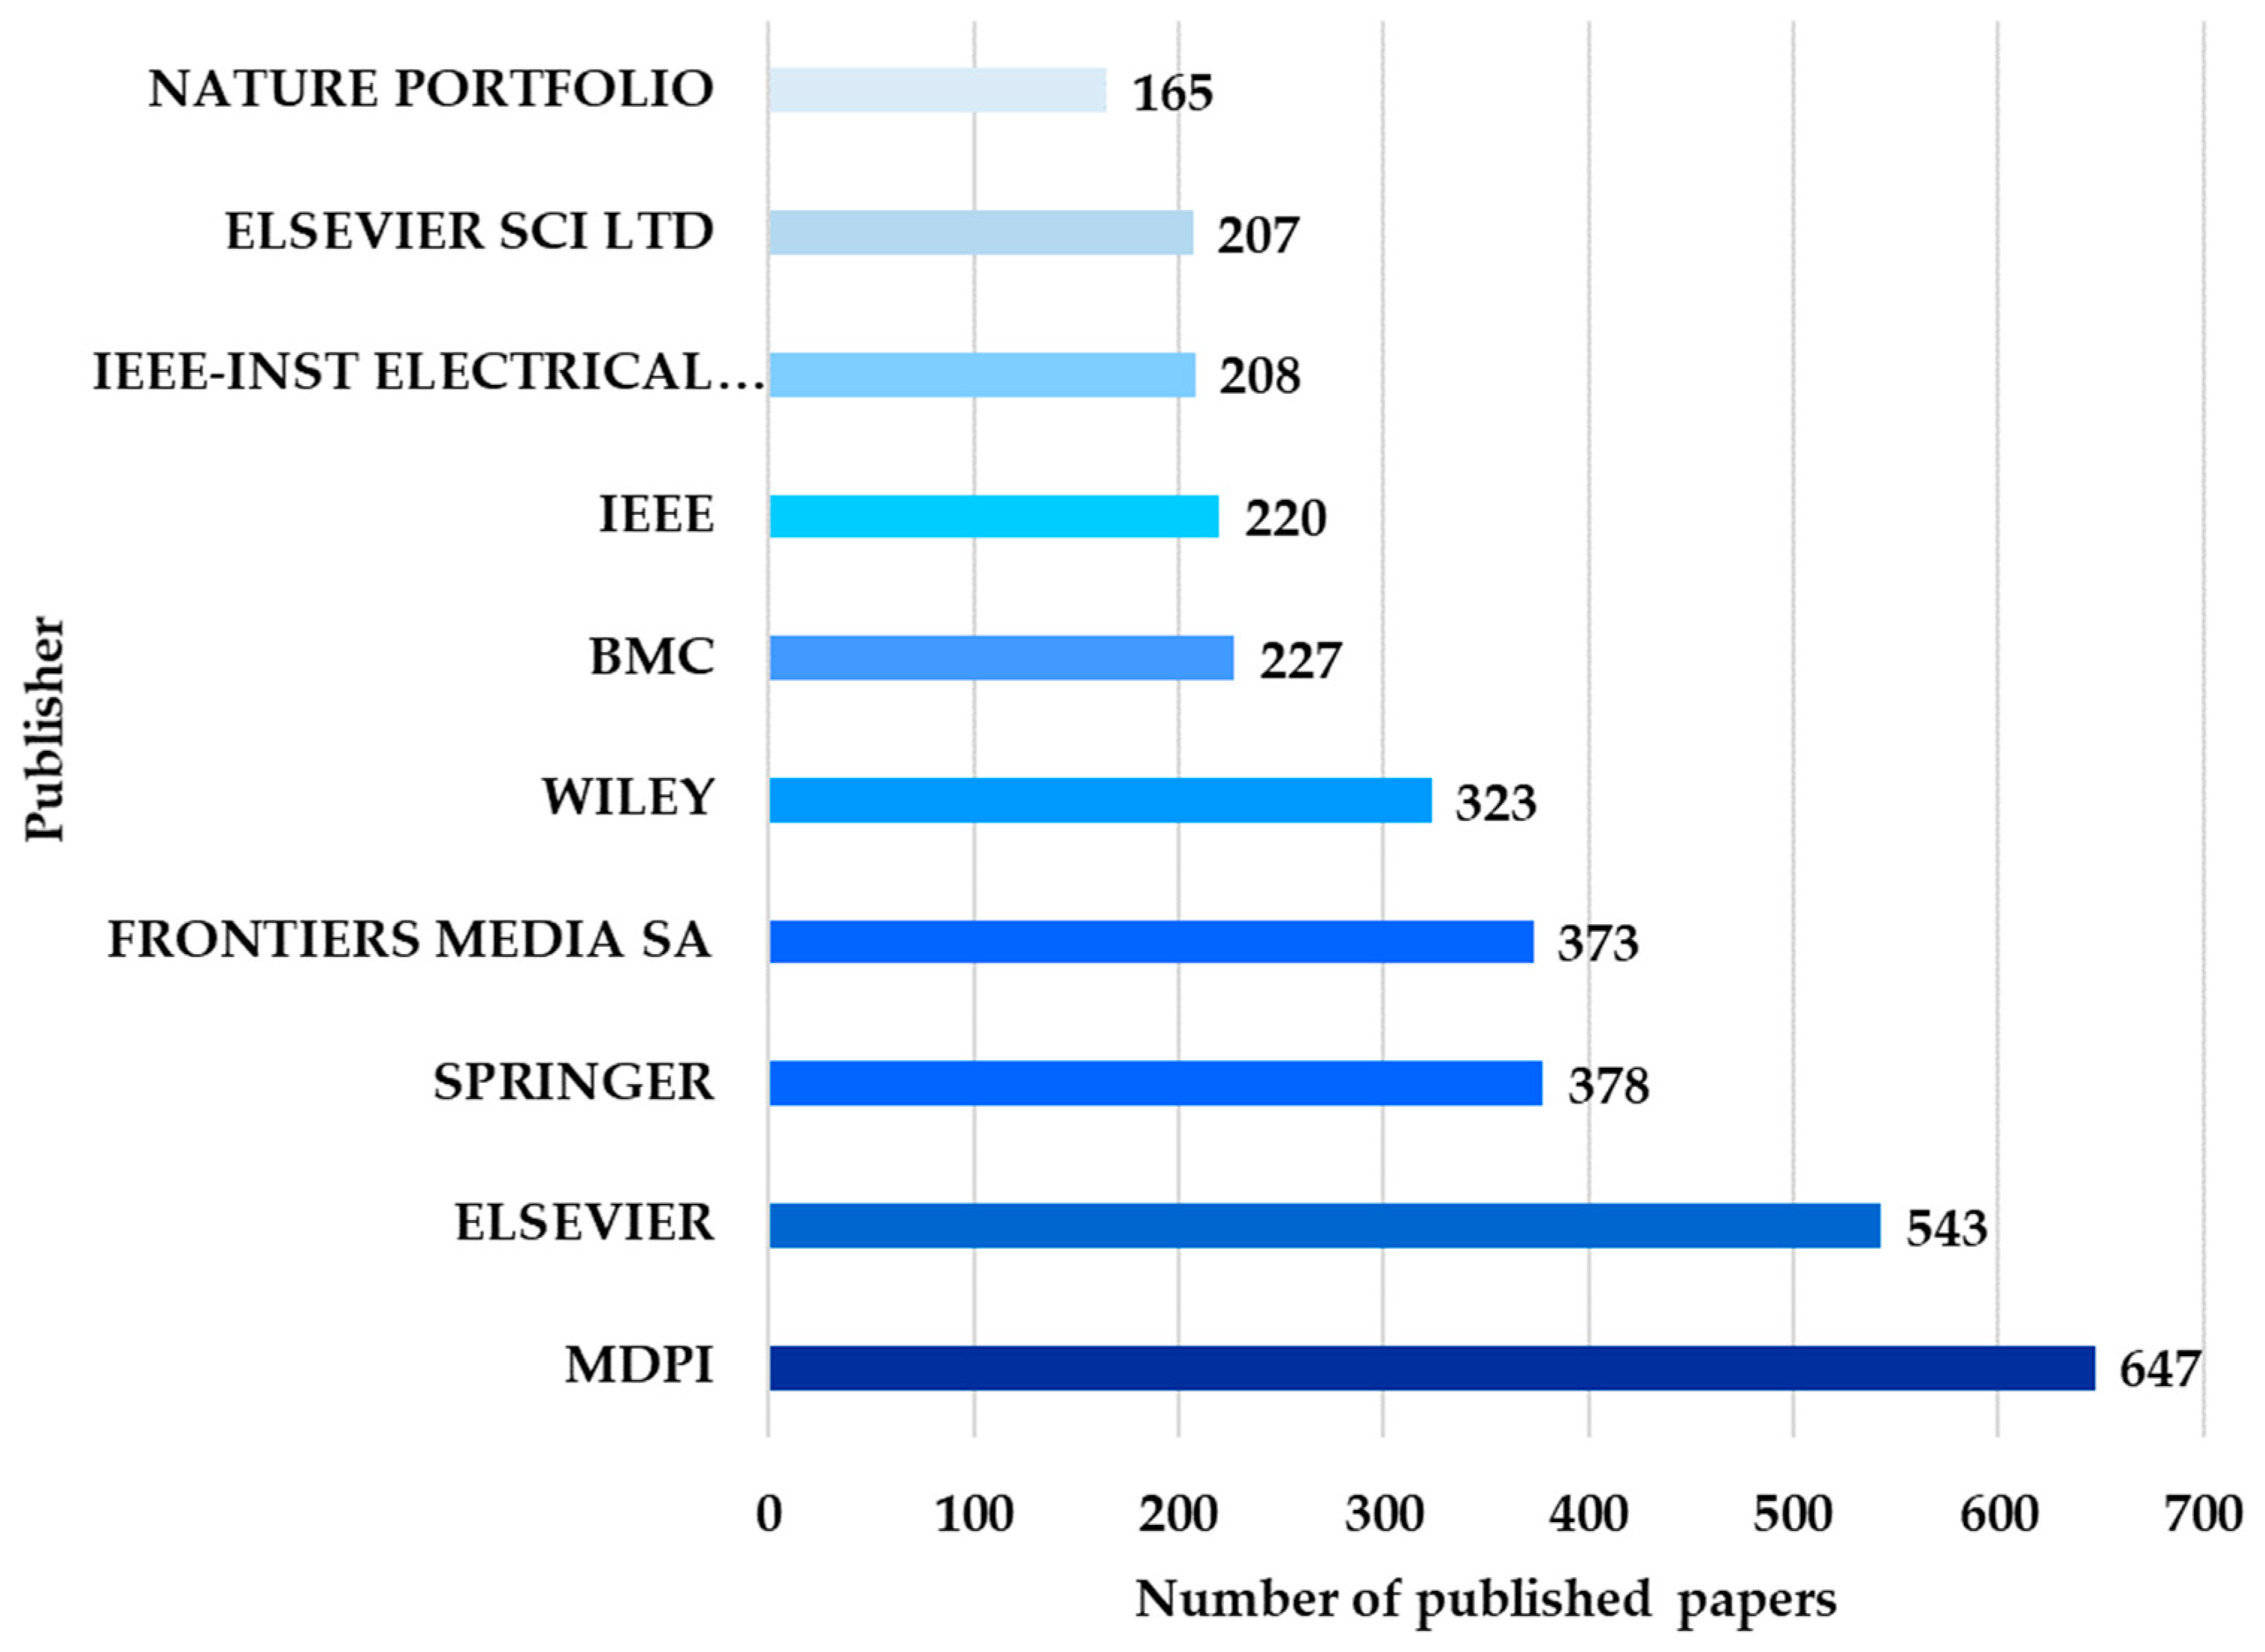
- Analysis 4: The distribution of works by publishers in the Neuro-ML field aims to identify the publishers that facilitate disseminating research results in the Neuro-ML field.
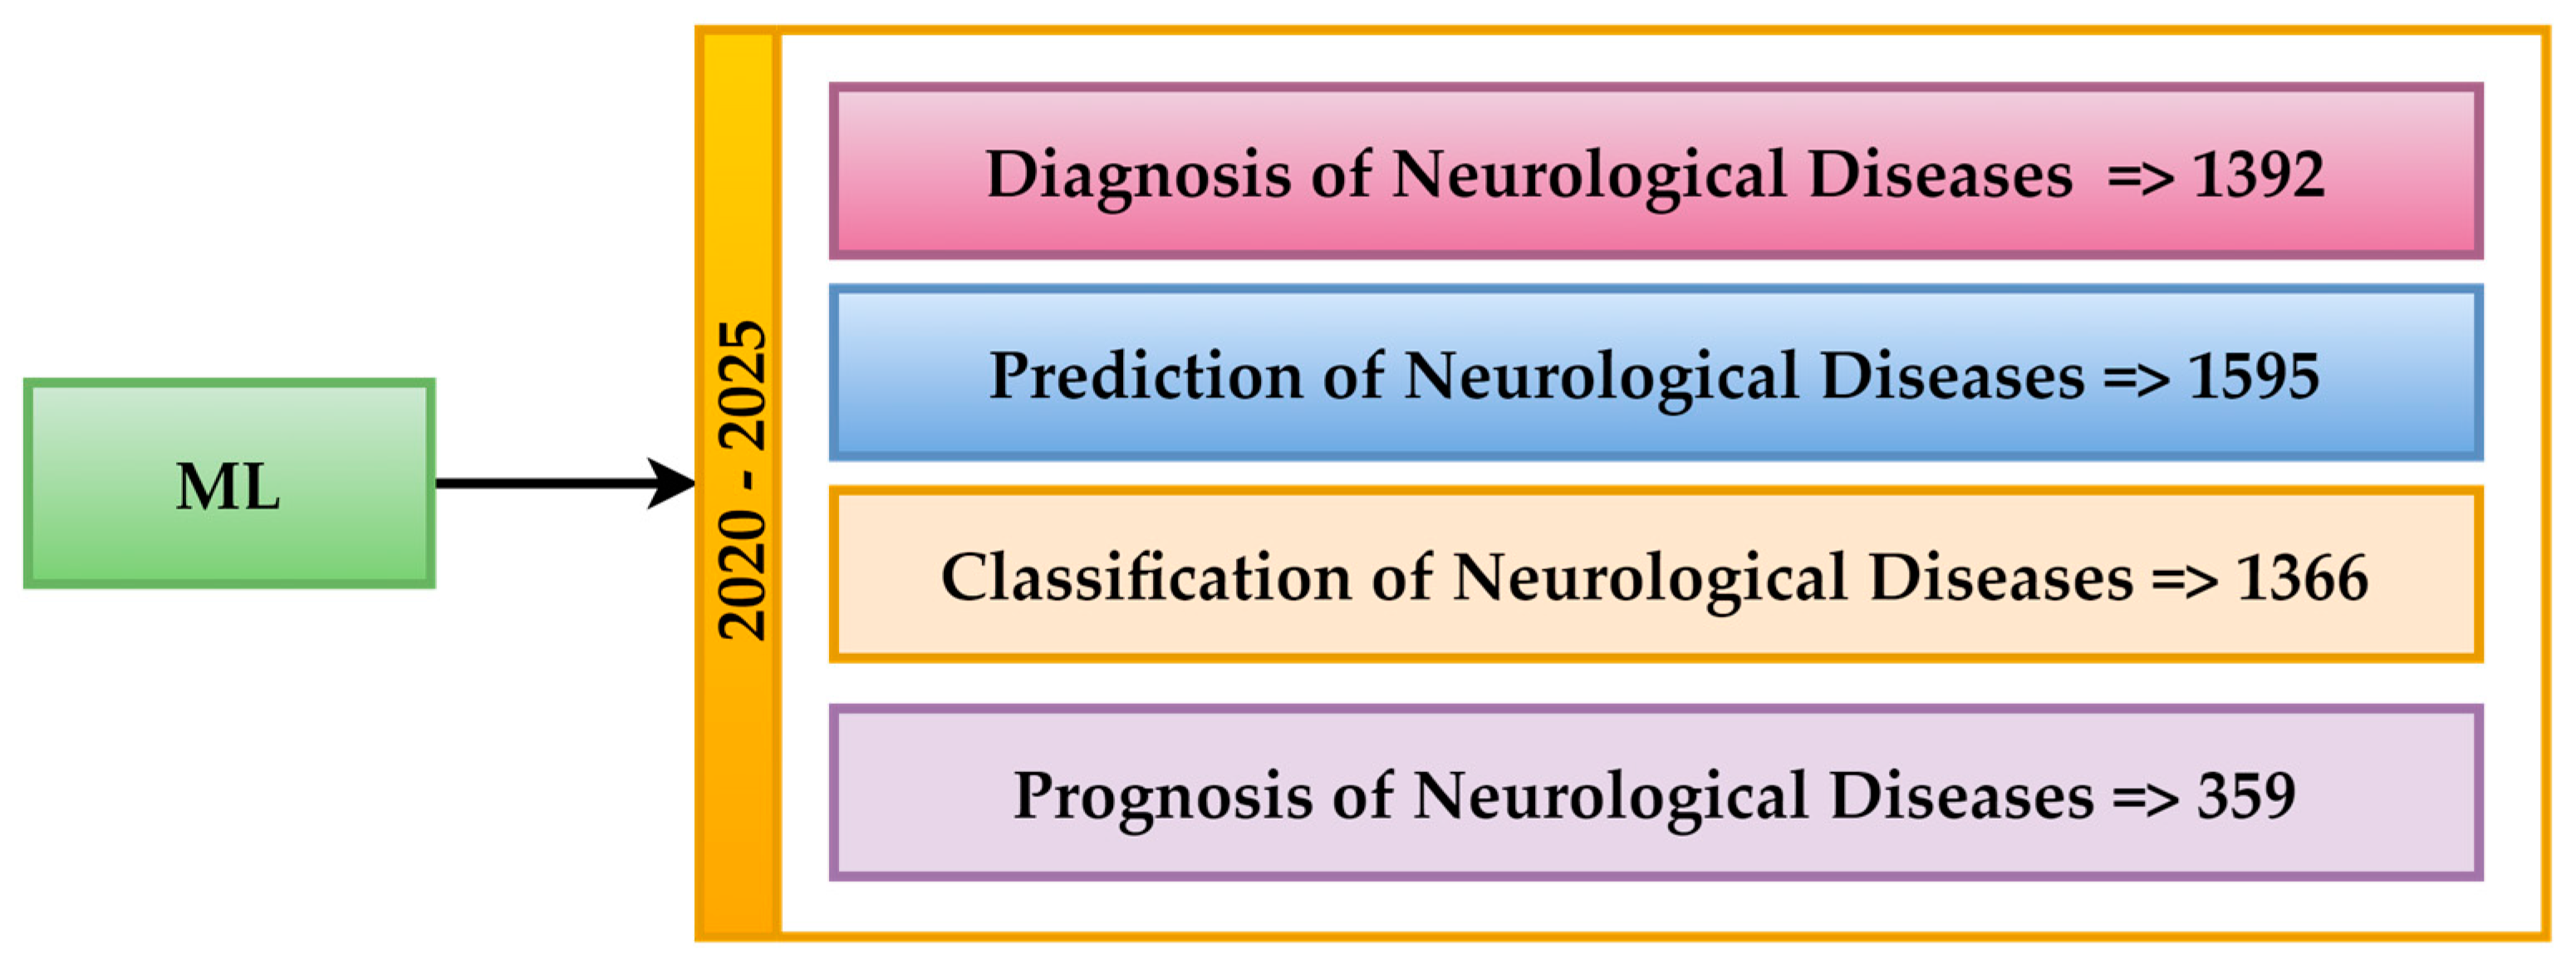
- Analysis 5: The Neuro-ML Distribution by Research Objectives aims to evaluate researchers’ priorities based on specific objectives, such as prediction, diagnosis, and classification.
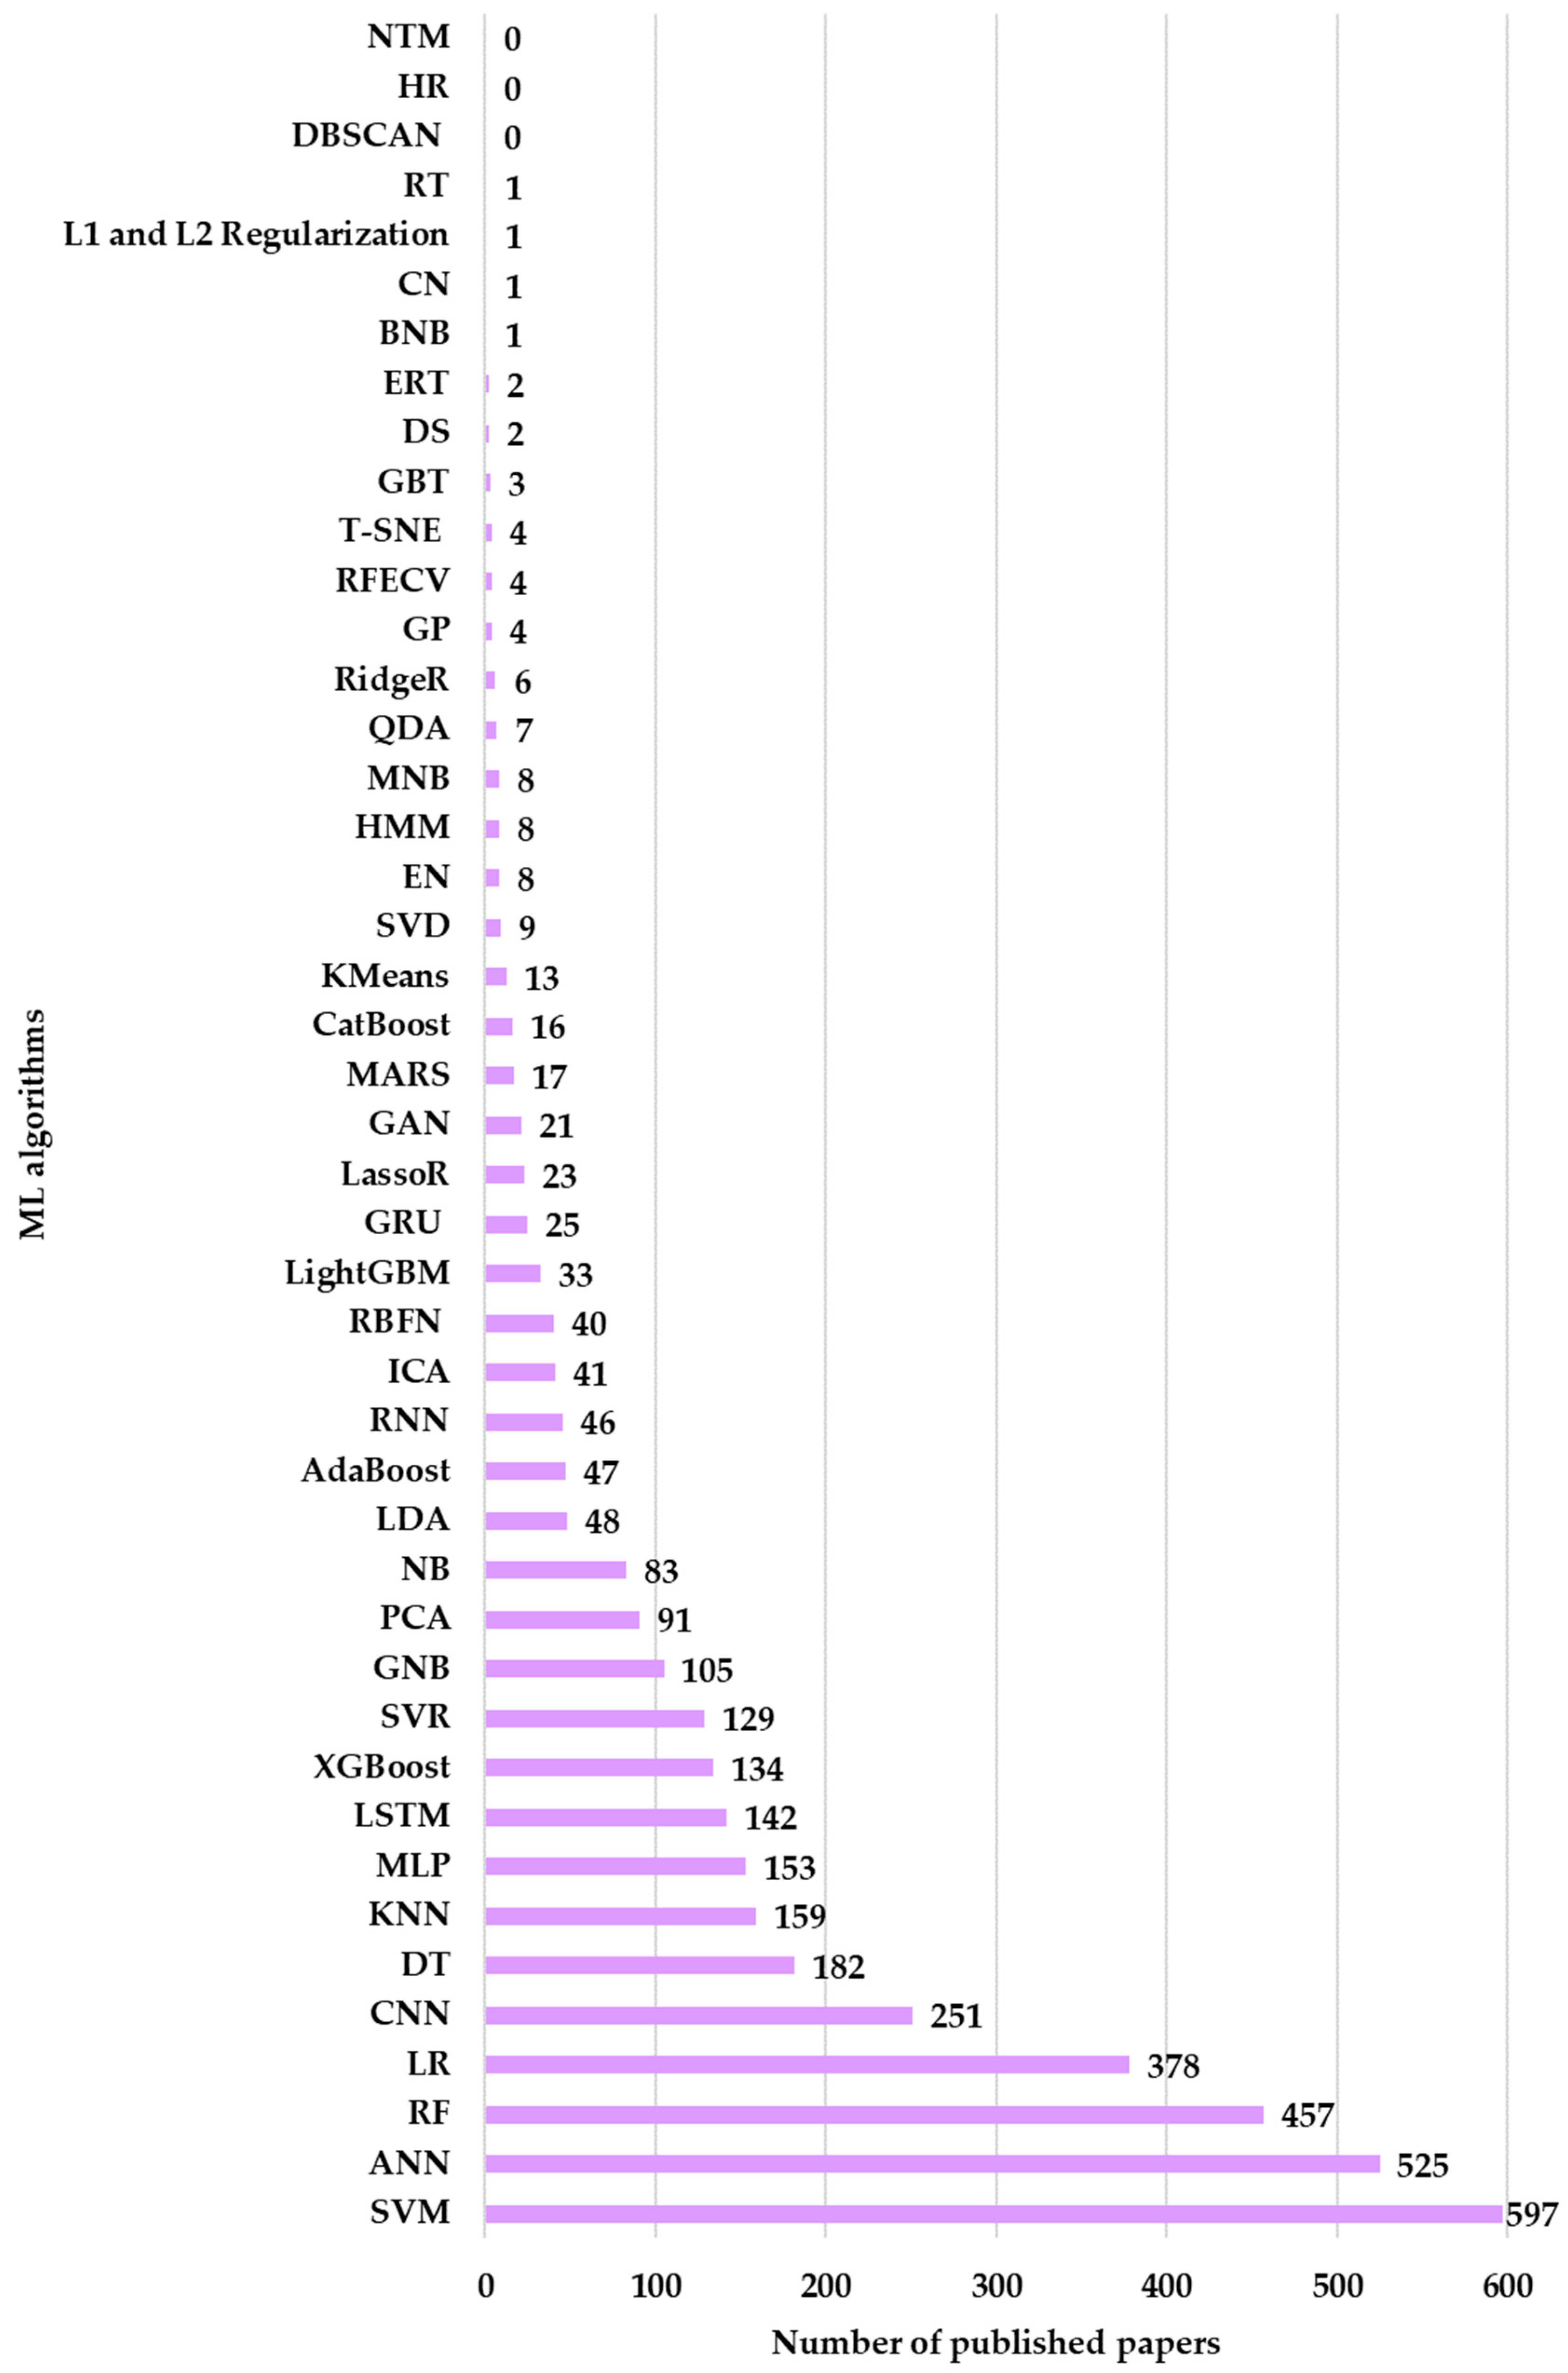
- Analysis 6: Comparing the number of articles for ML algorithms applied in neurological research (WOS) aims to establish the most used ML algorithms in neurological research.
- Analysis 7: Comparative metrics between ML models applied in different diseases research.
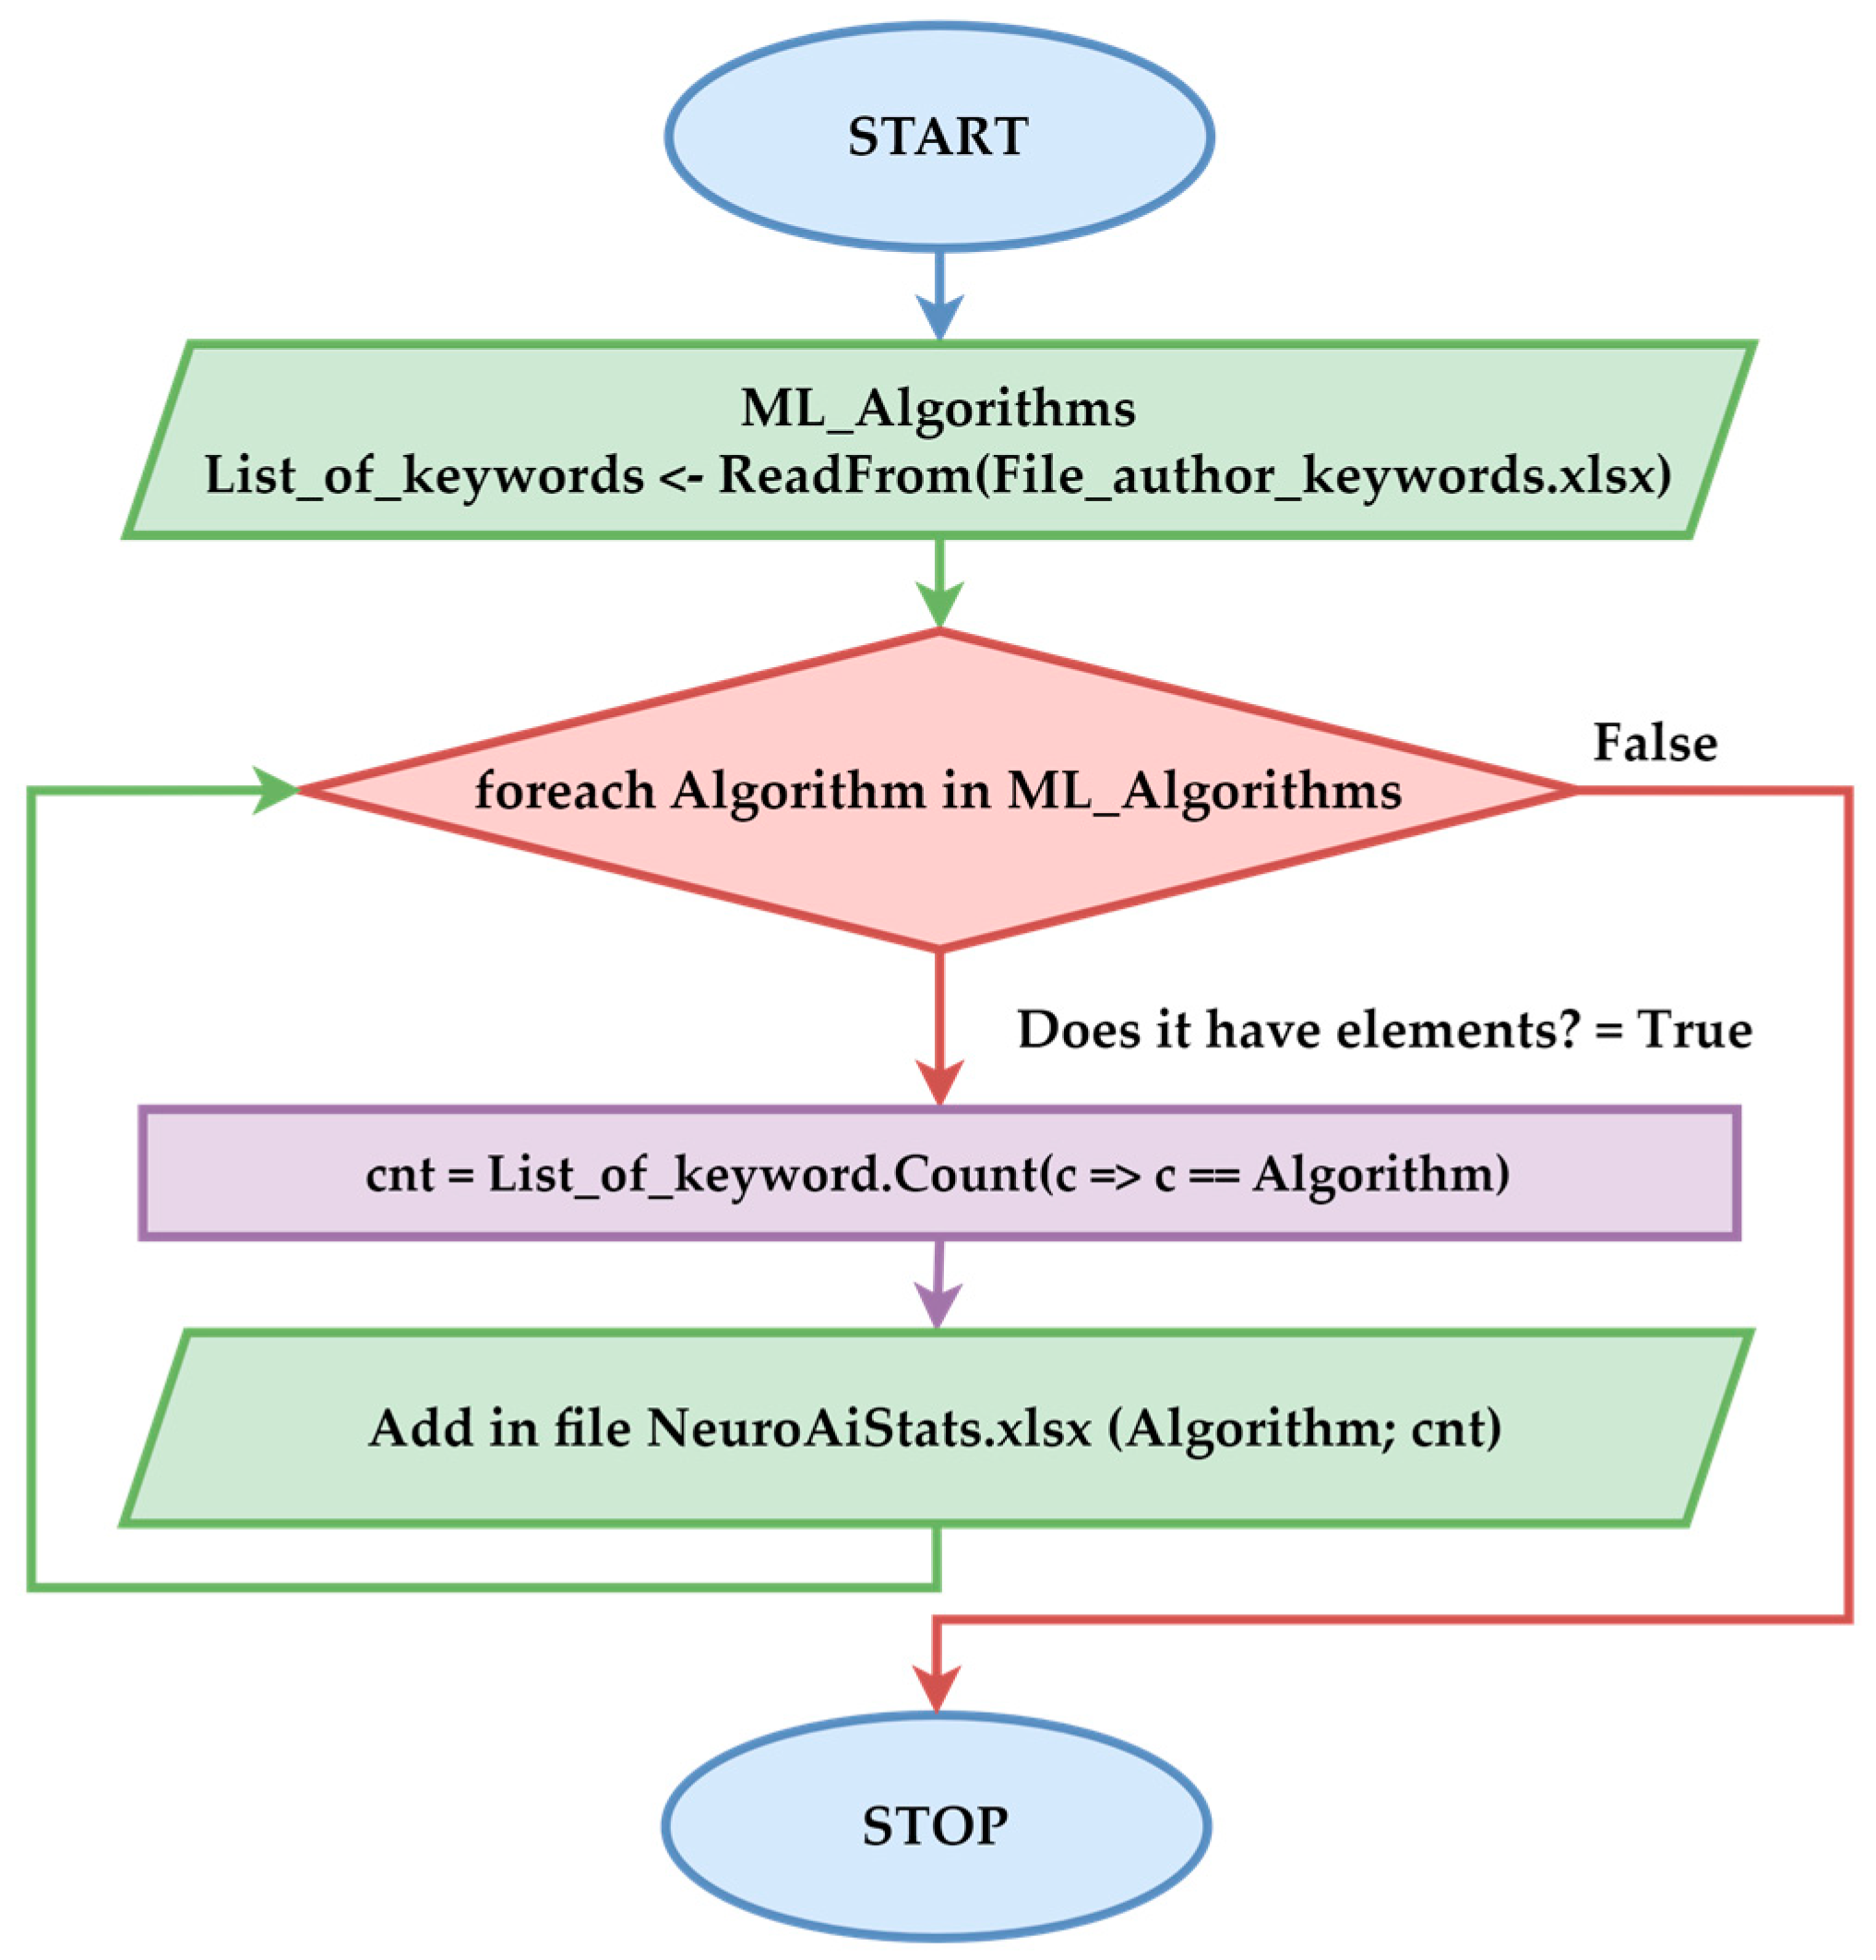
- Analysis 8: Comparing the number of articles on ML algorithms applied in neurological research (custom procedure) obtains a complementary WOS perspective on using ML algorithms through customized methods.
- Analysis 9: The comparative analysis of the results between the customized method and WOS aims to compare the results obtained through two different approaches to identify the differences.
- Analysis 10: Identifying gaps and opportunities in the specialized literature aims to highlight future research directions, focusing on the underrepresentation of rare diseases and the exploration of underutilized algorithms.
4. Results
4.1. Distribution of Research Papers Across Authors’ Keywords in Neuro-ML
- The first cluster (colored in red in Figure 6) comprises 16 terms, with neurological diseases (such as cerebrospinal diseases, inflammations, MS, Alzheimer’s, etc.) as central elements. This cluster highlights the significance of ML technologies in Neuro-AI diagnostics.
- The second cluster (colored in green), comprising 11 terms, is associated with ML techniques such as Artificial Neural Networks (ANNs), RF, and SVM. This cluster suggests that researchers are investigating various methods for analyzing neurological data.
- The third cluster (colored in blue) contains seven terms. This cluster features DL as its central element, highlighting the importance of feature selection and feature extraction techniques in electroencephalograms and epilepsy, particularly when using classification methods.
- The last cluster (colored in yellow) contains three terms correlating the MRI algorithm with neuroimaging and PD.
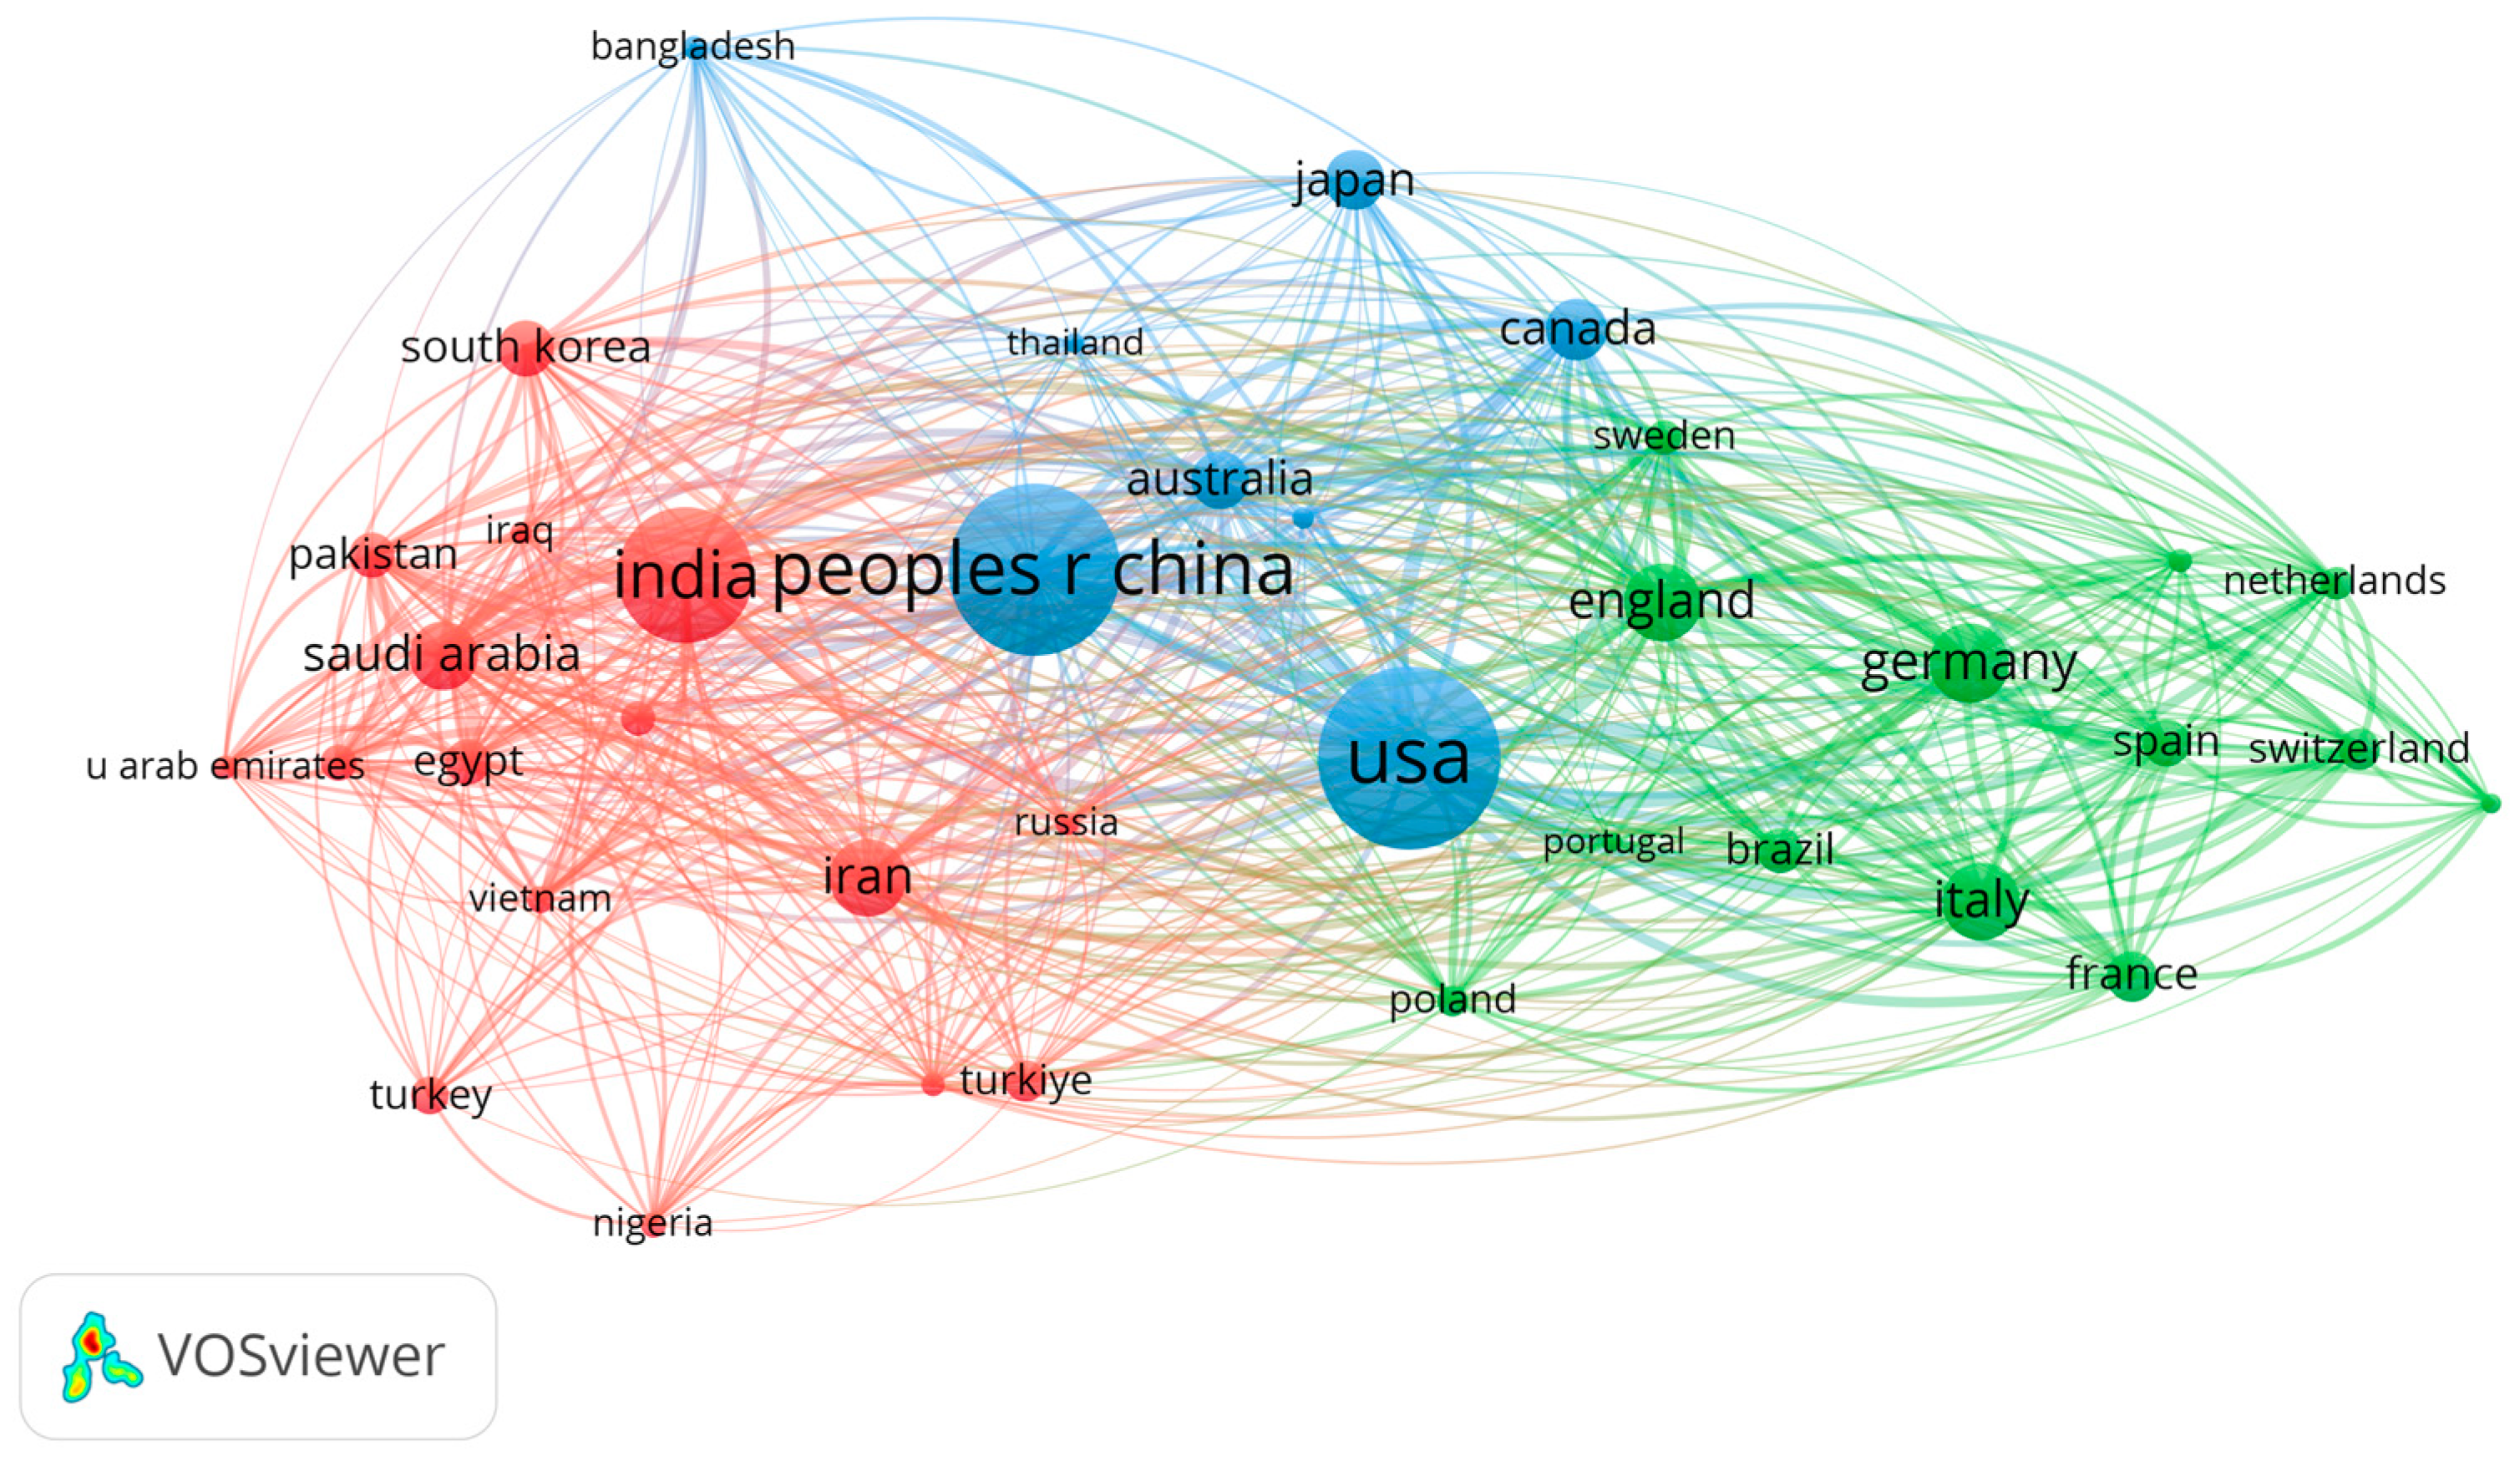
4.2. Distribution of Research Papers Across Countries in Neuro-ML
4.3. Distribution of Research Papers Across Years in Neuro-ML (2020–2024)
4.4. Distribution of Research Papers Across Publishers in the Neuro-ML Domain
4.5. Distribution of Neuro-ML Across Objective Research
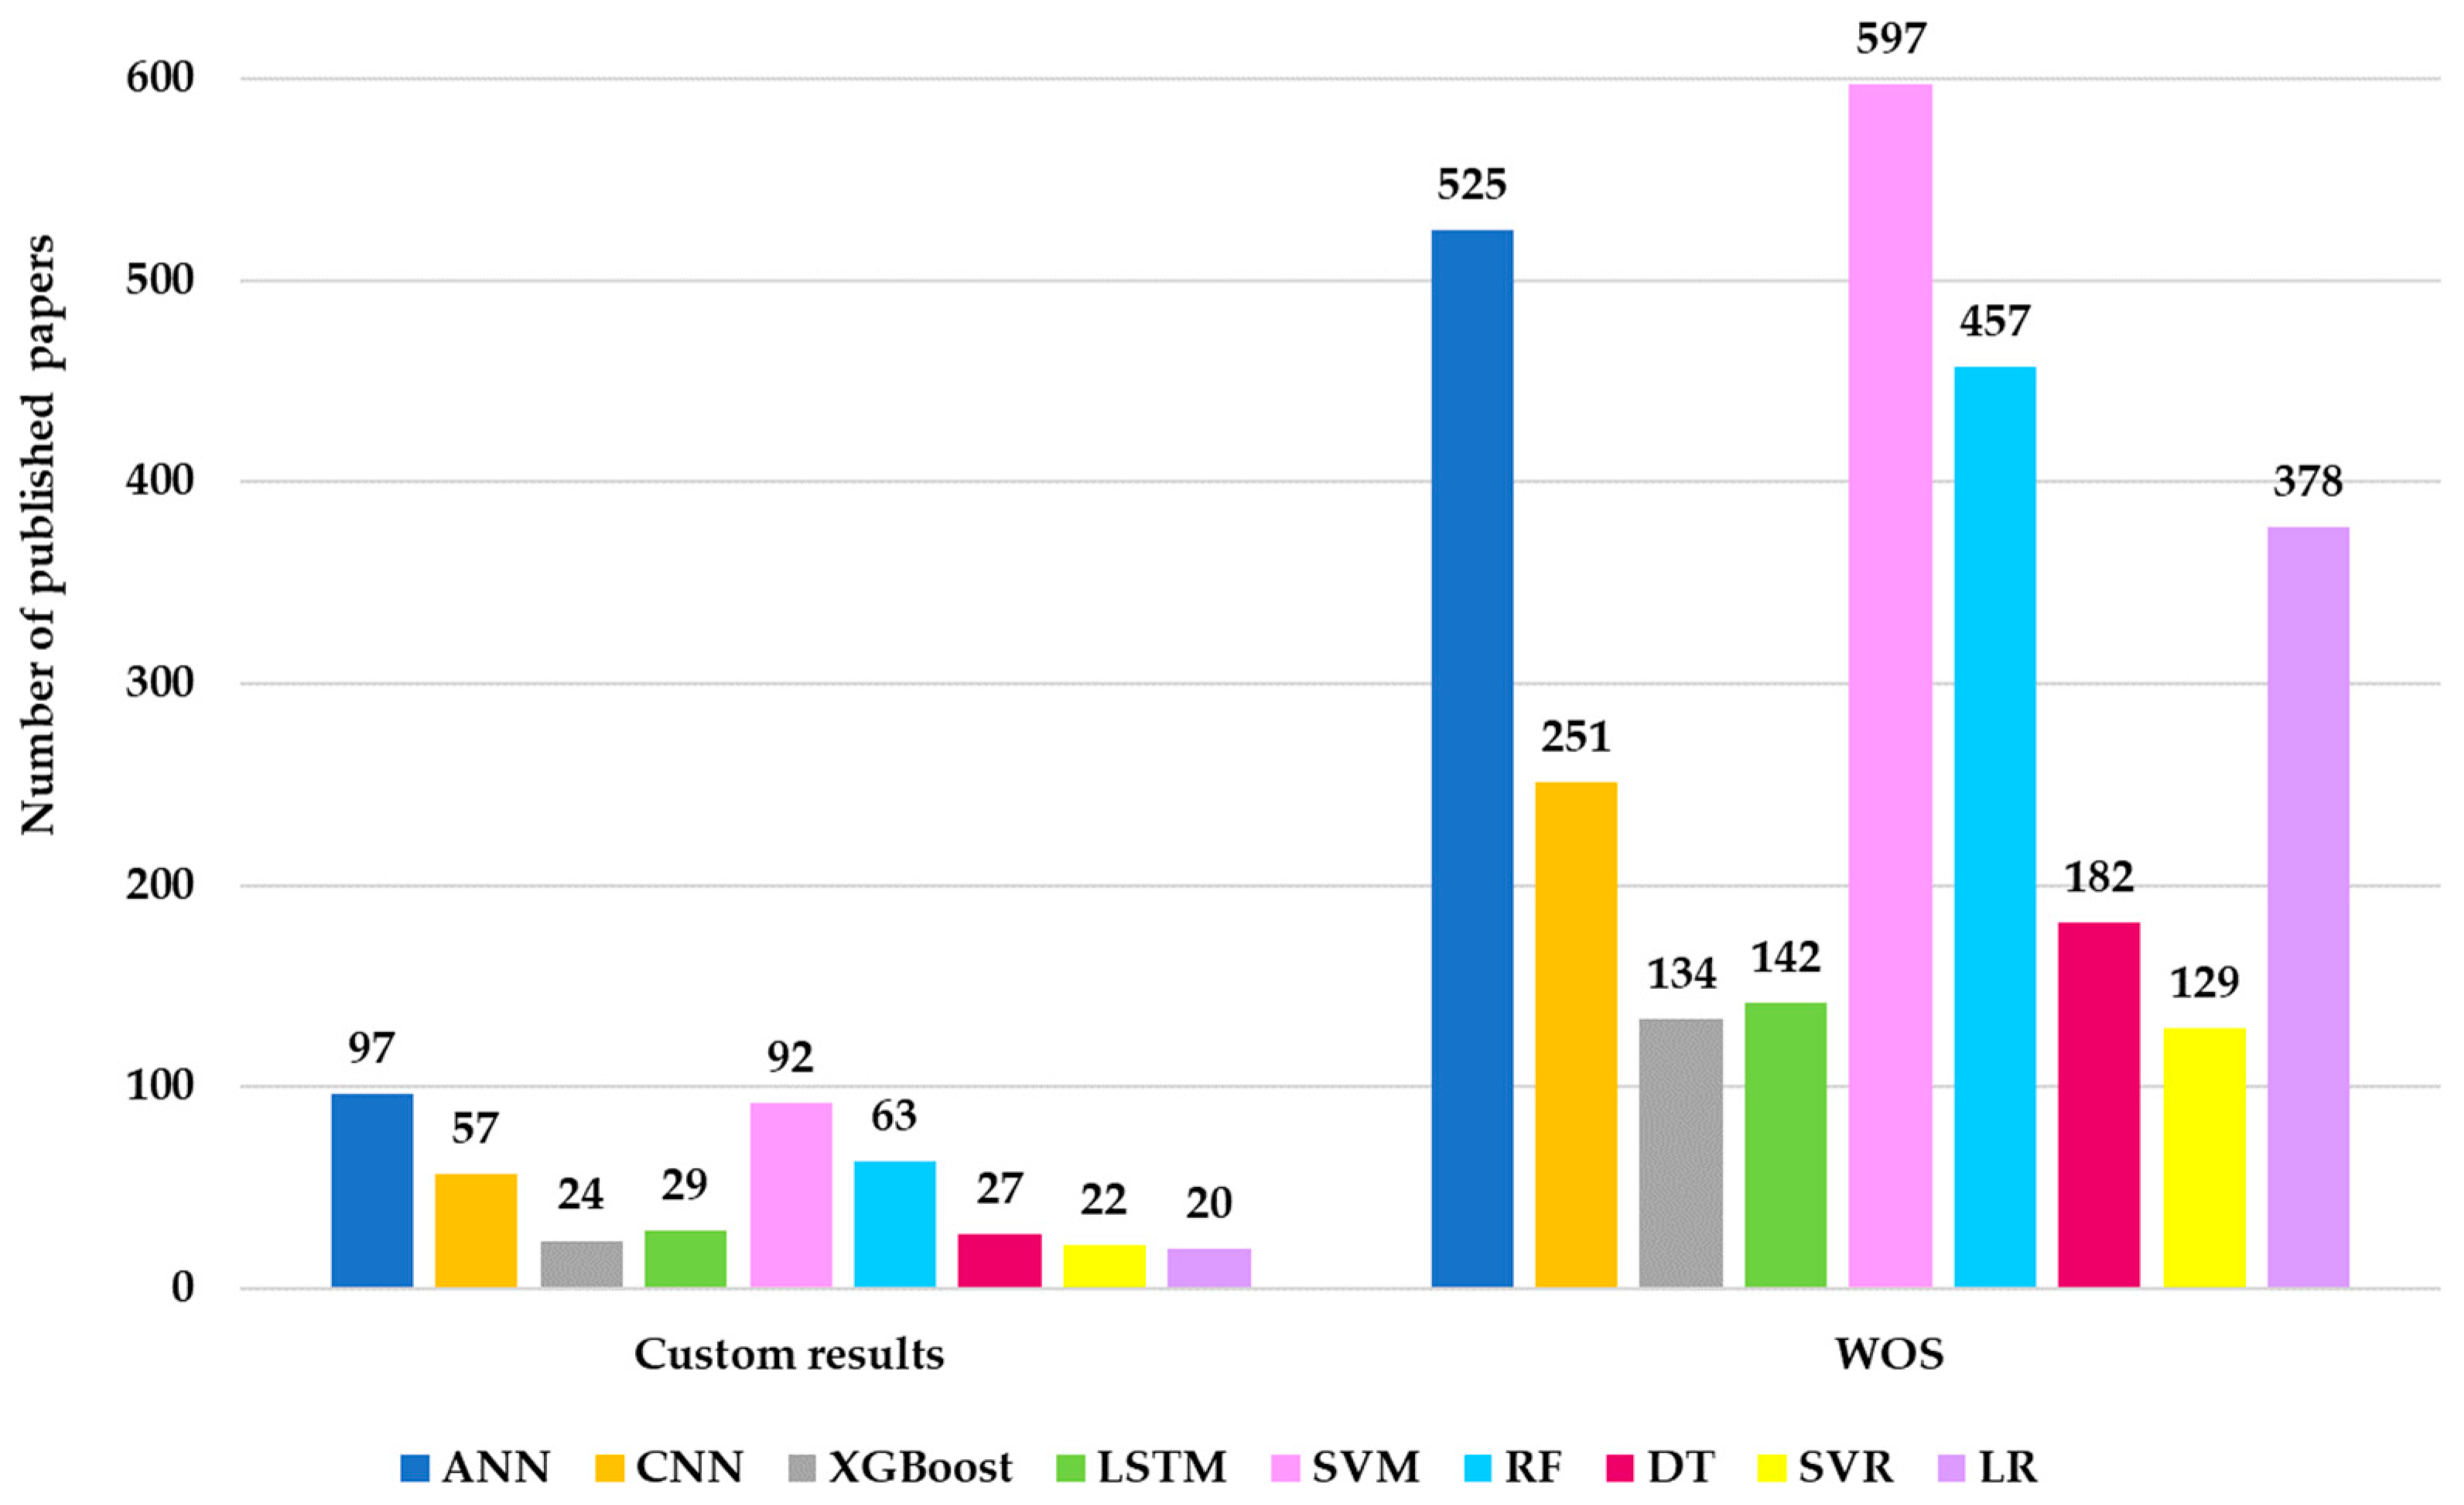
4.6. Comparison of Article Counts for ML Algorithms Applied in Neurological Research Based on WOS
4.7. Distribution of ML Algorithms Across Specific Neurological Diseases Relevant in Research
- The reduced volume of datasets required for the other ML algorithms generated a low number of results;
- The algorithms are not suitable for the issues of neural diseases;
- The lack of popularity of these algorithms causes researchers’ interest in them to be low.
4.8. Comparison of Article Counts for ML Algorithms Applied in Neurological Research Based on a Custom-Made Procedure
4.9. Comparative Analysis of Custom-Made vs. WOS Results for ML Algorithms in Neurology
4.10. Review of ML on AD
4.11. Review of ML on PD
4.12. Review of ML on MS
4.13. Overview of Publicly Available Datasets in Neuro-ML Studies
5. Discussion
- RQ1: The most commonly used ML methods for diagnosing neurodegenerative diseases are SVM (597 articles), ANN (525 articles), RF (457 articles), CNN (251 articles), and LSTM (142 articles). Other models, such as XGBoost, SVR, and MLP, have been studied less. These methods are mainly applied in diagnosing Alzheimer’s, Parkinson’s, and MS.
- RQ2: ML models surpass traditional methods in diagnosing neurodegenerative diseases through their ability to process large volumes of heterogeneous data. ML models can identify hidden patterns. For example, RF and SVM have reported accuracies of over 90% in diagnosing Alzheimer’s and Parkinson’s, compared to traditional methods that rely on subjective clinical assessments. Performance varies depending on the size of the dataset and its quality.
- RQ3: The main challenges include unbalanced datasets, affecting the models’ generalization ability. Additionally, the lack of standardized protocols for evaluating the performance of ML models makes it difficult to compare results between studies. Computational resources represent another challenge. Models such as CNN and LSTM require significant resources for training, which is a limitation for researchers.
- RQ4: The major limitations arise from the challenges presented earlier. Thus, in the category of limitations, the dependence on datasets that need to be voluminous and correlated, the underrepresentation of rare diseases, the underrepresentation of a class of algorithms that present difficulties in implementation both computationally and algorithmically, as well as the lack of standardization of performance metrics in relation to the specifics of neural diseases are identified.
5.1. Distribution of Articles Based on ML Algorithms in Neurological Research
5.2. Distribution of ML Algorithms in the Context of Specific Neurological Diseases
- ML models can shorten the diagnostic time and reduce the error rate in the early identification of neurodegenerative diseases (e.g., early diagnosis in Alzheimer’s with 97.46% accuracy using DBN-MOA).
- Algorithms allow personalized treatment by stratifying patients based on genetic or imaging biomarkers (e.g., in ALS or MS).
- The integration of ML into clinical practice remains dependent on standardized protocols and validation on large clinical datasets, which is recognized as a limitation and a priority direction for the future.
5.3. Research Gaps Identification
- Most studies investigate common diseases such as AD and PD, leaving rare diseases like ALS and prion diseases insufficiently explored. This limitation reduces the applicability of ML models in diagnosing these conditions.
- Algorithms such as XGBoost, LR, and MLP have not been sufficiently studied in the context of neurological diseases. A possible explanation could be the researchers’ insufficient knowledge of these techniques. A second explanation could be related to the difficulties associated with their implementation.
- Models like CNN and LSTM require large computational resources. In addition to this limitation, these models also require large volumes of data for training. These requirements can pose an obstacle for researchers working with limited resources.
- The lack of standardized protocols for evaluating the performance of ML models in the context of neurological diseases makes it difficult to compare results between different studies.
5.4. Future Directions
- Investment in data collection for rare diseases like ALS and prion diseases. Researchers can develop ML models that allow for the most accurate diagnosis by creating datasets associated with these conditions.
- Researchers should explore the potential of XGBoost and LR algorithms in the context of neurological diseases. Their approach could lead to discoveries beyond the models extensively investigated in the literature.
- The development of standardized protocols for evaluating the performance of ML models concerning neurological diseases would make it possible to compare results between studies to more easily identify the best models and their best configurations for each type of neurological disease.
- Developing computational tools that prevent resource limitations allows research to be conducted without advanced hardware resources.
- Exploring the integration of multimodal data, such as medical images, genetic data, and clinical biomarkers, into the performance of ML models. This multidisciplinary approach will lead to improved identification of the mechanisms of neurological diseases, which can have direct implications for the personalization of treatments.
6. Conclusions
- The extensive use of specific ML algorithms;
- High diagnostic performance for the most researched diseases;
- The unequal distribution of research on neurological diseases;
- Identification of training characteristics through biomarkers.
- The research gaps are mentioned below:
- The underrepresentation of rare diseases, such as ALS and prion diseases, which are insufficiently explored in the context of ML;
- Limiting underutilized algorithms, such as XGBoost, LR, and MLP, which are sporadically used in neurological research;
- The lack of standardization in evaluating ML model performance makes comparing results across different studies difficult.
- Unbalanced and limited datasets.
Supplementary Materials
Author Contributions
Funding
Data Availability Statement
Conflicts of Interest
Abbreviations
| AD | Alzheimer’s disease |
| AdaBoost | Adaptive Boosting |
| ADNI | Alzheimer’s Disease Neuroimaging Initiative |
| AI | Artificial intelligence |
| ALS | Amyotrophic Lateral Sclerosis |
| ANN | Artificial Neural Network |
| APOE | Apolipoprotein E |
| APOE4 | Apolipoprotein E4 |
| AUC | Area under the curve |
| BAD | Brain age difference |
| BNB | Bernoulli Naive Bayes |
| BO-SVM | Bayesian Optimization–Support Vector Machine |
| CAD | Computer-aided diagnosis |
| CatBoost | Categorical Boosting |
| CJD | Creutzfeldt–Jakob Disease |
| CN | Capsule Network |
| CNN | Convolutional Neural Network |
| CogN | Cognitively normal |
| CSF | Cerebrospinal fluid |
| DAT-SPECT | Dopamine transporter single-photon emission computed tomography |
| DBN | Deep Belief Network |
| DBSCAN | Density-Based Spatial Clustering of Applications with Noise |
| dFBB | Delay-phase 18F-florbetaben |
| dMRI | Diffusion Magnetic Resonance Imaging |
| DL | Deep learning |
| DM-SamEn | Dense Multiscale Sample Entropy |
| dReHo | Dynamic regional homogeneity |
| DS | Decision Stump |
| DT | Decision Tree |
| EEG | Electroencephalogram |
| EMD | Empirical mode decomposition |
| EN | Elastic Net |
| ERT | Extremely Randomized Tree |
| FBB | 18F-florbetaben |
| FKNN | Fine K-Nearest Neighbor |
| F-RSF | Random Survival Forests for women |
| FTD | Frontotemporal Dementia |
| GAN | Generative Adversarial Network |
| GEO | Gene Expression Omnibus |
| GB | Gradient Boosting |
| GBDT | Gradient-Boosted Decision Tree |
| GBT | Gradient Boosting Tree |
| GNB | Gaussian Naive Bayes |
| GP | Gaussian Processes |
| GRU | Gated Recurrent Unit |
| HC | Healthy control |
| HD | Huntington’s Disease |
| HMM | Hidden Markov Model |
| HR | Huber Regressor |
| ICA | Independent Component Analysis |
| ID | Integrated difference |
| IDD | Intellectual and Developmental Disability |
| KMeans | K-Means Clustering |
| KNN | K-Nearest Neighbors |
| LassoR | Lasso Regression |
| LBD | Lewy Body Dementia |
| LDA | Linear Discriminant Analysis |
| LightGBM | Light Gradient Boosting Machine |
| LR | Logistic Regression |
| LSTM | Long Short-Term Memory |
| MARS | Multivariate Adaptive Regression Splines |
| MCI | Mild cognitive impairment |
| ML | Machine learning |
| MLP | Multilayer Perceptron |
| MNB | Multinomial Naive Bayes |
| MOA | Moonflower Optimization Algorithm |
| MRI | Magnetic Resonance Imaging |
| M-RSF | Random Survival Forests for men |
| MS | Multiple Sclerosis |
| NB | Naive Bayes |
| NC | Natural compounds |
| NDD | Neurodevelopmental disorder |
| Neuro-ML | Machine learning algorithms used in the field of neurological diseases |
| NI | Normal individual |
| NLP | Natural language processing |
| NMO | Neuromyelitis Optica |
| NTM | Neural Turing Machines |
| OASIS | Open Access Series of Imaging Studies |
| OCB | Oligoclonal bands |
| PCA | Principal Component Analysis |
| PD | Parkinson’s disease |
| PET | Positron Emission Tomography |
| P-MCI | Mild cognitive impairment patient proceeding to AD |
| PPMI | Parkinson’s Progression Markers Initiative |
| PRNP | Prion protein |
| QDA | Quadratic Discriminant Analysis |
| RBFN | Radial Basis Function Network |
| ReHo | Regional homogeneity |
| RF | Random Forest |
| RFECV | Recursive Feature Elimination with Cross-Validation |
| RFR | Random Forest Regression |
| RidgeR | Ridge Regression |
| RNN | Recurrent Neural Networks |
| ROC | Receiver operating characteristic |
| RQ | Research question |
| RSF | Random Survival Forests |
| rs-fMRI | Resting-state functional Magnetic Resonance Imaging |
| RT | Randomized Trees |
| SCA | Spinocerebellar Ataxia |
| SFFS | Sequential floating forward |
| SGD | Stochastic Gradient Descent |
| SHAP | Shapley Additive Explanations |
| S-MCI | Stable Mild cognitive impairment patient |
| SMOTE | Synthetic minority over-sampling technique |
| SUVR | Standardized uptake value ratio |
| SVD | Singular Value Decomposition |
| SVM | Support Vector Machine |
| SVR | Support Vector Regression |
| T-SNE | t-Distributed Stochastic Neighbor Embedding |
| VGRF | Vertical ground reaction force |
| WOS | Web of Science |
| XAI | Explainable artificial intelligence |
| XGBoost | Extreme Gradient Boosting |
References
- Rosca, C.-M.; Stancu, A.; Tănase, M.R. A Comparative Study of Azure Custom Vision Versus Google Vision API Integrated into AI Custom Models Using Object Classification for Residential Waste. Appl. Sci. 2025, 15, 3869. [Google Scholar] [CrossRef]
- Rosca, C.-M.; Stancu, A.; Neculaiu, C.-F.; Gortoescu, I.-A. Designing and Implementing a Public Urban Transport Scheduling System Based on Artificial Intelligence for Smart Cities. Appl. Sci. 2024, 14, 8861. [Google Scholar] [CrossRef]
- Rosca, C.-M.; Stancu, A. Earthquake Prediction and Alert System Using IoT Infrastructure and Cloud-Based Environmental Data Analysis. Appl. Sci. 2024, 14, 10169. [Google Scholar] [CrossRef]
- Popescu, C.; Dissanayake, H.; Mansi, E.; Stancu, A. Eco Breakthroughs: Sustainable Materials Transforming the Future of Our Planet. Sustainability 2024, 16, 10790. [Google Scholar] [CrossRef]
- Alshehri, S.; Alahmari, K.A.; Alasiry, A. A Comprehensive Evaluation of AI-Assisted Diagnostic Tools in ENT Medicine: Insights and Perspectives from Healthcare Professionals. J. Pers. Med. 2024, 14, 354. [Google Scholar] [CrossRef]
- Kwok, T.N.C.; Henry, C.; Saffaran, S.; Meeus, M.; Bates, D.; Van Laere, D.; Boylan, G.; Boardman, J.P.; Sharkey, D. Application and potential of artificial intelligence in neonatal medicine. Semin. Fetal Neonatal Med. 2022, 27, 101346. [Google Scholar] [CrossRef]
- Joshi, G.; Jain, A.; Araveeti, S.R.; Adhikari, S.; Garg, H.; Bhandari, M. FDA-Approved Artificial Intelligence and Machine Learning (AI/ML)-Enabled Medical Devices: An Updated Landscape. Electronics 2024, 13, 498. [Google Scholar] [CrossRef]
- Baxi, V.; Edwards, R.; Montalto, M.; Saha, S. Digital pathology and artificial intelligence in translational medicine and clinical practice. Mod. Pathol. 2022, 35, 23–32. [Google Scholar] [CrossRef]
- Passaro, A.P.; Lebos, A.L.; Yao, Y.; Stice, S.L. Immune Response in Neurological Pathology: Emerging Role of Central and Peripheral Immune Crosstalk. Front. Immunol. 2021, 12, 676621. [Google Scholar] [CrossRef]
- Needham, E.J.; Chou, S.H.Y.; Coles, A.J.; Menon, D.K. Neurological Implications of COVID-19 Infections. Neurocrit. Care 2020, 32, 667–671. [Google Scholar] [CrossRef]
- Rosca, C.-M.; Stancu, A. Fusing Machine Learning and AI to Create a Framework for Employee Well-Being in the Era of Industry 5.0. Appl. Sci. 2024, 14, 10835. [Google Scholar] [CrossRef]
- Wang, T.V.; Song, P.C. Neurological Voice Disorders: A Review. Int. J. Head Neck Surg. 2022, 13, 32–40. [Google Scholar] [CrossRef]
- Waris, A.; Ali, A.; Khan, A.U.; Asim, M.; Zamel, D.; Fatima, K.; Raziq, A.; Khan, M.A.; Akbar, N.; Baset, A.; et al. Applications of Various Types of Nanomaterials for the Treatment of Neurological Disorders. Nanomaterials 2022, 12, 2140. [Google Scholar] [CrossRef] [PubMed]
- Ashraf, H.; Solla, P.; Sechi, L.A. Current Advancement of Immunomodulatory Drugs as Potential Pharmacotherapies for Autoimmunity Based Neurological Diseases. Pharmaceuticals 2022, 15, 1077. [Google Scholar] [CrossRef]
- Wang, P.; Lynn, A.; Miskimen, K.; Song, Y.E.; Wisniewski, T.; Cohen, M.; Appleby, B.S.; Safar, J.G.; Haines, J.L. Genome-wide association studies identify novel loci in rapidly progressive Alzheimer’s disease. Alzheimer’s Dement. 2024, 20, 2034–2046. [Google Scholar] [CrossRef]
- Saleem, T.J.; Zahra, S.R.; Wu, F.; Alwakeel, A.; Alwakeel, M.; Jeribi, F.; Hijji, M. Deep Learning-Based Diagnosis of Alzheimer’s Disease. J. Pers. Med. 2022, 12, 815. [Google Scholar] [CrossRef]
- Rahman, S.; Hasan, M.; Sarkar, A.K.; Khan, F. Classification of Parkinson’s Disease using Speech Signal with Machine Learning and Deep Learning Approaches. Eur. J. Electr. Eng. Comput. Sci. 2023, 7, 20–27. [Google Scholar] [CrossRef]
- Zeng, Q.; Shen, J.; Chen, K.; Zhou, J.; Liao, Q.; Lu, K.; Yuan, J.; Bi, F. The alteration of gut microbiome and metabolism in amyotrophic lateral sclerosis patients. Sci. Rep. 2020, 10, 12998. [Google Scholar] [CrossRef]
- Wang, H. Phylogenetic analysis of microRNA biomarkers for amyotrophic lateral sclerosis. BIOCELL 2021, 45, 547–561. [Google Scholar] [CrossRef]
- Stefanova, E.; Marjanović, A.; Dobričić, V.; Mandić-Stojmenović, G.; Stojković, T.; Branković, M.; Šarčević, M.; Novaković, I.; Kostić, V.S. Frequency of C9orf72, GRN, and MAPT pathogenic variants in patients recruited at the Belgrade Memory Center. Neurogenetics 2024, 25, 193–200. [Google Scholar] [CrossRef]
- Tellone, E.; Galtieri, A.; Ficarra, S. Reviewing Biochemical Implications of Normal and Mutated Huntingtin in Huntington’s Disease. Curr. Med. Chem. 2020, 27, 5137–5158. [Google Scholar] [CrossRef] [PubMed]
- Rosser, A.E.; Busse, M.E.; Gray, W.P.; Badin, R.A.; Perrier, A.L.; Wheelock, V.; Cozzi, E.; Martin, U.P.; Salado-Manzano, C.; Mills, L.J.; et al. Translating cell therapies for neurodegenerative diseases: Huntington’s disease as a model disorder. Brain 2022, 145, 1584–1597. [Google Scholar] [CrossRef] [PubMed]
- Ratner, M.H.; Rutchik, J.S. A rare case of early onset lewy body dementia with parkinsonism associated with chronic exposure to copper contaminated drinking water. Front. Toxicol. 2024, 6, 1451235. [Google Scholar] [CrossRef] [PubMed]
- Schmitz, M.; Villar-Piqué, A.; Hermann, P.; Escaramís, G.; Calero, M.; Chen, C.; Kruse, N.; Cramm, M.; Golanska, E.; Sikorska, B.; et al. Diagnostic accuracy of cerebrospinal fluid biomarkers in genetic prion diseases. Brain 2022, 145, 700–712. [Google Scholar] [CrossRef] [PubMed]
- Kothekar, H.; Chaudhary, K. Kuru Disease: Bridging the Gap Between Prion Biology and Human Health. Cureus 2024, 16, e51708. [Google Scholar] [CrossRef]
- Ouchi, H.; Ishiguro, H.; Shibano, K.; Hara, K.; Sugawara, M.; Enomoto, K.; Miyata, H. Primary degeneration of oculomotor, motor, and somatosensory systems and auditory and visual pathways in spinocerebellar ataxia type 7: A clinicopathological study in a Japanese autopsy case. Neuropathology 2023, 43, 164–175. [Google Scholar] [CrossRef]
- Palvadeau, R.; Kaya-Güleç, Z.E.; Şimşir, G.; Vural, A.; Öztop-Çakmak, Ö.; Genç, G.; Aygün, M.S.; Falay, O.; Başak, A.N.; Ertan, S. Cerebellar cognitive-affective syndrome preceding ataxia associated with complex extrapyramidal features in a Turkish SCA48 family. Neurogenetics 2020, 21, 51–58. [Google Scholar] [CrossRef]
- Duggirala, N.; Ngo, K.J.; Pagnoni, S.M.; Rosa, A.L.; Fogel, B.L. Spinocerebellar ataxia type 14 (SCA14) in an Argentinian family: A case report. J. Med. Case Rep. 2023, 17, 168. [Google Scholar] [CrossRef]
- Podbielska, M.; Szulc, Z.M.; Ariga, T.; Pokryszko-Dragan, A.; Fortuna, W.; Bilinska, M.; Podemski, R.; Jaskiewicz, E.; Kurowska, E.; Yu, R.K.; et al. Distinctive sphingolipid patterns in chronic multiple sclerosis lesions. J. Lipid Res. 2020, 61, 1464–1479. [Google Scholar] [CrossRef]
- Oraby, M.I.; El Masry, H.A.; Abd El Shafy, S.S.; Abdul Galil, E.M. Serum level of brain-derived neurotrophic factor in patients with relapsing–remitting multiple sclerosis: A potential biomarker for disease activity. Egypt. J. Neurol. Psychiatry Neurosurg. 2021, 57, 40. [Google Scholar] [CrossRef]
- Rosca, C.-M.; Cărbureanu, M. A Comparative Analysis of Sorting Algorithms for Large-Scale Data: Performance Metrics and Language Efficiency. In Emerging Trends and Technologies on Intelligent Systems: Proceedings of the ETTIS 2024, Noida, India, 27–28 March 2024; Lecture Notes in Networks and Systems; Springer Nature: Berlin/Heidelberg, Germany, 2025; Volume 1073, pp. 99–113. [Google Scholar] [CrossRef]
- Rosca, C.-M.; Stancu, A. A Comprehensive Review of Machine Learning Models for Optimizing Wind Power Processes. Appl. Sci. 2025, 15, 3758. [Google Scholar] [CrossRef]
- Liu, J. SSH Application Classification Based on Machine Learning. Mach. Learn. Theory Pract. 2021, 2, 20–27. [Google Scholar] [CrossRef]
- Sharp, J. Exam Ref AI-900 Microsoft Azure AI Fundamentals; Pearson Education: London, UK, 2022. [Google Scholar]
- Rosca, C.-M.; Gortoescu, I.A.; Tanase, M.R. Artificial Intelligence—Powered Video Content Generation Tools. Rom. J. Pet. Gas Technol. 2024, 5, 131–144. [Google Scholar] [CrossRef]
- Endut, N.; Hamzah, W.M.A.F.W.; Ismail, I.; Yusof, M.K.; Baker, Y.A.; Yusoff, H. A Systematic Literature Review on Multi-Label Classification based on Machine Learning Algorithms. TEM J. 2022, 11, 658–666. [Google Scholar] [CrossRef]
- Ling, Q. Machine learning algorithms review. Appl. Comput. Eng. 2023, 4, 91–98. [Google Scholar] [CrossRef]
- Liao, M.; Duan, H.; Wang, G. Application of Machine Learning Techniques to Detect the Children with Autism Spectrum Disorder. J. Healthc. Eng. 2022, 2022, 9340027. [Google Scholar] [CrossRef]
- Rosca, C.-M.; Stancu, A.; Ariciu, A.V. Algorithm for child adoption process using artificial intelligence and monitoring system for children. Internet Things 2024, 26, 101170. [Google Scholar] [CrossRef]
- Ramadurgam, S.; Perera, D.G. An Efficient FPGA-Based Hardware Accelerator for Convex Optimization-Based SVM Classifier for Machine Learning on Embedded Platforms. Electronics 2021, 10, 1323. [Google Scholar] [CrossRef]
- Huang, Z. A Research on Image Recognition and Classification Based on Traditional Machine Learning and Deep Learning. Trans. Comput. Sci. Intell. Syst. Res. 2024, 5, 766–773. [Google Scholar] [CrossRef]
- Ye, S. Blended Learning for Machine Learning-based Image Classification. EAI Endorsed Trans. E-Learn. 2023, 9, 1–7. [Google Scholar] [CrossRef]
- Sinra, A.; Waluyo Poetro, B.S.; Angriani, H.; Zein, H.; Musdar, I.A.; Taruk, M. Optimizing Neurodegenerative Disease Classification with Canny Segmentation and Voting Classifier: An Imbalanced Dataset Study. Int. J. Artif. Intell. Med. Issues 2023, 1, 95–105. [Google Scholar] [CrossRef]
- Escamilla-Luna, O.; Wister, M.A.; Hernandez-Torruco, J. Machine Learning Algorithms for Classification Patients with Parkinson’s Disease and Hereditary Ataxias. J. Commun. Softw. Syst. 2023, 19, 9–18. [Google Scholar] [CrossRef]
- Tian, J.; Smith, G.; Guo, H.; Liu, B.; Pan, Z.; Wang, Z.; Xiong, S.; Fang, R. Modular machine learning for Alzheimer’s disease classification from retinal vasculature. Sci. Rep. 2021, 11, 238. [Google Scholar] [CrossRef] [PubMed]
- Martinez-Valbuena, I. Phenotype parallels protein seeding capacity in neurodegenerative diseases. Brain Pathol. 2024, 34, e13238. [Google Scholar] [CrossRef]
- Payares-Garcia, D.; Mateu, J.; Schick, W. Spatially informed Bayesian neural network for neurodegenerative diseases classification. Stat. Med. 2023, 42, 105–121. [Google Scholar] [CrossRef]
- Cheung, C.Y.; Ran, A.R.; Wang, S.; Chan, V.T.T.; Sham, K.; Hilal, S.; Venketasubramanian, N.; Cheng, C.-Y.; Sabanayagam, C.; Tham, Y.C.; et al. A deep learning model for detection of Alzheimer’s disease based on retinal photographs: A retrospective, multicentre case-control study. Lancet Digit. Health 2022, 4, e806–e815. [Google Scholar] [CrossRef]
- Snyder, P.J.; Alber, J.; Alt, C.; Bain, L.J.; Bouma, B.E.; Bouwman, F.H.; Debuc, D.C.; Campbell, M.C.W.; Carrillo, M.C.; Chew, E.Y.; et al. Retinal imaging in Alzheimer’s and neurodegenerative diseases. Alzheimer’s Dement. 2021, 17, 103–111. [Google Scholar] [CrossRef]
- Roșca, C.-M.; Bold, R.-A.; Gerea, A.-E. A Comprehensive Patient Triage Algorithm Incorporating ChatGPT API for Symptom-Based Healthcare Decision-Making. In Emerging Trends and Technologies on Intelligent Systems: Proceedings of the ETTIS 2024, Noida, India, 27–28 March 2024; Lecture Notes in Networks and Systems; Springer Nature: Berlin/Heidelberg, Germany, 2025; Volume 1073, pp. 167–178. [Google Scholar] [CrossRef]
- Sun, M.; Yan, T.; Liu, R.; Zhao, X.; Zhou, X.; Ma, Y.; Jia, J. Predictive value of machine learning in diagnosing cognitive impairment in patients with Parkinson’s disease: A systematic review and meta-analysis. Ann. Palliat. Med. 2022, 11, 3775–3784. [Google Scholar] [CrossRef]
- Rosca, C.-M. Comparative Analysis of Object Classification Algorithms: Traditional Image Processing Versus Artificial Intelligence-Based Approach. Rom. J. Pet. Gas Technol. 2023, 4, 169–180. [Google Scholar] [CrossRef]
- Quazi, S. Artificial intelligence and machine learning in precision and genomic medicine. Med. Oncol. 2022, 39, 120. [Google Scholar] [CrossRef]
- Chang, C.-H.; Lin, C.-H.; Lane, H.-Y. Machine Learning and Novel Biomarkers for the Diagnosis of Alzheimer’s Disease. Int. J. Mol. Sci. 2021, 22, 2761. [Google Scholar] [CrossRef] [PubMed]
- Yi, F.; Yang, H.; Chen, D.; Qin, Y.; Han, H.; Cui, J.; Bai, W.; Ma, Y.; Zhang, R.; Yu, H. XGBoost-SHAP-based interpretable diagnostic framework for alzheimer’s disease. BMC Med. Inform. Decis. Mak. 2023, 23, 137. [Google Scholar] [CrossRef] [PubMed]
- Helaly, H.A.; Badawy, M.; Haikal, A.Y. Deep Learning Approach for Early Detection of Alzheimer’s Disease. Cogn. Comput. 2022, 14, 1711–1727. [Google Scholar] [CrossRef] [PubMed]
- Agostinho, D.; Caramelo, F.; Moreira, A.P.; Santana, I.; Abrunhosa, A.; Castelo-Branco, M. Combined Structural MR and Diffusion Tensor Imaging Classify the Presence of Alzheimer’s Disease With the Same Performance as MR Combined With Amyloid Positron Emission Tomography: A Data Integration Approach. Front. Neurosci. 2022, 15, 638175. [Google Scholar] [CrossRef]
- Krokidis, M.G.; Vrahatis, A.G.; Lazaros, K.; Skolariki, K.; Exarchos, T.P.; Vlamos, P. Machine Learning Analysis of Alzheimer’s Disease Single-Cell RNA-Sequencing Data across Cortex and Hippocampus Regions. Curr. Issues Mol. Biol. 2023, 45, 8652–8669. [Google Scholar] [CrossRef]
- Zhou, B.; Wei, J.; Zhang, Y.; Liu, Y.; Shan, S.; Ye, S.; Li, B.; Fan, D.; Luo, Y. Different observation period of exercise training in amyotrophic lateral sclerosis patients: A meta-analysis. Front. Neurol. 2022, 13, 986882. [Google Scholar] [CrossRef]
- Wong, J.K.; Roselle, A.K.; Shue, T.M.; Shimshak, S.J.E.; Beaty, J.M.; Celestin, N.M.; Gao, I.; Griffin, R.P.; Cudkowicz, M.E.; Sadiq, S.A. Apolipoprotein B-100-mediated motor neuron degeneration in sporadic amyotrophic lateral sclerosis. Brain Commun. 2022, 4, fcac207. [Google Scholar] [CrossRef]
- Ingre, C.; Chen, L.; Zhan, Y.; Termorshuizen, J.; Yin, L.; Fang, F. Lipids, apolipoproteins, and prognosis of amyotrophic lateral sclerosis. Neurology 2020, 94, e1835–e1844. [Google Scholar] [CrossRef]
- Van Bergeijk, K.H.; Voors, A.A.; Wykrzykowska, J.J. Prime time for machine learning to predict clinical outcomes in valvular heart disease? Eur. J. Heart Fail. 2021, 23, 2033–2034. [Google Scholar] [CrossRef]
- Torres, J.; Malla, S.D.; Silveira, V.; Mainero, L.; Czeisler, C.; Díaz-Rossello, J.L.; Maccarrone, A.; Medoro, A.; Sanchez, P.; Blasina, F.; et al. Local clinical informatics investments are required for in silico biomarker generation across the globe: Lessons learned from a secondary analysis of the PROP trial. J. Glob. Health Rep. 2022, 6, e2022038. [Google Scholar] [CrossRef]
- Jaramillo, J.; Solano, J.M.; Aristizábal, A.; Martínez, J. Analysis of SOD1 and C9orf72 mutations in patients with amyotrophic lateral sclerosis in Antioquia, Colombia. Biomédica 2022, 42, 623–632. [Google Scholar] [CrossRef] [PubMed]
- Poss, A.M.; Maschek, J.A.; Cox, J.E.; Hauner, B.J.; Hopkins, P.N.; Hunt, S.C.; Holland, W.L.; Summers, S.A.; Playdon, M.C. Machine learning reveals serum sphingolipids as cholesterol-independent biomarkers of coronary artery disease. J. Clin. Investig. 2020, 130, 1363–1376. [Google Scholar] [CrossRef] [PubMed]
- Vidovic, M.; Lapp, H.S.; Weber, C.; Plitzko, L.; Seifert, M.; Steinacker, P.; Otto, M.; Hermann, A.; Günther, R. Comparative analysis of neurofilaments and biomarkers of muscular damage in amyotrophic lateral sclerosis. Brain Commun. 2024, 6, fcae288. [Google Scholar] [CrossRef]
- Tay, Y.T.; Chai, J.Y.; Jabin, K.B.S.; Ang, K. Staging model for amyotrophic lateral sclerosis in Singapore. Singap. Med. J. 2022, 63, 371–375. [Google Scholar] [CrossRef]
- Thakore, N.J.; Lapin, B.R.; Mitsumoto, H.; Pooled Resource Open-Access Als Clinical Trials, C. Early initiation of riluzole may improve absolute survival in amyotrophic lateral sclerosis. Muscle Nerve 2022, 66, 702–708. [Google Scholar] [CrossRef]
- Rosca, C.-M.; Ariciu, A.V. Unlocking Customer Sentiment Insights with Azure Sentiment Analysis: A Comprehensive Review and Analysis. Rom. J. Pet. Gas Technol. 2023, 4, 173–182. [Google Scholar] [CrossRef]
- Salvi, M.; Molinari, F.; Ciccarelli, M.; Testi, R.; Taraglio, S.; Imperiale, D. Quantitative analysis of prion disease using an AI-powered digital pathology framework. Sci. Rep. 2023, 13, 17759. [Google Scholar] [CrossRef]
- Bizzi, A.; Pascuzzo, R.; Blevins, J.; Grisoli, M.; Lodi, R.; Moscatelli, M.E.M.; Castelli, G.; Cohen, M.L.; Schonberger, L.B.; Foutz, A.; et al. Evaluation of a New Criterion for Detecting Prion Disease With Diffusion Magnetic Resonance Imaging. JAMA Neurol. 2020, 77, 1141. [Google Scholar] [CrossRef]
- Bradford, B.M.; McGuire, L.I.; Hume, D.A.; Pridans, C.; Mabbott, N.A. Microglia deficiency accelerates prion disease but does not enhance prion accumulation in the brain. Glia 2022, 70, 2169–2187. [Google Scholar] [CrossRef]
- Katzeff, J.S.; Bright, F.; Phan, K.; Kril, J.J.; Ittner, L.M.; Kassiou, M.; Hodges, J.R.; Piguet, O.; Kiernan, M.C.; Halliday, G.M.; et al. Biomarker discovery and development for frontotemporal dementia and amyotrophic lateral sclerosis. Brain 2022, 145, 1598–1609. [Google Scholar] [CrossRef]
- Medina-Rioja, R.; Gonzalez-Calderon, G.; Masellis, M. Frontotemporal dementia. Can. Med. Assoc. J. 2023, 195, E1660. [Google Scholar] [CrossRef] [PubMed]
- Van Engelen, M.-P.E.; Heijst, H.; Willemse, E.A.J.; Oudega, M.L.; Vermunt, L.; Scheltens, P.; Vijverberg, E.G.B.; Pijnenburg, Y.A.L.; Teunissen, C.E. Urine as matrix for analysis of neurofilament light chain is not suitable to distinguish frontotemporal dementia from psychiatric diseases. Brain Commun. 2023, 5, fcad120. [Google Scholar] [CrossRef] [PubMed]
- Battineni, G.; Chintalapudi, N.; Hossain, M.A.; Losco, G.; Ruocco, C.; Sagaro, G.G.; Traini, E.; Nittari, G.; Amenta, F. Artificial Intelligence Models in the Diagnosis of Adult-Onset Dementia Disorders: A Review. Bioengineering 2022, 9, 370. [Google Scholar] [CrossRef] [PubMed]
- Mohammed, B.A.; Senan, E.M.; Rassem, T.H.; Makbol, N.M.; Alanazi, A.A.; Al-Mekhlafi, Z.G.; Almurayziq, T.S.; Ghaleb, F.A. Multi-Method Analysis of Medical Records and MRI Images for Early Diagnosis of Dementia and Alzheimer’s Disease Based on Deep Learning and Hybrid Methods. Electronics 2021, 10, 2860. [Google Scholar] [CrossRef]
- Garcia-Gutierrez, F.; Delgado-Alvarez, A.; Delgado-Alonso, C.; Díaz-Álvarez, J.; Pytel, V.; Valles-Salgado, M.; Gil, M.J.; Hernández-Lorenzo, L.; Matías-Guiu, J.; Ayala, J.L.; et al. Diagnosis of Alzheimer’s disease and behavioural variant frontotemporal dementia with machine learning-aided neuropsychological assessment using feature engineering and genetic algorithms. Int. J. Geriatr. Psychiatry 2022, 37, 1–13. [Google Scholar] [CrossRef]
- Rosca, C.-M. Convergence Catalysts: Exploring the Fusion of Embedded Systems, IoT, and Artificial Intelligence. In Engineering Applications of AI and Swarm Intelligence; Yang, X.-S., Ed.; Springer Nature: Singapore, 2025; pp. 69–87. [Google Scholar] [CrossRef]
- Das, S.; Panigrahi, P.; Chakrabarti, S. Corpus Callosum Atrophy in Detection of Mild and Moderate Alzheimer’s Disease Using Brain Magnetic Resonance Image Processing and Machine Learning Techniques. J. Alzheimer’s Dis. Rep. 2021, 5, 771–788. [Google Scholar] [CrossRef]
- Zadgaonkar, A.; Keskar, R.; Kakde, O. Towards a Machine Learning Model for Detection of Dementia Using Lifestyle Parameters. Appl. Sci. 2023, 13, 10630. [Google Scholar] [CrossRef]
- Miltiadous, A.; Tzimourta, K.D.; Afrantou, T.; Ioannidis, P.; Grigoriadis, N.; Tsalikakis, D.G.; Angelidis, P.; Tsipouras, M.G.; Glavas, E.; Giannakeas, N.; et al. A Dataset of Scalp EEG Recordings of Alzheimer’s Disease, Frontotemporal Dementia and Healthy Subjects from Routine EEG. Data 2023, 8, 95. [Google Scholar] [CrossRef]
- Lau, A.; Beheshti, I.; Modirrousta, M.; Kolesar, T.A.; Goertzen, A.L.; Ko, J.H. Alzheimer’s Disease-Related Metabolic Pattern in Diverse Forms of Neurodegenerative Diseases. Diagnostics 2021, 11, 2023. [Google Scholar] [CrossRef]
- Storelli, L.; Azzimonti, M.; Gueye, M.; Vizzino, C.; Preziosa, P.; Tedeschi, G.; De Stefano, N.; Pantano, P.; Filippi, M.; Rocca, M.A. A Deep Learning Approach to Predicting Disease Progression in Multiple Sclerosis Using Magnetic Resonance Imaging. Investig. Radiol. 2022, 57, 423–432. [Google Scholar] [CrossRef]
- Arrambide, G.; Comabella, M.; Tur, C. Big data and artificial intelligence applied to blood and CSF fluid biomarkers in multiple sclerosis. Front. Immunol. 2024, 15, 1459502. [Google Scholar] [CrossRef] [PubMed]
- Aslam, N.; Khan, I.U.; Bashamakh, A.; Alghool, F.A.; Aboulnour, M.; Alsuwayan, N.M.; Alturaif, R.A.K.; Brahimi, S.; Aljameel, S.S.; Al Ghamdi, K. Multiple Sclerosis Diagnosis Using Machine Learning and Deep Learning: Challenges and Opportunities. Sensors 2022, 22, 7856. [Google Scholar] [CrossRef] [PubMed]
- Martynova, E.; Goyal, M.; Johri, S.; Kumar, V.; Khaibullin, T.; Rizvanov, A.A.; Verma, S.; Khaiboullina, S.F.; Baranwal, M. Serum and Cerebrospinal Fluid Cytokine Biomarkers for Diagnosis of Multiple Sclerosis. Mediat. Inflamm. 2020, 2020, 2727042. [Google Scholar] [CrossRef]
- Saba, T.; Mujahid, M.; Rehman, A.; Alamri, F.S.; Ayesha, N. Enhancing trustworthiness and reliability: Advance explainable artificial intelligence framework for real world Sclerosis detection. Phys. Scr. 2024, 99, 105017. [Google Scholar] [CrossRef]
- Hagiwara, A.; Otsuka, Y.; Andica, C.; Kato, S.; Yokoyama, K.; Hori, M.; Fujita, S.; Kamagata, K.; Hattori, N.; Aoki, S. Differentiation between multiple sclerosis and neuromyelitis optica spectrum disorders by multiparametric quantitative MRI using convolutional neural network. J. Clin. Neurosci. 2021, 87, 55–58. [Google Scholar] [CrossRef]
- Sun, X.; Ren, X.; Zhang, J.; Nie, Y.; Hu, S.; Yang, X.; Jiang, S. Discovering miRNAs Associated With Multiple Sclerosis Based on Network Representation Learning and Deep Learning Methods. Front. Genet. 2022, 13, 899340. [Google Scholar] [CrossRef]
- Rosca, C.-M. New Algorithm to Prevent Online Test Fraud Based on Cognitive Services and Input Devices Events. In Proceedings of the Third Emerging Trends and Technologies on Intelligent Systems—ETTIS 2023. Lecture Notes in Networks and Systems, Noida, India, 23–24 February 2023; Noor, A., Saroha, K., Pricop, E., Sen, A., Trivedi, G., Eds.; Springer Nature: Singapore, 2023; Volume 730, pp. 207–219. [Google Scholar] [CrossRef]
- Wang, W.; Lee, J.; Harrou, F.; Sun, Y. Early Detection of Parkinson’s Disease Using Deep Learning and Machine Learning. IEEE Access 2020, 8, 147635–147646. [Google Scholar] [CrossRef]
- Makarious, M.B.; Leonard, H.L.; Vitale, D.; Iwaki, H.; Sargent, L.; Dadu, A.; Violich, I.; Hutchins, E.; Saffo, D.; Bandres-Ciga, S.; et al. Multi-modality machine learning predicting Parkinson’s disease. NPJ Park. Dis. 2022, 8, 35. [Google Scholar] [CrossRef]
- Gong, Z.; Lei, L. Spinocerebellar ataxia type 11 (SCA11): An update. Eur. J. Neurosci. 2023, 58, 2623–2640. [Google Scholar] [CrossRef]
- Shivakoti, M.; Medaramatla, S.C.; Godavarthi, D.; Shivakoti, N. Prognoza: Parkinson’s Disease Prediction Using Classification Algorithms. EAI Endorsed Trans. Pervasive Health Technol. 2023, 9, 1–8. [Google Scholar] [CrossRef]
- Banou, E.; Vrahatis, A.G.; Krokidis, M.G.; Vlamos, P. Machine Learning Analysis of Genomic Factors Influencing Hyperbaric Oxygen Therapy in Parkinson’s Disease. BioMedInformatics 2024, 4, 127–138. [Google Scholar] [CrossRef]
- Giannakopoulou, K.-M.; Roussaki, I.; Demestichas, K. Internet of Things Technologies and Machine Learning Methods for Parkinson’s Disease Diagnosis, Monitoring and Management: A Systematic Review. Sensors 2022, 22, 1799. [Google Scholar] [CrossRef] [PubMed]
- Tran, C.; Shen, K.; Liu, K.; Ashok, A.; Ramirez-Zamora, A.; Chen, J.; Li, Y.; Fang, R. Deep learning predicts prevalent and incident Parkinson’s disease from UK Biobank fundus imaging. Sci. Rep. 2024, 14, 3637. [Google Scholar] [CrossRef] [PubMed]
- Gelvez-Almeida, E.; Váasquez-Coronel, A.; Guatelli, R.; Aubin, V.; Mora, M. Classification of Parkinson’s disease patients based on spectrogram using local binary pattern descriptors. J. Phys. Conf. Ser. 2022, 2153, 012014. [Google Scholar] [CrossRef]
- Vyas, T.; Yadav, R.; Solanki, C.; Darji, R.; Desai, S.; Tanwar, S. Deep learning-based scheme to diagnose Parkinson’s disease. Expert Syst. 2022, 39, e12739. [Google Scholar] [CrossRef]
- Wu, P.; Zhao, Y.; Wu, J.; Brendel, M.; Lu, J.; Ge, J.; Bernhardt, A.; Li, L.; Alberts, I.; Katzdobler, S.; et al. Differential diagnosis of parkinsonism based on deep metabolic imaging indices. J. Nucl. Med. 2022, 63, 1741–1747. [Google Scholar] [CrossRef]
- Zhao, Y.; Wu, P.; Wu, J.; Brendel, M.; Lu, J.; Ge, J.; Tang, C.; Hong, J.; Xu, Q.; Liu, F.; et al. Decoding the dopamine transporter imaging for the differential diagnosis of parkinsonism using deep learning. Eur. J. Nucl. Med. Mol. Imaging 2022, 49, 2798–2811. [Google Scholar] [CrossRef]
- Gao, Y.; Hou, L.; Gao, Y.; An, M.; Xiao, W. A boosting-based prediction model for disease progression. J. Comput. Electron. Inf. Manag. 2024, 12, 15–19. [Google Scholar] [CrossRef]
- Ahn, S.; Shin, J.; Song, S.J.; Yoon, W.T.; Sagong, M.; Jeong, A.; Kim, J.H.; Yu, H.G. Neurologic Dysfunction Assessment in Parkinson Disease Based on Fundus Photographs Using Deep Learning. JAMA Ophthalmol. 2023, 141, 234. [Google Scholar] [CrossRef]
- Rosca, C.-M.; Popescu, M.; Patrascioiu, C.; Stancu, A. Comparative Analysis of pH Level Between Pasteurized and UTH Milk Using Dedicated Developed Application. Rev. Chim. 2019, 70, 3917–3920. [Google Scholar] [CrossRef]
- Nath, S.; Caron, N.S.; May, L.; Gluscencova, O.B.; Kolesar, J.; Brady, L.; Kaufman, B.A.; Boulianne, G.L.; Rodriguez, A.R.; Tarnopolsky, M.A.; et al. Functional characterization of variants of unknown significance in a spinocerebellar ataxia patient using an unsupervised machine learning pipeline. Hum. Genome Var. 2022, 9, 10. [Google Scholar] [CrossRef] [PubMed]
- Rossi, F.; Ma, J.; Tsakadze, N.; Benes-Lima, L.; Gonzalez, J.A.; Hoffmann, M. Genetic rhabdomyolysis within the spectrum of the Spinocerebellar Ataxia type 2 responsive to pregabalin. Cerebellum Ataxias 2021, 8, 10. [Google Scholar] [CrossRef] [PubMed]
- Sanchez-Flores, M.; Corral-Juan, M.; Gasch-Navalón, E.; Cirillo, D.; Sanchez, I.; Matilla-Dueñas, A. Novel genotype–phenotype correlations, differential cerebellar allele-specific methylation, and a common origin of the (ATTTC)n insertion in spinocerebellar ataxia type 37. Hum. Genet. 2024, 143, 211–232. [Google Scholar] [CrossRef] [PubMed]
- Ru, D.; Li, J.; Xie, O.; Peng, L.; Jiang, H.; Qiu, R. Explainable artificial intelligence based on feature optimization for age at onset prediction of spinocerebellar ataxia type 3. Front. Neuroinform. 2022, 16, 978630. [Google Scholar] [CrossRef]
- Ngo, T.; Nguyen, D.C.; Pathirana, P.N.; Corben, L.A.; Delatycki, M.B.; Horne, M.; Szmulewicz, D.J.; Roberts, M. Federated Deep Learning for the Diagnosis of Cerebellar Ataxia: Privacy Preservation and Auto-Crafted Feature Extractor. IEEE Trans. Neural Syst. Rehabil. Eng. 2022, 30, 803–811. [Google Scholar] [CrossRef]
- Bilek, F.; Balgetir, F.; Demir, C.F.; Alkan, G.; Arslan-Tuncer, S. Quantitative Assessment of Ataxia in Multiple Sclerosis Patients using Spatiotemporal Parameters: A Relief-Based Machine Learning Analysis. Phys. Med. Rehabil. Kurortmed. 2021, 31, 367–376. [Google Scholar] [CrossRef]
- Ganesh, S.; Chithambaram, T.; Krishnan, N.R.; Vincent, D.R.; Kaliappan, J.; Srinivasan, K. Exploring Huntington’s Disease Diagnosis via Artificial Intelligence Models: A Comprehensive Review. Diagnostics 2023, 13, 3592. [Google Scholar] [CrossRef]
- Joseph, A.; Chandra, J. Machine Learning Approaches for Efficient Analysis of Neuroimaging Techniques. In Proceedings of the 4th ETLTC International Conference on ICT Integration in Technical Education, Aizuwakamatsu, Japan, 25–28 January 2022; p. 03027. [Google Scholar] [CrossRef]
- Riad, R.; Lunven, M.; Titeux, H.; Cao, X.-N.; Hamet Bagnou, J.; Lemoine, L.; Montillot, J.; Sliwinski, A.; Youssov, K.; Cleret De Langavant, L.; et al. Predicting clinical scores in Huntington’s disease: A lightweight speech test. J. Neurol. 2022, 269, 5008–5021. [Google Scholar] [CrossRef]
- Cheng, J.; Liu, H.-P.; Lin, W.-Y.; Tsai, F.-J. Identification of contributing genes of Huntington’s disease by machine learning. BMC Med. Genom. 2020, 13, 176. [Google Scholar] [CrossRef]
- Rosca, C.-M.; Rădulescu, G.; Stancu, A. Artificial Intelligence of Things Infrastructure for Quality Control in Cast Manufacturing Environments Shedding Light on Industry Changes. Appl. Sci. 2025, 15, 2068. [Google Scholar] [CrossRef]
- Rosca, C.-M.; Stancu, A.; Popescu, M. The Impact of Cloud Versus Local Infrastructure on Automatic IoT-Driven Hydroponic Systems. Appl. Sci. 2025, 15, 4016. [Google Scholar] [CrossRef]
- Horigome, T.; Hino, K.; Toyoshiba, H.; Shindo, N.; Funaki, K.; Eguchi, Y.; Kitazawa, M.; Fujita, T.; Mimura, M.; Kishimoto, T. Identifying neurocognitive disorder using vector representation of free conversation. Sci. Rep. 2022, 12, 12461. [Google Scholar] [CrossRef] [PubMed]
- Xu, Q.; Zou, K.; Deng, Z.A.; Zhou, J.; Dang, X.; Zhu, S.; Liu, L.; Fang, C. A Study of Dementia Prediction Models Based on Machine Learning with Survey Data of Community-Dwelling Elderly People in China. J. Alzheimer’s Dis. 2022, 89, 669–679. [Google Scholar] [CrossRef]
- Shehzad, A.; Rockwood, K.; Stanley, J.; Dunn, T.; Howlett, S.E. Use of Patient-Reported Symptoms from an Online Symptom Tracking Tool for Dementia Severity Staging: Development and Validation of a Machine Learning Approach. J. Med. Internet Res. 2020, 22, e20840. [Google Scholar] [CrossRef]
- You, J.; Zhang, Y.-R.; Wang, H.-F.; Yang, M.; Feng, J.-F.; Yu, J.-T.; Cheng, W. Development of a novel dementia risk prediction model in the general population: A large, longitudinal, population-based machine-learning study. eClinicalMedicine 2022, 53, 101665. [Google Scholar] [CrossRef]
- Twait, E.L.; Andaur Navarro, C.L.; Gudnason, V.; Hu, Y.-H.; Launer, L.J.; Geerlings, M.I. Dementia prediction in the general population using clinically accessible variables: A proof-of-concept study using machine learning. The AGES-Reykjavik study. BMC Med. Inform. Decis. Mak. 2023, 23, 168. [Google Scholar] [CrossRef]
- Rennie, A.; Ekman, U.; Shams, S.; Rydén, L.; Samuelsson, J.; Zettergren, A.; Kern, S.; Oppedal, K.; Blanc, F.; Hort, J.; et al. Cerebrovascular and Alzheimer’s disease biomarkers in dementia with Lewy bodies and other dementias. Brain Commun. 2024, 6, fcae290. [Google Scholar] [CrossRef]
- Hijazi, Z.; Yassi, N.; O’Brien, J.T.; Watson, R. The influence of cerebrovascular disease in dementia with Lewy bodies and Parkinson’s disease dementia. Eur. J. Neurol. 2022, 29, 1254–1265. [Google Scholar] [CrossRef]
- Bit, S.; Dey, P.; Maji, A.; Khan, T.K. MRI-based mild cognitive impairment and Alzheimer’s disease classification using an algorithm of combination of variational autoencoder and other machine learning classifiers. J. Alzheimer’s Dis. Rep. 2024, 8, 1434–1452. [Google Scholar] [CrossRef]
- Sarma, M.; Chatterjee, S. Machine Learning-Based Alzheimer’s Disease Stage Diagnosis Utilizing Blood Gene Expression and Clinical Data: A Comparative Investigation. Diagnostics 2025, 15, 211. [Google Scholar] [CrossRef]
- Abbas, Q.; Hussain, A.; Baig, A.R. CAD-ALZ: A Blockwise Fine-Tuning Strategy on Convolutional Model and Random Forest Classifier for Recognition of Multistage Alzheimer’s Disease. Diagnostics 2023, 13, 167. [Google Scholar] [CrossRef] [PubMed]
- Wang, X.; Zhou, Q.; Li, H.; Chen, M. Enhancing Feature Selection for Imbalanced Alzheimer’s Disease Brain MRI Images by Random Forest. Appl. Sci. 2023, 13, 7253. [Google Scholar] [CrossRef]
- Safi, K.; Aly, W.H.F.; Alakkoumi, M.; Kanj, H.; Ghedira, M.; Hutin, E. EMD-Based Method for Supervised Classification of Parkinson’s Disease Patients Using Balance Control Data. Bioengineering 2022, 9, 283. [Google Scholar] [CrossRef]
- Gupta, C.; Chandrashekar, P.; Jin, T.; He, C.; Khullar, S.; Chang, Q.; Wang, D. Bringing machine learning to research on intellectual and developmental disabilities: Taking inspiration from neurological diseases. J. Neurodev. Disord. 2022, 14, 28. [Google Scholar] [CrossRef] [PubMed]
- Song, C.; Jiang, Z.-Q.; Liu, D.; Wu, L.-L. Application and research progress of machine learning in the diagnosis and treatment of neurodevelopmental disorders in children. Front. Psychiatry 2022, 13, 960672. [Google Scholar] [CrossRef]
- Mohammadi-Ghazi, R.; Nguyen, H.; Mishra, R.K.; Enriquez, A.; Najafi, B.; Stephen, C.D.; Gupta, A.S.; Schmahmann, J.D.; Vaziri, A. Objective Assessment of Upper-Extremity Motor Functions in Spinocerebellar Ataxia Using Wearable Sensors. Sensors 2022, 22, 7993. [Google Scholar] [CrossRef]
- Yang, J.H.; Park, J.H.; Jang, S.-H.; Cho, J. Novel Method of Classification in Knee Osteoarthritis: Machine Learning Application Versus Logistic Regression Model. Ann. Rehabil. Med. 2020, 44, 415–427. [Google Scholar] [CrossRef]
- Ceyhan, B.; Bek, S.; Onal-Suzek, T. Machine Learning-Based Prediction Models for Cognitive Decline Progression: A Comparative Study in Multilingual Settings Using Speech Analysis. J. Aging Res. Amp; Lifestyle 2024, 13, 43–50. [Google Scholar] [CrossRef]
- Ma, Y.; Bland, J.K.S.; Fujinami, T. Classification of Alzheimer’s Disease and Frontotemporal Dementia Using Electroencephalography to Quantify Communication between Electrode Pairs. Diagnostics 2024, 14, 2189. [Google Scholar] [CrossRef]
- Sharma, V.; Midhunchakkaravarthy, D. Local post-hoc interpretable machine learning model for prediction of dementia in young adults. Indones. J. Electr. Eng. Comput. Sci. 2023, 32, 1569. [Google Scholar] [CrossRef]
- De La Fuente Garcia, S.; Ritchie, C.W.; Luz, S. Artificial Intelligence, Speech, and Language Processing Approaches to Monitoring Alzheimer’s Disease: A Systematic Review. J. Alzheimer’s Dis. 2020, 78, 1547–1574. [Google Scholar] [CrossRef] [PubMed]
- Gunata, M.; Arslan, A.K.; Çolak, C.; Parlakpinar, H. Estimation of Risk Factors Related to Heart Diseases with Multilayer Perceptron Model. Med. Rec. 2022, 4, 171–178. [Google Scholar] [CrossRef]
- Erdaş, Ç.B.; Sümer, E. CNN-Based Neurodegenerative Disease Classification Using QR-Represented Gait Data. Brain Behav. 2024, 14, e70100. [Google Scholar] [CrossRef] [PubMed]
- Chandler, J.; Georgieva, M.; Desai, U.; Kirson, N.; Lane, H.; Cheung, H.C.; Westermeyer, B.; Biglan, K. Disease Progression and Longitudinal Clinical Outcomes of Lewy Body Dementia in the NACC Database. Neurol. Ther. 2023, 12, 177–195. [Google Scholar] [CrossRef]
- Saini, D.; Mukherjee, A.; Roy, A.; Biswas, A. A Comparative Study of the Behavioral Profile of the Behavioral Variant of Frontotemporal Dementia and Parkinson’s Disease Dementia. Dement. Geriatr. Cogn. Disord. Extra 2020, 10, 182–194. [Google Scholar] [CrossRef]
- Thanoun, M.Y.; Yaseen, M.T.; Aleesa, A.M. Development of Intelligent Parkinson Disease Detection System Based on Machine Learning Techniques Using Speech Signal. Int. J. Adv. Sci. Eng. Inf. Technol. 2021, 11, 388–392. [Google Scholar] [CrossRef]
- Ullah, M.A.; Afrin, S.H.; Nazib, K.M.; Roy, R.; Ali, L.E. Unravelling Parkinson’s Disease Prediction: An Evaluation of Feature Selection Techniques with a Focus on PCA and KNN Performance. Rev. Comput. Eng. Stud. 2023, 10, 20–27. [Google Scholar] [CrossRef]
- Merkin, A.; Krishnamurthi, R.; Medvedev, O.N. Machine learning, artificial intelligence and the prediction of dementia. Curr. Opin. Psychiatry 2022, 35, 123–129. [Google Scholar] [CrossRef]
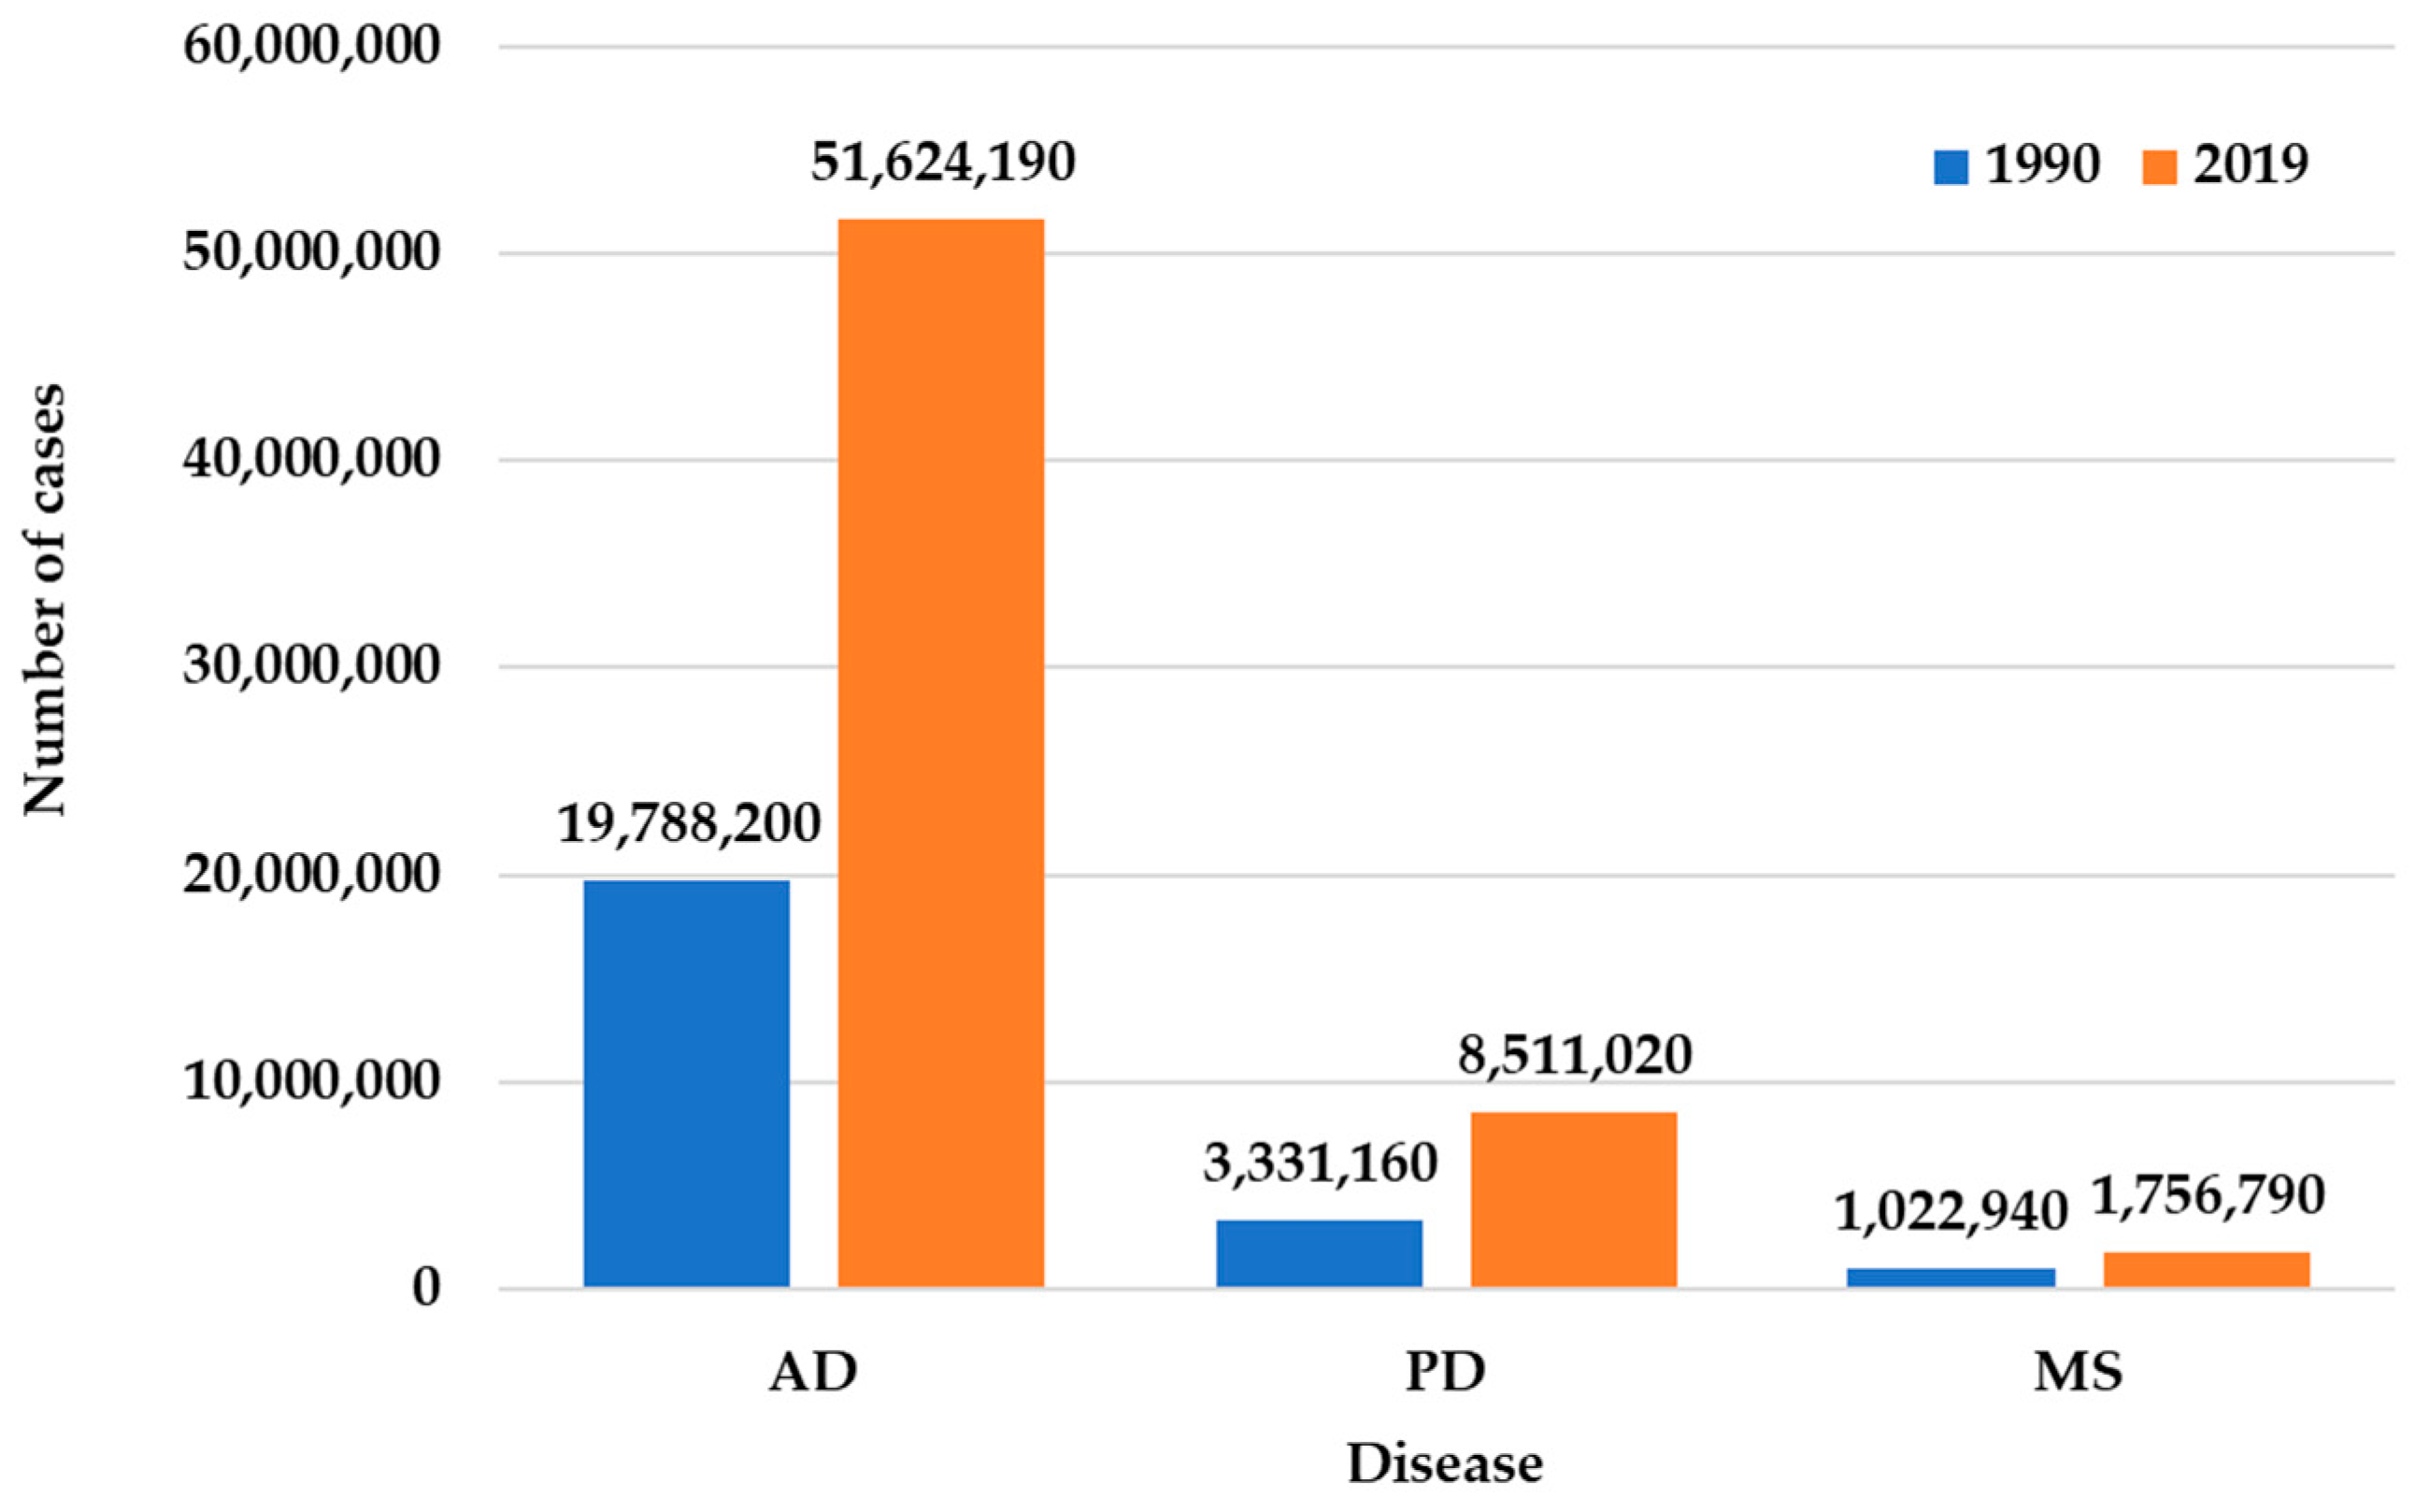
- Ding, C.; Wu, Y.; Chen, X.; Chen, Y.; Wu, Z.; Lin, Z.; Kang, D.; Fang, W.; Chen, F. Global, regional, and national burden and attributable risk factors of neurological disorders: The Global Burden of Disease study 1990–2019. Front. Public Health 2022, 10, 952161. [Google Scholar] [CrossRef]
- Zhou, J.; Li, C.; Kim, Y.K.; Park, S. Bioinformatics and Deep Learning Approach to Discover Food-Derived Active Ingredients for Alzheimer’s Disease Therapy. Foods 2025, 14, 127. [Google Scholar] [CrossRef]
- Woods, C.; Xing, X.; Khanal, S.; Lin, A.-L. Machine Learning-Driven Prediction of Brain Age for Alzheimer’s Risk: APOE4 Genotype and Gender Effects. Bioengineering 2024, 11, 943. [Google Scholar] [CrossRef] [PubMed]
- Sarica, A.; Pelagi, A.; Aracri, F.; Arcuri, F.; Quattrone, A.; Quattrone, A. Sex Differences in Conversion Risk from Mild Cognitive Impairment to Alzheimer’s Disease: An Explainable Machine Learning Study with Random Survival Forests and SHAP. Brain Sci. 2024, 14, 201. [Google Scholar] [CrossRef] [PubMed]
- Alqahtani, N.; Alam, S.; Aqeel, I.; Shuaib, M.; Mohsen Khormi, I.; Khan, S.B.; Malibari, A.A. Deep Belief Networks (DBN) with IoT-Based Alzheimer’s Disease Detection and Classification. Appl. Sci. 2023, 13, 7833. [Google Scholar] [CrossRef]
- Shukla, A.; Tiwari, R.; Tiwari, S. Alzheimer’s Disease Detection from Fused PET and MRI Modalities Using an Ensemble Classifier. Mach. Learn. Knowl. Extr. 2023, 5, 512–538. [Google Scholar] [CrossRef]
- Shin, H.-J.; Yoon, H.; Kim, S.; Kang, D.-Y. Classification of Alzheimer’s Disease Using Dual-Phase 18F-Florbetaben Image with Rank-Based Feature Selection and Machine Learning. Appl. Sci. 2022, 12, 7355. [Google Scholar] [CrossRef]
- Bangyal, W.H.; Rehman, N.U.; Nawaz, A.; Nisar, K.; Ibrahim, A.A.A.; Shakir, R.; Rawat, D.B. Constructing Domain Ontology for Alzheimer Disease Using Deep Learning Based Approach. Electronics 2022, 11, 1890. [Google Scholar] [CrossRef]
- Hooshmand, K.; Halliday, G.M.; Pineda, S.S.; Sutherland, G.T.; Guennewig, B. Overlap between Central and Peripheral Transcriptomes in Parkinson’s Disease but Not Alzheimer’s Disease. Int. J. Mol. Sci. 2022, 23, 5200. [Google Scholar] [CrossRef]
- Huang, Y.-L.; Lin, C.-H.; Tsai, T.-H.; Huang, C.-H.; Li, J.-L.; Chen, L.-K.; Li, C.-H.; Tsai, T.-F.; Wang, P.-N. Discovery of a Metabolic Signature Predisposing High Risk Patients with Mild Cognitive Impairment to Converting to Alzheimer’s Disease. Int. J. Mol. Sci. 2021, 22, 10903. [Google Scholar] [CrossRef]
- Song, M.; Jung, H.; Lee, S.; Kim, D.; Ahn, M. Diagnostic Classification and Biomarker Identification of Alzheimer’s Disease with Random Forest Algorithm. Brain Sci. 2021, 11, 453. [Google Scholar] [CrossRef]
- Nguyen, M.T.P.; Tran, M.K.P.; Nakano, T.; Tran, T.H.; Nguyen, Q.D.N. An Approach for Detecting Parkinson’s Disease by Integrating Optimal Feature Selection Strategies with Dense Multiscale Sample Entropy. Information 2024, 16, 1. [Google Scholar] [CrossRef]
- Khedimi, M.; Zhang, T.; Merzougui, H.; Zhao, X.; Geng, Y.; Djaroudib, K.; Lorenz, P. Architecture-Aware Augmentation: A Hybrid Deep Learning and Machine Learning Approach for Enhanced Parkinson’s Disease Detection. Bioengineering 2024, 11, 1218. [Google Scholar] [CrossRef] [PubMed]
- Majda-Zdancewicz, E.; Potulska-Chromik, A.; Nojszewska, M.; Kostera-Pruszczyk, A. Speech Signal Analysis in Patients with Parkinson’s Disease, Taking into Account Phonation, Articulation, and Prosody of Speech. Appl. Sci. 2024, 14, 11085. [Google Scholar] [CrossRef]
- Hussain, S.S.; Degang, X.; Shah, P.M.; Islam, S.U.; Alam, M.; Khan, I.A.; Awwad, F.A.; Ismail, E.A.A. Classification of Parkinson’s Disease in Patch-Based MRI of Substantia Nigra. Diagnostics 2023, 13, 2827. [Google Scholar] [CrossRef] [PubMed]
- Nijhawan, R.; Kumar, M.; Arya, S.; Mendirtta, N.; Kumar, S.; Towfek, S.K.; Khafaga, D.S.; Alkahtani, H.K.; Abdelhamid, A.A. A Novel Artificial-Intelligence-Based Approach for Classification of Parkinson’s Disease Using Complex and Large Vocal Features. Biomimetics 2023, 8, 351. [Google Scholar] [CrossRef]
- Li, K.; Tian, Y.; Chen, H.; Ma, X.; Li, S.; Li, C.; Wu, S.; Liu, F.; Du, Y.; Su, W. Temporal Dynamic Alterations of Regional Homogeneity in Parkinson’s Disease: A Resting-State fMRI Study. Biomolecules 2023, 13, 888. [Google Scholar] [CrossRef]
- Kim, J.; Park, H.-J.; Yoon, Y. RNA Sequences-Based Diagnosis of Parkinson’s Disease Using Various Feature Selection Methods and Machine Learning. Appl. Sci. 2023, 13, 2698. [Google Scholar] [CrossRef]
- Elshewey, A.M.; Shams, M.Y.; El-Rashidy, N.; Elhady, A.M.; Shohieb, S.M.; Tarek, Z. Bayesian Optimization with Support Vector Machine Model for Parkinson Disease Classification. Sensors 2023, 23, 2085. [Google Scholar] [CrossRef]
- Castelli Gattinara Di Zubiena, F.; Menna, G.; Mileti, I.; Zampogna, A.; Asci, F.; Paoloni, M.; Suppa, A.; Del Prete, Z.; Palermo, E. Machine Learning and Wearable Sensors for the Early Detection of Balance Disorders in Parkinson’s Disease. Sensors 2022, 22, 9903. [Google Scholar] [CrossRef]
- Li, A.; Li, C. Detecting Parkinson’s Disease through Gait Measures Using Machine Learning. Diagnostics 2022, 12, 2404. [Google Scholar] [CrossRef]
- Chen, P.-H.; Hou, T.-Y.; Cheng, F.-Y.; Shaw, J.-S. Prediction of Cognitive Degeneration in Parkinson’s Disease Patients Using a Machine Learning Method. Brain Sci. 2022, 12, 1048. [Google Scholar] [CrossRef]
- Mian, T.S. An Unsupervised Neural Network Feature Selection and 1D Convolution Neural Network Classification for Screening of Parkinsonism. Diagnostics 2022, 12, 1796. [Google Scholar] [CrossRef] [PubMed]
- Rosca, C.-M.; Stancu, A.; Iovanovici, E.M. The New Paradigm of Deepfake Detection at the Text Level. Appl. Sci. 2025, 15, 2560. [Google Scholar] [CrossRef]
- Demir, F.; Siddique, K.; Alswaitti, M.; Demir, K.; Sengur, A. A Simple and Effective Approach Based on a Multi-Level Feature Selection for Automated Parkinson’s Disease Detection. J. Pers. Med. 2022, 12, 55. [Google Scholar] [CrossRef]
- Qasim, H.M.; Ata, O.; Ansari, M.A.; Alomary, M.N.; Alghamdi, S.; Almehmadi, M. Hybrid Feature Selection Framework for the Parkinson Imbalanced Dataset Prediction Problem. Medicina 2021, 57, 1217. [Google Scholar] [CrossRef]
- Arora, S.; Tsanas, A. Assessing Parkinson’s Disease at Scale Using Telephone-Recorded Speech: Insights from the Parkinson’s Voice Initiative. Diagnostics 2021, 11, 1892. [Google Scholar] [CrossRef]
- Skaramagkas, V.; Andrikopoulos, G.; Kefalopoulou, Z.; Polychronopoulos, P. A Study on the Essential and Parkinson’s Arm Tremor Classification. Signals 2021, 2, 201–224. [Google Scholar] [CrossRef]
- Chien, C.-Y.; Hsu, S.-W.; Lee, T.-L.; Sung, P.-S.; Lin, C.-C. Using Artificial Neural Network to Discriminate Parkinson’s Disease from Other Parkinsonisms by Focusing on Putamen of Dopamine Transporter SPECT Images. Biomedicines 2020, 9, 12. [Google Scholar] [CrossRef]
- Aich, S.; Youn, J.; Chakraborty, S.; Pradhan, P.M.; Park, J.-H.; Park, S.; Park, J. A Supervised Machine Learning Approach to Detect the On/Off State in Parkinson’s Disease Using Wearable Based Gait Signals. Diagnostics 2020, 10, 421. [Google Scholar] [CrossRef]
- Borzì, L.; Fornara, S.; Amato, F.; Olmo, G.; Artusi, C.A.; Lopiano, L. Smartphone-Based Evaluation of Postural Stability in Parkinson’s Disease Patients During Quiet Stance. Electronics 2020, 9, 919. [Google Scholar] [CrossRef]
- Blanck-Lubarsch, M.; Dirksen, D.; Feldmann, R.; Bormann, E.; Hohoff, A. Simplifying Diagnosis of Fetal Alcohol Syndrome Using Machine Learning Methods. Front. Pediatr. 2022, 9, 707566. [Google Scholar] [CrossRef]
- Tur, C. Machine and deep learning in MS research are just powerful statistics—Yes. Mult. Scler. J. 2021, 27, 661–662. [Google Scholar] [CrossRef] [PubMed]
- Munger, E.; Hickey, J.W.; Dey, A.K.; Jafri, M.S.; Kinser, J.M.; Mehta, N.N. Application of machine learning in understanding atherosclerosis: Emerging insights. APL Bioeng. 2021, 5, 011505. [Google Scholar] [CrossRef] [PubMed]
- Ekmekyapar, T.; Taşcı, B. Exemplar MobileNetV2-Based Artificial Intelligence for Robust and Accurate Diagnosis of Multiple Sclerosis. Diagnostics 2023, 13, 3030. [Google Scholar] [CrossRef] [PubMed]
- Norris, C. Annals of Biomedical Engineering 2022 Year in Review. Ann. Biomed. Eng. 2023, 51, 865–867. [Google Scholar] [CrossRef]
- Pontillo, G.; Penna, S.; Cocozza, S.; Quarantelli, M.; Gravina, M.; Lanzillo, R.; Marrone, S.; Costabile, T.; Inglese, M.; Morra, V.B.; et al. Stratification of multiple sclerosis patients using unsupervised machine learning: A single-visit MRI-driven approach. Eur. Radiol. 2022, 32, 5382–5391. [Google Scholar] [CrossRef]
- Karim, F.K.; Ghorashi, S.; Ishak, A.B.; Elhag, A.A.; Mohamed, N. Innovative Mathematical Modelling Approaches to Diagnose Chronic Neurological Disorders with Deep Learning. Therm. Sci. 2024, 28, 5217–5229. [Google Scholar] [CrossRef]
- Afifi, N.; Abdel-Hamid, A.T.; Abdullah, B.A. Detection of Multiple Sclerosis Using Convolutional Neural Networks: A Comparative Study. In Proceedings of the 10th International Conference on Soft Computing & Machine Intelligence, Mexico City, Mexico, 25–26 November 2023; pp. 77–80. [Google Scholar] [CrossRef]
- Omrani, M.; Chiarelli, R.R.; Acquaviva, M.; Bassani, C.; Dalla Costa, G.; Montini, F.; Preziosa, P.; Pagani, L.; Grassivaro, F.; Guerrieri, S.; et al. Machine learning-driven diagnosis of multiple sclerosis from whole blood transcriptomics. Brain Behav. Immun. 2024, 121, 269–277. [Google Scholar] [CrossRef]
- Ata, N.; Zahoor, I.; Hoda, N.; Adnan, S.M.; Vijayakumar, S.; Louis, F.; Poisson, L.; Rattan, R.; Kumar, N.; Cerghet, M.; et al. Artificial neural network-based prediction of multiple sclerosis using blood-based metabolomics data. Mult. Scler. Relat. Disord. 2024, 92, 105942. [Google Scholar] [CrossRef]
- Kaur, R.; Levy, J.; Motl, R.W.; Sowers, R.; Hernandez, M.E. Deep Learning for Multiple Sclerosis Differentiation Using Multi-Stride Dynamics in Gait. IEEE Trans. Biomed. Eng. 2023, 70, 2181–2192. [Google Scholar] [CrossRef]
- Banijamali, S.M.A.; Versek, C.; Babinski, K.; Kamarthi, S.; Green-Laroche, D.; Sridhar, S. Portable multi-focal visual evoked potential diagnostics for multiple sclerosis/optic neuritis patients. Doc. Ophthalmol. 2024, 149, 23–45. [Google Scholar] [CrossRef]
- Maggi, P.; Fartaria, M.J.; Jorge, J.; La Rosa, F.; Absinta, M.; Sati, P.; Meuli, R.; Du Pasquier, R.; Reich, D.S.; Cuadra, M.B.; et al. CVSnet: A machine learning approach for automated central vein sign assessment in multiple sclerosis. NMR Biomed. 2020, 33, e4283. [Google Scholar] [CrossRef] [PubMed]
- Spieker, E.L.; Dvorani, A.; Salchow-Hömmen, C.; Otto, C.; Ruprecht, K.; Wenger, N.; Schauer, T. Targeting Transcutaneous Spinal Cord Stimulation Using a Supervised Machine Learning Approach Based on Mechanomyography. Sensors 2024, 24, 634. [Google Scholar] [CrossRef] [PubMed]
- Gaetani, L.; Bellomo, G.; Di Sabatino, E.; Sperandei, S.; Mancini, A.; Blennow, K.; Zetterberg, H.; Parnetti, L.; Di Filippo, M. The Immune Signature of CSF in Multiple Sclerosis with and without Oligoclonal Bands: A Machine Learning Approach to Proximity Extension Assay Analysis. Int. J. Mol. Sci. 2023, 25, 139. [Google Scholar] [CrossRef] [PubMed]
- Gharaibeh, M.; Abedalaziz, W.; Alawad, N.A.; Gharaibeh, H.; Nasayreh, A.; El-Heis, M.; Altalhi, M.; Forestiero, A.; Abualigah, L. Optimal Integration of Machine Learning for Distinct Classification and Activity State Determination in Multiple Sclerosis and Neuromyelitis Optica. Technologies 2023, 11, 131. [Google Scholar] [CrossRef]
- Ponce De Leon-Sanchez, E.R.; Dominguez-Ramirez, O.A.; Herrera-Navarro, A.M.; Rodriguez-Resendiz, J.; Paredes-Orta, C.; Mendiola-Santibañez, J.D. A Deep Learning Approach for Predicting Multiple Sclerosis. Micromachines 2023, 14, 749. [Google Scholar] [CrossRef]


| Disease | Dataset | Objective |
|---|---|---|
| AD | MRI, PET, DTI, clinical and cognitive data | Diagnose AD, detect subtle brain structural changes, and classify neurodegeneration patterns. |
| ALS | Genetic, proteomic, clinical datasets, neurofilament levels, metabolic biomarkers | Identify ALS biomarkers, predict disease progression, stratify patient risk, and personalize treatments. |
| FTD | MRI datasets, EEG signals, cognitive evaluations | Differentiate FTD from other dementias, classify neurodegenerative profiles, and detect anomalies. |
| HD | MRI, genetic/molecular biomarkers, vocal markers | Identify imaging biomarkers, evaluate disease progression, analyze voice symptoms, and classify HD. |
| Prion Diseases | Histopathological images, diffusion MRI data | Classify prion diseases and analyze cellular interactions. |
| MS | MRI data, CSF, serum biomarkers, patient-reported symptoms | Classify MS severity, predict relapses, automate biomarker detection, and differentiate MS from other conditions. |
| PD | Vocal signals, body movement data, retinal imaging, fundus photographs, MRI | Predict PD onset, classify PD through dysphonic features, monitor disease progression, and differentiate Parkinsonian disorders. |
| SCA | Genomic data, repeat expansions, MRI images, gait parameters | Classify SCA variants, predict disease progression, differentiate SCA genotypes, and assess ataxia forms. |
| LBD | Conversational data, cognitive/demographic/imaging data, DementiaBank, UK Biobank | Diagnose LBD, differentiate LBD from Alzheimer’s, and predict dementia in diverse populations. |
| Methodology (ML Algorithm Used) | Strengths (1–5) | Weaknesses (1–5) | Reference |
|---|---|---|---|
| AD | |||
| RF, LR | 4 | 3 | [126] |
| RF | 3 | 4 | [127] |
| RF | 4 | 3 | [128] |
| PD | |||
| RF | 4 | 3 | [129] |
| KNN, SVM, RF | 4 | 3 | [17] |
| RF, LR | 4 | 3 | [93] |
| MS | |||
| DT, LR | 3 | 4 | [30] |
| RF, SVM | 4 | 3 | [86] |
| RF | 3 | 4 | [111] |
| Diseases | Accuracy | Reference |
|---|---|---|
| AD | 90% | [118] |
| AD | 94.71% | [134] |
| AD | >80% | [135] |
| FTD | ~79% | [136] |
| AD/FTD | >90% | [114,137] |
| ALS/SCA | AUC = 0.96 | [132] |
| ALS | 83.33% | [133] |
| HD | 84% | [138] |
| HD | 90.50% | [139] |
| LBD | 75–85% | [140] |
| PD | >80% | [141] |
| PD | 80% | [93] |
| PD | 46.56% | [142] |
| PD | AUC = 0.71 | [98] |
| PD | Up to 96% | [143] |
| PD | 80–85% | [144] |
| Subject | Metric | Value | Reference | ||
|---|---|---|---|---|---|
| Multi-stage diagnosis of AD | ROC AUC (Clinical) | 98.9% (CogN) | 92.7% (MCI) | 90.7% (Dementia) | [126] |
| ROC AUC (Genomic) | 76.3% (CogN) | 76.1% (MCI) | 70.6% (Dementia) | ||
| F1-Score (Clinical) | 97.1% (CogN) | 93.9% (MCI) | 88.6% (Dementia) | ||
| F1-Score (Genomic) | 71% (CogN) | 77% (MCI) | 53% (Dementia) | ||
| Differences in progression from MCI to Alzheimer’s | Harrell’s c-index | 0.87 (M-RSF) | 0.79 (F-RSF) | - | [148] |
| ML for AD diagnosis using MRI | Accuracy | 97.46% | - | - | [149] |
| F1-Score | 93.19% | - | - | ||
| Recall | 95.79% | - | - | ||
| Precision | 94.62% | - | - | ||
| Detecting AD using PET and MRI images | Accuracy (Binary) | 99% | - | - | [150] |
| Accuracy (AD vs. MCI) | 91% | - | - | ||
| Accuracy (Multi-class) | 96% | - | - | ||
| CAD for detecting AD stages | Accuracy | 99.21% | - | - | [127] |
| Sensitivity | 99.69% | - | - | ||
| F1-Score | 99.61% | - | - | ||
| Evaluating dual-phase FBB vs. delay-phase FBB | F1-Score (SUVR composite) | 78.06% (RF) | - | - | [151] |
| AUC (SUVR composite) | 0.8724 (RF) | - | - | ||
| F1-Score (SUVR regional) | 78.54% (RF) | - | - | ||
| AUC (SUVR regional) | 0.8456 (RF) | - | - | ||
| Ontology for AD diagnosis | Accuracy (MLP) | 92.12% | - | - | [152] |
| Accuracy (CNN) | 94.61% | - | - | ||
| Untargeted metabolomic profiling for MCI dementia conversion | Accuracy (3-class) | 73.50% | - | - | [154] |
| Accuracy (P-MCI vs. S-MCI) | 80.30% | - | - | ||
| Evaluating RF compared to other ML models | Accuracy (63 features) | 90.2% (RF) | 89.6% (MLP) | 90.5% (CNN) | [155] |
| Accuracy (22 features) | Smaller decrease (−3.8%) for RF vs. MLP (−6.8%) and CNN (−4.5%) | - | - | ||
| Approach | Strengths (1–5) | Weaknesses (1–5) | Reference |
|---|---|---|---|
| Multi-stage diagnosis of AD | 5 | 2 | [126] |
| Differences in progression from MCI to Alzheimer’s | 5 | 3 | [148] |
| ML for AD diagnosis using MRI | 5 | 3 | [149] |
| Detecting AD using PET and MRI images | 5 | 3 | [150] |
| CAD for detecting AD stages | 5 | 3 | [127] |
| Evaluating dual-phase FBB vs. delay-phase FBB | 4 | 3 | [151] |
| Ontology for AD diagnosis | 4 | 3 | [152] |
| Untargeted metabolomic profiling for MCI dementia conversion | 4 | 3 | [154] |
| Evaluating RF compared to other ML models | 5 | 3 | [155] |
| Objective | Metrics/AI Model | Strengths (1–5) | Weaknesses (1–5) | Reference |
|---|---|---|---|---|
| PD diagnosis via DM-SamEn | Accuracy (95% CI: 97.82–98.5%) | 5 | 3 | [156] |
| Severity (95% CI: 96.3–97.3%) | ||||
| Early PD detection via spiral drawings | KNN: 96.77% (no augmentation) | 5 | 3 | [157] |
| ResNet-50 + LR: 93.55% (augmentation) | ||||
| PD detection via voice changes | KNN: 92.2% | 4 | 3 | [158] |
| Sensitivity: 91.1% | ||||
| Specificity: 93.3% | ||||
| PD diagnosis using CNN | Accuracy: 98.7%, | 5 | 2 | [159] |
| Sensitivity: 95.83% | ||||
| Specificity: 96.87% | ||||
| AUC: 94.5% | ||||
| Early PD detection via human voices | Improved AUC by ≥1% compared to state-of-the-art | 4 | 3 | [160] |
| Dynamic brain activity in PD | SVM: 98% correct identification (p < 0.001) | 5 | 3 | [161] |
| Feature selection for model improvement | XGBoost: +10% | 5 | 3 | [162] |
| DNN: +38.18% | ||||
| SVM: +0.91% | ||||
| DT: +7.27% | ||||
| PD classification using BO-SVM | SVM: 92.3% | 4 | 3 | [163] |
| Early Detection of Balance Disorders in PD | FKNN: Accuracy: 95.6% | 5 | 3 | [164] |
| FKNN: Recall: 99% | ||||
| FKNN: Precision: 95.2% | ||||
| Cognitive degeneration prediction | PCA-SVM: Accuracy: 92.3% | 5 | 3 | [166] |
| PCA-SVM: AUC: 0.929; | ||||
| With 13 features: Accuracy: 100% | ||||
| With 13 features: AUC: 1.0 | ||||
| PD identification via voice disorders | CNN-1D: F1-Score: 92.7% | 4 | 3 | [167] |
| LR: F1-Score: 92.2% | ||||
| Postural stability analysis in PD | SVM: 92% | 5 | 3 | [129] |
| Dempster-Shafer: 96.51% | ||||
| PD classification | Accuracy: 95.4%, | 5 | 3 | [169] |
| Sensitivity: 94.9% | ||||
| Specificity: 93% | ||||
| Precision: 95.2% | ||||
| F1-Score: 95.5% | ||||
| Early PD detection | SVM: Accuracy: 98.2% | 5 | 3 | [170] |
| KNN: Specificity: 99% | ||||
| PD screening via voice | Sensitivity: 67.43% | 3 | 4 | [171] |
| Specificity: 67.25% | ||||
| Tremor type discrimination | SVM: 100% (single measurement) | 5 | 3 | [172] |
| General: 82.62% | ||||
| PD vs. Parkinsonism differentiation | ANN: Accuracy: 86% | 4 | 3 | [173] |
| ANN: Sensitivity: 81.8% | ||||
| ANN: Specificity: 88.6% | ||||
| Medication state monitoring in PD | RF: Accuracy: 96.72% | 5 | 3 | [174] |
| RF: Recall: 97.35% | ||||
| RF: Precision: 96.92% |
| Objective | Metrics/AI Model | Strengths (1–5) | Weaknesses (1–5) | Reference |
|---|---|---|---|---|
| MS detection using ensemble of models | MSDNet (LSTM, DNN, CNN) optimized by enhanced walrus optimization algorithm | 5 | 3 | [182] |
| MS lesion detection using MRI | CNN with VGG16 architecture: Accuracy: 98.44% | 5 | 2 | [183] |
| CNN with VGG16 architecture: Specificity: 99.4% | ||||
| CNN with VGG16 architecture: Sensitivity: 97.56% | ||||
| MS classification using blood transcriptomics | Binary classification model: Accuracy: 97% | 5 | 3 | [184] |
| MS detection using metabolomics data | ANN: Accuracy: 87% | 4 | 3 | [185] |
| ANN: Sensitivity: 82.5% | ||||
| ANN: Specificity: 89% | ||||
| MS gait analysis | ResNet with regression-based normalization: Accuracy 100% | 5 | 3 | [186] |
| ResNet with regression-based normalization: F1-Score: 100% | ||||
| MS visual signs evaluation | NeuroVEP system: Agreement with standard tests: 91% | 4 | 3 | [187] |
| Central vein sign detection in MS lesions | CVSnet (3D CNN): Accuracy: 91% on test set | 5 | 3 | [188] |
| MS diagnosis via acceleration classifiers | Accuracy: 87% vs. EMG | 4 | 3 | [189] |
| MS biomarker identification in CSF | OCB+ Model: Sensitivity: 91% (training) | 4 | 3 | [190] |
| OCB+ Model: Specificity: 94% (training) | ||||
| OCB+ Model: Sensitivity: 81% (validation) | ||||
| OCB+ Model: Specificity: 94% (validation) | ||||
| OCB− Model: Sensitivity: 87% (training) | ||||
| OCB− Model: Specificity: 80% (training) | ||||
| OCB− Model: Sensitivity: 56% (validation) | ||||
| OCB− Model: Specificity: 48% (validation) | ||||
| MS and NMO classification using MRI | SVM & KNN: Precision: 98% | 5 | 3 | [191] |
| SVM & KNN: Recall: 99% | ||||
| SVM & KNN: F1-Score: 99% | ||||
| SVM & KNN: Accuracy: 99% (VGG16) | ||||
| MS prediction using ANN | ANN: Training Accuracy: 100% | 4 | 3 | [192] |
| ANN: Testing Accuracy: 75% |
| Dataset | Disease | Data Type | Size/Composition | Reference |
|---|---|---|---|---|
| ADNI | AD | MRI, PET, clinical, CSF, genomics | ~2000 participants (incl. CN, MCI, AD) | [126,127,149,150,155] |
| PPMI | PD | MRI, DaTscan, biomarkers, clinical data | ~1400 participants | [159,161] |
| DementiaBank (Pitt Corpus) | AD, LBD | Speech recordings, transcripts | ~240 individuals, >1000 recordings | [118,151] |
| OASIS | AD, Healthy controls | MRI | ~1100 MRI scans (OASIS-1/2/3 combined) | [152] |
| UK Biobank | General, AD, LBD | MRI, genetics, questionnaires | >500,000 participants, ~40,000 MRI scans | [119,147] |
| PhysioNet—Gait in PD | PD | Gait time-series | 306 subjects (214 PD, 92 control) | [165] |
| Kaggle PD voice dataset | PD | Acoustic features, vocal recordings | 195 instances, 23 features | [163,167,170] |
| Kaggle AD dataset | AD | Demographics, MMSE, MRI metadata | ~373 instances | [152] |
| BioFIND | PD | Clinical, MRI | ~120 participants | [159] |
| GEO (Gene Expression Omnibus) | ALS, AD | RNA-seq, microarray | Varies by dataset (GSE series) | [153] |
| OASIS-3 | AD | MRI, PET, clinical and cognitive scores | ~1095 subjects, longitudinal | [155] |
| ISBI 2015 Challenge Dataset | MS | MRI, lesion masks (longitudinal) | 5 patients, 4–5 timepoints each | [183] |
| MICCAI MSSEG 2016/2021 | MS | MRI (T1, T2, FLAIR), segmentation masks | ~15–60 patients, multiple modalities | [191] |
| Gait Analysis Dataset (custom or lab-collected) | MS | Accelerometry, motion signals | ~20–50 subjects (varies by lab) | [186,189] |
| Transcriptomic Datasets (e.g., GEO: GSE21942, GSE138266) | MS | Gene expression (blood) | 30–60 samples per cohort | [184] |
| Metabolomic Dataset (not named explicitly) | MS | Serum/plasma metabolic markers | ~50–100 subjects | [185] |
| NeuroVEP System Dataset | MS | Visual evoked potential signals | ~30–100 patients (from VEP systems) | [187] |
| OCB Biomarker Dataset (lab-collected) | MS | CSF biomarkers (OCB presence) | Training: ~100, Validation: ~50 | [190] |
| Multi-center MRI dataset (NMO vs. MS) | MS, NMO | MRI, clinical labels | ~100 subjects per group | [191] |
Disclaimer/Publisher’s Note: The statements, opinions and data contained in all publications are solely those of the individual author(s) and contributor(s) and not of MDPI and/or the editor(s). MDPI and/or the editor(s) disclaim responsibility for any injury to people or property resulting from any ideas, methods, instructions or products referred to in the content. |
© 2025 by the authors. Licensee MDPI, Basel, Switzerland. This article is an open access article distributed under the terms and conditions of the Creative Commons Attribution (CC BY) license (https://creativecommons.org/licenses/by/4.0/).
Share and Cite
Rosca, C.-M.; Stancu, A. A Review of Neuro-ML Breakthroughs in Addressing Neurological Disorders. Appl. Sci. 2025, 15, 5442. https://doi.org/10.3390/app15105442
Rosca C-M, Stancu A. A Review of Neuro-ML Breakthroughs in Addressing Neurological Disorders. Applied Sciences. 2025; 15(10):5442. https://doi.org/10.3390/app15105442
Chicago/Turabian StyleRosca, Cosmina-Mihaela, and Adrian Stancu. 2025. "A Review of Neuro-ML Breakthroughs in Addressing Neurological Disorders" Applied Sciences 15, no. 10: 5442. https://doi.org/10.3390/app15105442
APA StyleRosca, C.-M., & Stancu, A. (2025). A Review of Neuro-ML Breakthroughs in Addressing Neurological Disorders. Applied Sciences, 15(10), 5442. https://doi.org/10.3390/app15105442