1. Introduction
In recent years, the importance of daily health monitoring has grown significantly, driven by the increase in cases of patients with chronic conditions such as diabetes, hypertension, and cardiovascular diseases. Patients with this type of condition are often required to track physiological data, such as blood pressure, glucose levels, or oxygen saturation, using medical devices at home [
1]. However, despite the widespread use of such devices, a challenge remains in efficiently collecting and sharing the recorded data with healthcare providers. Currently, many medical devices require manual data entry into personal health records or mobile applications, which can be considered a tedious process and prone to many errors [
2,
3]. This monitoring process can be optimized using intelligent systems that digitize and centralize the data present in these devices. Additionally, many medical measurement devices do not have built-in communication interfaces, such as Bluetooth or Wi-Fi, which prevents them from automatically sending data to external systems or applications. Even in cases where connectivity is available, data transmission is often restricted to proprietary applications, limiting interoperability and integration with broader healthcare platforms.
Almost all recommended medical devices use a screen to show measurement values. Within those devices that use a screen, the majority use a seven-segment display [
4]. Despite their simple structure, seven-segment digits can be difficult to detect and recognize. Additionally, acronyms (which can be units of measurement or the category the values represent) typically are not in seven-segment format and can have multiple fonts, adding another layer of complexity to the recognition process.
The development of systems for automating the recognition of medical or industrial device displays has already been explored in previous works [
1,
3,
4,
5,
6,
7,
8,
9,
10,
11,
12,
13,
14,
15]. A diverse range of methodologies were employed in these studies, from traditional image-processing techniques to deep learning models. Regarding studies that focused on traditional processing methods, various approaches have been employed to identify seven-segment digits. Adaptive thresholding and binarization techniques have been applied to enhance contrast and isolate digit segments from the background, as demonstrated by the works [
3,
5]. Segmentation techniques have been widely used to extract individual digits from display screens. For instance, Tsiktsiris et al. [
3] proposed an algorithm that combines adaptive thresholding, segmentation, and a predefined lookup table for digit classification. Feature extraction methods were also used to refine digit recognition by analyzing segment shapes and spatial positioning. Popayorm et al. [
6] explored this approach using Hue, Saturation, Value (HSV)-based color slicing to improve segmentation accuracy. Finnegan et al. [
4] proposed a hybrid approach that combined binarization with Maximally Stable Extremal Regions (MSER) to enhance digit segmentation in seven-segment displays. Additionally, their method incorporated machine learning, using a Multi-Layer Perceptron (MLP) classifier to improve recognition accuracy beyond that of traditional image-processing techniques.
As for studies that follow a deep learning approach [
1,
7,
8,
9,
10,
11,
12,
13,
14,
15], we can observe a prevalence in the use of models such as Convolutional Neural Networks and object detection frameworks. Lobo et al. [
1] used the You Only Look Once (YOLOv3) and Single Shot MultiBox Detector (SSD) models for the detection and classification of digits and acronyms in medical devices. The study focused on three types of devices: glucometers, blood pressure monitors, and oximeters. Among the models tested, YOLOv3 demonstrated the most consistent performance. In the context of industrial devices, Suttapakti et al. [
9] evaluated several object detection models for seven-segment display recognition and found that the Cascade Region-Based Convolutional Neural Network (Cascade R-CNN) achieved the best overall performance. Although its classification accuracy was slightly lower than YOLOv3 and CornerNet, it outperformed all other models in precision, recall, and F1-score, demonstrating potential for reliable digit detection.
From the analysis of related work, we can observe that traditional processing methods, although effective for specific and controlled environments, may have limitations in generalizing to different display conditions, such as conditions with noise and lighting variations. However, these methods remain efficient and suitable for constrained devices or controlled settings. Suttapakti et al. [
9] conducted a direct comparison between deep learning models and the handcrafted approaches analyzed by Popayorm et al. [
6], showing that deep learning achieved superior performance in terms of detection accuracy, although the study did not focus on computational cost or real-time applicability. In scenarios involving small datasets or highly controlled acquisition conditions, simpler algorithms can still perform adequately and often offer advantages in terms of computational efficiency and ease of deployment. Additionally, the assumption that artificial intelligence (AI) systems will perform reliably under diverse real-world conditions may overlook practical issues such as device variability, user operation errors, and inconsistent lighting environments. These challenges must be considered when evaluating the generalizability of AI-driven digitization approaches in home care settings.
This work is part of an initial analysis to support the development of a practical application for automatically digitizing measurements from medical device displays intended for use in home care and clinical environments. To support this goal, the present study focuses on identifying the most suitable detection models based on their accuracy and efficiency under controlled conditions, establishing a technical foundation for the forthcoming implementation phase.
The current research provides a comparative analysis of several YOLO [
16] and SSD [
17] models for detecting and classifying digits and acronyms on medical device displays. This study aims to provide insights into the advantages and limitations of each model, offering guidance for selecting the most suitable option based on the specific requirements of the intended application. The analysis also evaluates the computational efficiency of each model to determine their suitability for real-time deployment in resource-constrained environments.
The remainder of this document is organized as follows:
Section 2 outlines the methodology, including the object detection models, datasets, and implementation details.
Section 3 describes the experimental setup, covering the training process and evaluation metrics used to assess model performance.
Section 4 presents the experimental results, followed by
Section 5, which discusses the findings, key insights, limitations, and potential improvements. Finally,
Section 6 concludes the study, summarizing the main contributions.
2. Methodology
2.1. Models Description
Object detection architectures can be broadly classified into single-stage and two-stage detectors, each presenting specific trade-offs regarding accuracy, speed, and computational efficiency. The selection of the appropriate architecture is highly dependent on the application requirements. Given the potential future deployment of this system on mobile devices or devices with limited resources, the comparative analysis focused on single-stage detectors, due to their lower computational requirements and ability to achieve real-time performance without significantly compromising detection accuracy.
Single-stage detectors such as YOLO [
16] and the SSD [
17] employ an end-to-end approach that directly predicts bounding boxes and class probabilities in a single network pass. These models are optimized for speed and are particularly suitable for real-time applications. However, due to the lack of a separate region refinement stage, they may exhibit a slight decrease in accuracy when detecting small or overlapping objects.
For this study, the comparative analysis included the following models: YOLOv3u, YOLOv5mu, YOLOv8n, YOLOv8m, and YOLOv8l from the YOLO family (Ultralytics repository) and the SSD MobileNet V2 Feature Pyramid Network Lite (FPNLite) from the TensorFlow Model Garden API. The models were evaluated at two distinct input image resolutions: 320 × 320 and 640 × 640.
In addition to the aforementioned models, a Convolutional Neural Network (CNN) was developed for the classification component. The architecture of this network was based on the work carried out by Lobo et al. [
1], and was designed to classify the objects extracted from the bounding boxes predicted by the detection models.
2.2. YOLO (You Only Look Once)
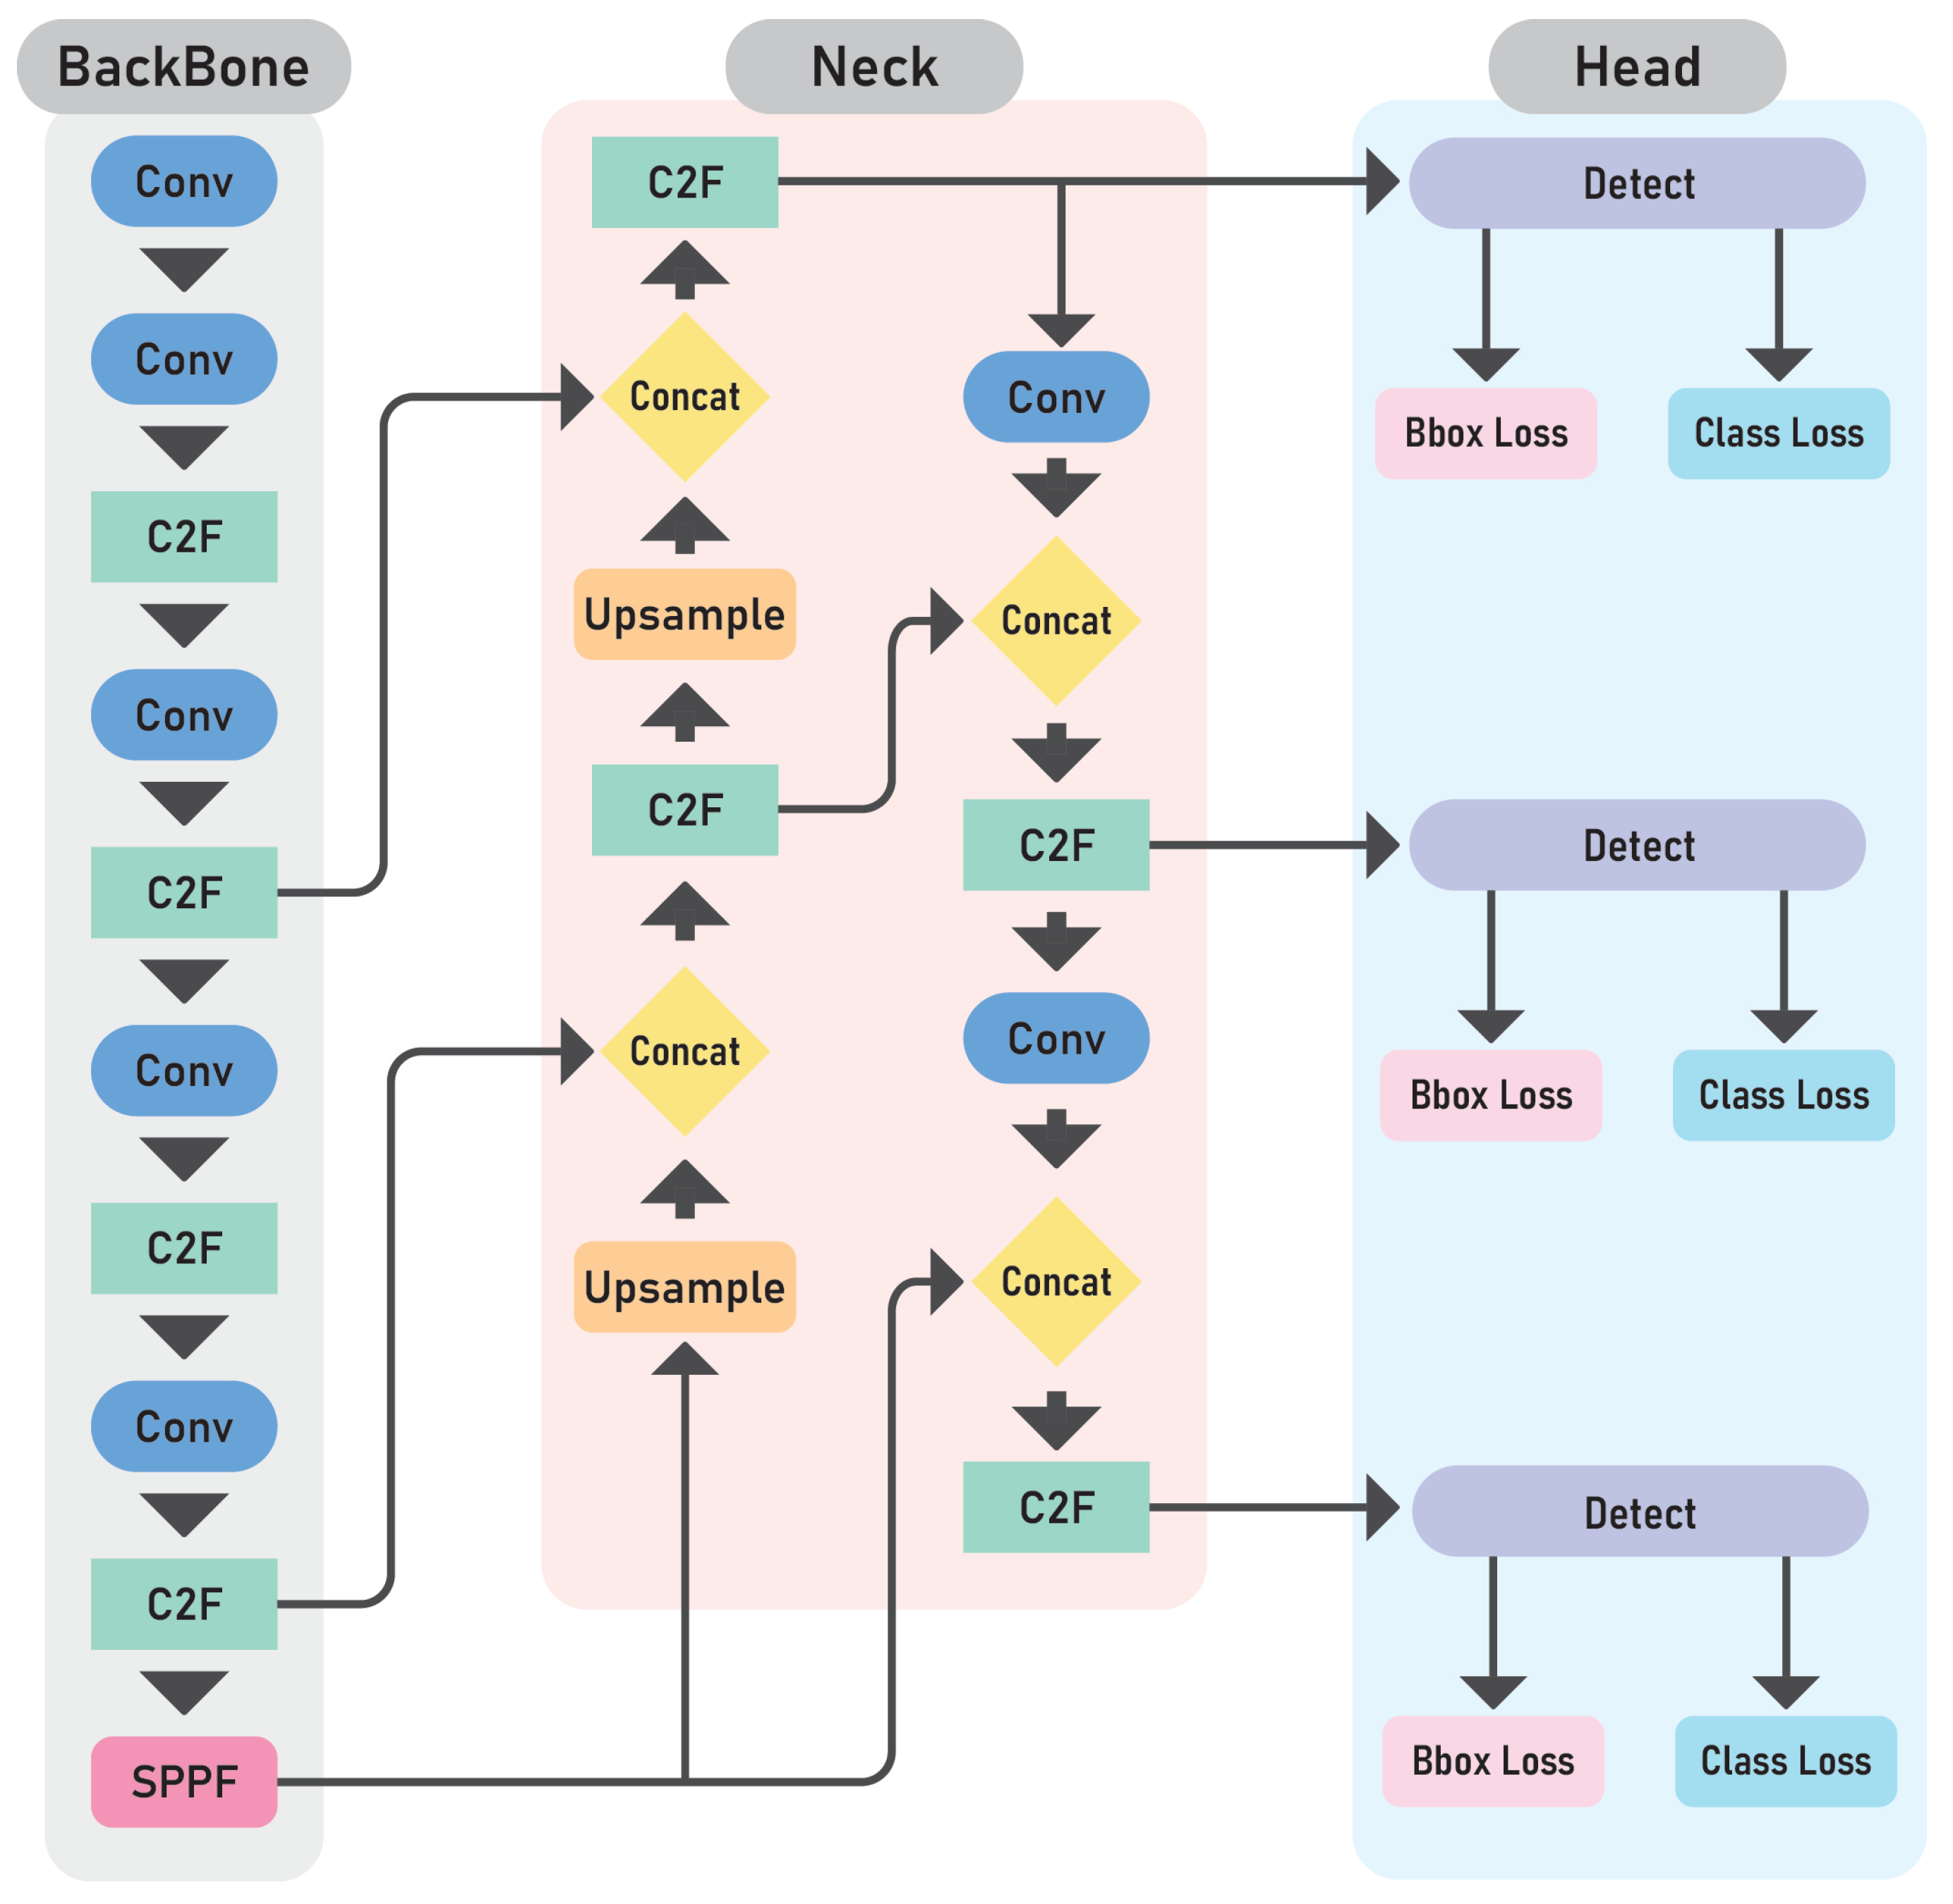
YOLO approaches object detection as a single regression task, directly predicting bounding boxes and class probabilities from the input image in one forward pass. A convolutional backbone, typically CSPDarknet-inspired modules, is used to extract rich spatial features. These features are then processed by a feature aggregation neck, such as a Feature Pyramid Network (FPN) or Path Aggregation Network (PAN), which enhances multiscale detection by combining spatial and semantic information across different resolutions. The resulting feature maps are fed into multiple detection heads that simultaneously predict object classes, bounding box coordinates, and objectness scores. Recent iterations, such as YOLOv8, introduce anchor-free detection and partially decoupled heads for classification and regression, improving performance on small or overlapping objects while maintaining real-time inference capabilities.
Figure 1 illustrates the general architecture of the YOLOv8 model, highlighting a convolutional backbone based on Concatenate-to-Fuse (C2F) modules for feature extraction, a PAN-style neck for multiscale feature fusion, and detection heads operating at three different resolutions. In the following subsections, we provide detailed descriptions of the YOLO variants used in this comparative study. The information presented is based on the official documentation from the Ultralytics repository [
18].
2.2.1. YOLOv3u
YOLOv3u is an advanced variant of YOLOv3, optimized by Ultralytics for improved accuracy and inference speed. It incorporates the anchor-free, objectness-free split head used in YOLOv8 models. While maintaining the original Darknet-53 backbone and neck architecture from YOLOv3, the aforementioned modification eliminates the need for predefined anchor boxes and objectness scores. The updated detection head improves the model’s ability to detect objects of varying sizes and shapes.
2.2.2. YOLOv5mu
YOLOv5mu is an optimized variant of the YOLOv5 series that combines the model’s signature modular design with advanced detection capabilities. Building on YOLOv5’s Cross Stage Partial (CSP) backbone architecture, which reduces computational load while maintaining accuracy, the medium (mu) variant introduces the anchor-free, objectness-free split head from YOLOv8 models. The medium variant specifically targets the balance between computational efficiency and detection performance, making it particularly suitable for resource-constrained environments.
2.2.3. YOLOv8 (n, m, l)
YOLOv8 represents one of the latest versions of the YOLO family, introducing state-of-the-art improvements in architecture and detection capabilities. Built on an optimized CSPDarknet backbone with enhanced neck architectures, the model incorporates several key innovations including anchor-free detection, deeper networks, and advanced training techniques. The anchor-free split head design eliminates the need for predefined bounding box anchors, enhancing adaptability to detect objects of varying sizes while maintaining computational efficiency. In this study, the variants YOLOv8n (nano), YOLOv8m (medium), and YOLOv8l (large) were used to evaluate the performance in recognizing digits and acronyms on medical device displays.
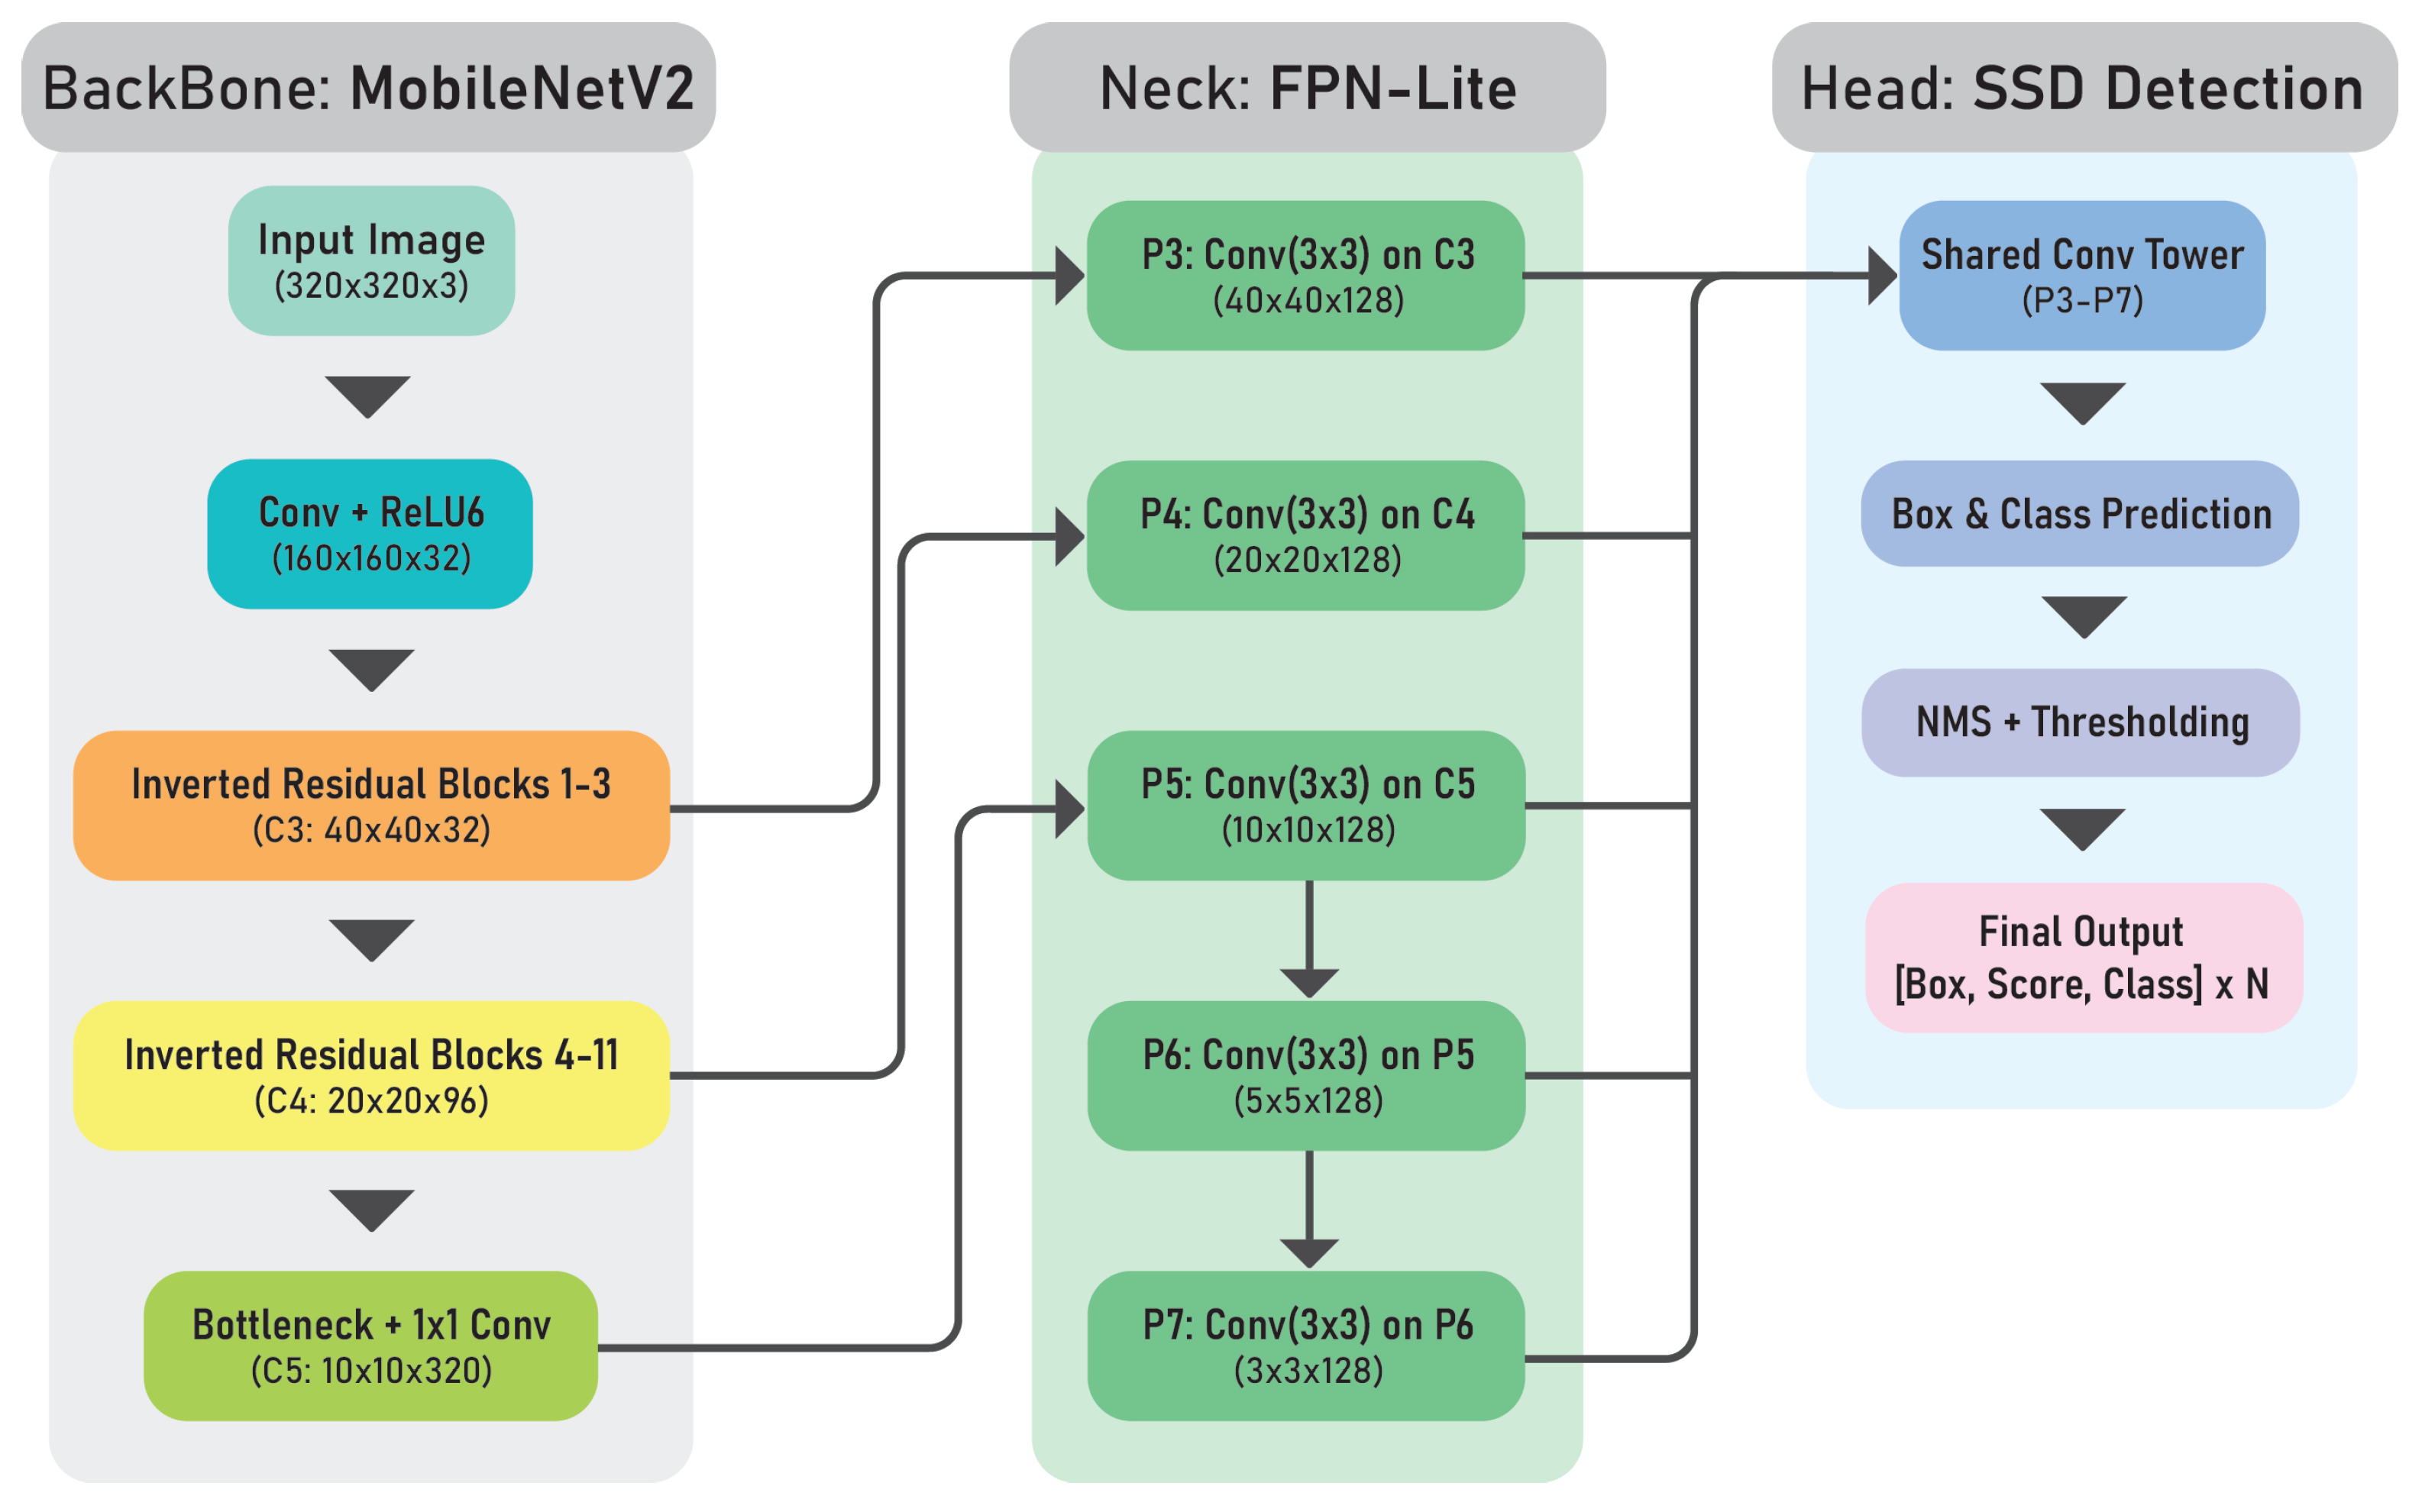
2.3. SSD MobileNet V2 FPNLite
The SSD framework [
17], when combined with the MobileNetV2 backbone and the FPNLite extension, forms a computationally efficient object detection system optimized for resource-constrained environments.
MobileNet V2 acts as the backbone and employs depthwise separable convolutions along with inverted residual blocks to enable lightweight and effective feature extraction with minimal computational overhead. To enhance detection performance across distinct object scales, particularly for small objects, the SSD integrates FPNLite, a streamlined variant of the traditional Feature Pyramid Network (FPN). FPNLite enables hierarchical feature fusion, allowing the model to leverage multiscale features more effectively without a significant increase in complexity. The SSD detection head complements this architecture by performing multiscale predictions across feature maps at different resolutions. Each grid cell within these feature maps is responsible for detecting objects in specific receptive fields, using predefined default anchor boxes with varying aspect ratios and scales.
The general architecture of the SSD with MobileNetV2 and FPNLite is shown in
Figure 2.
2.4. CNN Architecture
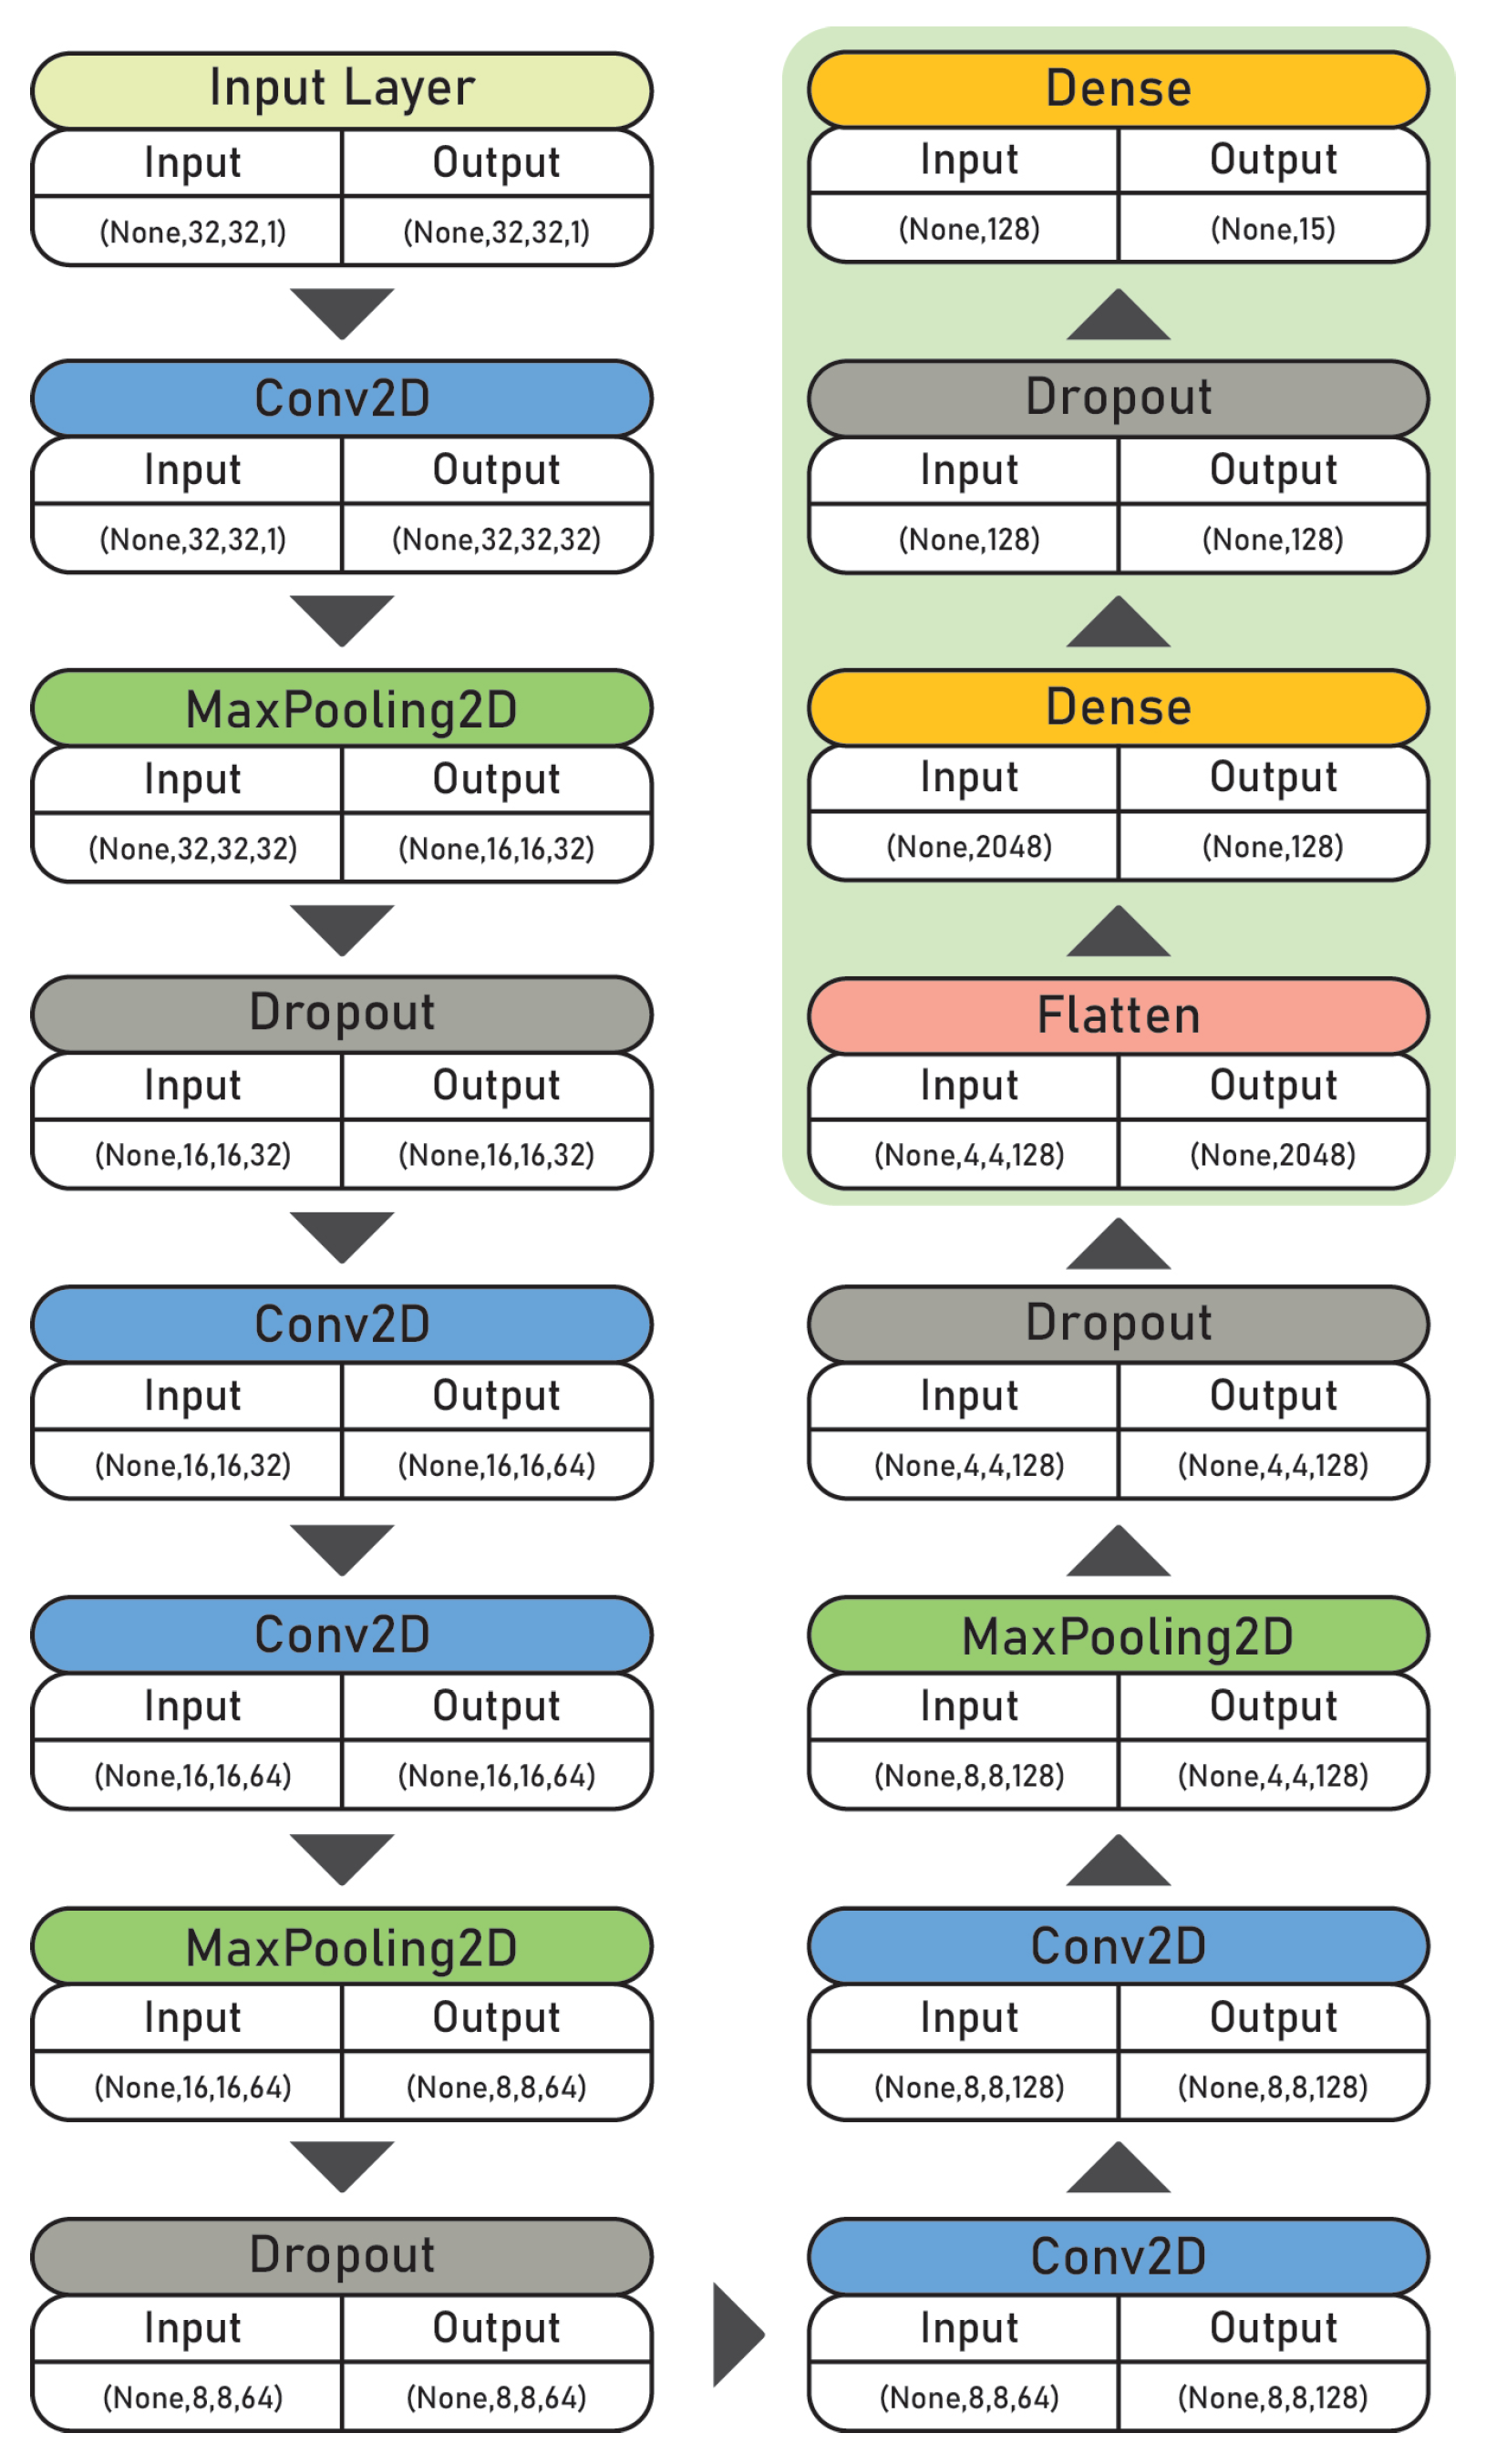
A Convolutional Neural Network (CNN) was developed for multiclass classification. It was designed for grayscale images of size 32 × 32 pixels with a single channel (32, 32, 1). The architecture was optimized for computational efficiency while incorporating regularization techniques to mitigate overfitting and improve generalization on limited grayscale image data.
The model architecture begins with an input layer configured to process grayscale images of dimensions 32 × 32 pixels followed by batch normalization to stabilize and accelerate training. It includes three convolutional blocks, each comprising two convolutional layers with ReLU activations and the same padding, followed by max-pooling and dropout layers to reduce spatial dimensions and mitigate overfitting. The number of filters increases progressively across the blocks (32, 64, 128) to capture increasingly complex features.
After the convolutional layers, the output is flattened and passed through a fully connected dense layer with 128 units, followed by an additional dropout layer. The final layer is a dense layer with 15 units, activated by a softmax function to produce class probabilities corresponding to the 15 output categories.
The general CNN architecture is illustrated in
Figure 3.
2.5. Datasets
The dataset was obtained from [
1]. The data include photographs of local medical devices, images compiled from the internet, particularly from manufacturers catalogs, and additional data sourced from a public dataset [
4]. The medical devices represented in the dataset include oximeters, glucometers, and blood pressure monitors. A detailed breakdown of the number of images per device type and source is presented in
Table 1, illustrating the composition and diversity of the dataset. From the full set of 1614 annotated images, 75% were used for training, 12.5% for validation, and 12.5% for testing. This split was applied to ensure balanced representation across device types and label classes.
For each image, manual labeling was performed using 15 classes, comprising the ten digits (0 to 9) and five acronyms representing medical terms: “sys” for systolic blood pressure, “dia” for diastolic blood pressure, “m” for glycemic level, “p” for pulse, and “spO2” for oxygen saturation.
A second dataset was created from the original. This dataset consisted of cropped images of the bounding boxes annotated in the original images, along with their corresponding labels. The purpose of this dataset was to train the CNN to perform the classification task specifically, to compare the performance of standalone models with the combined approach of bounding box regression and CNN classification.
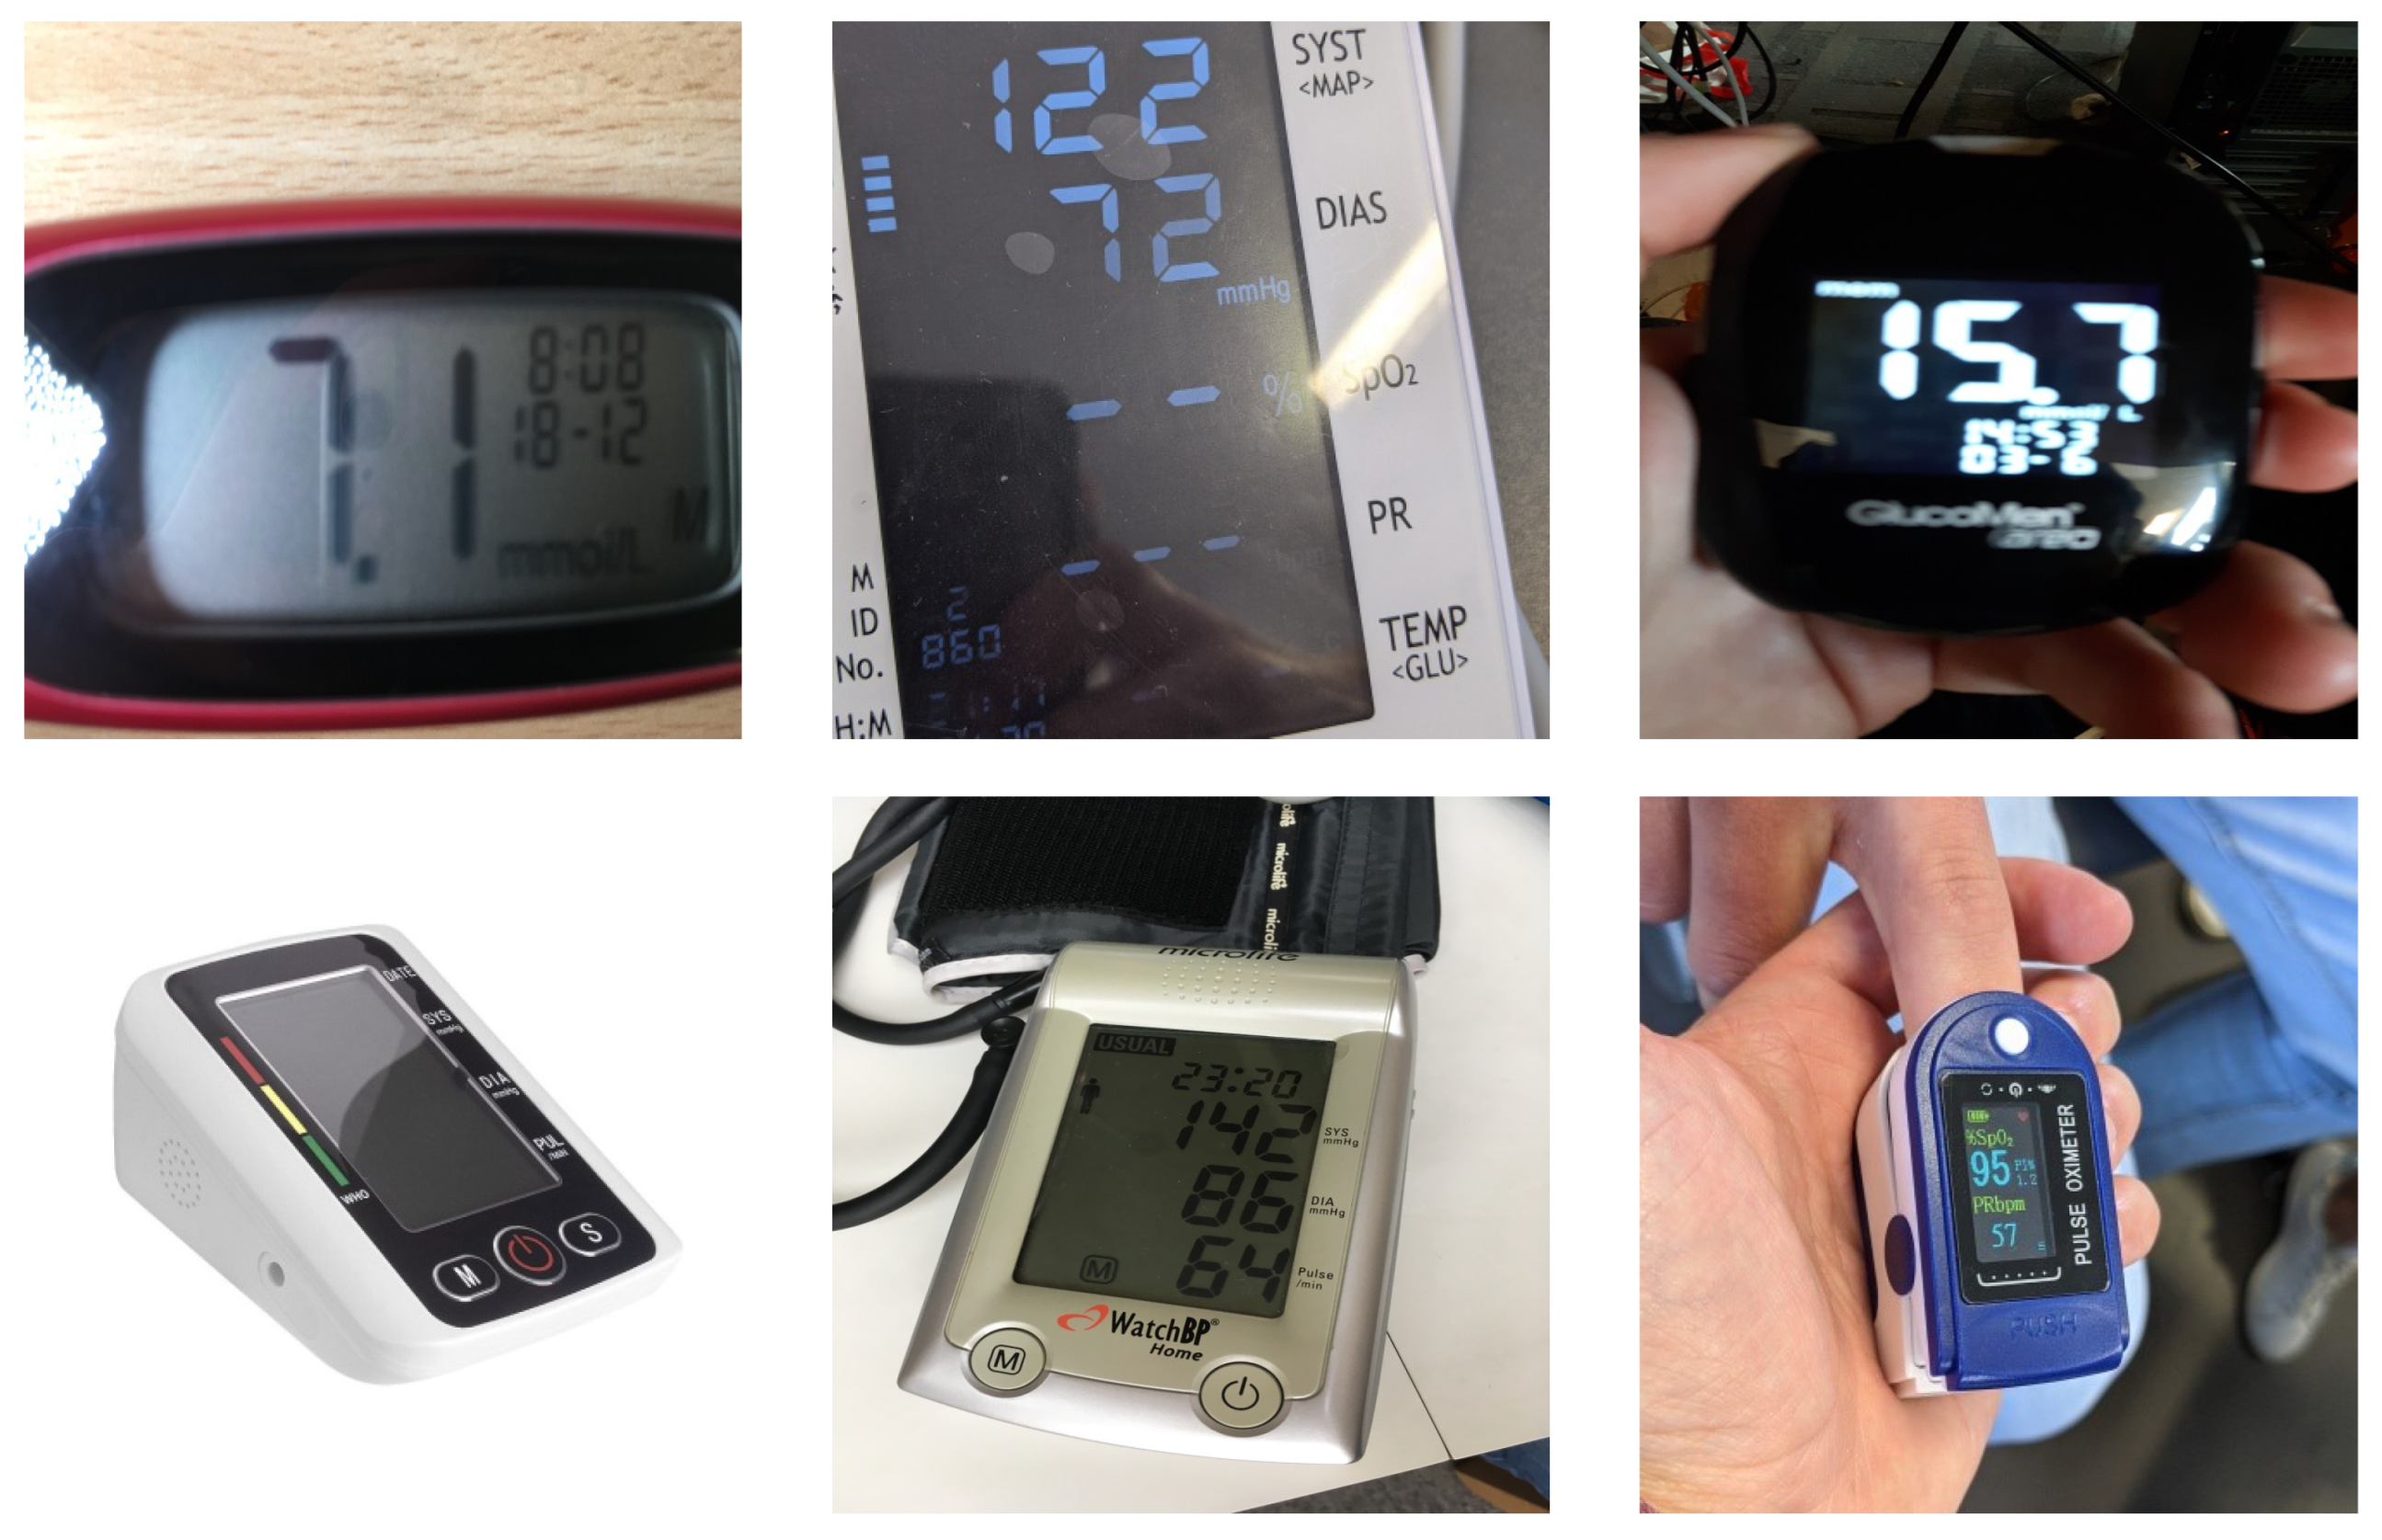
To illustrate some of the variability present in the dataset,
Figure 4 presents a selection of sample images. These samples reflect a range of characteristics, including inconsistent lighting, glare, reflections, and varying fonts.
2.6. Implementation Details
Before our analysis, some preprocessing steps were carried out, including the resizing and cropping of all images to a dimension of 832 × 832 pixels and converting them to a common file format.
In our implementation, considering the applied methodology, a second resizing was applied to convert the image size to the defined input sizes, namely, 320 × 320 and 640 × 640 pixels. Additionally, data augmentation techniques, such as horizontal flips and random crops, were applied to increase the diversity of the training data.
Image normalization was handled internally within the model architectures during training, both in YOLO (Ultralytics) and the SSD (via the TensorFlow Model Garden configuration). This process scaled the pixel values from their original range of [0, 255] to a range of [0, 1] for YOLO and [−1, 1] for the SSD.
Regarding the CNN, additional preprocessing steps were applied to the cropped images. These steps included resizing the images to a dimension of 32 × 32 pixels, converting them to grayscale, and normalizing the pixel values to a range of [0, 1]. Data augmentation techniques were also applied to improve the generalization ability of the model.
3. Experiments
3.1. Training Setup
All experiments were conducted on a computational platform equipped with an NVIDIA GeForce GTX 1650 graphics card (4 GB) (Santa Clara, CA, USA), an Intel Core i5-9300HF (Santa Clara, CA, USA), and 8 GB of RAM, operating with the NVIDIA CUDA Toolkit version 12.1.
The implementation utilized Ultralytics YOLO, TensorFlow Model Garden, and PyTorch for model development and execution. Supporting tools included OpenCV and Pillow for image processing, NumPy and Pandas for data handling, and Matplotlib for data visualization.
The YOLO models were trained for approximately 30,000 steps with the AdamW optimizer using the Complete Intersection over Union (CIoU) as the loss function for bounding box regression and Binary Cross-Entropy (BCE) for both objectness (confidence) and classification. The SSD models were trained for 56,000 steps with the Momentum Stochastic Gradient Descent (SGD) optimizer using Smooth L1 Loss for bounding box regression and Sigmoid Focal Loss for classification.
Regarding the Convolutional Neural Network (CNN), the model was trained over 150 epochs using the Adam optimizer and categorical cross-entropy.
3.2. Evaluation Metrics
The object detection models were evaluated using metrics such as precision, recall, and mean average precision (mAP) at 0.5 Intersection over Union (IoU). For overall performance, we also measured frames per second (FPS) to assess inference speed.
In the class-wise comparison, precision, recall, and average precision (AP) at 0.5 IoU were reported for each class to highlight the model’s ability to detect specific categories.
Regarding the evaluation of the classification component, comparing the standalone models with the combined approach of bounding box regression and CNN classification, the metrics used were the standard classification report metrics.
4. Results
To assess how the model’s performance varies with resolution, two distinct input dimensions were evaluated, 320x320 and 640x640. As shown in
Table 2, models using a higher resolution achieved better detection accuracy. The YOLOv8l (640) model achieved the highest mAP@50, reaching 0.979. Regarding inference speed, YOLOv8n (320) achieved the fastest performance, with a frame rate of 129.79 FPS.
In the class-wise performance analysis, the YOLOv8l (640) and SSD MobileNet V2 FPNLite (640) models, which achieved the highest mAP@50 scores within their respective architectures, were compared. It should be noted that this comparison selection was based solely on mAP@50 and does not imply these are the best models overall, as the optimal choice may vary depending on specific use-case requirements.
The comparison, shown in
Table 3, reports precision, recall, and AP@50 metrics for each class. The classes include the digits 0-9, as well as medical acronyms such as “sys”, “dia”, “m”, “p”, and “spO2”. The YOLOv8l (640) demonstrated superior performance across all classes, with particularly high metrics for class 4, achieving a precision of 0.995 and a recall of 0.975. While the SSD MobileNet V2 FPNLite (640) model exhibited lower precision and recall values, it performed well in class 4 with 0.902 precision and 0.933 recall. Overall, the YOLOv8l (640) model demonstrated higher class-wise performance when compared to the SSD MobileNet V2 FPNLite (640).
Table 4 presents a comparative analysis of classification metrics between the YOLOv8l (640) standalone model and the YOLOv8l (640) combined with a CNN classifier. It is essential to emphasize that the classification metrics were derived exclusively from matched bounding boxes, where correspondence between predicted and ground truth boxes was established using an Intersection over Union threshold of 0.5. Only these matched boxes were included in the metrics calculation, while unmatched predictions and ground truths were excluded from the evaluation. This approach focused on the classification performance of the boxes that were successfully matched rather than the overall object detection performance. For the standalone YOLOv8l (640) model, an accuracy of 0.98 was achieved, with high precision, recall, and F1-scores across most classes.
In comparison, the YOLOv8l model combined with the CNN classifier achieved a slightly lower overall accuracy of 0.96. While most classes maintained high performance metrics, some classes, such as class 5 and class 2, showed lower values of precision, recall, and F1-scores.
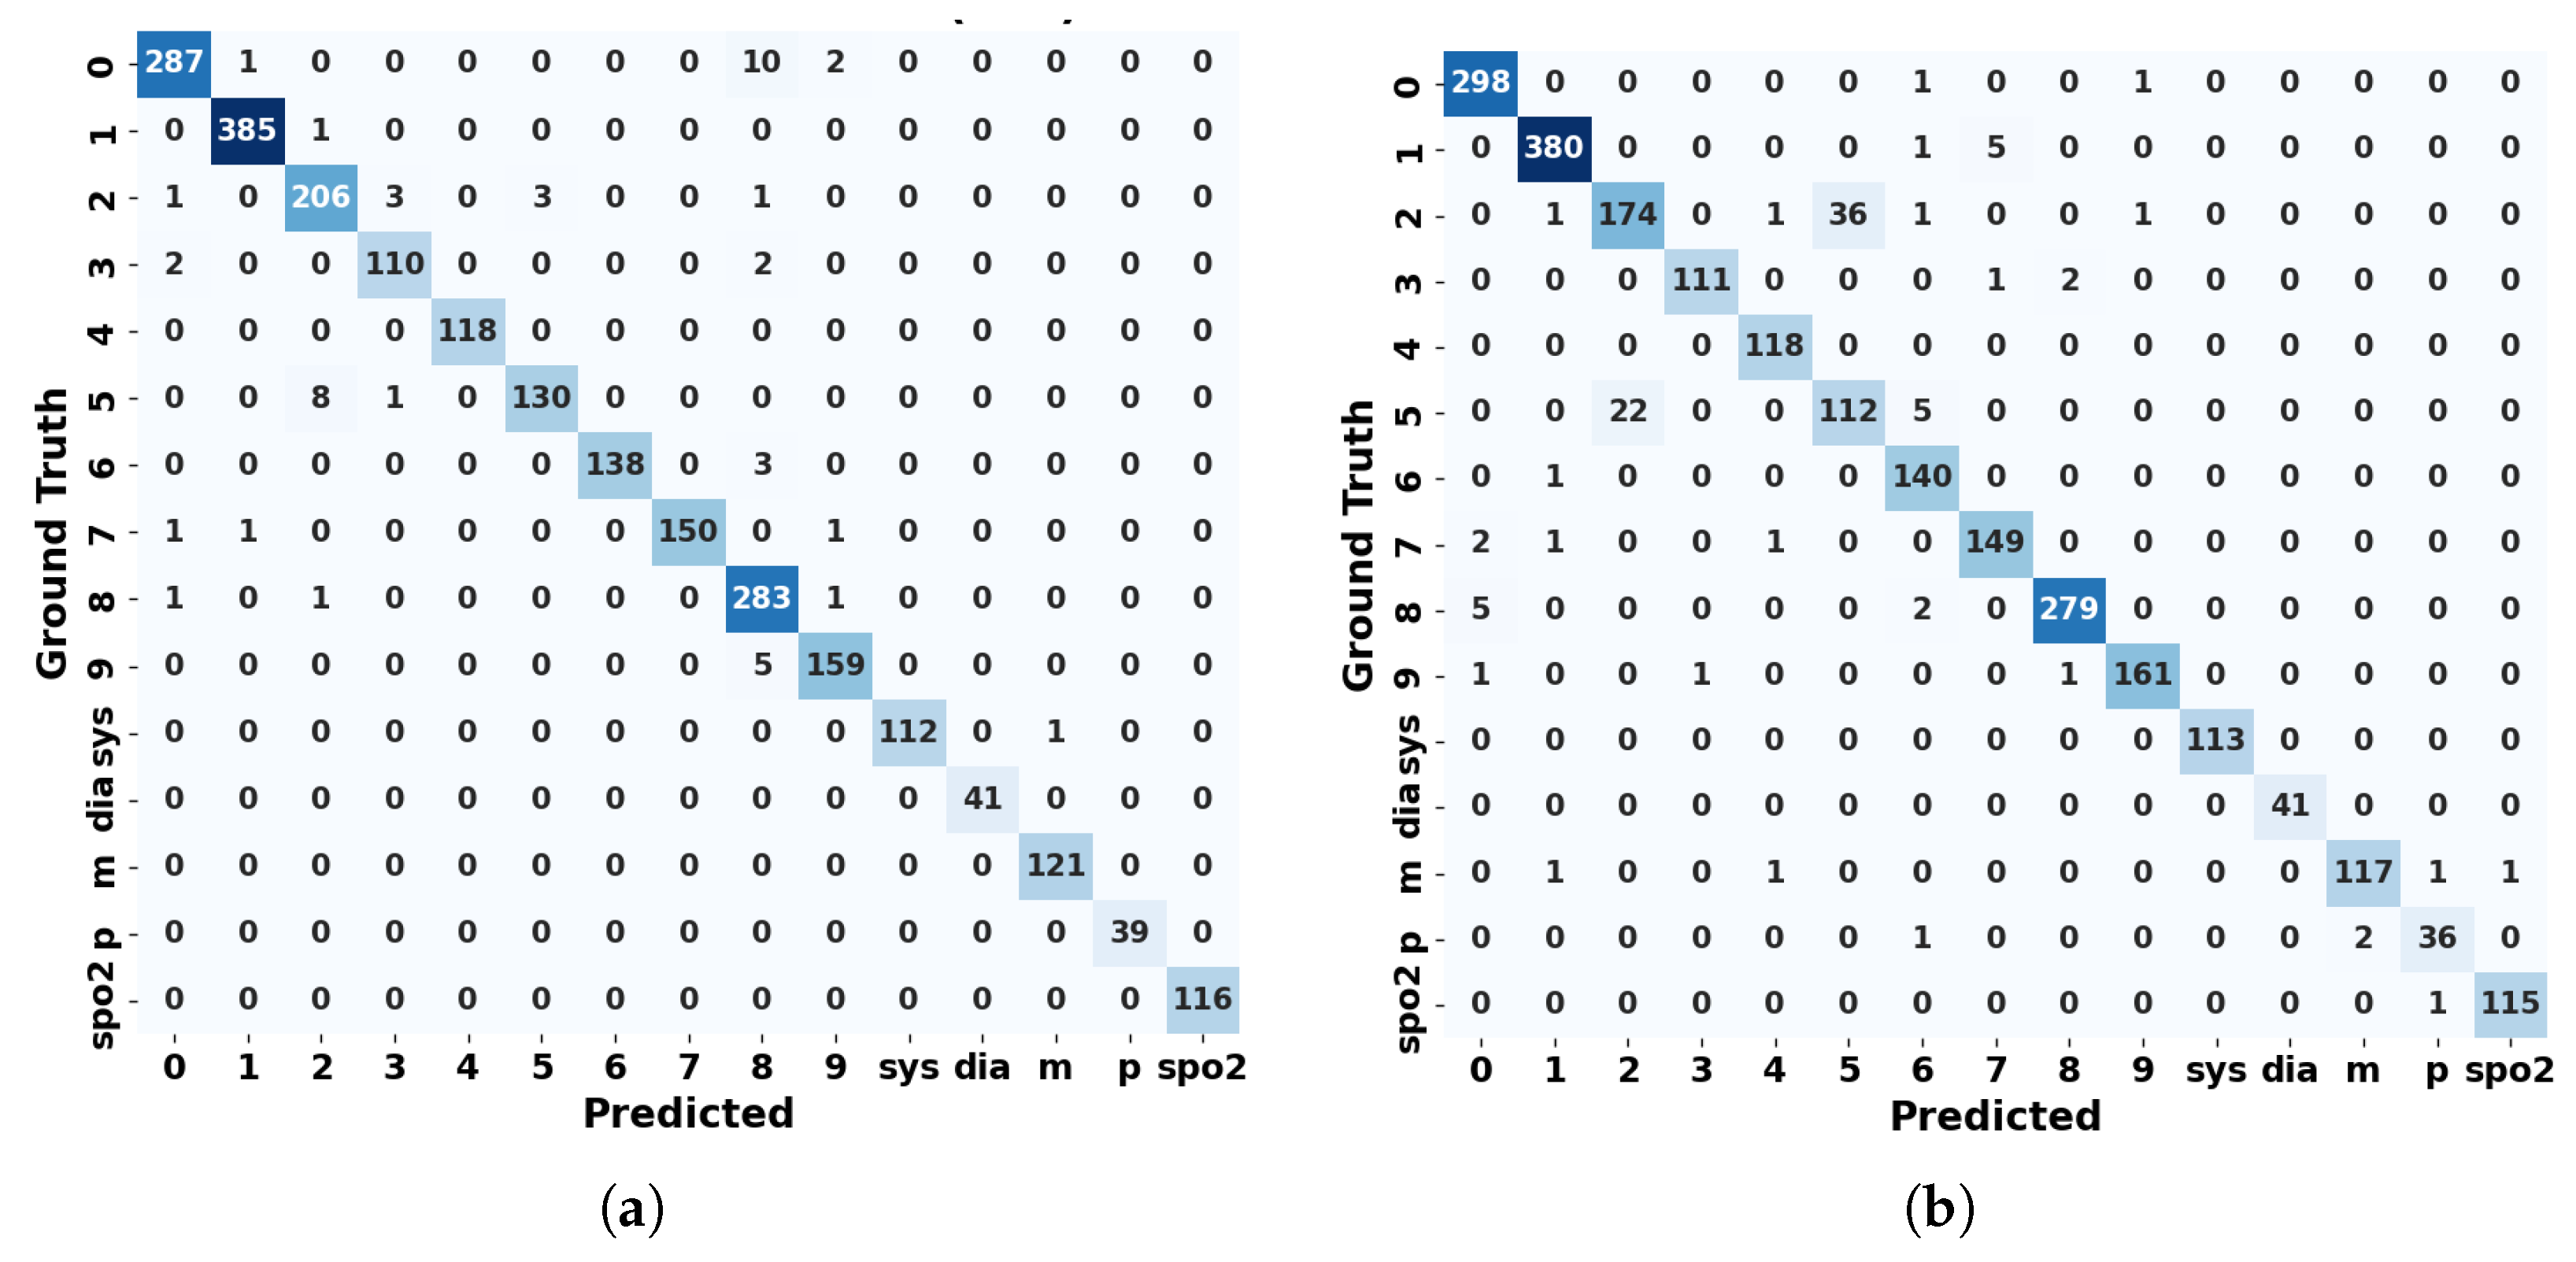
Regarding the confusion matrices between the YOLOv8l standalone model and the YOLOv8l with the CNN, shown in
Figure 5, we can once again observe that the performance of the standalone model was slightly superior to that of the model with the CNN incorporated.
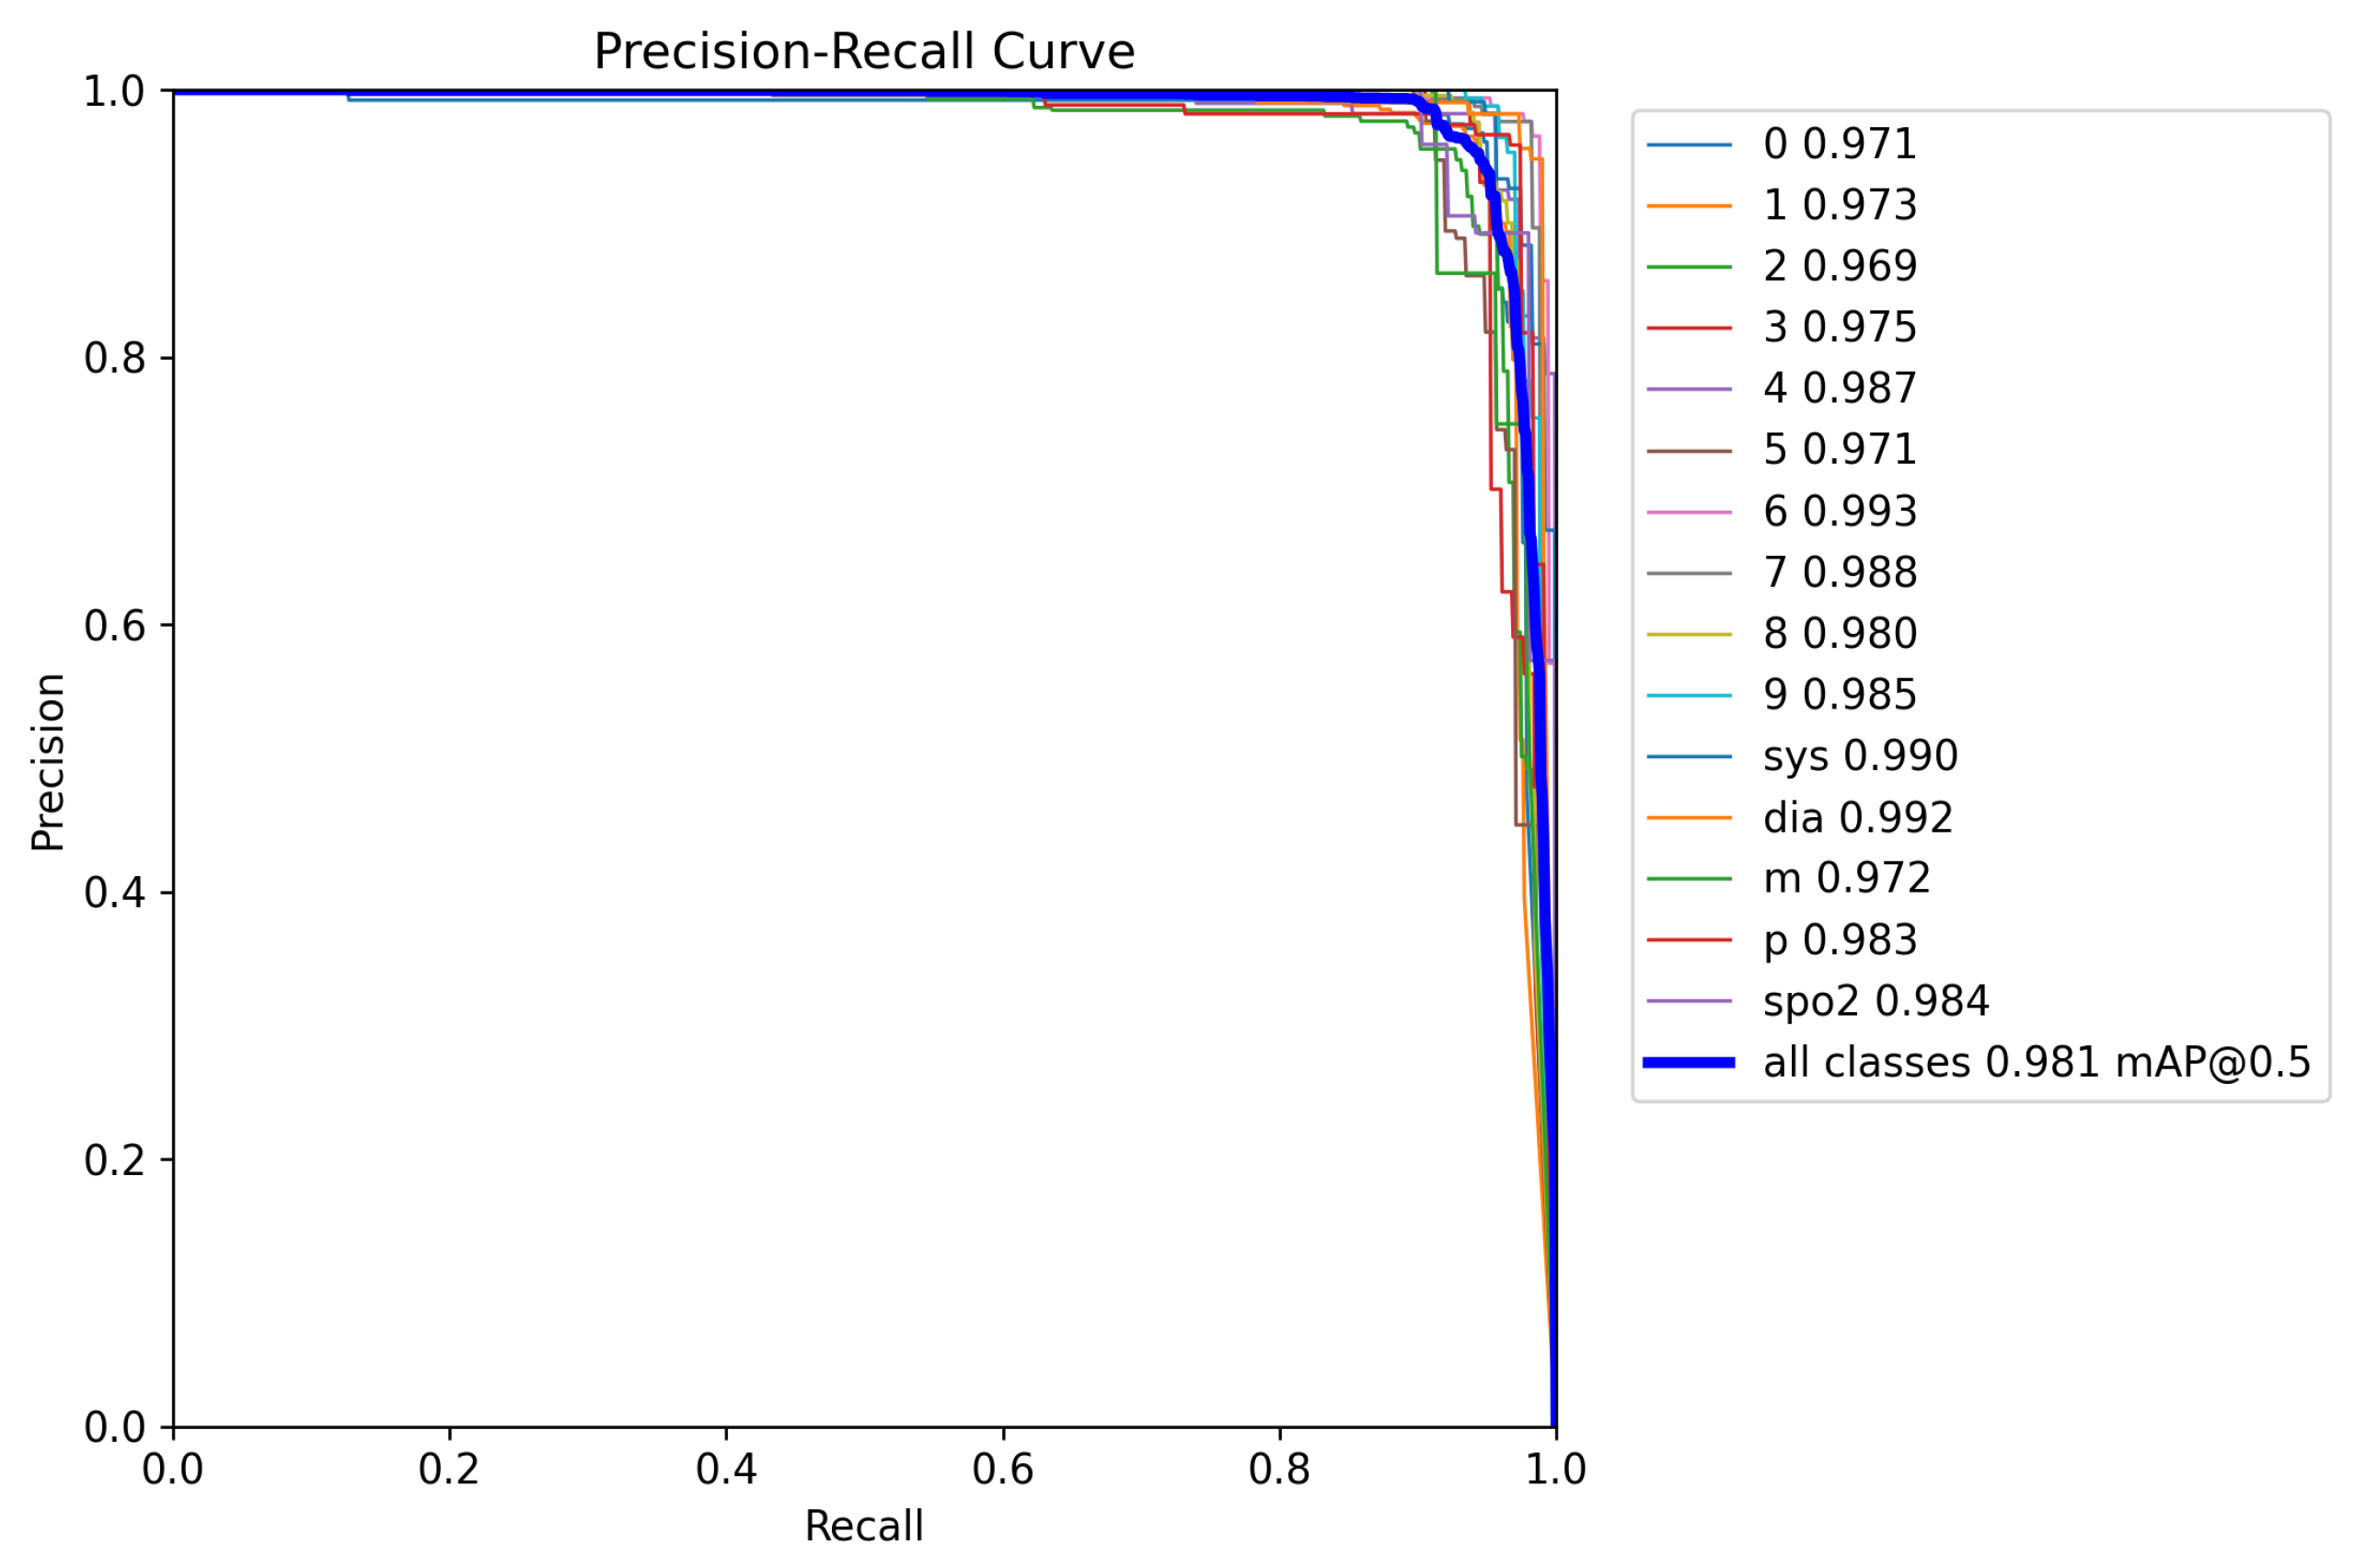
Figure 6 presents the precision–recall (PR) curve for the YOLOv8l standalone model. The PR curve illustrates the relationship between precision and recall across different classification thresholds. We can observe that all classes have good performance across various threshold levels. The curves for each class are positioned in the upper-right corner, indicating that the model achieves a good balance of precision and recall for all the analyzed classes.
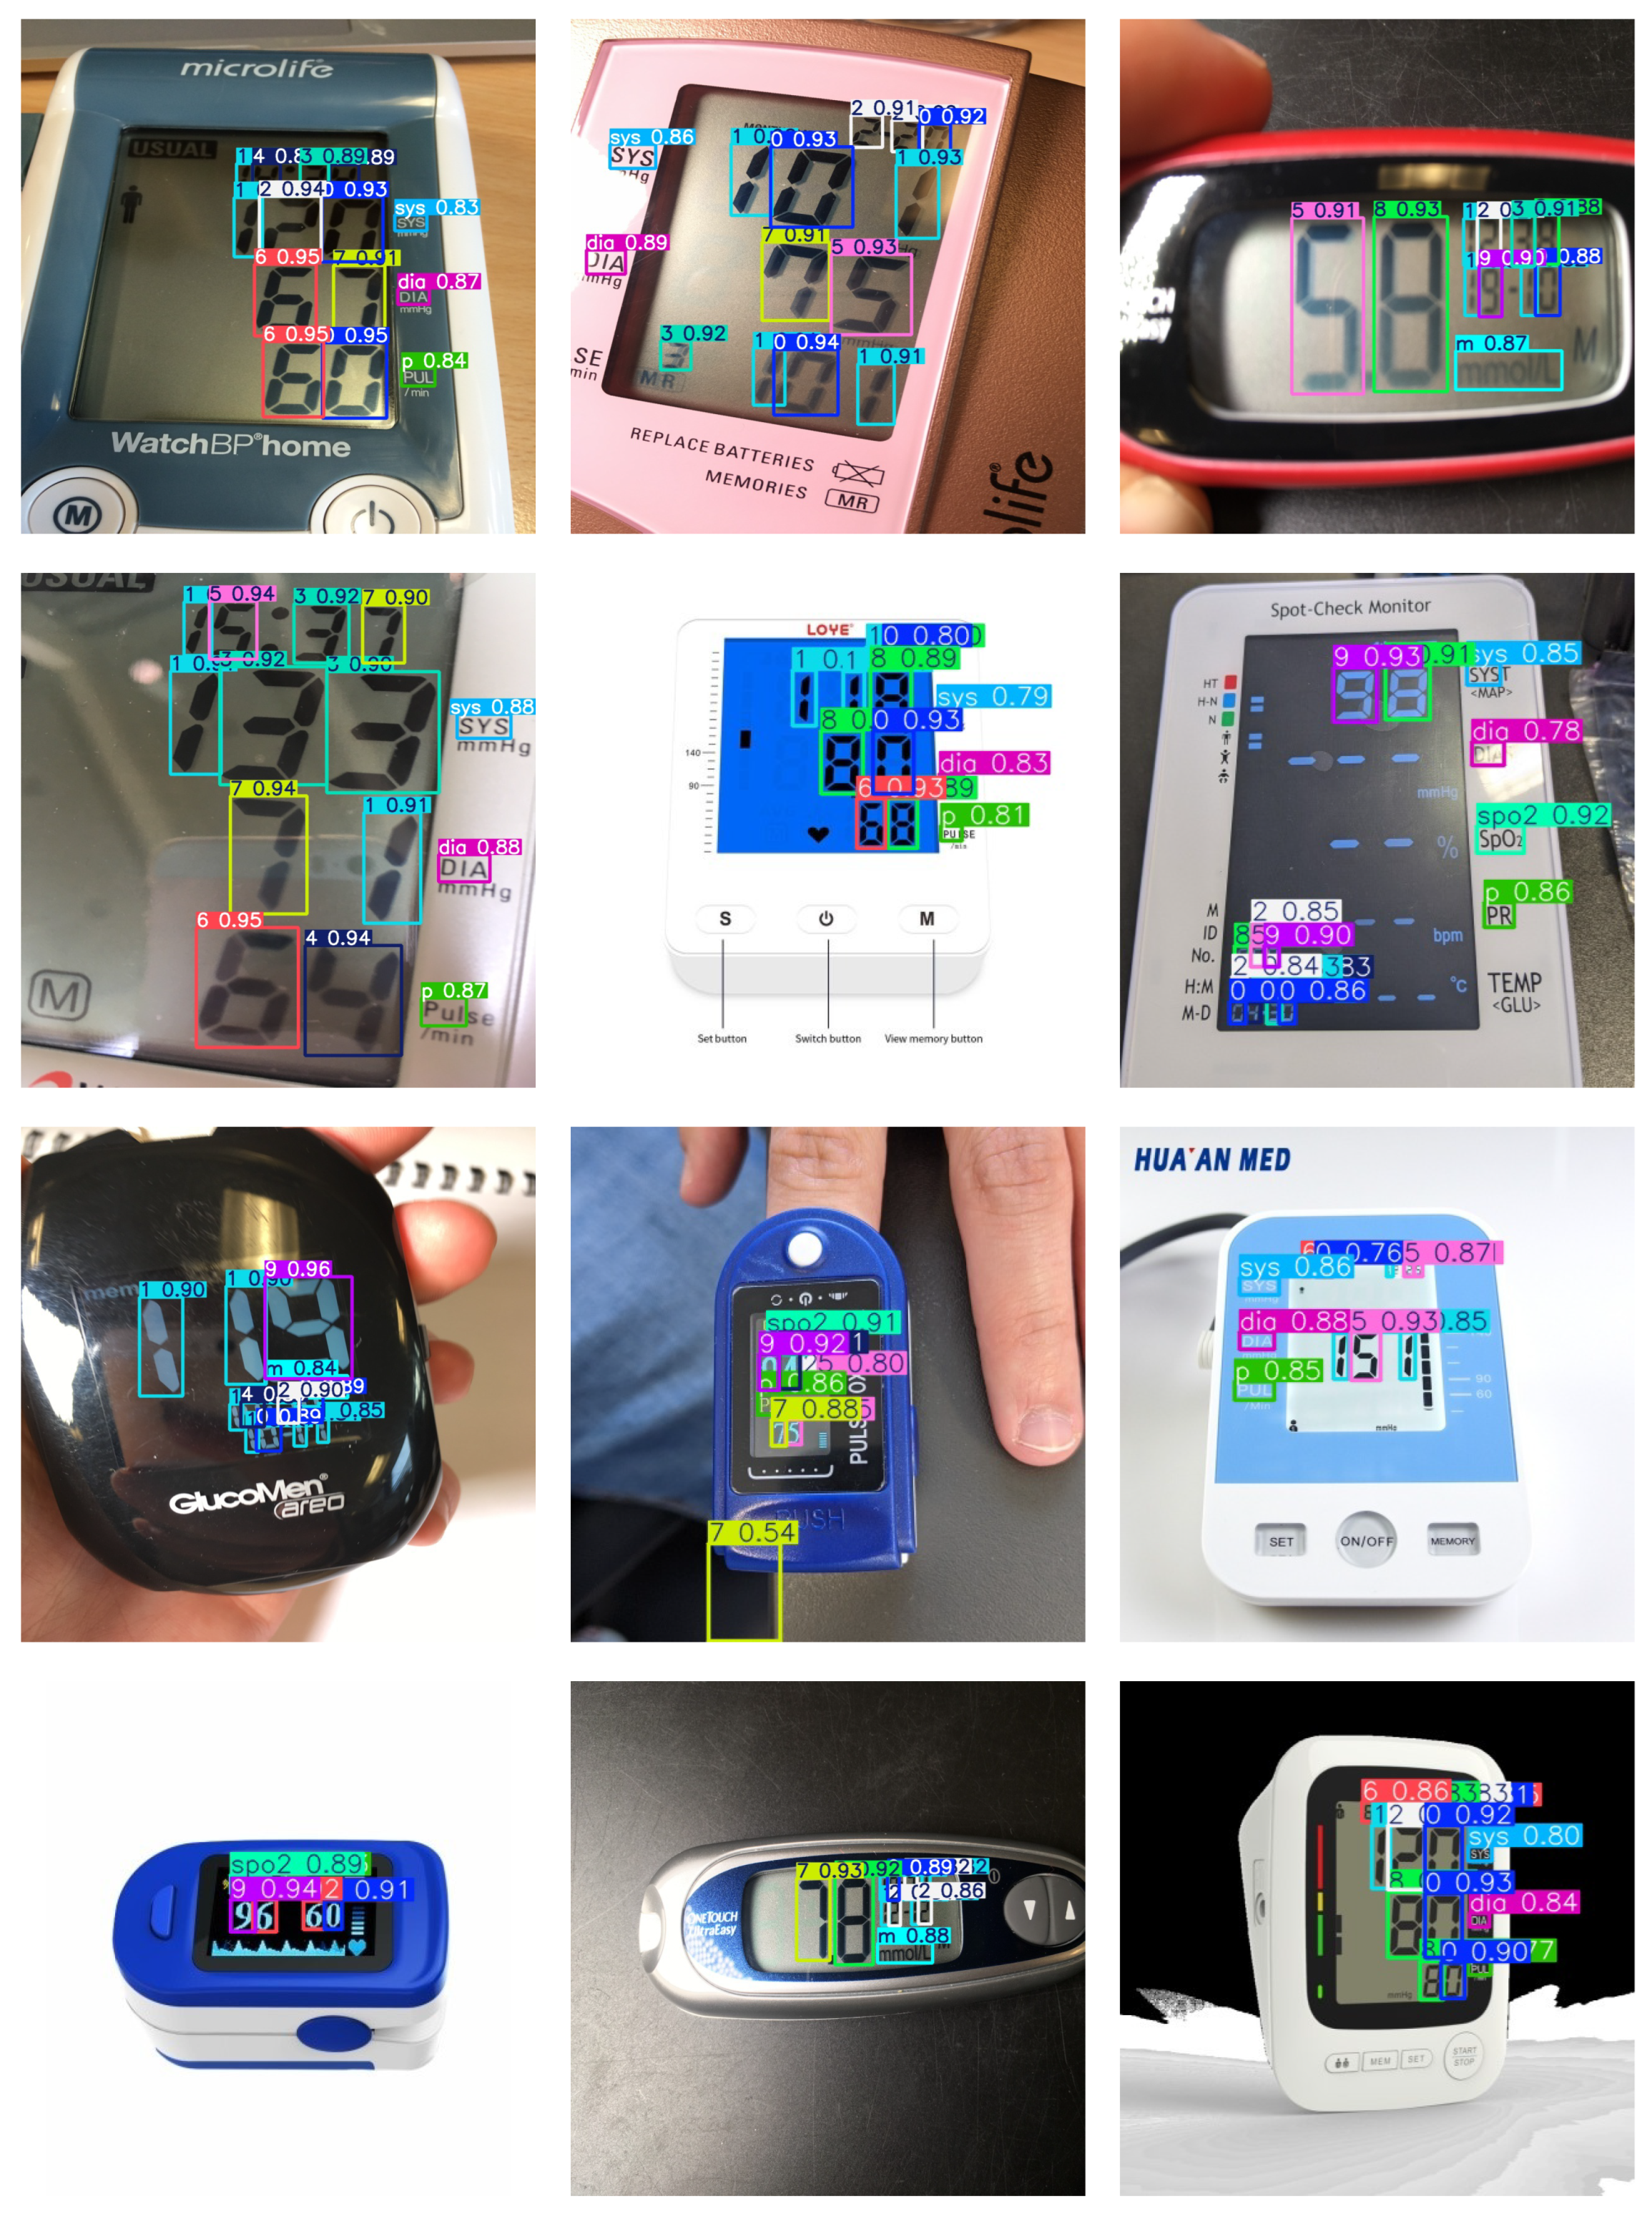
Finally,
Figure 7 provides a qualitative analysis showcasing some of the results obtained with the YOLOv8l (640) standalone model.
5. Discussion
The evaluation of YOLO and SSD models in this study provided key insights into their strengths and weaknesses in detecting and recognizing digits and acronyms on medical device displays.
Overall, the results demonstrate that the YOLO models, particularly YOLOv8l (640), exhibited superior performance in terms of mAP@50, precision, and recall when compared to the SSD MobileNet V2 FPNLite models. YOLOv8l (640) achieved the highest mAP@50 of 0.979, and strong class-wise performance for both digits and medical acronyms. The SSD (640) model performed relatively well for certain classes (e.g., class 4 with 0.902 precision and 0.933 recall), but it showed poorer performance compared to the YOLO models for other classes.
Analysis of the experimental results demonstrated a fundamental trade-off between detection accuracy and computational efficiency. While higher resolution (640 × 640) achieved the highest detection accuracy, it also came at the expense of higher inference time. For instance, YOLOv8n (320) offered the fastest performance at 129.79 FPS, making it a suitable option for real-time applications, but this was achieved at the cost of a lower mAP (0.786). Conversely, YOLOv8l (640), which achieved the highest mAP (0.979), had a much lower inference speed of 13.20 FPS, making it less suitable for real-time use cases where inference time is critical. This highlights the need to balance inference speed and detection performance depending on the application requirements. For real-time patient-monitoring systems where inference speed is crucial, a lighter model such as YOLOv8n may be more appropriate. However, in situations where detection accuracy is the priority, YOLOv8l (640) might be more suitable. To the extent of our knowledge, similar works did not report inference speed, computational efficiency, or frames per second (FPS), focusing solely on standard evaluation metrics for object detection models.
The comparison between the standalone YOLOv8l (640) model and the YOLOv8l with the CNN classifier provided additional insight into the classification component performance. The standalone model achieved a higher performance with an accuracy of 0.98. However, upon integrating the CNN classifier, a slight reduction in accuracy to 0.96 was observed, with some classes, such as class 5 and class 2, showing a noticeable drop in all metrics evaluated. For the other classes, the performance remained high or even improved, suggesting that integrating the CNN for classification may be beneficial in certain cases. Nevertheless, further optimization is required to avoid performance loss in specific classes. The analysis of the confusion matrices for both configurations (
Figure 5) reinforces these findings. The YOLOv8l standalone model demonstrated fewer misclassifications across almost all classes. In contrast, the combined YOLOv8l-CNN approach demonstrated increased confusion between classes, particularly for the visually similar digits ‘2’ and ‘5’. This may be due to the classifier’s sensitivity to subtle variations in seven-segment digit representations, as these digits can appear visually similar depending on display orientation.
The precision–recall (PR) curve for the YOLOv8l (640) model, shown in
Figure 6, demonstrates a consistently strong performance across all classes. The curves cluster tightly in the upper-right quadrant, reflecting that the model maintains high precision and recall under different threshold levels. The global mAP@50 across all classes reaches 0.981, confirming the model’s performance consistency and generalization capacity. In addition to quantitative metrics, a qualitative assessment was conducted to visually inspect some of the predictions made by the YOLOv8l (640) model. As shown in
Figure 7, the model accurately detects digits and acronyms across various medical devices and conditions. It handles differences in lighting, reflections, fonts, and orientations, demonstrating strong generalization.
Nevertheless, some performance bottlenecks were found. The study identified that visually similar digits, such as ’2’ and ’5’, present recognition challenges, particularly in the CNN-based classification, where minor variations in seven-segment structures led to increased misclassification. This suggests a limitation in the model’s ability to differentiate fine-grained features in small objects. Future improvements should focus on handling ambiguous characters more effectively and improving model robustness through a more realistic data augmentation process.
Overall, and looking at all results, this study suggests that YOLOv8l (640) achieved the highest detection accuracy under the given experimental conditions. However, it is important to note that these results were obtained using the specific dataset analyzed in this study, which reflects some controlled conditions and may not fully represent the variability encountered in real-world environments. Additionally, while YOLOv8l performs well in terms of precision and mAP@50, its inference speed is considerably slower than that of lighter models such as YOLOv8n. Therefore, its suitability may be limited in applications where real-time processing is a critical requirement. The comparative analysis highlights the trade-offs between accuracy and computational efficiency, indicating that model selection should be scenario dependent rather than based solely on peak detection performance. This study provides a foundation for the final smartphone application being researched in this project. Based on the findings, the most suitable model will be used in the next phase, which will include deployment and evaluation in real-world scenarios.
Building on these findings, future research will focus on developing models capable of capturing contextual relationships between the detected elements. Future models will not only detect and classify individual digits and acronyms but also integrate contextual awareness to directly associate these values with their corresponding medical parameters (e.g., systolic or diastolic blood pressure), reducing the need for extensive post-processing.
An additional consideration for future deployment is the integration of ethical safeguards, which was beyond the scope of this technical evaluation. As highlighted by Thurzo [
19], the increasing autonomy of AI systems in healthcare, especially when it operates with partial autonomy in diagnostic or monitoring tasks, introduces governance challenges that require transparency, accountability, and human oversight, which are not addressed by performance metrics alone. In line with these concerns, the concept of a “Trustworthy Ethical Firewall”, introduced by Thurzo [
20], proposes a layered architecture embedding mathematically provable ethical constraints into the AI’s decision-making core. This architecture ensures transparent, auditable decision-making, and incorporates escalation protocols to trigger human oversight in ambiguous or high-risk scenarios. Integrating such frameworks into medical AI systems could mitigate risks and promote trustworthiness, especially when AI agents are used for patient monitoring or diagnosis. Addressing these ethical aspects will ensure the safe and reliable deployment of the proposed future application.
6. Conclusions
This study conducted a comparative evaluation of several YOLO and SSD-based object detection models for the task of digit and acronym recognition on medical device displays. The results demonstrated that YOLOv8l (640) achieved the highest accuracy with an mAP@50 of 0.979, while lighter models such as YOLOv8n (320) obtained faster inference times (129.79 FPS) at the expense of accuracy (0.78). These findings underscore the importance of balancing performance metrics such as accuracy, speed, and model complexity. Rather than declaring a single optimal model, the results support that the model selection should be based on the operational constraints and priorities of specific deployment scenarios.
Furthermore, the comparison carried out in the classification component between the standalone YOLOv8l (640) and the hybrid approach that combines YOLOv8l (640) with a CNN-based classifier demonstrated that, despite a slight reduction in overall accuracy, certain classes benefited from the addition of the CNN.
Future work should extend this evaluation to include a more diverse and noisy dataset, incorporating real-world variability such as inconsistent lighting, device display differences, and user-related factors (e.g., angle, blur, or obstruction), and should also include a more comprehensive analysis of the trade-offs between multiple performance indicators. Additionally, research should explore lightweight and efficient models suitable for deployment on mobile or embedded hardware, where inference speed, memory usage, and power consumption are critical constraints.


