A Design of an Engine Speed Measurement System Based on Cigarette Lighter Signal Analysis in Vehicles


Abstract
1. Introduction
1.1. Research Background
1.2. Literature Review
1.2.1. Conventional Contact-Type Methods
1.2.2. Non-Contact Vibration Analysis Methods
1.2.3. Advanced Optical Measurement Methods
1.3. Contribution of This Study
2. Materials and Method
2.1. Materials
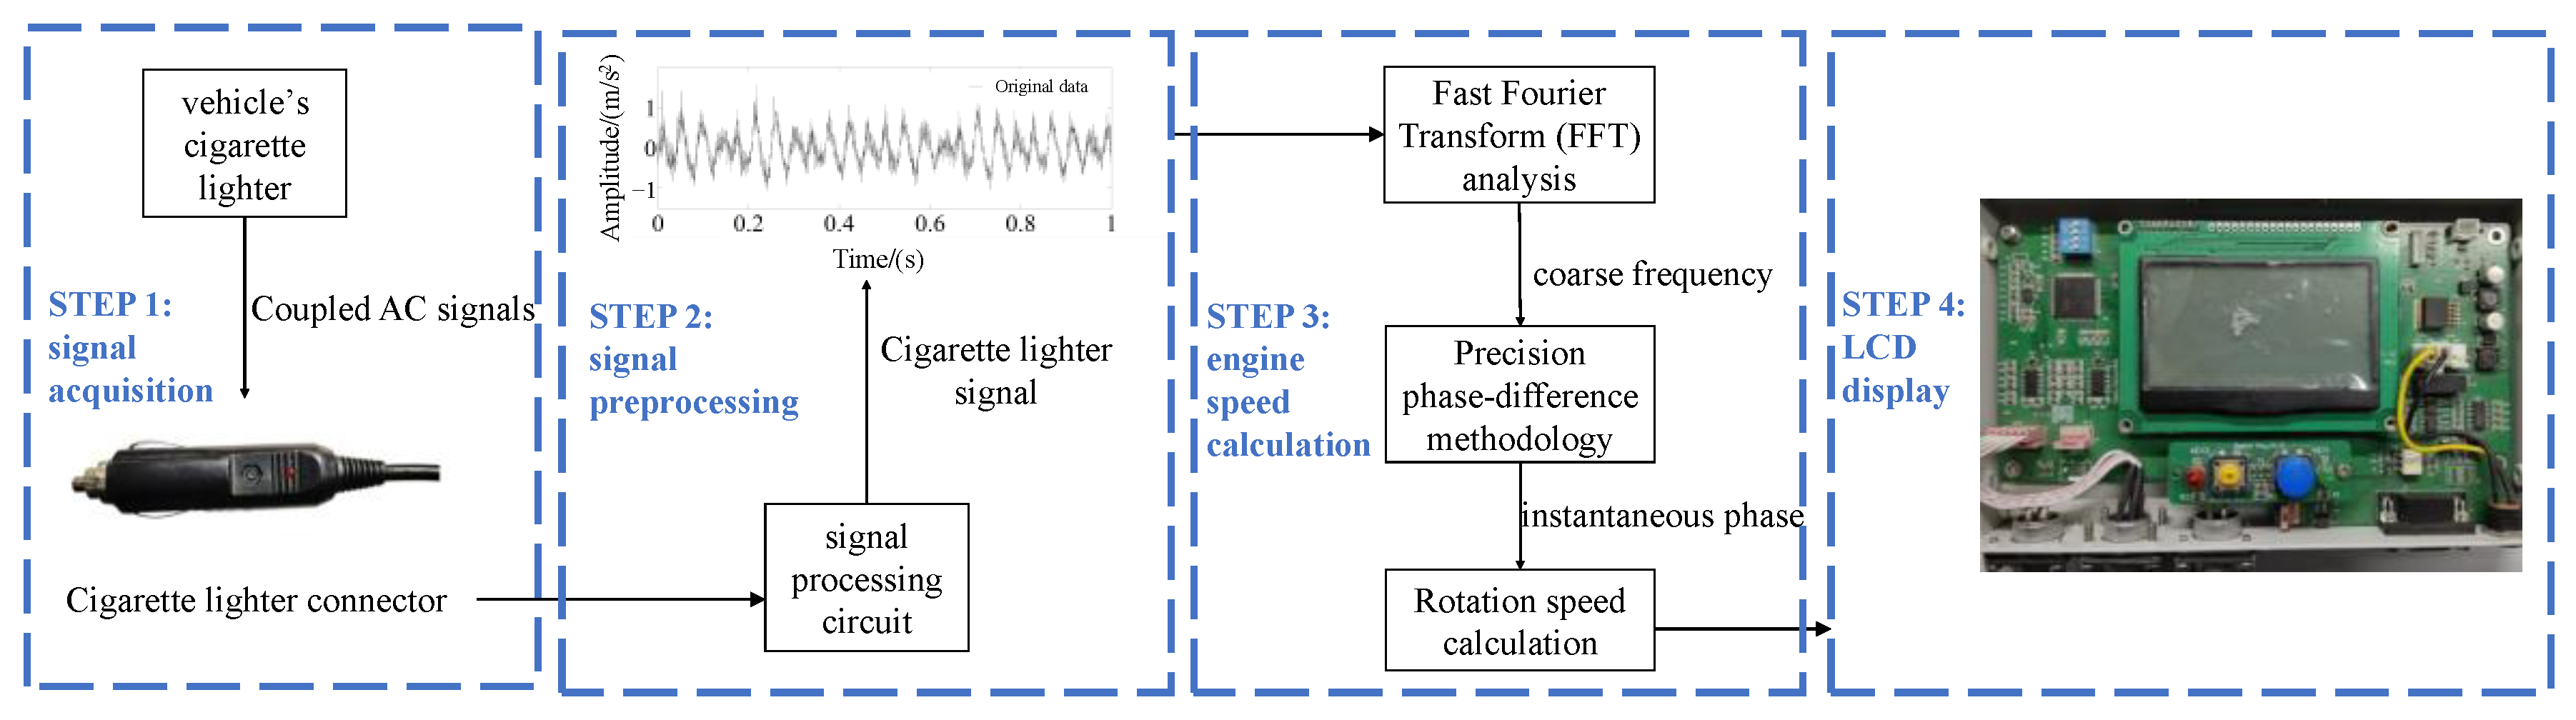
2.2. Method
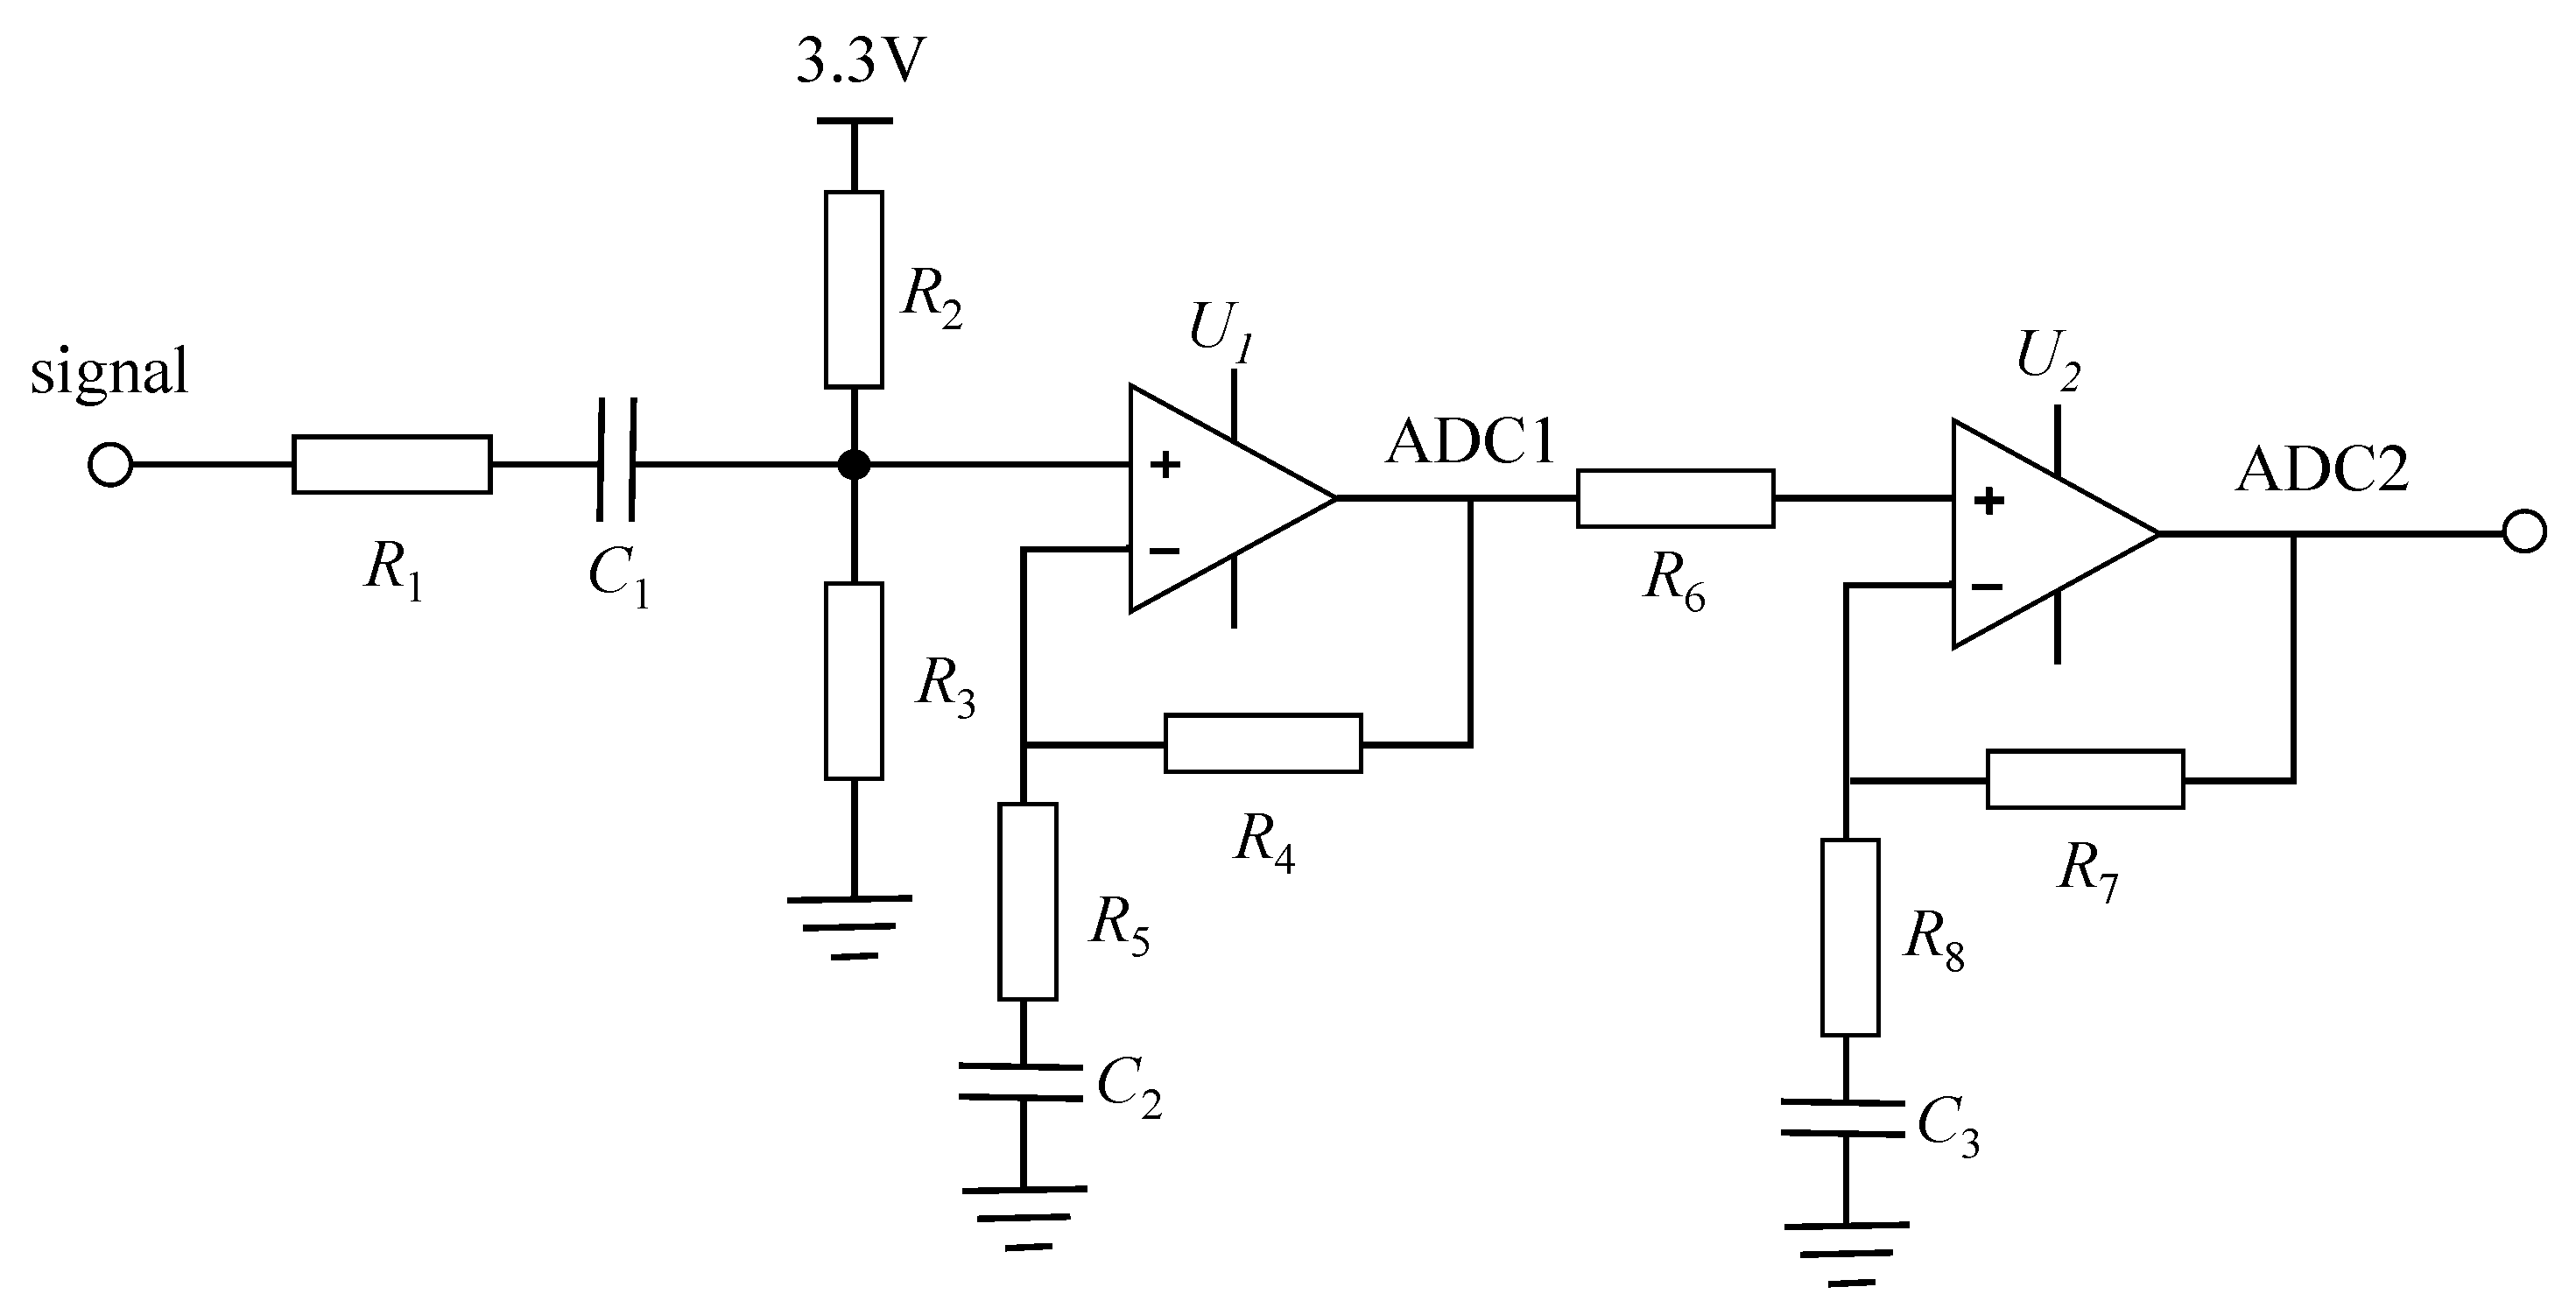
2.2.1. Signal Acquisition Circuit Design
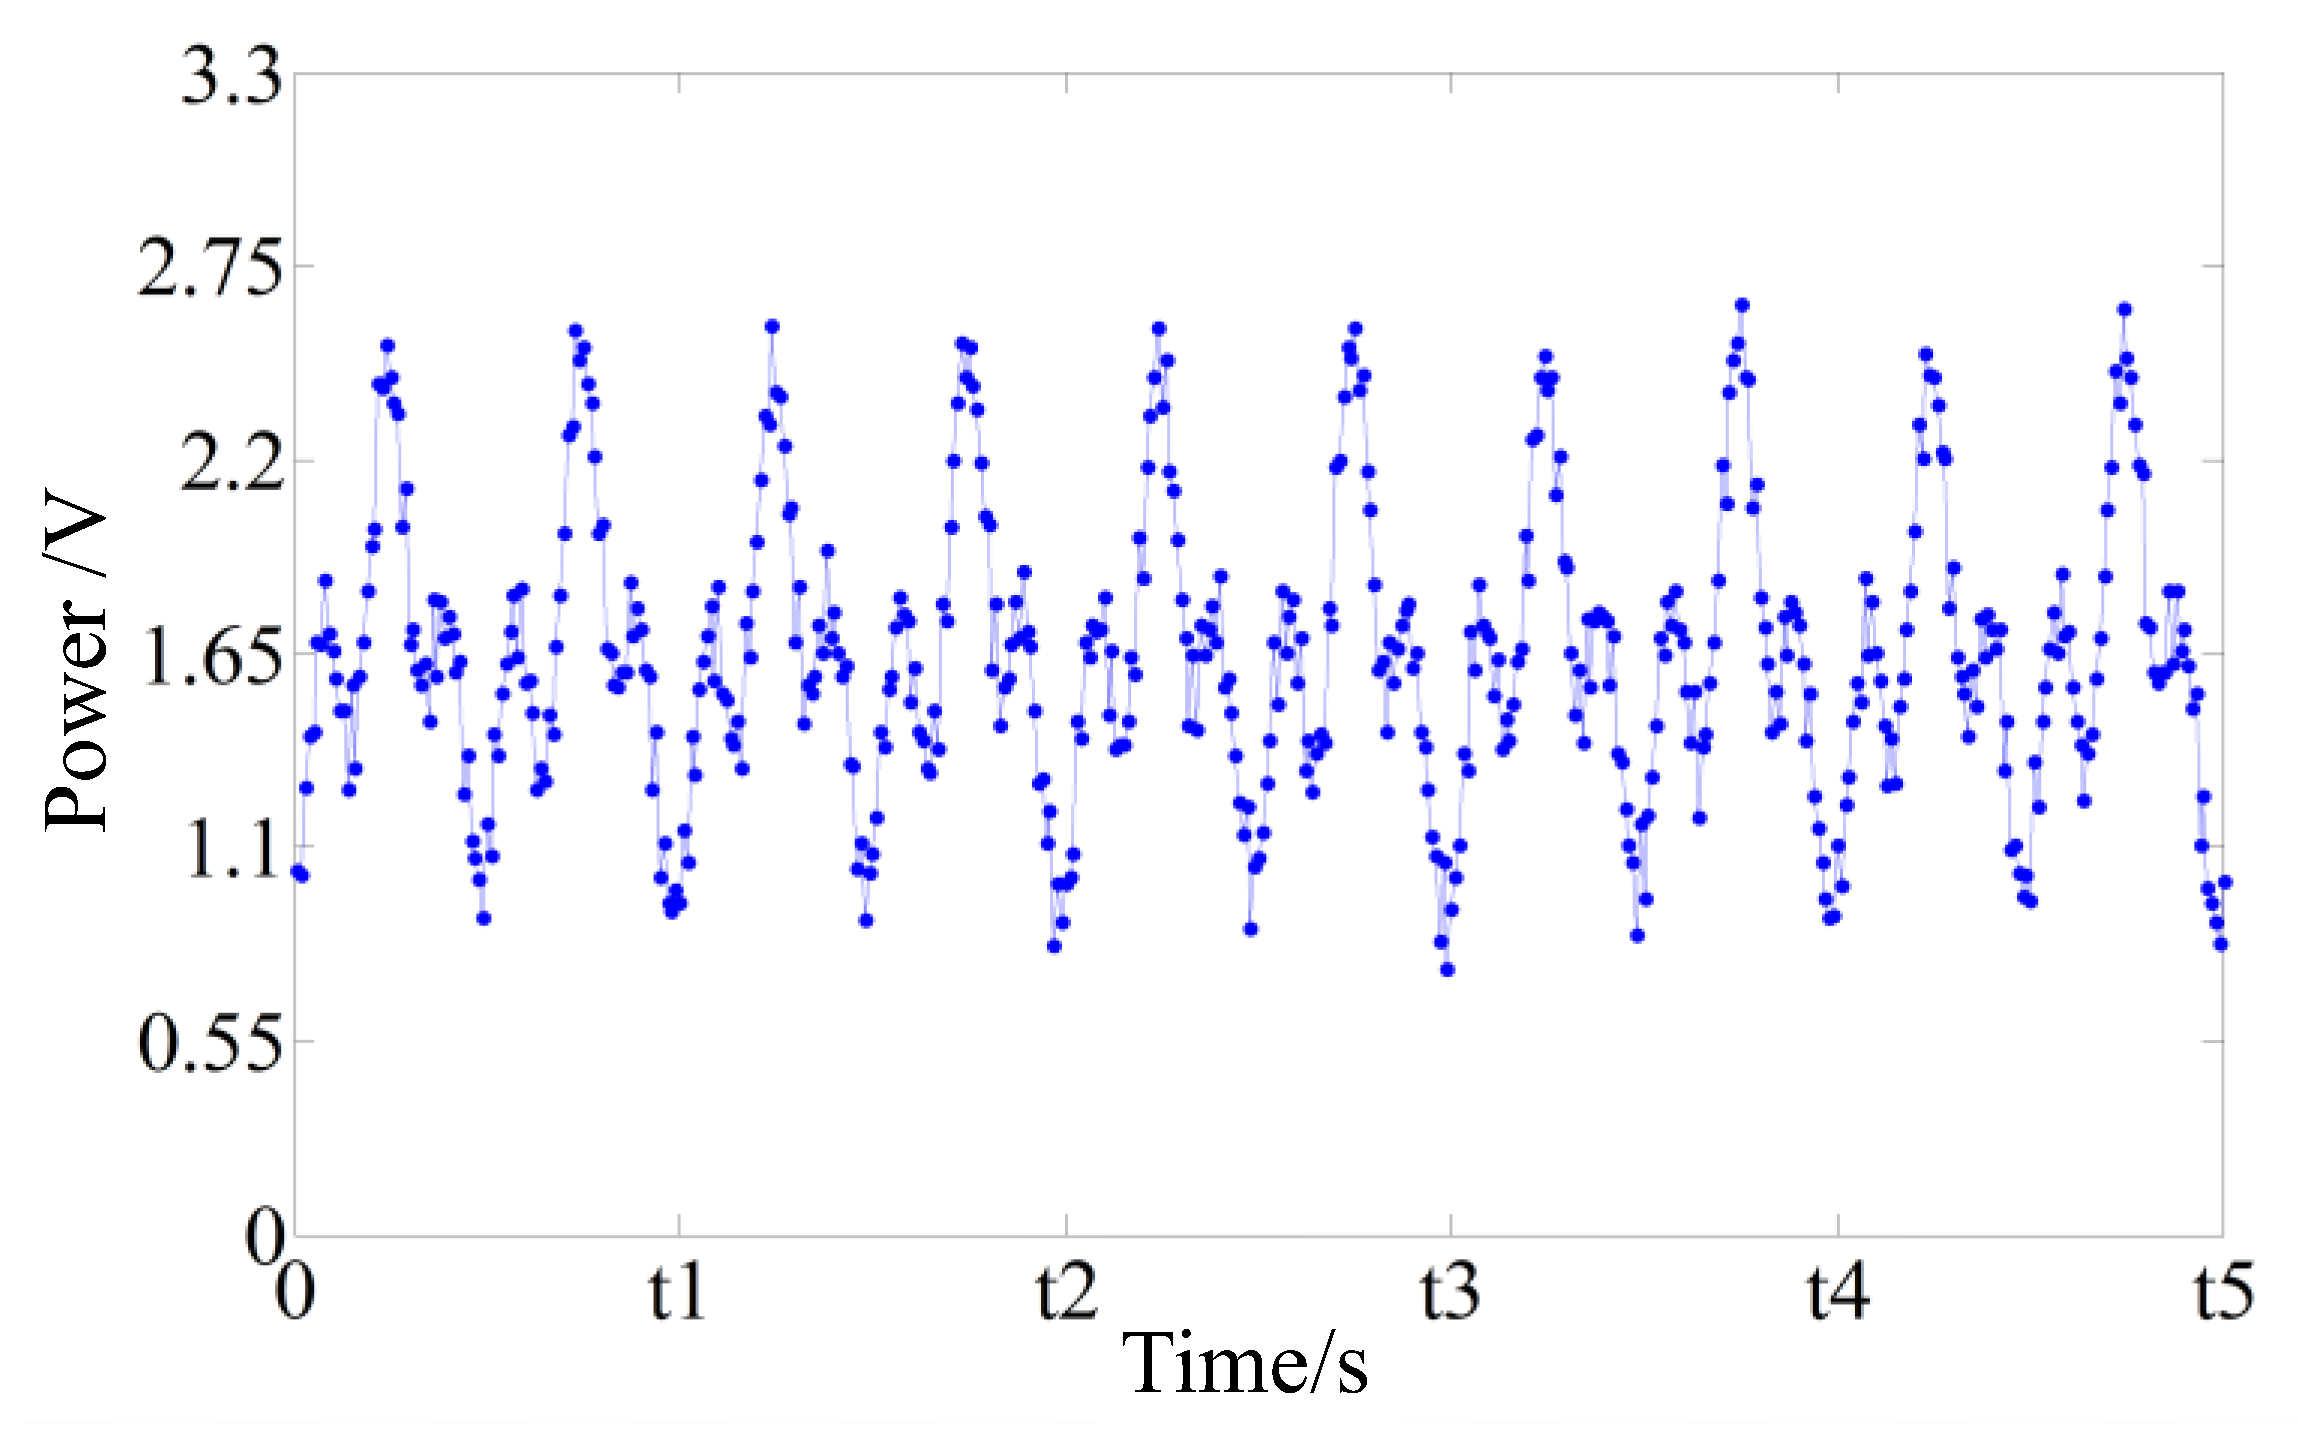
2.2.2. Signal Acquisition Program Design
2.2.3. Rotation Speed Calculation Method
FFT Accuracy Analysis
Phase-Difference Method Used to Analyze the Main Frequency
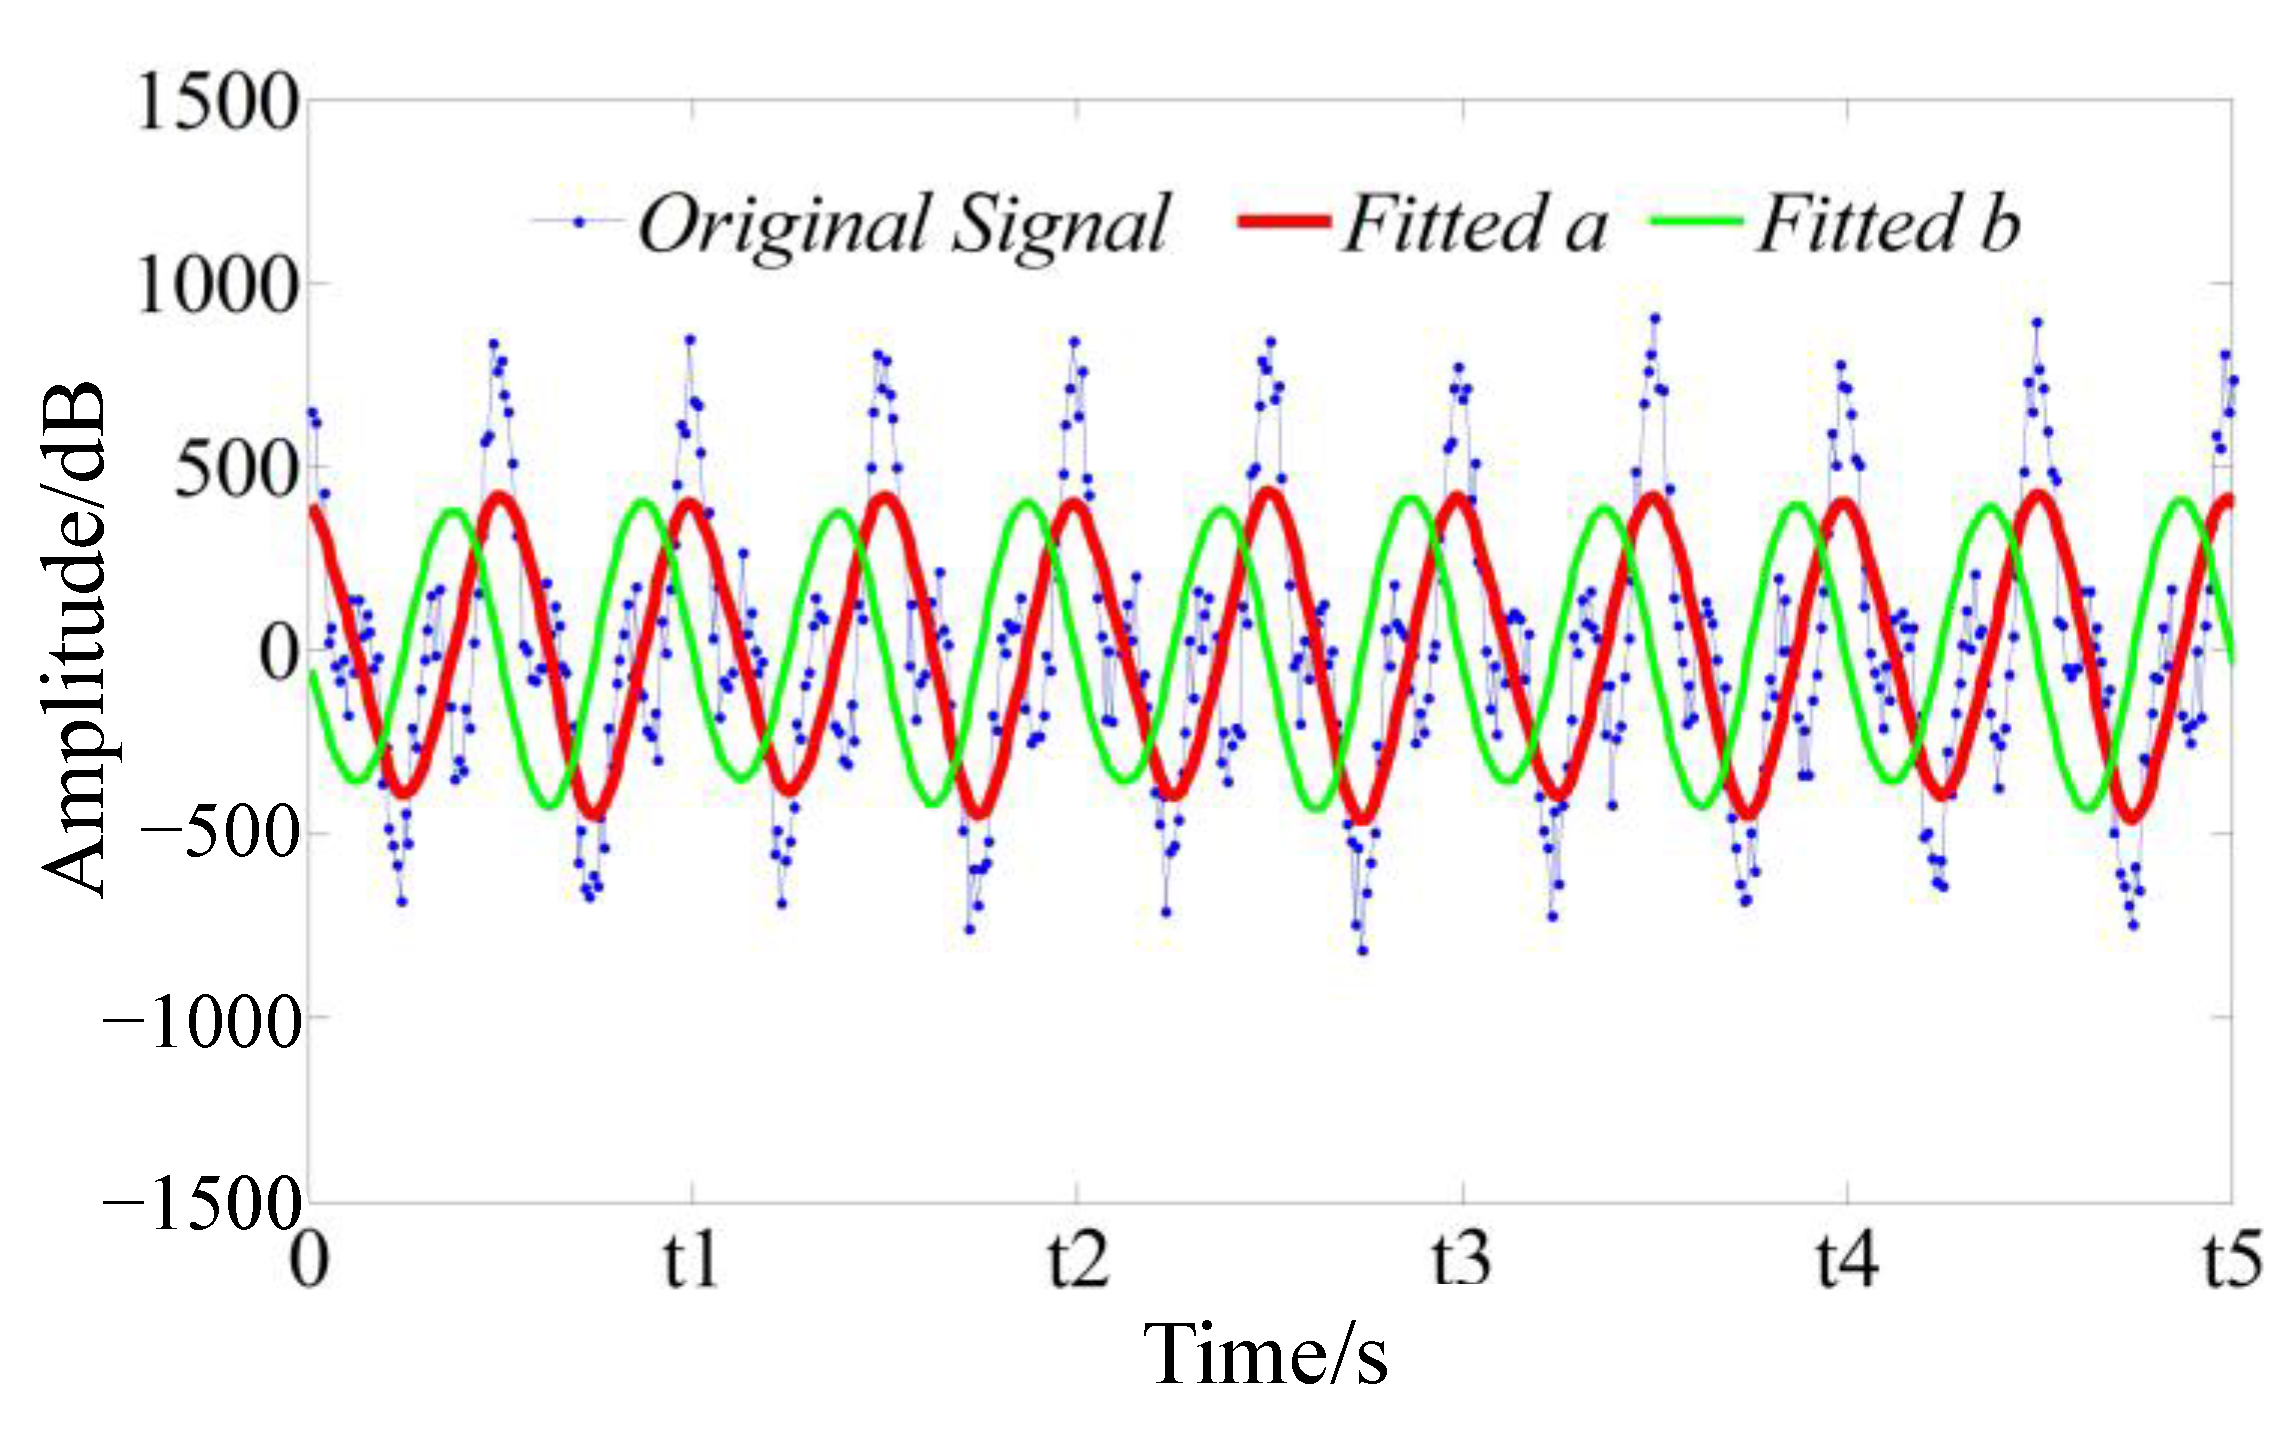
Sinusoidal Least-Squares Fitting Method
The Process of Calculating the Main Frequency Using the Phase Difference
3. Experiment and Results
3.1. Simulation Experiment
3.1.1. Simulation Experiment Results
3.1.2. Statistical Testing of Simulation Data
3.2. Real-Vehicle Testing
3.2.1. Real-Vehicle Test Results
3.2.2. Statistical Testing of Real-Vehicle Data
4. Discussion
4.1. Discussion of Findings
4.1.1. Discussion of Simulation Results
4.1.2. Discussion of Real-Vehicle Result
4.2. Research Gaps and Prospects
5. Conclusions
Author Contributions
Funding
Institutional Review Board Statement
Informed Consent Statement
Data Availability Statement
Conflicts of Interest
References
- Tao, K.; Zhao, Z.; Yang, Y.; Wu, J.; Li, Y.; Fan, K.; Fu, Y.; Chang, H.; Yuan, W. Development of bipolar-charged electret rotatory power generator and application in self-powered intelligent thrust bearing. Nano Energy 2021, 90, 106491. [Google Scholar] [CrossRef]
- Yang, H.; Liu, W.; Xi, Y.; Lai, M.; Guo, H.; Liu, G.; Wang, M.; Li, T.; Ji, X.; Li, X. Rolling friction contact-separation mode hybrid triboelectric nanogenerator for mechanical energy harvesting and self-powered multifunctional sensors. Nano Energy 2018, 47, 539–546. [Google Scholar] [CrossRef]
- Li, Z.M.; Chen, L.L.; Ren, Y.; Qiu, S.; Liu, T.; Wang, C.; Wang, H. Laser-based detection of rotation speed with high accuracy and high signal-to-noise ratio (SNR) based on the rotational Doppler effect. Lasers Eng. 2021, 50, 367–377. [Google Scholar]
- Shan, X.; Tang, L.; Wen, H.; Martinek, R.; Smulko, J. Analysis of vibration and acoustic signals for noncontact measurement of engine rotation speed. Sensors 2020, 20, 683. [Google Scholar] [CrossRef] [PubMed]
- Paramo-Balsa, P.; Roldan-Fernandez, J.M.; Burgos-Payan, M.; Riquelme-Santos, J.M. A low-cost non-intrusive method for in-field motor speed measurement based on a smartphone. Sensors 2021, 21, 4317. [Google Scholar] [CrossRef]
- Mu, J.; He, H.; Song, J.; He, J.; Hou, X.; Han, X.; Feng, C.; Zou, J.; Yu, J.; Chou, X. Functional structure enhanced synergistic sensing from triboelectric–electromagnetic hybrid nanogenerator for self-powered rotating speed monitoring. Energy Rep. 2022, 8, 5272–5283. [Google Scholar] [CrossRef]
- Mihm, T.N.; Yang, B.; Shepherd, J.J. Power laws used to extrapolate the coupled cluster correlation energy to the thermodynamic limit. J. Chem. Theory Comput. 2021, 17, 2752–2758. [Google Scholar] [CrossRef]
- Hasegawa, Y. Thermodynamic correlation inequality. Phys. Rev. Lett. 2024, 132, 087102. [Google Scholar] [CrossRef]
- Kilian, P.; Kohler, A.; Van Bergen, P.; Gebauer, C.; Pfeufer, B.; Koller, O.; Bertsche, B. Principle guidelines for safe power supply systems development. IEEE Access 2021, 9, 107751–107766. [Google Scholar] [CrossRef]
- Mukherjee, S. SAE J1939-Specific Cyber Security for Medium and Heavy-Duty Vehicles. Ph.D. Thesis, Colorado State University, Fort Collins, CO, USA, 2023. [Google Scholar]
- Wu, C.; Ding, H.; Han, L. Design of a centrifugal force-based speed sensor for downhole turbodrills. J. Sens. 2018, 2018, 3029181. [Google Scholar] [CrossRef]
- Liu, X.; Liu, C.; Pong, P.W.T. Velocity measurement technique for permanent magnet synchronous motors through external stray magnetic field sensing. IEEE Sens. J. 2018, 18, 4013–4021. [Google Scholar] [CrossRef]
- Sun, W.; Shen, J.-X.; Jin, M.-J.; Hao, H. A robust magnetic polarity self-sensing method for start up of PM synchronous machine in fanlike system. IEEE Trans. Ind. Appl. 2017, 53, 2169–2177. [Google Scholar] [CrossRef]
- Ferreira, F.J.T.E.; Duarte, A.F.F.; Lopes, F.J.P. Experimental evaluation of a novel webcam-based tachometer for in-situ rotational speed measurement. In Proceedings of the 2020 IEEE International Conference on Industrial Technology (ICIT), Buenos Aires, Argentina, 26–28 February 2020; IEEE: Piscataway, NJ, USA, 2020; pp. 917–924. [Google Scholar]
- Kazienko, D.; Chybowski, L. Instantaneous rotational speed algorithm for locating malfunctions in marine diesel engines. Energies 2020, 13, 1396. [Google Scholar] [CrossRef]
- Arif, S.J.; Asghar, M.S.J.; Sarwar, A. Measurement of Speed and Calibration of Tachometers Using Rotating Magnetic Field. IEEE Trans. Instrum. Meas. 2014, 63, 848–858. [Google Scholar] [CrossRef]
- Kepak, S.; Stolarik, M.; Nedoma, J.; Martinek, R.; Kolarik, J.; Pinka, M. Alternative Approaches to Vibration Measurement Due to the Blasting Operation: A Pilot Study. Sensors 2019, 19, 4084. [Google Scholar] [CrossRef] [PubMed]
- Nedoma, J.; Stolarik, M.; Kepak, S.; Pinka, M.; Martinek, R.; Frnda, J.; Fridrich, M. Alternative Approaches to Measurement of Ground Vibrations Due to the Vibratory Roller: A Pilot Study. Sensors 2019, 19, 5420. [Google Scholar] [CrossRef] [PubMed]
- Santacruz, M.; Felix, M.; Ocampo, J.; Luna, G. Vibration Frequency Peak Detection and Sorting Technique for Passenger Vehicles. In Proceedings of the 2013 IEEE International Instrumentation and Measurement Technology Conference, Minneapolis, MN, USA, 6–9 May 2013; pp. 1353–1357. [Google Scholar]
- Dandge, A.R. Low Cost Engine Monitoring System for Commercial Vehicles; SAE Technical Paper; SAE International: Warrendale, PA, USA, 2010. [Google Scholar]
- Wang, Y.; Wang, L.; Yan, Y. Rotational speed measurement through digital imaging and image processing. In Proceedings of the 2017 IEEE International Instrumentation and Measurement Technology Conference (I2MTC), Turin, Italy, 22–25 May 2017; IEEE: Piscataway, NJ, USA, 2017; pp. 1–6. [Google Scholar]
- Wodecki, J.; Stefaniak, P.; Obuchowski, J.; Wylomanska, A.; Zimroz, R. Combination of principal component analysis and time-frequency representations of multichannel vibration data for gearbox fault detection. J. Vibroeng. 2016, 18, 2167–2175. [Google Scholar] [CrossRef]
- Lindfors, M.; Hendeby, G.; Gustafsson, F.; Karlsson, R. IEEE Vehicle Speed Tracking Using Chassis Vibrations. In Proceedings of the 2016 IEEE Intelligent Vehicles Symposium, Gothenburg, Sweden, 19–22 June 2016; pp. 214–219. [Google Scholar]
- Ma, X.; Wang, H.; Li, M.; Ma, X.; Ye, L.; Song, Y.; Song, Y.; Zhu, L. Research on speed measurement signal denoising processing of laser Doppler vibrometer. Integr. Ferroelectr. 2021, 217, 11–26. [Google Scholar] [CrossRef]
- Wu, X.; Wang, Q.; Luo, Z.; Fang, M.; Cen, K. Experimental study of particle rotation characteristics with high-speed digital imaging system. Powder Technol. 2008, 181, 21–30. [Google Scholar] [CrossRef]
- Rothberg, S.J.; Allen, M.S.; Castellini, P.; Di Maio, D.; Dirckx, J.J.J.; Ewins, D.J.; Halkon, B.J.; Muyshondt, P.; Paone, N.; Ryan, T.; et al. An international review of laser Doppler vibrometry: Making light work of vibration measurement. Opt. Lasers Eng. 2017, 99, 11–22. [Google Scholar] [CrossRef]
- Li, Y.; Dieussaert, E.; Baets, R. Miniaturization of laser doppler vibrometers—A review. Sensors 2022, 22, 4735. [Google Scholar] [CrossRef] [PubMed]
- Chiariotti, P.; Rembe, C.; Castellini, P.; Allen, M. Laser doppler vibrometry measurements in structural dynamics. In Handbook of Experimental Structural Dynamics; Springer: Berlin/Heidelberg, Germany, 2020; pp. 1–45. [Google Scholar]
- Zhang, D.; Guo, J.; Lei, X.; Zhu, C. A high-speed vision-based sensor for dynamic vibration analysis using fast motion extraction algorithms. Sensors 2016, 16, 572. [Google Scholar] [CrossRef]
- Pan, X.; Yang, T.; Xiao, Y.; Yao, H.; Adeli, H. Vision-based real-time structural vibration measurement through deep-learning-based detection and tracking methods. Eng. Struct. 2023, 281, 115676. [Google Scholar] [CrossRef]
- Fu, Y.; Shang, Y.; Hu, W.; Li, B.; Yu, Q. Non-contact optical dynamic measurements at different ranges: A review. Acta Mech. Sin. 2021, 37, 537–553. [Google Scholar] [CrossRef]
- Rimpas, D.; Papadakis, A.; Samarakou, M. OBD-II sensor diagnostics for monitoring vehicle operation and consumption. Energy Rep. 2020, 6, 55–63. [Google Scholar] [CrossRef]
- Hong, L.; Qu, Y.; Dhupia, J.S.; Sheng, S.; Tan, Y.; Zhou, Z. A novel vibration-based fault diagnostic algorithm for gearboxes under speed fluctuations without rotational speed measurement. Mech. Syst. Signal Process. 2017, 94, 14–32. [Google Scholar] [CrossRef]
- Gildish, E.; Grebshtein, M.; Makienko, I. Vibration-based rotation speed estimation for Industrial IoT. Internet Things 2024, 25, 101024. [Google Scholar] [CrossRef]
- Di Napoli, M. Modeling and Experimental Characterization of Belt Drive Systems in Micro-Hybrid Vehicles. Ph.D. Thesis, Politecnico di Torino, Turin, Italy, 2018. [Google Scholar]
- Zhang, C.; Mousavi, A.A.; Masri, S.F.; Gholipour, G.; Yan, K.; Li, X. Vibration feature extraction using signal processing techniques for structural health monitoring: A review. Mech. Syst. Signal Process. 2022, 177, 109175. [Google Scholar] [CrossRef]
- Panic, S.; Petrović, V.; Drašković, S.; Kontrec, N.; Milojević, S. Performance Analysis of Hybrid Fso/Rf Communication System with Receive Diversity in the Presence of Chi-Square/Gamma Turbulence and Rician Fading. 2023. Available online: https://scidar.kg.ac.rs/handle/123456789/19785 (accessed on 7 May 2025).
- Kang, D.; Ming, X.; Xiaofei, Z. Phase difference correction method for phase and frequency in spectral analysis. Mech. Syst. Signal Process. 2000, 14, 835–843. [Google Scholar] [CrossRef]
- Tu, D.; Wang, B.; Liu, L. Automatic Recognition of FM Signals Based on FFT Spectrum Analysis. In Proceedings of the 2024 International Wireless Communications and Mobile Computing (IWCMC), Ayia Napa, Cyprus, 27–31 May 2024; IEEE: Piscataway, NJ, USA, 2024; pp. 668–672. [Google Scholar]
- Itoh, K. Analysis of the phase unwrapping algorithm. Appl. Opt. 1982, 21, 2470. [Google Scholar] [CrossRef]
- Harris, F.J. On the use of windows for harmonic analysis with the discrete Fourier transform. Proc. IEEE 2005, 66, 51–83. [Google Scholar] [CrossRef]
- Ramsden, E. Hall-Effect Sensors: Theory and Application; Elsevier: Amsterdam, The Netherlands, 2011. [Google Scholar]
- Yu, X.; Liu, Y.; Chen, W. Efficient phase-shift error compensation algorithm based on probability density function. Opt. Lasers Eng. 2022, 153, 107007. [Google Scholar] [CrossRef]
- Srinivasan, R.S.; Wood, K.L.; McAdams, D.A. Functional tolerancing: A design for manufacturing methodology. Res. Eng. Des. 1996, 8, 99–115. [Google Scholar] [CrossRef]
- Manin, L.; Michon, G.; Remond, D.; Dufour, R. From transmission error measurement to pulley–belt slip determination in serpentine belt drives: Influence of tensioner and belt characteristics. Mech. Mach. Theory 2009, 44, 813–821. [Google Scholar] [CrossRef]
- McMahan, B.; Moore, E.; Ramage, D.; Hampson, S.; Arcas, B.A.y. Communication-efficient learning of deep networks from decentralized data. In Proceedings of the 20th International Conference on Artificial Intelligence and Statistics (AISTATS) 2017, Ft. Lauderdale, FL, USA, 20–22 April 2017; pp. 1273–1282. [Google Scholar]
- Rigatos, G.; Tzafestas, S. Extended Kalman filtering for fuzzy modelling and multi-sensor fusion. Math. Comput. Model. Dyn. Syst. 2007, 13, 251–266. [Google Scholar] [CrossRef]
- Warden, P.; Situnayake, D. Tinyml: Machine Learning with Tensorflow Lite on Arduino and Ultra-Low-Power Microcontrollers; O’Reilly Media: Sebastopol, CA, USA, 2019. [Google Scholar]


| Category | Proposed System | Conventional Contact-Type [13] | OBD-II Based Tools [32] | Vibration-Based Non-Contact [33] |
|---|---|---|---|---|
| Main Processor | STM32F407VGT6 (ARM Cortex-M4, 168 MHz; sourced from Shenzhen JLCPCB Technology Development Co., Ltd., Shenzhen, China) | Dedicated sensor module (e.g., Hall-effect ICs, Allegro MicroSystems, Worcester, MA, USA) | Commercial OBD scanner (e.g., ELM327, 8-bit MCU, Microchip Technology Inc., Chandler, AZ, USA) | DSP processors (e.g., TI C2000, 120 MHz, Texas Instruments, Dallas, TX, USA) |
| Key Parameters | 12-bit ADC, 5 kHz sampling | 10-bit ADC, 500 Hz sampling | CAN bus decoding (250 kbps) | 16-bit ADC, 5 kHz sampling |
| Signal Conditioning | Custom circuit (Altium-designed 2018, <10 Mv pp noise) | Passive RC filters | OBD (v2.4.7, SAE J1979-compliant, ELM327 chipset, Texas Instruments, USA) signal passthrough (no conditioning) | IEPE accelerometers(PCB Piezotronics, Depew, NY, USA) + charge amplifiers |
| Power Supply | Isolated LM2596-5V + AMS1117-3.3V (decoupled from vehicle power) | Vehicle battery (12 V direct) | Vehicle battery (risk of ground loops) | External LiPo packs (portable but limited runtime, Shenzhen Grepow Battery Co., Ltd., Shenzhen, China) |
| Software | Keil uVision5 (FFT + phase compensation in C) | Vendor-specific firmware v1.2.3 (Custom OBD-II Protocol) (closed-source,) | Proprietary OBD app ELM327 v2.4.7 (SAE J1979-compliant) (e.g., Torque Pro) | MATLAB R2023a (MathWorks, Natick, MA, USA)/Python 3.9.7 (CPython, Open-Source) post-processing (offline) |
| Display | LabWindows/CVI 2023 (real-time visualization) | Mechanical dial gauges | Smartphone/tablet via Bluetooth | PC-based DAQ systems (e.g., NI LabVIEW, National Instruments, Austin, TX, USA) |
| Installation | Plug-and-play (cigarette lighter interface) | Mechanical coupling (crankshaft disassembly required) | OBD-II v2.4.7 (SAE J1979-compliant, ELM327 chipset, Texas Instruments, USA) port connection | Surface mounting (adhesive sensors) |
| Key Advantages | Non-invasive, real-time (±10 ms latency), low cost | High accuracy (±0.2%) in steady-state | Protocol standardization (SAE J1979) | Low-invasive |
| Limitations | Dependent on alternator correlation model | Mechanical wear, invasive installation | Limited to OBD-compliant vehicles, no raw signal access | Environmental noise sensitivity, high computational latency (>200 ms) |
| Typical Cost | Low | High (sensor + installation) | moderate | high (DAQ + sensors) |
| Metric | Value | Threshold | Compliance |
|---|---|---|---|
| Mean | 2048.2 | - | - |
| Skewness (γ1) | 0.15 | [−0.5, +0.5] | Yes |
| Kurtosis (γ2) | −0.82 | [−1.0, +1.0] | Yes |
| Outliers Detected | 3.2% | <5% | Yes |
| Shapiro–Wilk p-value | 0.062 | >0.05 | Yes (marginally) |
| Actual Speed/(r/min) | Calculated/(r/min) | Asolute Error/(%) |
|---|---|---|
| 800 | 801 | 0.13 |
| 1200 | 1196 | 0.33 |
| 1500 | 1505 | 0.33 |
| 2000 | 1992 | 0.4 |
| Metric | Value | Threshold | Compliance |
|---|---|---|---|
| Mean | 2069.4 | - | - |
| Skewness (γ1) | +0.65 | [−0.5, +0.5] | Yes |
| Kurtosis (γ2) | −0.42 | [−1.0, +1.0] | Yes |
| Outliers Detected | 4.5% | <5% | Yes |
| Shapiro–Wilk p-value | 0.028 | >0.05 | No |
Disclaimer/Publisher’s Note: The statements, opinions and data contained in all publications are solely those of the individual author(s) and contributor(s) and not of MDPI and/or the editor(s). MDPI and/or the editor(s) disclaim responsibility for any injury to people or property resulting from any ideas, methods, instructions or products referred to in the content. |
© 2025 by the authors. Licensee MDPI, Basel, Switzerland. This article is an open access article distributed under the terms and conditions of the Creative Commons Attribution (CC BY) license (https://creativecommons.org/licenses/by/4.0/).
Share and Cite
Li, X.; Wang, X.; Yin, J.; Liu, D.; Zhai, Z. A Design of an Engine Speed Measurement System Based on Cigarette Lighter Signal Analysis in Vehicles. Appl. Sci. 2025, 15, 5387. https://doi.org/10.3390/app15105387
Li X, Wang X, Yin J, Liu D, Zhai Z. A Design of an Engine Speed Measurement System Based on Cigarette Lighter Signal Analysis in Vehicles. Applied Sciences. 2025; 15(10):5387. https://doi.org/10.3390/app15105387
Chicago/Turabian StyleLi, Xuelian, Xuanze Wang, Jinping Yin, Da Liu, and Zhongsheng Zhai. 2025. "A Design of an Engine Speed Measurement System Based on Cigarette Lighter Signal Analysis in Vehicles" Applied Sciences 15, no. 10: 5387. https://doi.org/10.3390/app15105387
APA StyleLi, X., Wang, X., Yin, J., Liu, D., & Zhai, Z. (2025). A Design of an Engine Speed Measurement System Based on Cigarette Lighter Signal Analysis in Vehicles. Applied Sciences, 15(10), 5387. https://doi.org/10.3390/app15105387