Article

Posture Detection of Passengers’ Movement When Boarding and Alighting an Urban Bus: A Pilot Study in Valparaíso, Chile

1
Escuela de Ingeniería Eléctrica, Pontificia Universidad Católica de Valparaíso, Valparaíso 2362804, Chile
2
Escuela de Ingeniería de Construcción y Transporte, Pontificia Universidad Católica de Valparaíso, Valparaíso 2362804, Chile
*
Author to whom correspondence should be addressed.
Appl. Sci. 2025, 15(10), 5367; https://doi.org/10.3390/app15105367
Submission received: 7 April 2025 / Revised: 1 May 2025 / Accepted: 7 May 2025 / Published: 12 May 2025
(This article belongs to the Special Issue New Insights into Computer Vision and Graphics)

Abstract

This study presents an artificial intelligence-based approach for the pose detection of passengers’ skeletons when boarding and alighting from an urban bus in Valparaíso, Chile. Using the AlphaPose pose estimator and an activity recognition model based on Random Forest, video data were processed to analyze the poses and activities of passengers. The results obtained allow for an evaluation of safety and ergonomics in public transportation, providing valuable information for improving design and accessibility in buses. This approach not only enhances understanding of passenger behavior but also contributes to the optimization of bus systems to accommodate diverse needs, ensuring a safer and more comfortable environment for all users. AlphaPose accurately estimates the posture of passengers, offering insights into their movements when interacting with the bus. In addition, the Random Forest model recognizes a variety of activities, from walking to sitting, helping to analyze how passengers interact with the space. The analysis helps identify areas where improvements can be made in terms of accessibility, comfort, and safety, contributing to the overall design of public transport systems. This study opens up new possibilities for AI-driven urban transportation analysis and can serve as a foundation for future improvements in transportation planning.

1. Introduction

Public transportation plays a crucial role in facilitating urban mobility, offering an efficient and eco-friendly alternative to private vehicles. It connects people to their workplaces, schools, healthcare facilities, and recreational spaces, contributing to the overall functioning of a city. However, while the system itself may be well established in many urban centers, significant challenges remain in ensuring that passengers can board and alight from buses safely and comfortably [1].
One of the primary issues is the inadequate infrastructure surrounding bus stops and stations [2]. Poorly designed or maintained bus stops can present obstacles such as uneven pavement, lack of proper ramps, or insufficient lighting, making it difficult for passengers, particularly those with disabilities or mobility impairments, to access the bus. These conditions can create hazardous situations where individuals may trip, fall, or struggle to board in a timely manner, increasing the risk of accidents [3].
The design of the buses themselves can also contribute to safety concerns [4,5]. Many older buses or those lacking modern updates may have high steps or narrow doorways that make it challenging for people with limited mobility, such as the elderly or those using wheelchairs or crutches, to enter or exit. Additionally, the interior layout of buses might not offer enough space for people with mobility aids or seated passengers, further exacerbating the difficulty for individuals to navigate the vehicle.
Inadequate communication about the bus’s arrival or expected stops can also add to the problem, particularly in situations where passengers have limited time to board or disembark [6]. This creates a scenario where people may rush to get on or off, increasing the risk of injury.
Addressing these issues requires a comprehensive analysis of passenger behavior to ensure that those who require assistance are provided with the support they need. To do so, artificial intelligence is required to make public transportation safer and more inclusive, helping to ensure that all passengers, regardless of age or physical ability, have equal access to the benefits of urban transit systems.
To address the above-mentioned issues, various methodologies based on artificial intelligence have been implemented. One of these is posture detection, which, through artificial intelligence, has been widely used in different contexts, such as public transport environments. AlphaPose is one of the most accurate tools for human pose estimation, while classification algorithms like Random Forest have proven to be effective in recognizing human activities based on pose data [7].
AlphaPose is a deep learning model capable of estimating the pose of multiple individuals in complex environments, such as trains, buses, and public spaces [8]. AlphaPose takes RGB images and/or videos as input and performs the pose estimation of each person present in the image using a pre-trained model (the COCO dataset). The output includes the X and Y coordinates in the image plane of 17 key points or joints, along with the confidence index of detection for each key point. Finally, these 17 points are connected to form a skeleton representing the posture of the person or people present in each RGB image. AlphaPose outputs a .json file containing the pose estimation for each person in the image. For each individual, there are 51 features per image (17 × (2 + 1)).
For this study, AlphaPose was used to extract the coordinates of the body joints of passengers in the captured videos, and thereby analyze the movement of each passenger, which is the aim of this research. The data obtained include the positions of the head, torso, and limbs, which are then used as feature vectors for the activity recognition model (see Figure 1).

2. Literature Review

The movement of passengers plays a crucial role in understanding and evaluating the overall service level in public transportation systems. This topic is particularly important for transportation planners, operators, and policymakers, as it directly impacts efficiency, user experience, and overall system effectiveness [9].
Passenger movement refers not only to the physical movement within a transit system but also to how passengers interact with different elements of the transportation network, such as routes, schedules, stations, and the vehicles themselves. Understanding these behaviors can help identify bottlenecks, optimize routes, improve safety, and enhance comfort [10].
Several factors can influence passenger behavior, with fare systems and bus design being two key elements. Fare structures, for example, can directly affect how passengers make decisions about their travel, such as whether they use the service regularly, whether they choose more expensive or less frequent routes, or even how they manage their travel time. A fare system that is complicated, costly, or not well understood may discourage passengers from using public transportation, ultimately leading to reduced system efficiency and increased congestion on certain routes [11].
Similarly, the design of buses or other forms of transportation also plays a vital role in shaping passenger movement [12]. Factors such as seating arrangements, standing space, ease of entry and exit, accessibility for disabled passengers, and the overall comfort of the vehicle can influence how passengers behave. A poorly designed bus can lead to crowding, delays, or uncomfortable conditions, which can deter people from using public transport or reduce the quality of the experience for those who do [13].
In addition to these elements, other factors such as station design [14,15], real-time information systems [16], service frequency and capacity [17], and the level of safety and security [18] can further shape passenger behavior. For instance, well-designed stations with clear signage and easy access can reduce confusion and enhance the flow of passengers, whereas delays in services or inadequate safety measures might prompt passengers to seek alternative travel options, undermining the effectiveness of the public transport system.
Understanding the movement of passengers within the context of service-level analysis is essential for improving the quality and efficiency of public transportation. By considering all these influencing factors, cities and transit authorities can create systems that better meet the needs of their passengers, encouraging greater use of public transport, reducing congestion, and contributing to a more sustainable and efficient transportation network. To do so, artificial intelligence (AI) is required [19]. The integration of video surveillance and advanced technologies powered by AI in public transportation systems offers significant opportunities for improving service efficiency, passenger safety, and the overall management of transit networks. By leveraging AI-driven video analysis, transportation authorities can detect and track passengers in real time across various transportation environments, providing valuable insights into how individuals interact with the system [20].
One of the key benefits of using video and AI technologies is the ability to analyze passenger behavior in complex and dynamic situations, such as when passengers are boarding or alighting from an urban bus. These moments are often critical for understanding traffic flow, crowd management, and operational efficiency. For example, AI systems can automatically detect the number of passengers waiting at a bus stop, monitor how they board the vehicle, and track how long it takes for them to enter and exit. These data can then be used to identify patterns in passenger movement, such as peak travel times, delays caused by overcrowding, or inefficiencies in the boarding process [21].
Additionally, AI technologies can help improve safety by detecting potentially hazardous behaviors or situations, such as passengers who may be obstructing doors, failing to follow safety protocols, or engaging in disruptive activities. Real-time alerts can be generated to inform bus drivers or transit operators about these issues, allowing for prompt intervention and ensuring a safer experience for all passengers [22].
Another important application of AI in public transportation is its ability to facilitate predictive analysis. By analyzing historical video data, AI systems can predict future passenger behavior, helping transportation authorities optimize bus schedules, allocate resources more effectively, and even improve the design of vehicles or stations to better meet the needs of passengers. For instance, AI can predict when a bus is likely to experience overcrowding, enabling transit authorities to adjust service frequencies or send additional buses during high-demand periods. Moreover, the use of video and AI technologies can support the development of more efficient transportation systems by providing insights into passenger preferences and habits [23]. Understanding how passengers move through a bus, how long they spend in particular areas, and where congestion typically occurs can help design better boarding processes, improve the placement of doors or seating, and reduce the overall time spent at each stop.
In the broader context of smart cities and connected transport systems, the combination of video and AI technologies allows for a more data-driven approach to urban planning. These tools enable continuous monitoring of transit networks, which can lead to ongoing improvements based on real-time data, ensuring that public transportation is more responsive to passenger needs and can adapt more quickly to changing circumstances [24,25].
In conclusion, the use of video and AI technologies in public transportation not only enhances operational efficiency and safety but also provides invaluable insights into passenger behavior. By enabling the analysis of complex interactions like boarding and alighting, these technologies contribute to the development of more efficient, responsive, and passenger-friendly transit systems.
Recent studies have explored deep learning techniques for posture and activity recognition, including convolutional neural networks (CNNs) for spatial feature extraction, recurrent neural networks (RNNs) such as LSTMs for temporal modeling, and graph convolutional networks (GCNs) applied to skeletal structures. These methods offer high accuracy but often require large annotated datasets and high computational resources. Our study, by contrast, uses a classical model, Random Forest, as a robust baseline to validate pose-based recognition pipelines in uncontrolled, real-world public transport scenarios—an essential step before deploying more advanced models in future work.
The Random Forest (RF) algorithm is a supervised ensemble learning method composed of multiple decision trees. Each tree is trained on a random subset of the dataset and a random subset of the input features (a technique known as “bagging”). During inference, each tree casts a vote for the predicted class, and the final prediction is made by majority voting. This ensemble mechanism improves generalization, reduces overfitting, and increases robustness to noise. Figure 2 illustrates the Random Forest algorithm. Each input sample is processed through multiple decision trees trained on random subsets of the data. The final predicted class is obtained by majority voting among the outputs of all trees. This ensemble approach increases robustness, reduces overfitting, and improves generalization in noisy environments.
Mathematically, each tree in the forest splits the feature space by optimizing a criterion such as the Gini impurity or entropy, recursively partitioning the data until a stopping condition is met (e.g., minimum number of samples per leaf). RF handles high-dimensional data well and is particularly effective when features (like body joint coordinates) have complex, non-linear interactions. This makes RF a strong candidate for interpreting skeletal pose data extracted from human motion.

3. Methodology

Figure 3 illustrates the complete workflow of the proposed human activity recognition system in the context of public transportation. The process consists of four main stages:
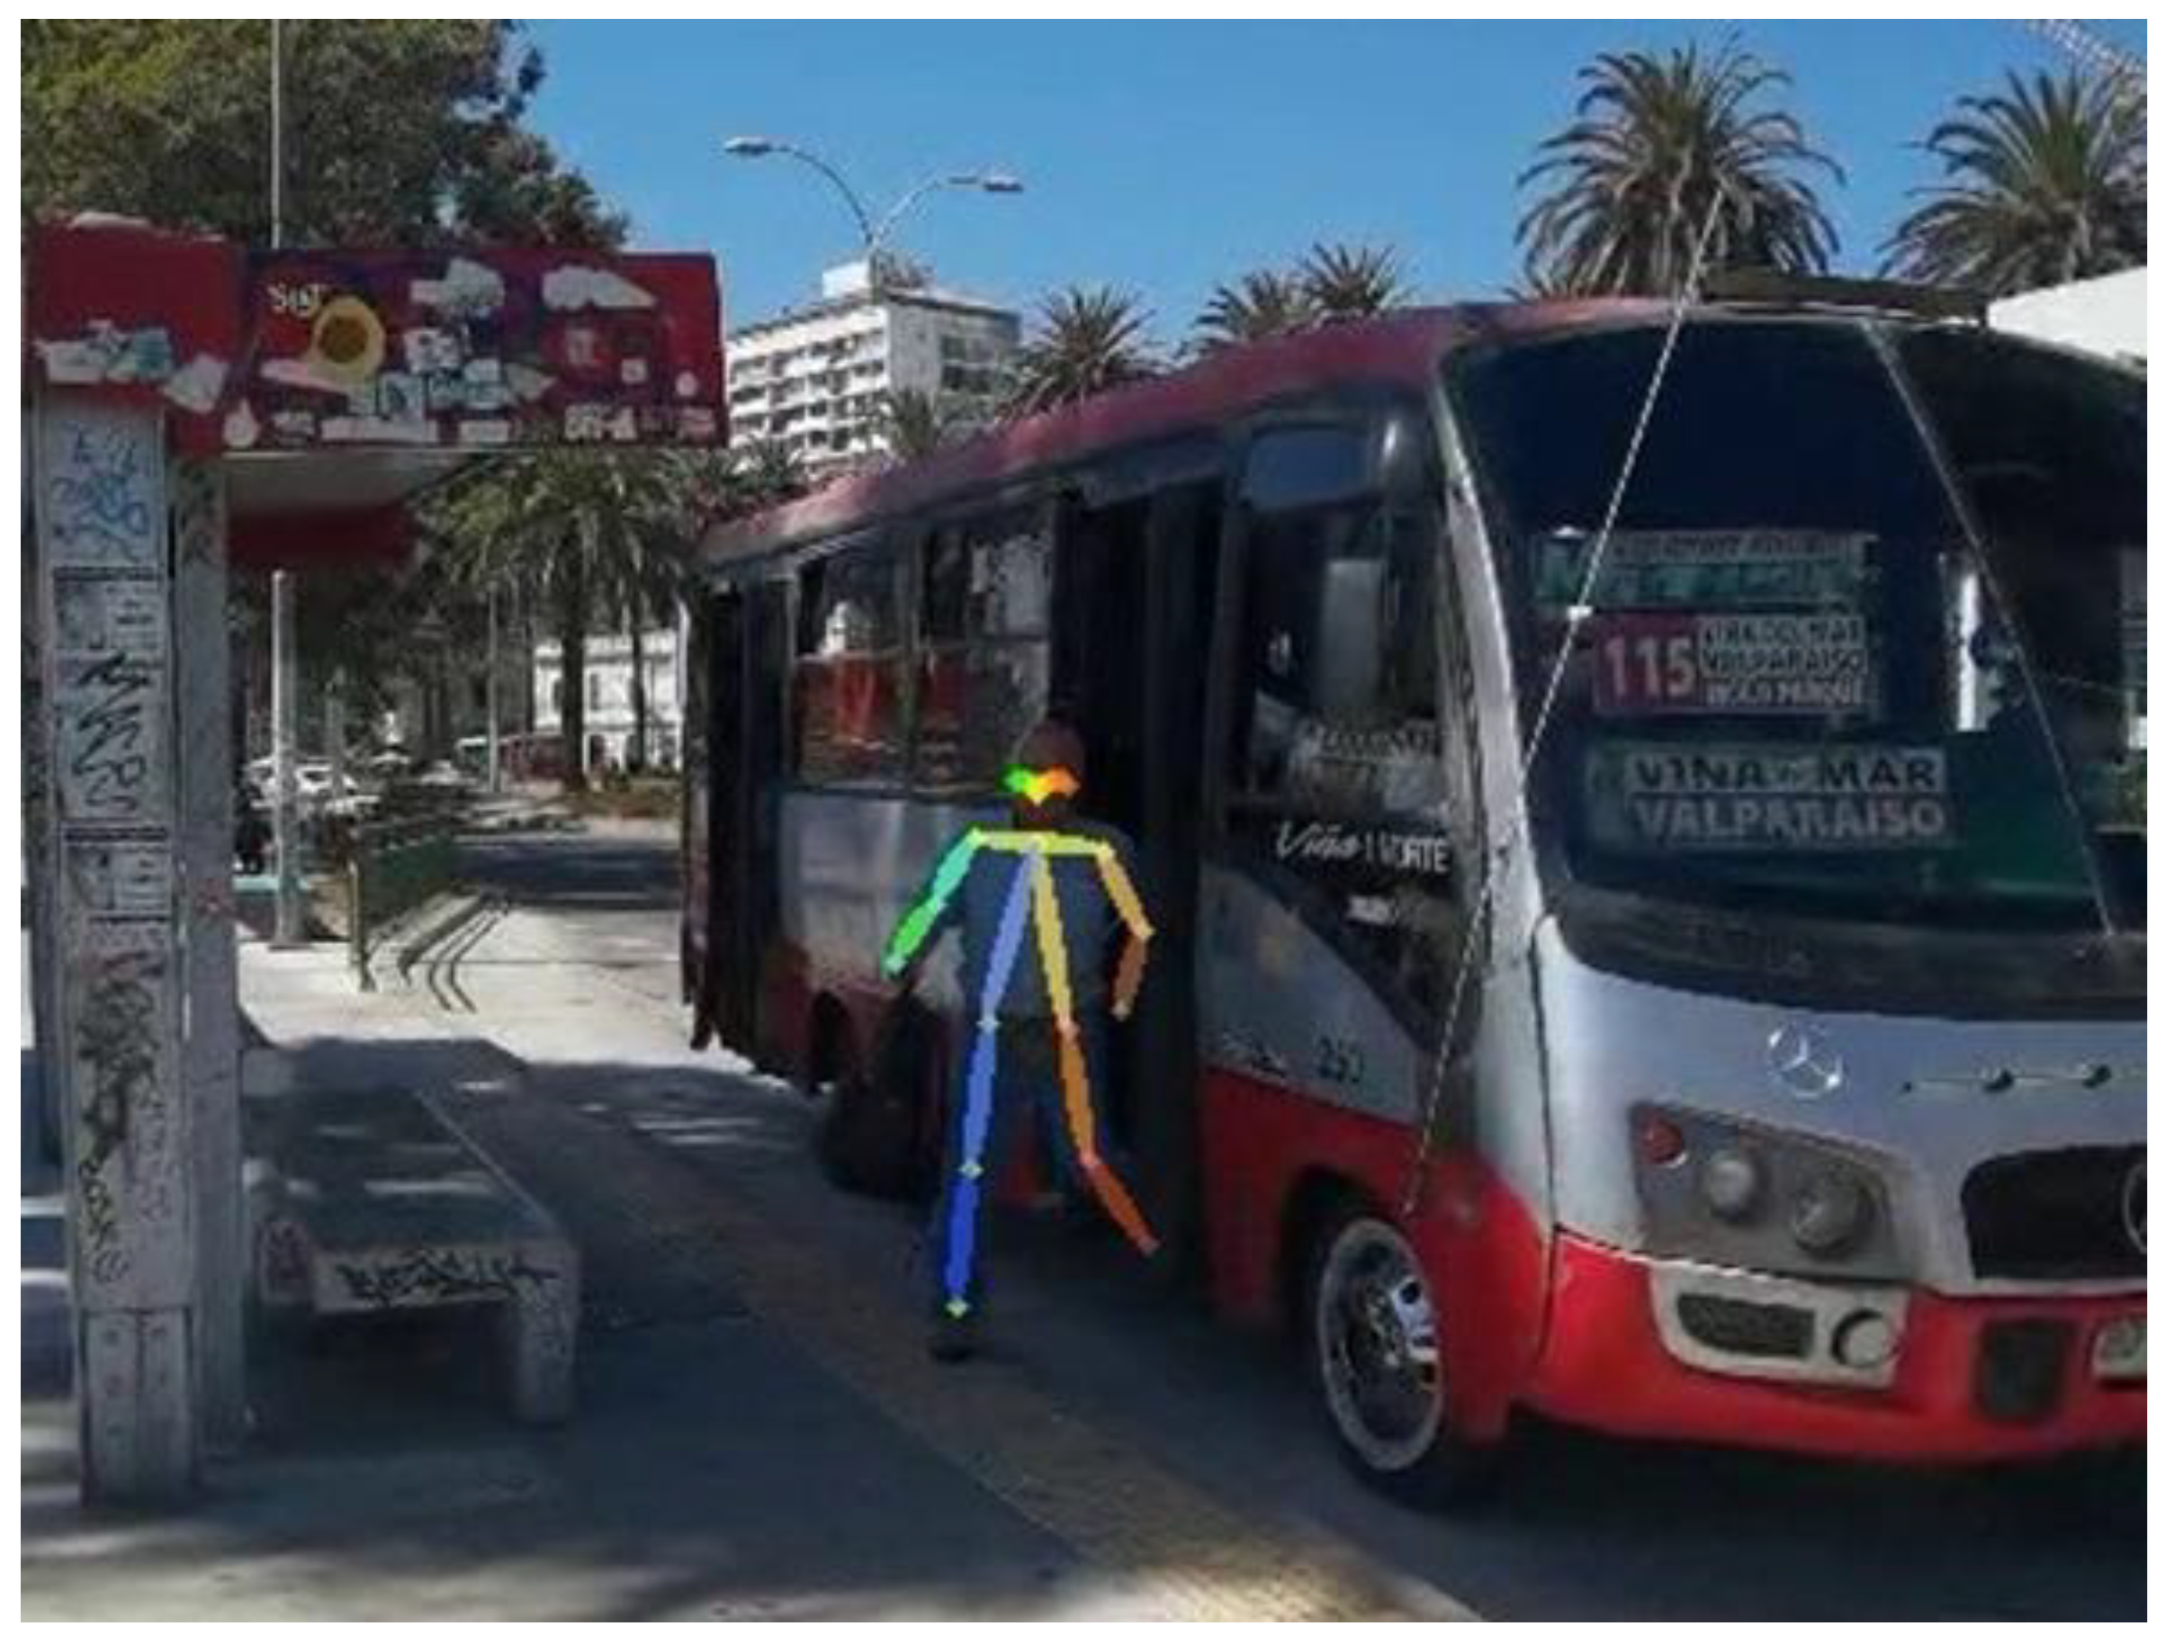
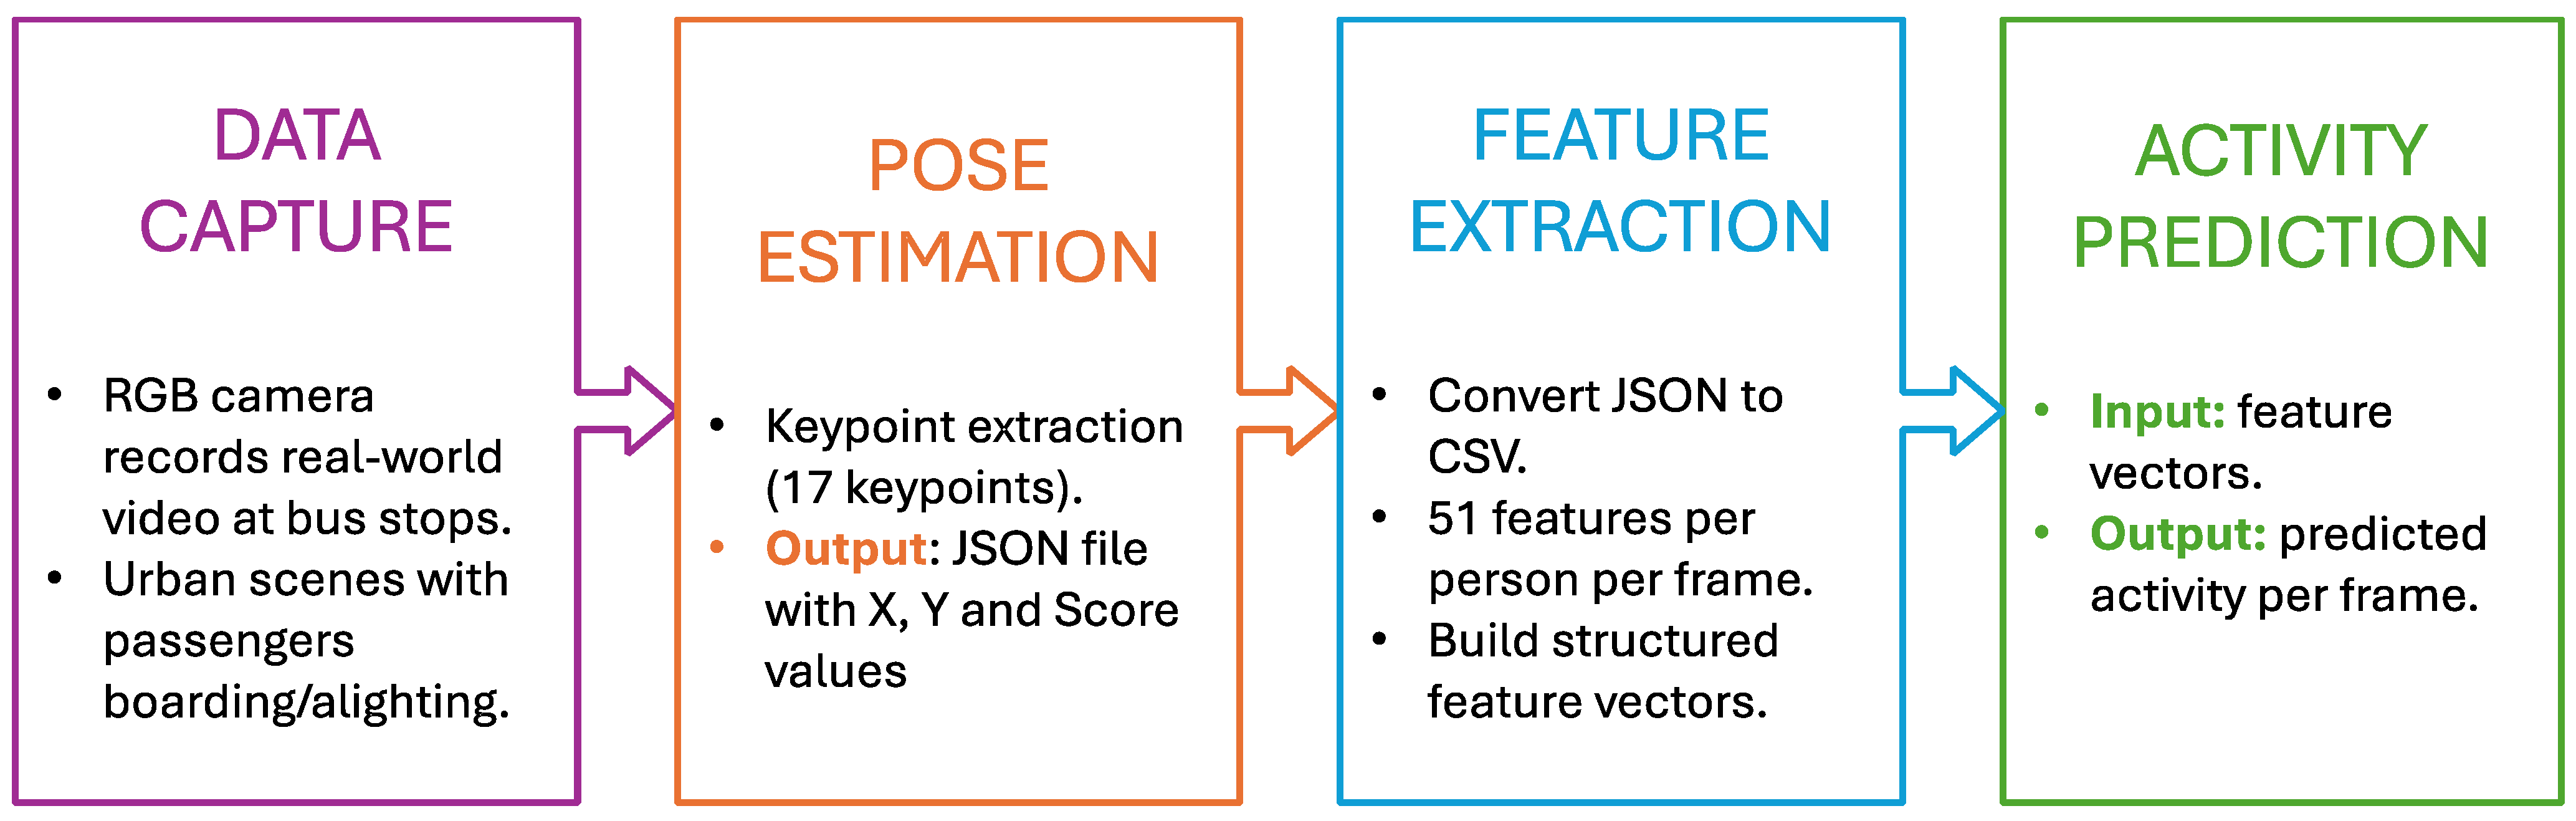
  • Data Capture: RGB video recordings are collected at urban bus stops using a fixed camera. These videos capture real-world passenger behaviors, including standing, walking, boarding, and alighting.
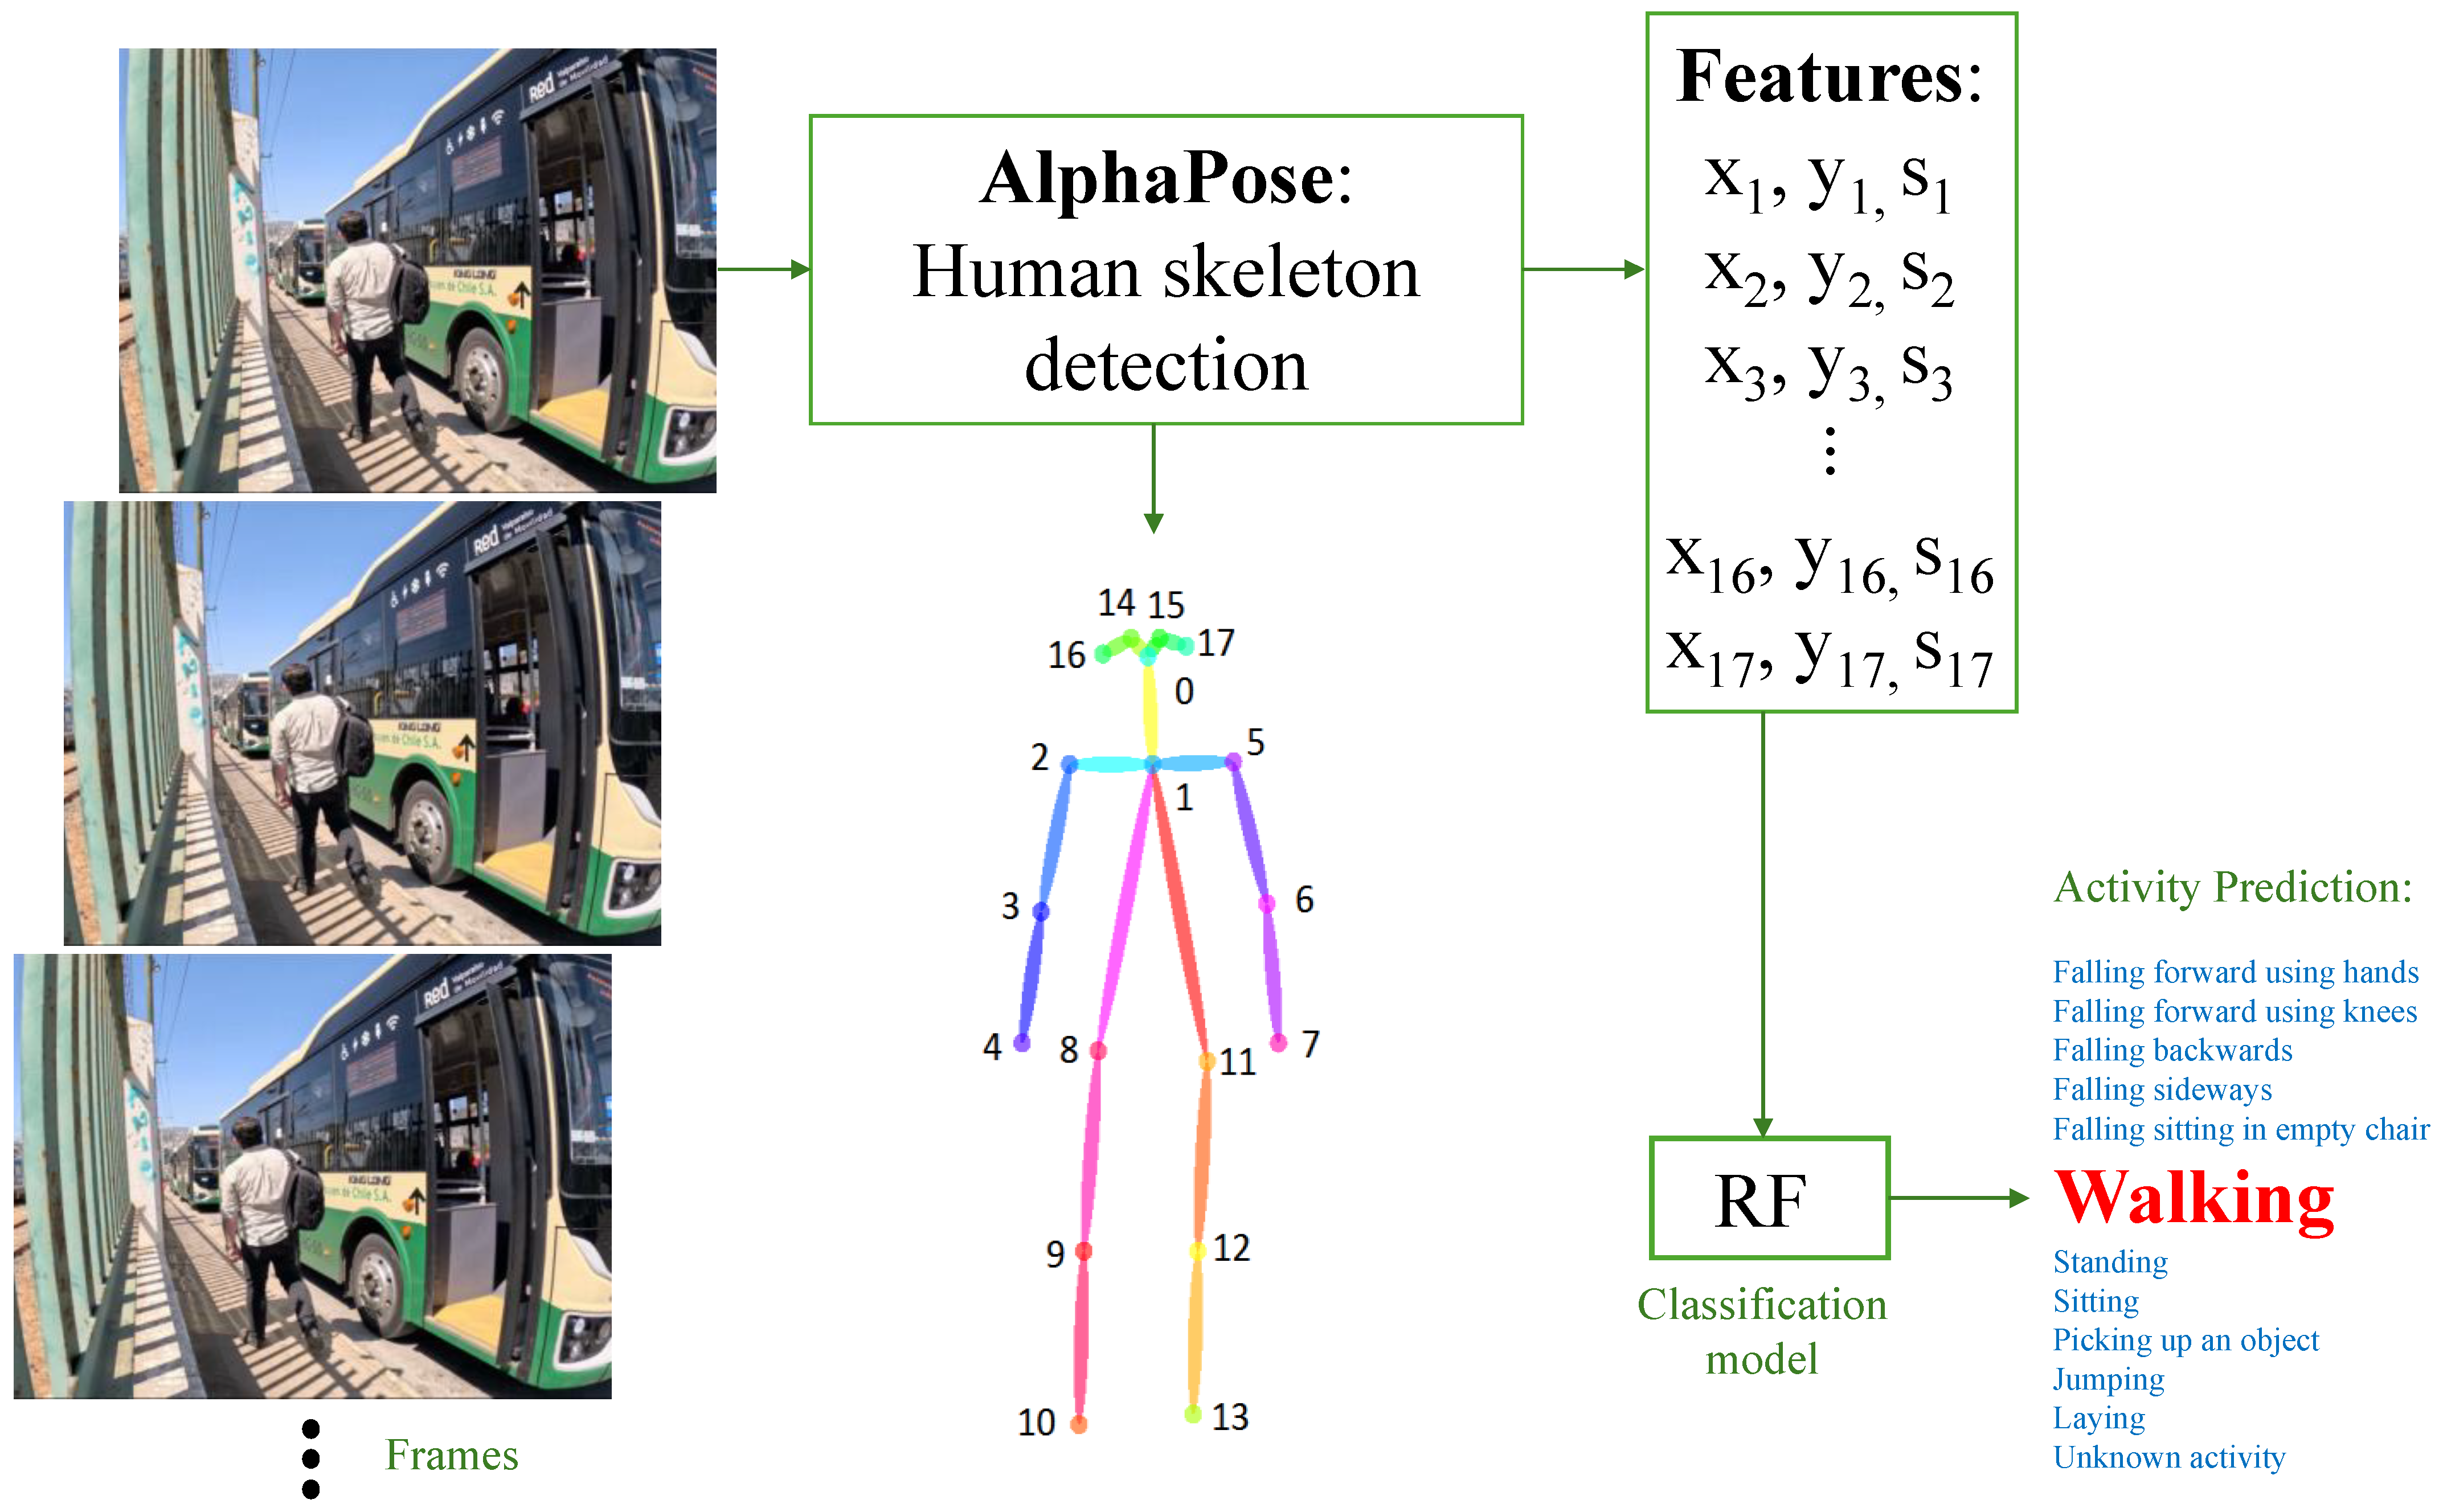
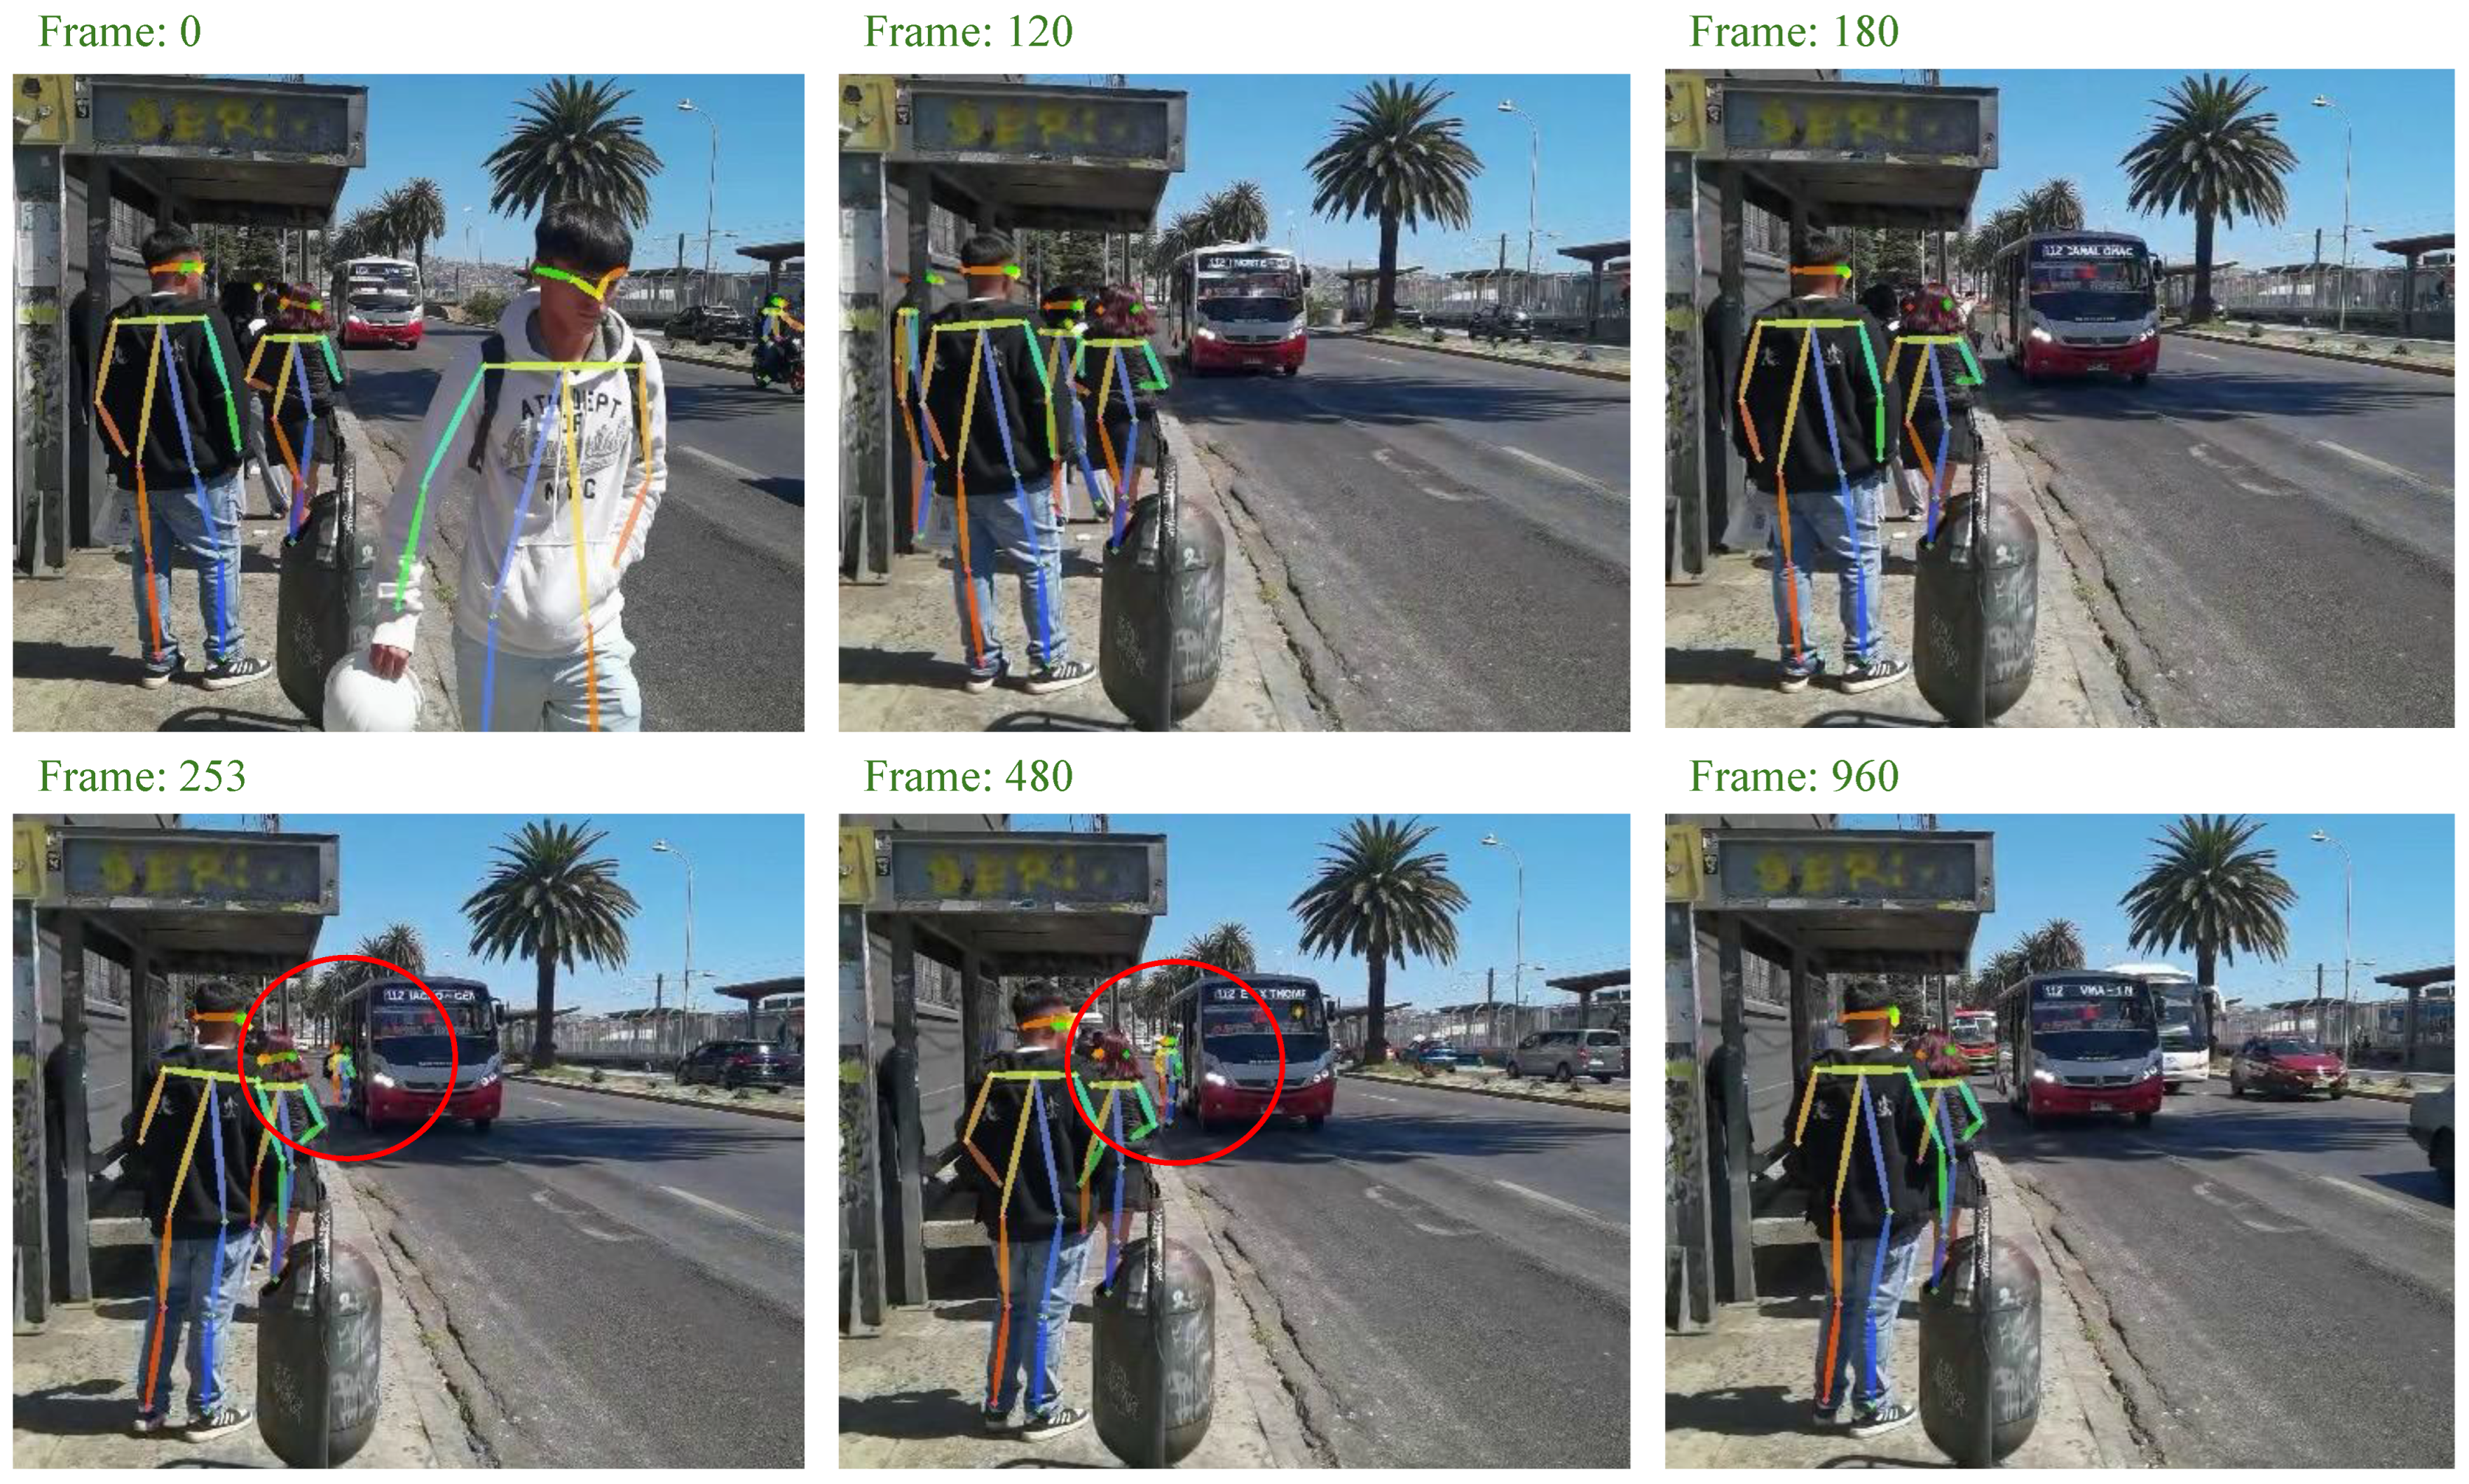
  • Pose Estimation: Each video frame is processed with a pose estimation algorithm, which detects and maps 17 key body joints per person. The output is a structured JSON file containing the coordinates (X, Y) and confidence scores for each joint.
  • Feature Extraction: The raw JSON data are parsed and transformed into CSV format. For each detected individual, 51 features are computed (17 joints × 3 values per joint: X, Y, Score), forming the feature vector used in the prediction stage.
  • Activity Prediction: The feature vector is input into a pre-trained machine learning model, which classifies the activity for each person in every frame. The model distinguishes between activities such as standing, sitting, walking, and falling.
This structured pipeline enables the system to operate in complex, real-world environments with multiple people and varying conditions, offering insights into passenger behavior and potential improvements in public transport accessibility and safety. The methodology used is explained in detail below.

3.1. Method

Figure 4 shows the workflow for activity prediction using images from videos of pedestrians waiting for the bus or boarding and alighting the bus. Below, each stage of this methodology is described.
Firstly, the data are captured. In this study, real-world video recordings were made using an RGB camera, capturing the dynamic and varied scenarios of passengers boarding and alighting from buses in the urban setting of Valparaíso, Chile. The choice of this environment was deliberate, aiming to capture the natural movements and behaviors of pedestrians and passengers in a typical public transportation context. The recorded activities covered a wide range of common behaviors such as pedestrians standing or sitting while waiting for the bus, pedestrians walking around the bus stop area, and passengers engaging in the process of boarding or alighting from the bus. These activities represent typical behaviors that occur at bus stops, providing a comprehensive dataset for analyzing pedestrian movement patterns in transit environments. The diversity of activities in the captured data helps ensure that the model can be generalized to real-world scenarios beyond controlled or artificial settings.
Secondly, the estimation of the pose is obtained. Once the videos were captured, individual frames from each video were extracted to be processed using the AlphaPose pose estimator. AlphaPose is a state-of-the-art system for human pose estimation that identifies key body joints (such as the elbows, knees, shoulders, and ankles) from each frame. These key points are used to construct a skeleton model of each person in the scene. The skeletal feature extraction process begins with person detection using an object detector (e.g., YOLOv3 or Faster R-CNN). Once the regions of interest corresponding to each person are identified, the model applies a pose estimation network that predicts the precise location of anatomical key points, thereby generating a skeletal representation. Each skeleton generated by AlphaPose consists of a set of 17 key points (following the COCO format), each represented by a pair of coordinates (x, y) in the image, along with a confidence score indicating the model’s certainty regarding the prediction. The 17 key points generated by AlphaPose include Nose, Left Eye, Right Eye, Left Ear, Right Ear, Left Shoulder, Right Shoulder, Left Elbow, Right Elbow, Left Wrist, Right Wrist, Left Hip, Right Hip, Left Knee, Right Knee, Left Ankle, and Right Ankle. The output from AlphaPose is a .json file containing the coordinates of the 17 key points for each person in every frame of the video. This file provides a skeletal representation of pedestrians and passengers, which is essential for understanding their movements and posture. The pose estimation process is crucial, as it allows the system to capture detailed information about the human body’s positioning, enabling more accurate activity recognition based on body posture and motion.
Thirdly, after pose estimation, the raw output from AlphaPose (the .json files) is converted into a .csv format to facilitate further analysis. The conversion process involves parsing the JSON data to extract relevant pose features, such as the positions of the joints, and organizing them into a structured table format. These cleaned and organized data are essential for building the feature vector, which serves as the input to the activity prediction model. The feature vector consists of 51 columns, each corresponding to the x-position, y-position, and score of each of the 17 skeleton key points, so 17 × 3 = 51. Each row of the .csv file represents a person in each frame of the video, providing a complete dataset of each person’s pose at a given time. Finally, we obtain the feature vector, a two-dimensional matrix with 51 columns and rows equal to the number of people detected per frame. This preparation step ensures that the data are ready for input into the machine learning model, removing noise and irrelevant information while retaining the critical details needed for accurate predictions.
Finally, with the feature vector properly prepared, it is then fed into a Random Forest-based machine learning model for prediction. This model uses the features extracted from the skeletal data to predict the activity of each individual in the video frames. Random Forest is an ensemble learning method that creates multiple decision trees to make predictions based on the data it is provided. For each video frame, the model predicts what activity the person is performing, such as standing, walking, sitting, or even anomalous behaviors like falling. The ability to predict such activities is critical in the context of understanding pedestrian and passenger behaviors in transportation settings, allowing for applications such as safety monitoring, crowd management, and behavior analysis. By training the model on a diverse set of labeled data, the model can identify subtle distinctions in posture and movement patterns, enabling accurate real-time activity recognition. The process is fully automated, with the model dynamically classifying each frame in the video based on the input feature vector, ensuring continuous and real-time activity monitoring.

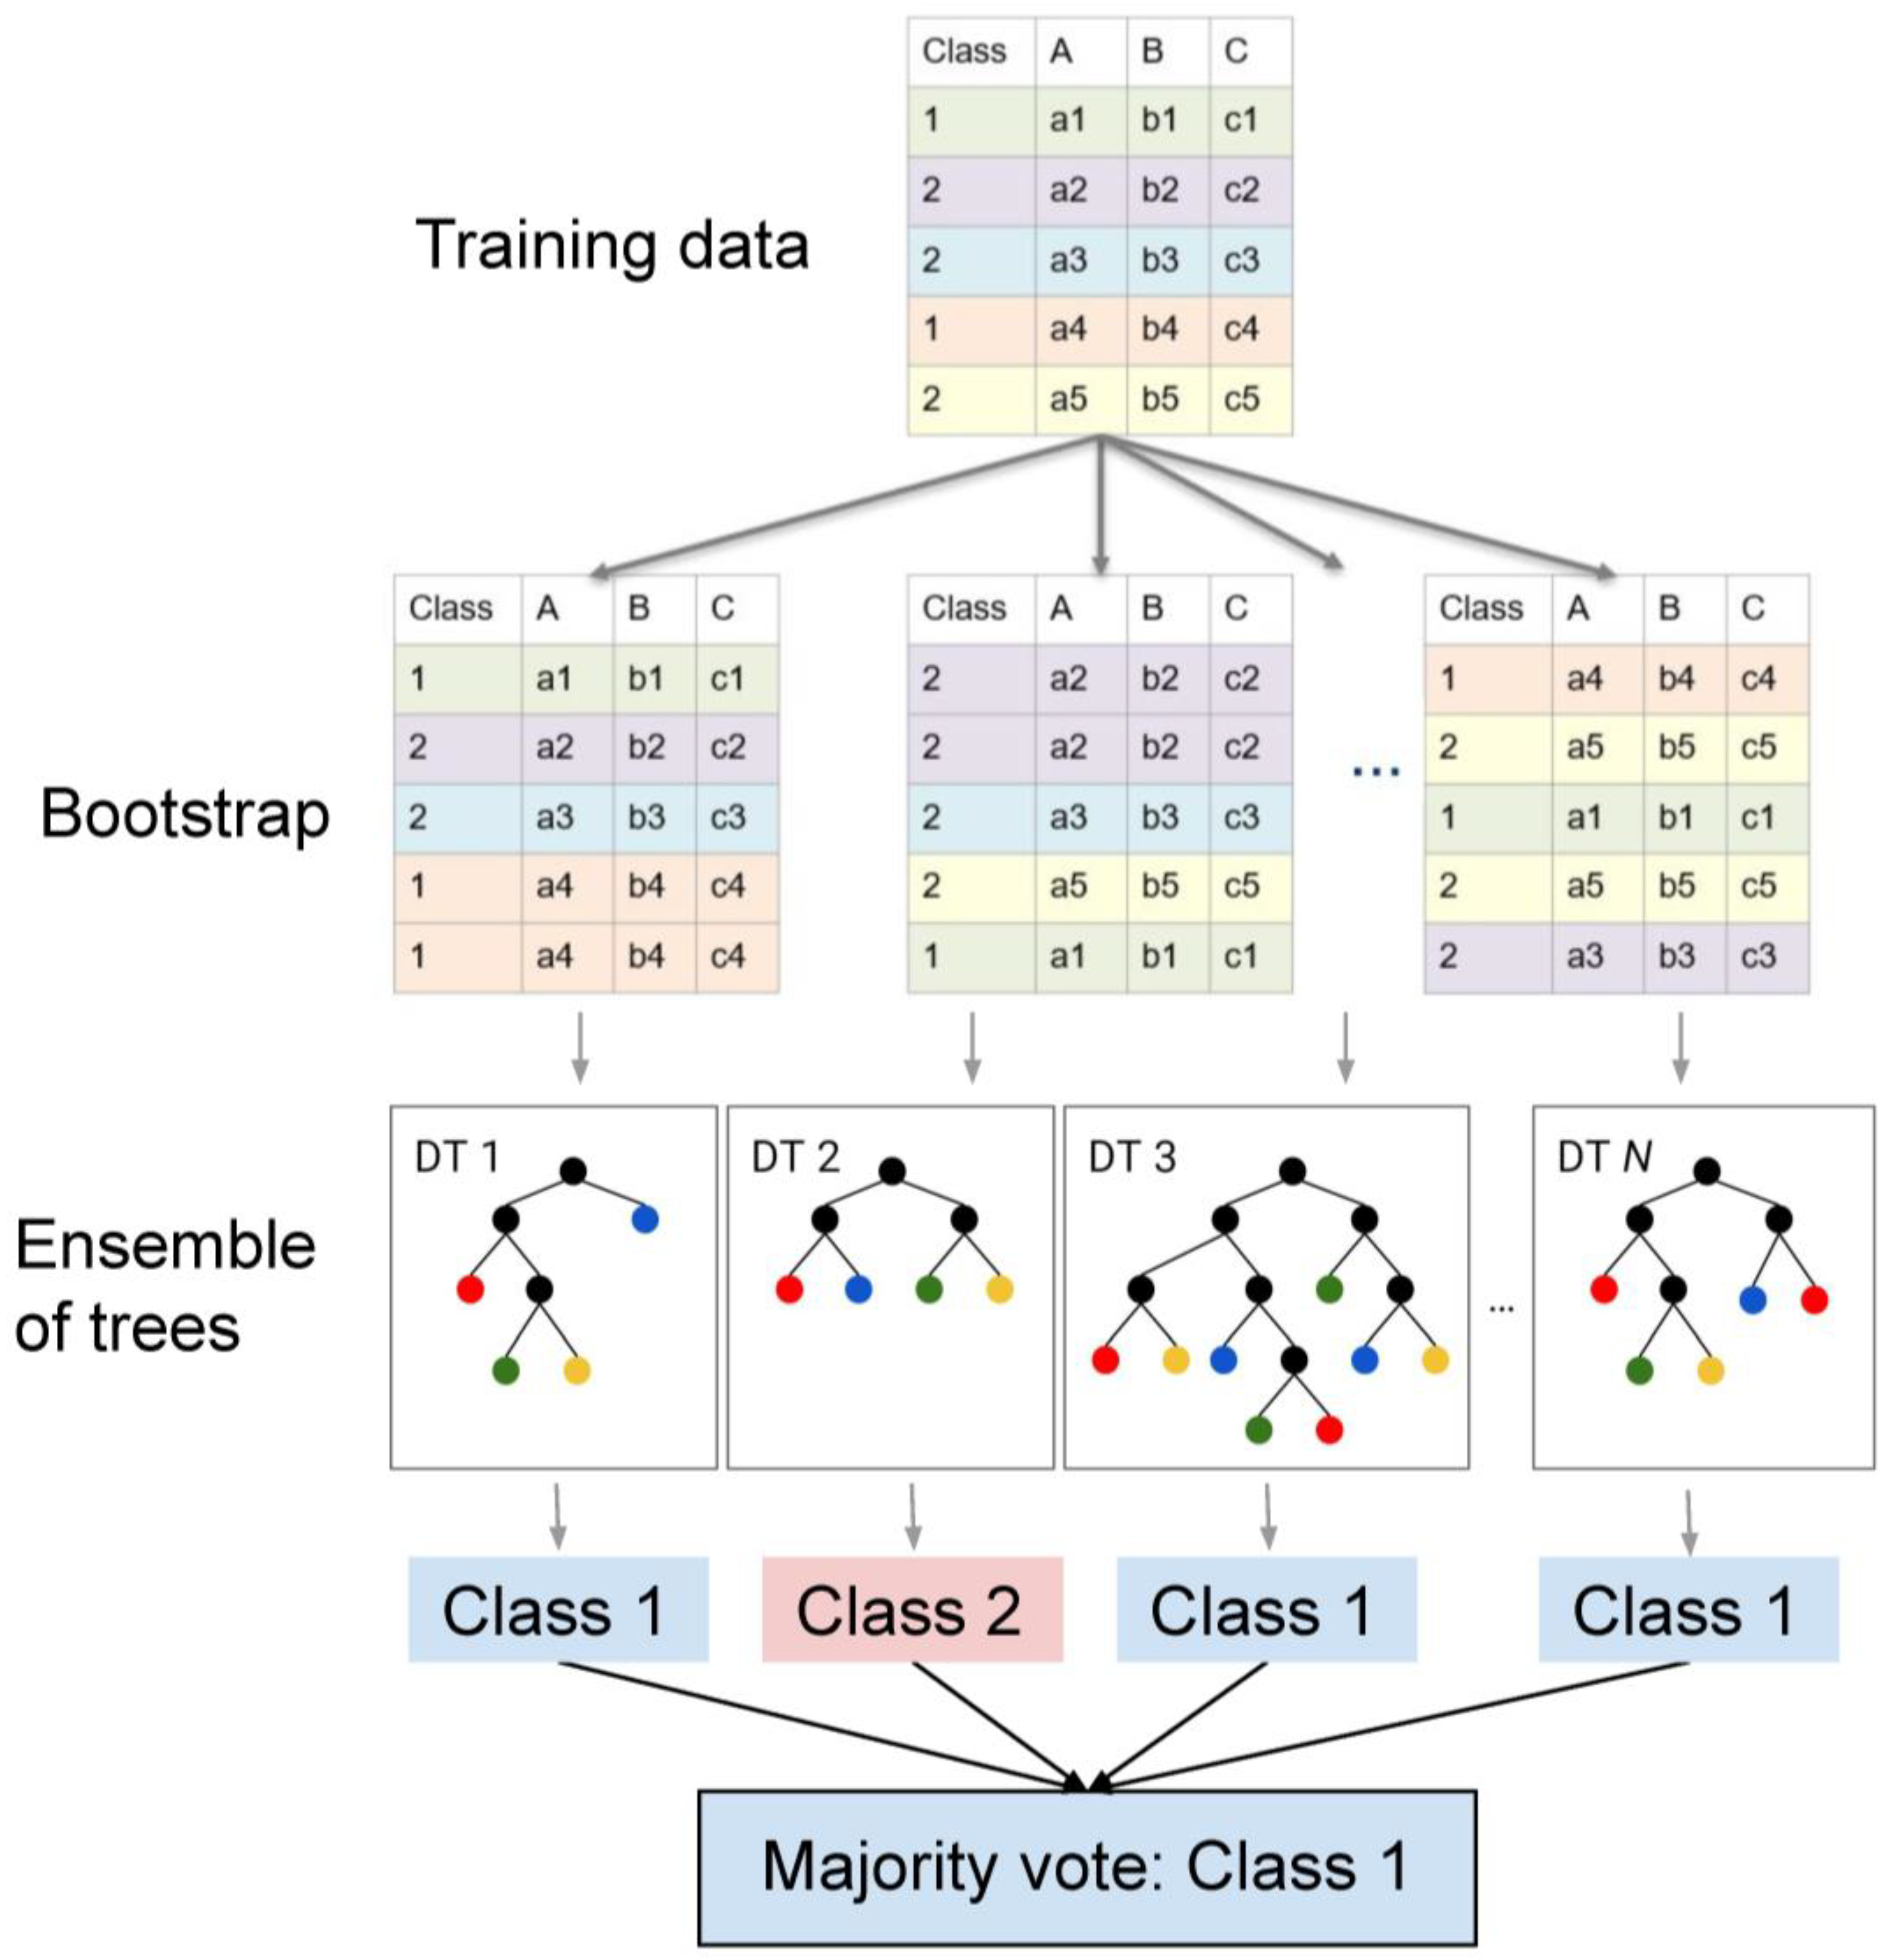
3.2. AI Selected Model

This study employs the Random Forest (RF) algorithm described in [7] in combination with skeleton data estimated by AlphaPose to recognize human activities in real-world public transportation scenarios. The selected model not only was the best-performing classifier in our previous controlled experiments (F1-score > 96%) but also presented key advantages such as robustness to noisy data, low computational cost, and interpretability—critical factors in uncontrolled, dynamic environments like bus stops.
The use of RF is strategic in this pilot study. The primary objective is to evaluate the feasibility and reliability of a human activity recognition (HAR) pipeline in realistic transit environments, rather than to propose a novel deep learning architecture. RF provides a robust and explainable baseline model that enables validation of the full methodology—from pose estimation to activity recognition—before exploring more complex models such as LSTM networks, graph convolutional networks (GCNs), or transformer-based architectures.
Furthermore, compared to deep learning models, RF is computationally efficient, making it suitable for edge-computing scenarios or real-time applications in public transport systems. Unlike sequential models, the current approach does not rely on temporal dynamics over long sequences, but rather on short frame-level or window-level posture features. This justifies the use of a non-sequential, tree-based model for classification.
It is important to emphasize that the novelty of our approach lies not in the machine learning algorithm itself but in its application: we are extending the use of a well-established AI pipeline (AlphaPose + RF) to a new and highly challenging context—real-world public bus stops—where multiple people interact dynamically and occlusions, noise, and posture variability are common. To our knowledge, this is among the first studies to validate a skeleton-based HAR model under real urban conditions.
This study thus serves as a steppingstone: it demonstrates the limits and potential of classical approaches in noisy, multi-person environments, and sets the foundation for future work using more advanced deep learning models like our in-development BERT-based architecture for skeleton data.
This work used the best machine learning model (Random Forest) described in [7] with the CAM (camera) modality through skeletons. Therefore, this human activity recognition model is selected to test if this methodology also works with more modern techniques.
The model classifies the activities of passengers at the bus stop and when boarding and alighting the bus. The feature vector used to predict the activity was composed of sequences of skeletal poses estimated by AlphaPose. The selection of the Random Forest (RF) model from [7] was based on its ability to handle datasets with high dimensionality, its good performance (over 90%), and its robustness to noise in measurements.
The Random Forest (RF) algorithm [26] is a supervised learning technique that generates multiple decision trees on a training dataset; the results obtained are combined to produce a single, more robust model compared to the results of each individual tree [27]. In [7], an RF model is trained on the UP-Fall dataset for activity recognition, with hyperparameters configured as shown in Table 1.
The model was trained and validated using the UP-Fall dataset [28] and tested with two datasets: UP-Fall and UR-Fall [29]. Everything was programmed in Python 3.10. The RF machine learning model from [7] is capable of recognizing, with very high performance (F1-score greater than 92%), 12 different human activities (5 fall activities and 7 daily activities):
  • Forward falls using the hands
  • Forward falls using the knees
  • Backward falls
  • Using an object
  • Sitting falls on an empty chair
  • Walking
  • Lying down
  • Sitting
  • Walking forward
  • Jumping
  • Standing
  • Unknown activity

4. Results

It is important to note that the real-world videos analyzed in this pilot study are not annotated with ground truth activity labels. Therefore, it was not possible to compute standard evaluation metrics such as per-class precision, recall, or confusion matrices. Nevertheless, the model’s performance was previously validated using annotated datasets (e.g., UP-Fall and UR-Fall), where F1-scores above 92% were achieved [7]. The encouraging results of this exploratory study motivate the future development of our own annotated dataset for public transport scenarios, which will allow for a complete quantitative evaluation.
The results show that the Random Forest-based model achieves an accuracy above 90% in activity classification. Specific patterns in the passengers’ poses were identified, which could be associated with difficulties in accessing the bus. This information could be used to improve public transportation design and policies. Among the videos captured at bus stops in Valparaíso, three main scenarios were identified: passengers getting off the bus, passengers running to catch the bus, and pedestrians waiting for the bus. The mentioned scenarios, along with the results of pose estimation and activity prediction, are presented below. All videos were recorded at 60 fps and processed through AlphaPose to estimate the poses of individuals, followed by activity prediction using the ML-RF model.

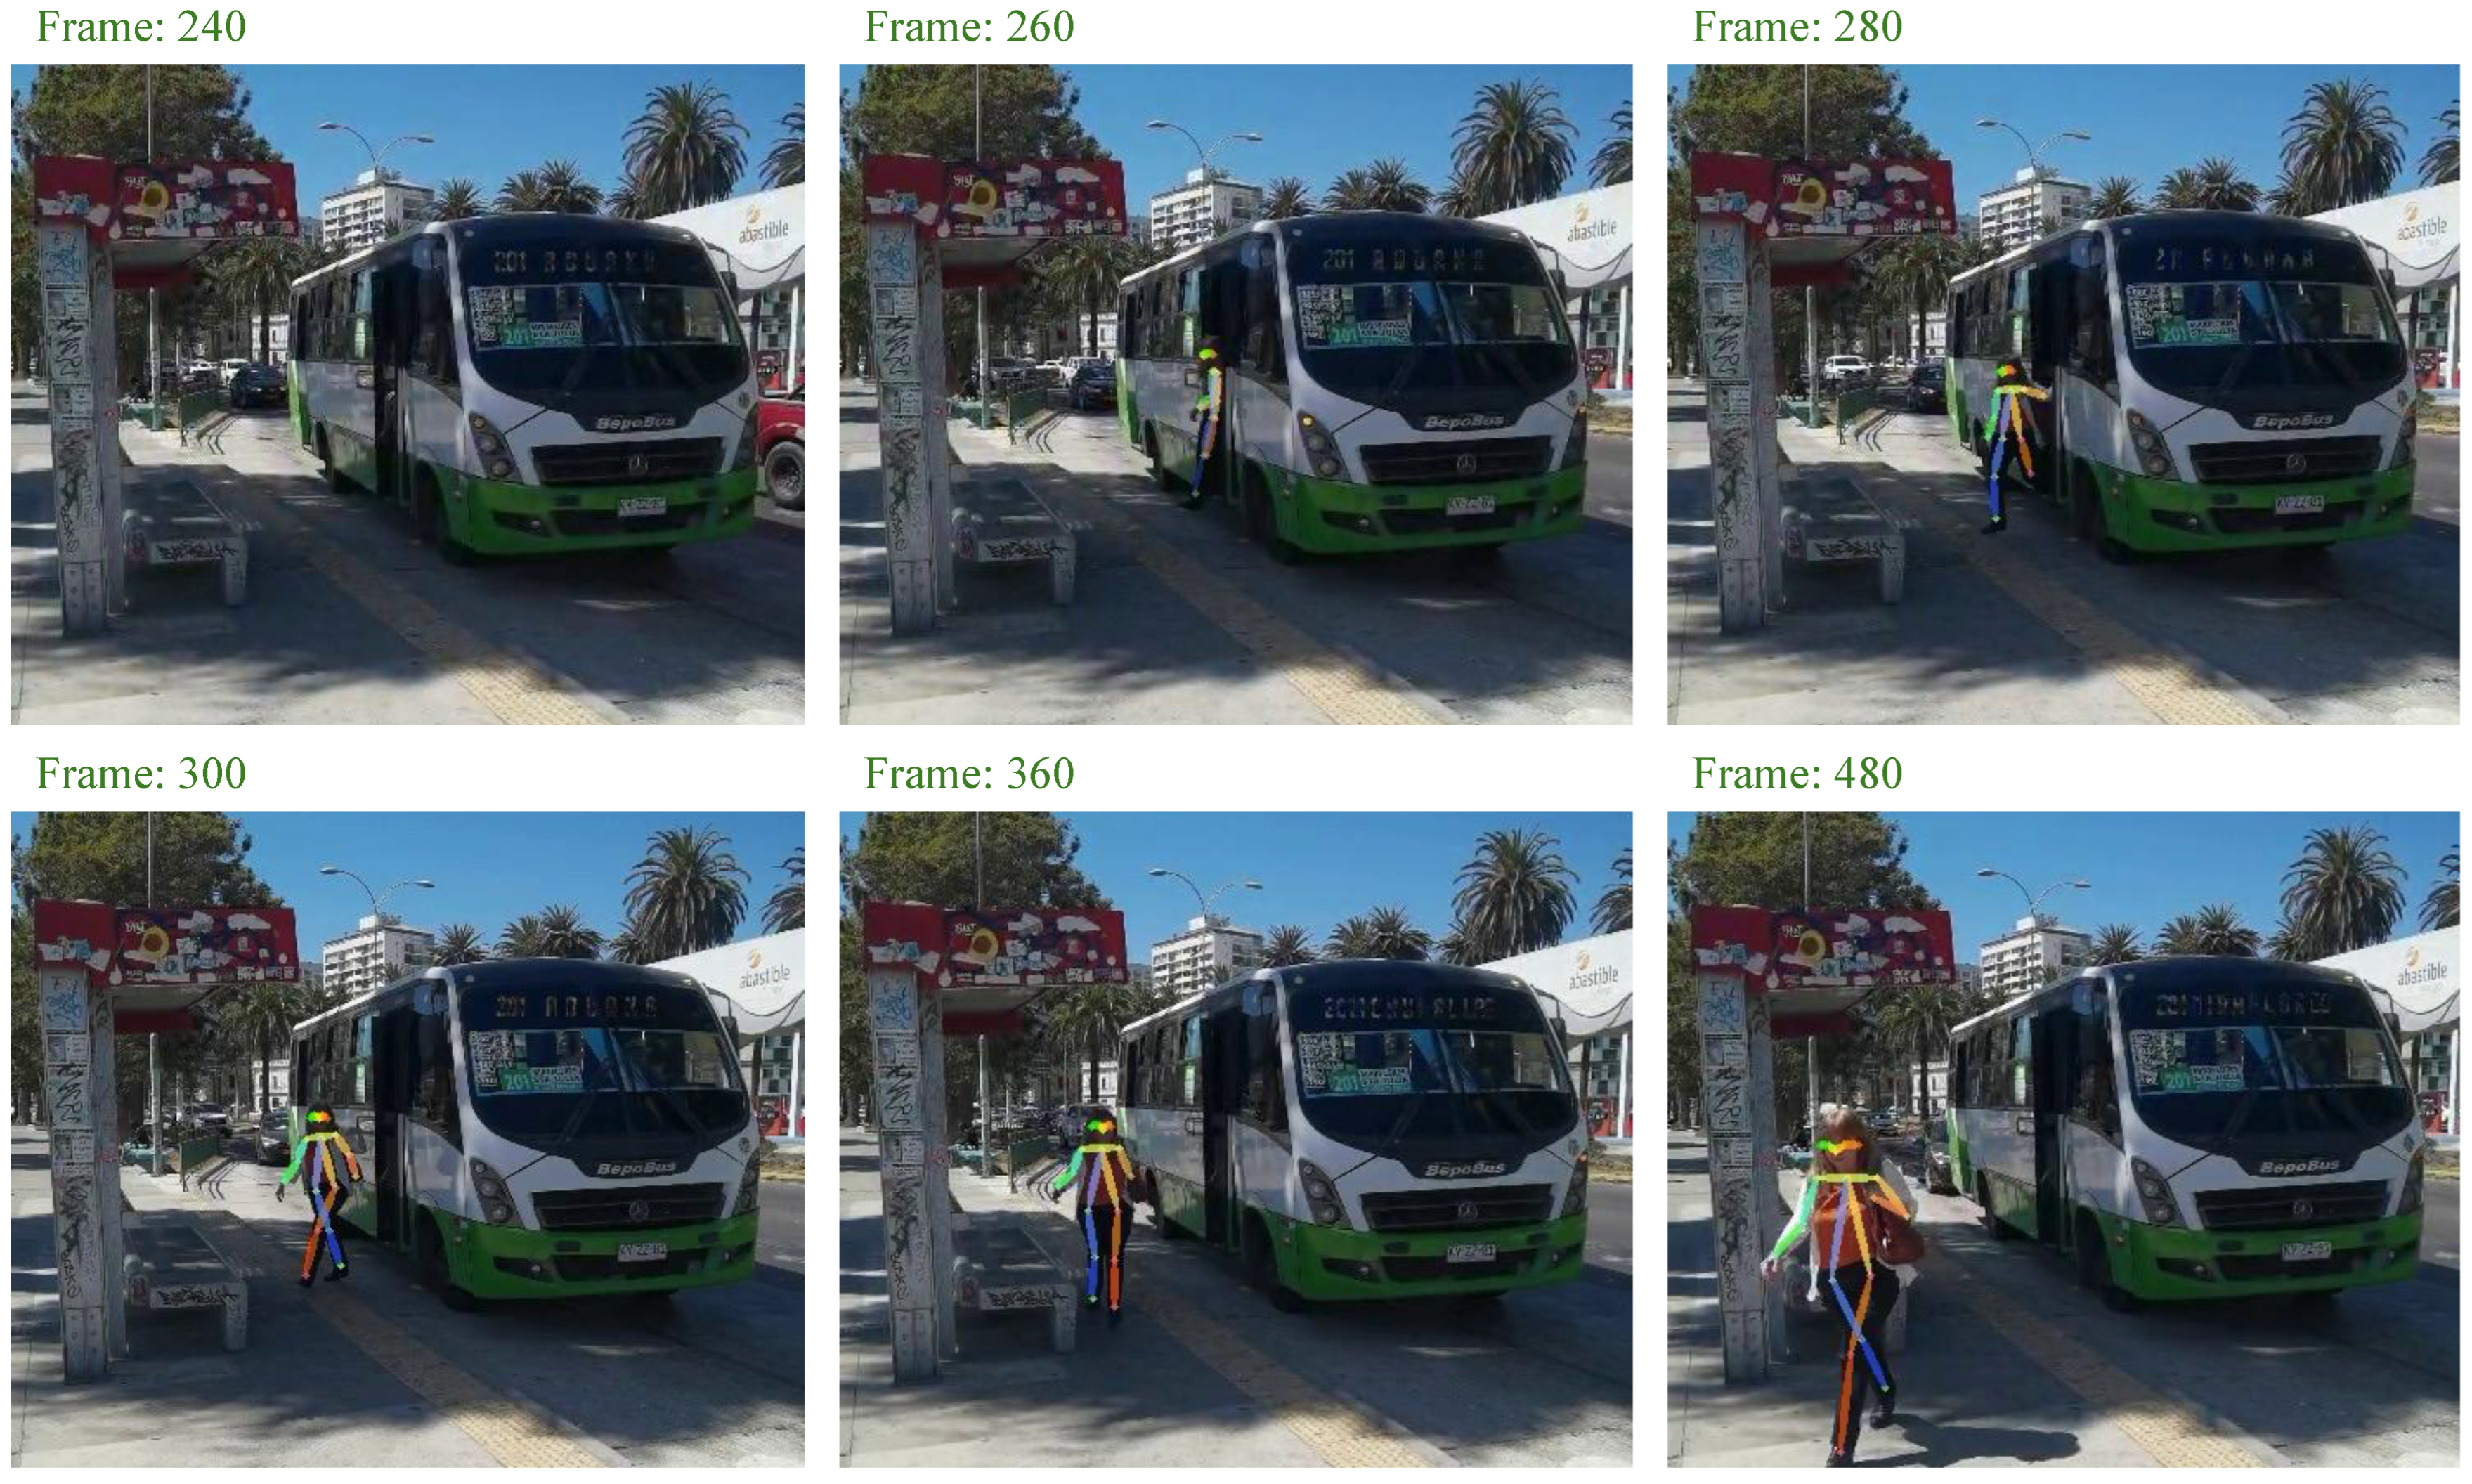
4.1. First Scenario: Video with a Passenger Getting off the Bus

In this first scenario, there is a video in which a person gets off a bus and then walks until they exit the scene (Figure 5). Afterward, the video shows another person getting out of a taxi (Figure 6) and walking away until the video ends.
The model is trained to distinguish between these types of movements, including the transition from getting off the bus to walking away, and it uses the pose estimation data to track the person’s movements. The identification of specific poses, such as the act of stepping off the bus and walking, allows the system to correctly classify the activity as “getting off the bus” and differentiate it from other similar actions, such as getting out of a car.
By analyzing these behaviors, the model can provide valuable insights into passenger mobility and possible challenges in the flow of people in areas like bus stops and parking lots.
Figure 5 and Figure 6 show the pose estimations for each person. It can be observed that AlphaPose is able to correctly detect everyone in the scene and accurately estimate their skeleton and pose.
AlphaPose’s ability to precisely identify key points on the human body, such as joints and limbs, allows it to create an accurate representation of each person’s posture. This capability is essential for understanding and classifying activities, as it provides valuable data about a person’s movements and body alignment during actions like getting off the bus or walking away from a car. The accurate pose estimation ensures that the model can make reliable predictions regarding the activity being performed, which is a crucial aspect for further improving transportation designs and policies.
With the pose estimation and the feature vector, the activity of each person is predicted using the ML-RF model. Figure 7 shows the activity recognized by the ML model. It can be seen that the model identified 5 activities throughout the video: falling backward, sitting down on a chair, walking, walking forward (towards the camera), and standing.
The Random Forest (RF) model takes the feature vectors derived from the pose estimation data and classifies the actions based on pre-trained patterns. This approach enables the system to recognize a wide range of activities, not just limited to those related to transportation but also including general movements and behaviors such as sitting or walking in different directions.
The variety of activities identified in the video suggests that the model is capable of distinguishing between different types of human motion, which is vital for understanding how passengers interact with their environment in real-world scenarios. By recognizing these specific activities, transportation planners can gain a better understanding of how people behave in transit settings and potentially identify points where improvements can be made to enhance accessibility and efficiency.
To understand the activities performed throughout the entire video, the evolution of activities over time is plotted. Figure 8 shows the activities performed by each person for each frame of the video. It can be observed that at several points in the video, the model incorrectly recognizes activities, such as falling, that are not actually occurring.
These misclassifications can occur for various reasons, such as rapid or subtle body movements that the model might interpret as falling, or limitations in the model’s ability to distinguish between similar activities, especially when the pose estimation data are not perfectly clear. For example, a sudden shift in posture or an abrupt movement could be falsely identified as falling backward, even if the person is simply adjusting their position.
To better understand which activities are being correctly and incorrectly recognized, Figure 9 presents a graph that highlights the activity classifications over time. This graph helps pinpoint the specific moments in the video where errors occur, which can be valuable for further fine-tuning the model. By identifying the periods of misclassification, the model can be adjusted to reduce false positives (incorrectly recognizing activities like falling) and improve overall accuracy.
Given that the videos are recorded at 60 frames per second, the x-axis in Figure 9 is divided into groups of 60 frames, corresponding to each second of the video. The graph shows the activities predicted by the ML-RF model for each 60-frame block. From the graph, it is clear that activities recognized with less frequency are displayed with lighter colors. These less frequent activities are often the ones that the model misclassifies or identifies only sporadically. To improve the interpretation of the prediction for each 60-frame block, the data are normalized, as shown in Figure 10.
Normalization helps provide a clearer view of the activity distribution across the video by scaling the predictions into a range that highlights relevant activities and reduces the influence of sporadic misclassifications or noise. This process ensures that activities with lower recognition frequency do not dominate the analysis and allows for a more accurate representation of the most significant actions in the video.
By normalizing the data, the analysis can focus on the most consistent and relevant predictions, making it easier to understand the model’s behavior over time. This approach also helps filter out irrelevant activities and provides a more reliable overview of the video’s events.
In Figure 11, the predictions made by the ML-RF model are normalized for every 60 frames by dividing the predictions by 60. From Figure 10, it can be concluded that activities that do not actually occur in the video, such as falling, have very little weight in each block of the graph. Therefore, to consider a recognized activity as relevant, it is assumed that for each second of the video (60 frames), the same activity must be recognized in at least half of the frames (>0.5).
This means that if the activity for each second of the video shows a number higher than 0.5, it indicates that the activity was recognized in the majority of the 60 frames. On the other hand, if the number is lower than 0.5, it means that the activity was recognized in less than half of a second, and thus, it can be considered an irrelevant prediction.
Taking this into account, activities with a weight below 0.5 are approximated to 0, and activities with a weight greater than 0.5 are approximated to 1. The graph in Figure 11 shows the approximated activities for each second of the video.
This normalization and thresholding process helps improve the robustness of the model by filtering out minor or false positive predictions (such as the activity of falling when it did not actually occur), focusing only on those activities that are clearly visible and consistent in the video.
With the approximated activities (Figure 11), we can observe the relevant activities recognized by the ML-RF model for each second of the video.
The graph in Figure 11 shows a clear representation of the activities that have been consistently identified over time, where values closer to 1 indicate that the activity was recognized across most of the frames in that second. On the other hand, values closer to 0 reflect activities that were either only detected briefly or were misclassified, making them less relevant for further analysis.
This visualization allows us to pinpoint which activities the model consistently recognized, and which were not as clearly identified. By focusing on those with a higher weight (closer to 1), we can ensure that the predictions align more accurately with the actual events in the video. This method also helps to filter out noise and reduce the impact of false positives or minor misclassifications.
Figure 11 shows that in the first 4 s, no activity is recognized, which, when viewing the video (as shown in Figure 5), aligns with the fact that there are no people in the scene during that time.
Then, from frames 240 to 540, the activities “walking” and “standing” are correctly recognized, which corresponds to the scenes shown in Figure 5. Between frames 540 and 660, no people are present in the scene. However, from frame 660 to the end of the video, a person appears, and the activity recognized by the ML-RF model is “walking”. This recognition is correct, as shown in Figure 6, where the person can be seen walking away from the scene.

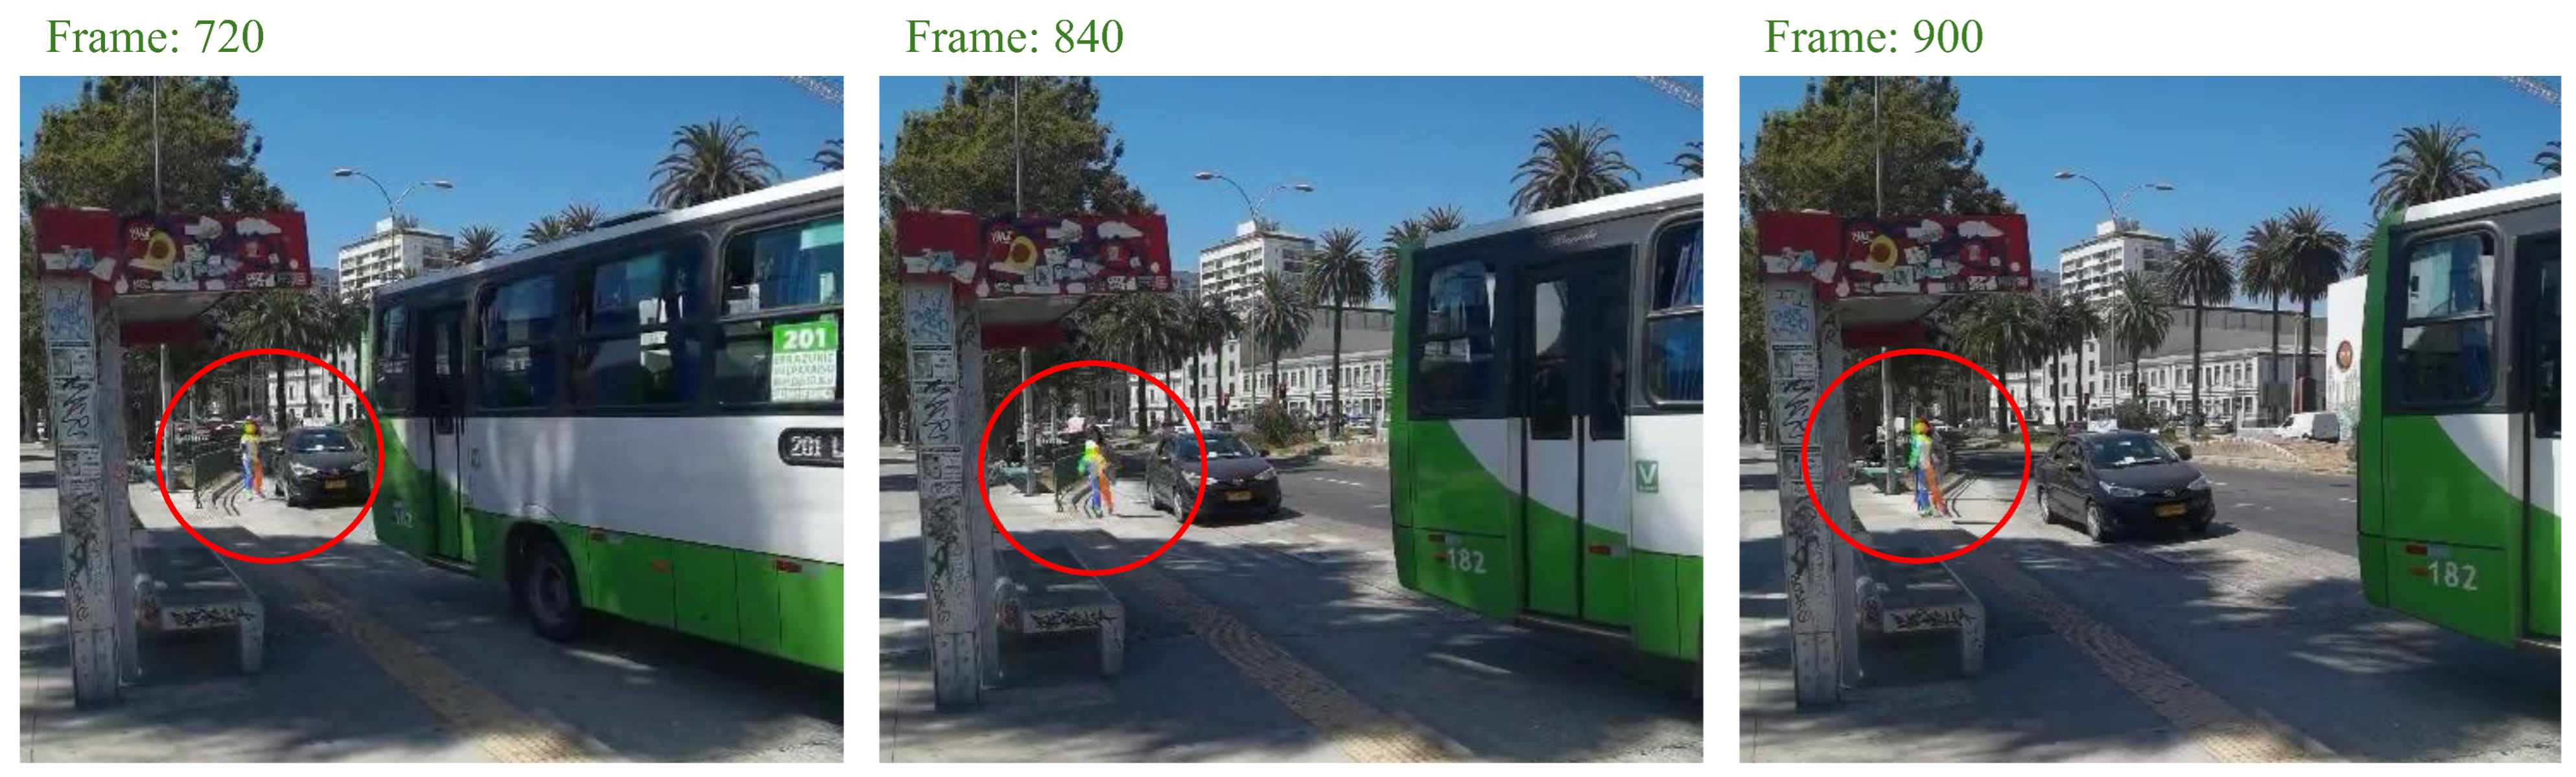
4.2. Second Scenario: Video with a Passenger Running to the Bus

In the second scenario, the video shows a person waiting for the bus, then walking towards the bus, and finally running to catch it (Figure 12).
As the person moves through these stages, the model uses pose estimation to track the changes in their body posture and movements. When the person is simply waiting, their pose remains relatively stable, with minimal movement. As they begin to walk towards the bus, the model detects the characteristic walking motion, and when the person switches to running to catch the bus, the model recognizes the faster, more intense movement associated with running.
By processing this sequence, the ML-RF model can accurately classify the activities as “waiting”, “walking”, and “running”, which correspond to the different phases shown in the video. These transitions are important because they highlight the person’s urgency to catch the bus, a common occurrence at bus stops, which can inform better planning for things like bus schedules or stop layouts.
Figure 12 shows the pose estimation for the person present in the video. It can be observed that AlphaPose is able to accurately estimate the skeleton and pose of the person in most frames of the video, tracking the key points of their body and movements with precision. This allows the system to generate a reliable representation of the person’s posture and movement at each moment in time.
Using this pose estimation data along with the feature vector, the ML-RF model predicts the activities being performed by the person. Figure 13 presents the activities recognized by the ML model throughout the video. It shows that the model identified 7 activities in total: falling to the knees, falling backward, using an object, sitting down on a chair, walking, walking towards the camera, and standing.
This variety of recognized activities suggests that the model can detect a wide range of human movements. Some activities, such as falling or using an object, might be misclassifications or rare occurrences, while others, like walking or standing, are more likely to be consistent throughout the video.
The ability to accurately predict and classify such activities provides valuable insights into the person’s behavior at the bus stop, which could be useful for improving the user experience and enhancing the design of the public transportation system. For example, recognizing activities like “walking towards the camera” or “standing” could help identify patterns of passenger movement that lead to delays or other inefficiencies at bus stops.
Figure 14 shows the activities performed by the person in the video for each frame. It can be observed that at several moments in the video, the model recognizes activities that do not occur, such as different forms of falling (e.g., falling to the knees or falling backward).
These misclassifications can arise due to subtle or rapid movements that the model might mistakenly interpret as falls, even though they are simply the person adjusting their position or shifting their posture. Such misclassifications often happen when the pose estimation is not as clear or when certain body movements resemble the patterns associated with falling.
To gain a clearer understanding of which activities are being correctly and incorrectly recognized, the graph in Figure 15 is generated. This graph highlights classification accuracy over time, helping to distinguish between valid predictions and erroneous ones. By examining this graph, we can see where the model makes mistakes, such as incorrectly predicting a fall when the person is merely walking or changing positions.
This analysis helps refine the model by focusing on the periods where errors occur and adjusting the system to improve its accuracy in identifying specific activities. It also provides insights into the limitations of the current model, which can be addressed in future iterations or model improvements.
As in the first case, to identify the relevant activities, the predictions made by the ML-RF model are normalized for every 60 frames (1 s). This means that the predictions are divided by 60. Activities that do not actually occur in the video (such as “falling”) are given very little weight in each 60-frame block.
Taking this into account, activities with a weight below 0.5 are approximated to 0, and activities with a weight greater than 0.5 are approximated to 1. This process helps to filter out irrelevant or incorrect predictions, focusing only on activities that are more likely to reflect actual events in the video.
Figure 15 presents the normalized and approximated activities for each second of the video. By visualizing this, we can clearly see which activities were consistently recognized by the model (those with weights close to 1) and which were brief misclassifications or irrelevant activities (those with weights closer to 0). Figure 15 shows that in the first 60 frames (the first second), the activity “standing” is recognized, which, upon verifying the video images (Figure 12), corresponds to the person standing up from the bus stop. Next, between frames 60 and 120, no activities are recognized. Upon closer inspection of Figure 12, we see that in frame 120, AlphaPose was unable to detect the person or estimate their pose. This could be due to several factors, such as lighting issues or the object the person is carrying, which might have caused an incomplete or incorrect skeleton estimation. From frames 120 to 180, the activity “walking” is correctly recognized, which aligns with the person’s movements in the video. However, from frame 180 to 360, the person starts running towards the bus. Since the ML-RF model was not trained to recognize running, it mistakenly classifies this activity as “standing”. When the person is almost out of the scene, at frame 360, the model predicts the activity as “using an object”, which is actually correct, as shown in Figure 12, where the person is seen interacting with an object near the bus. After frame 420, the person exits the scene.

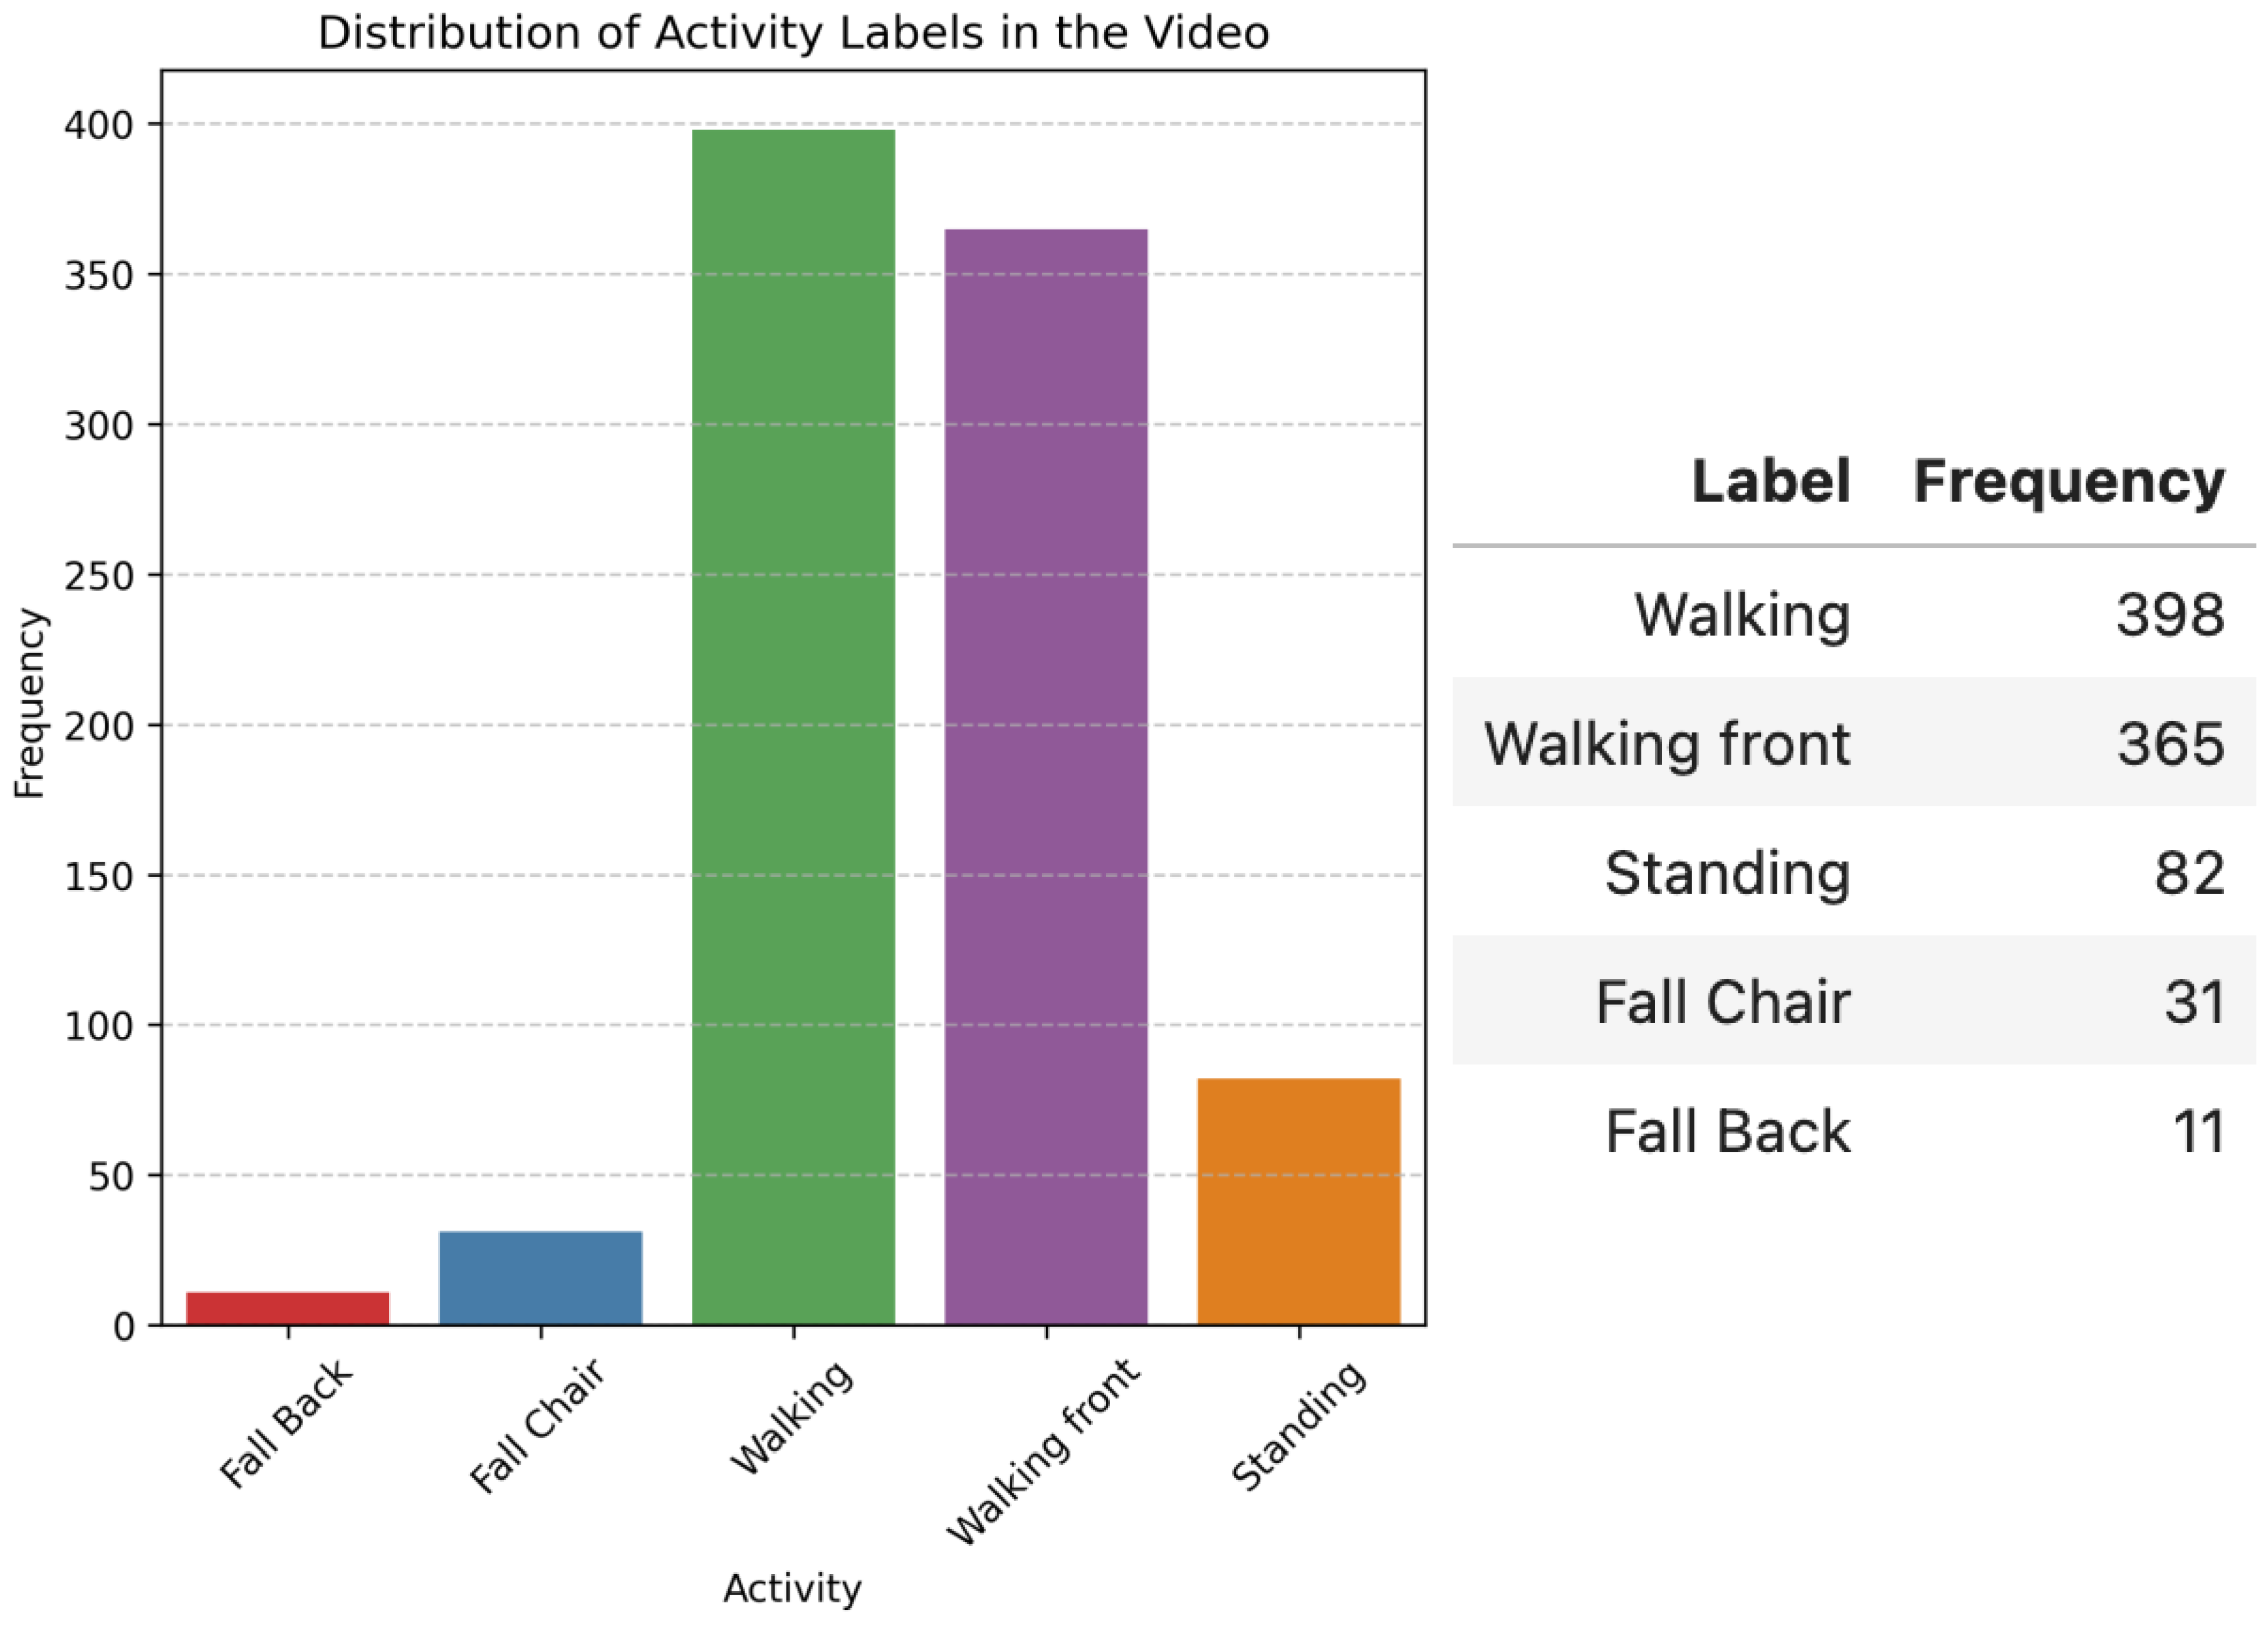
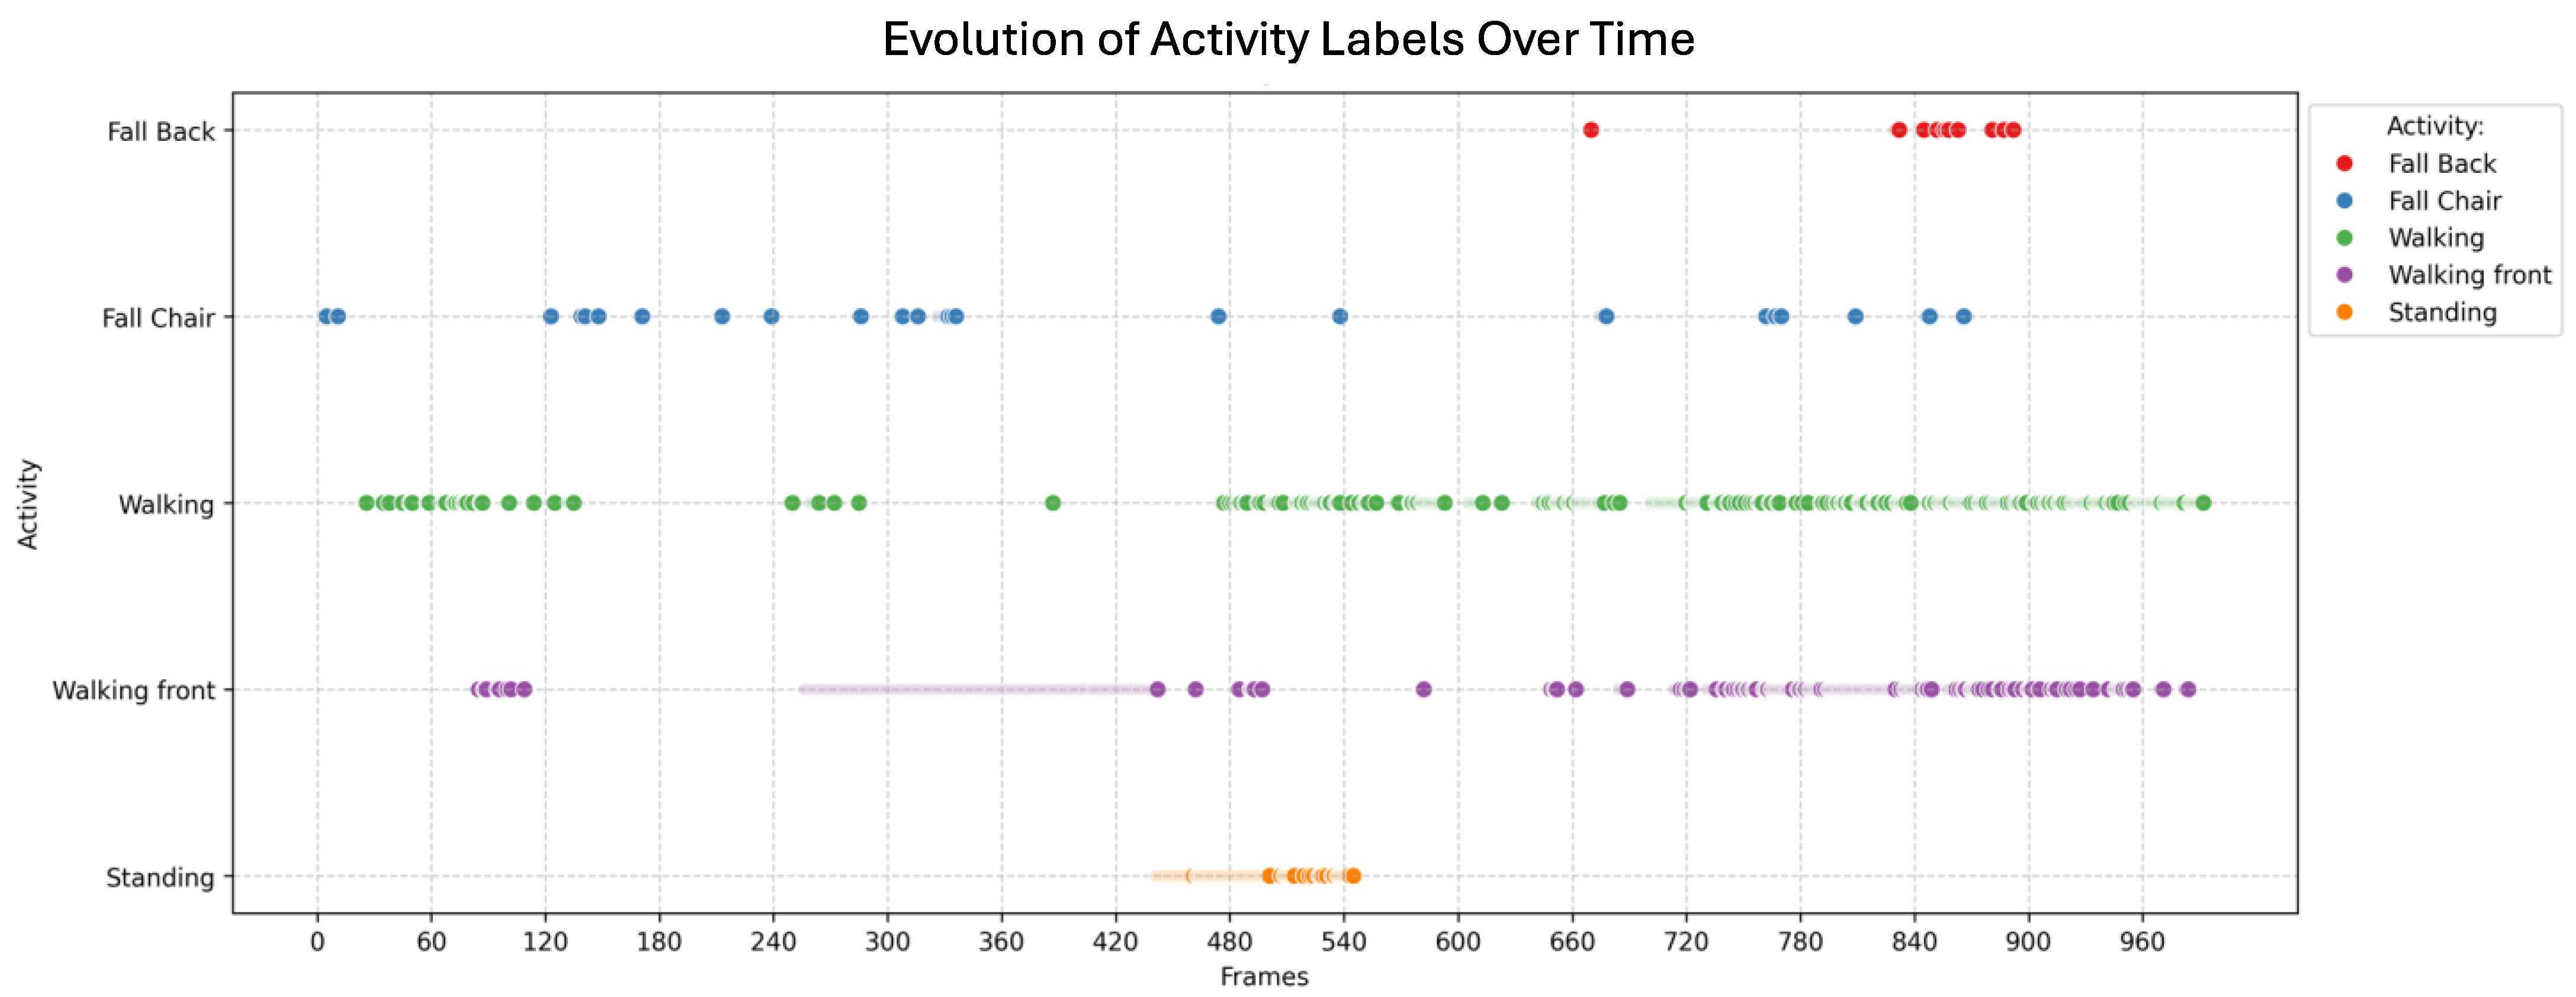
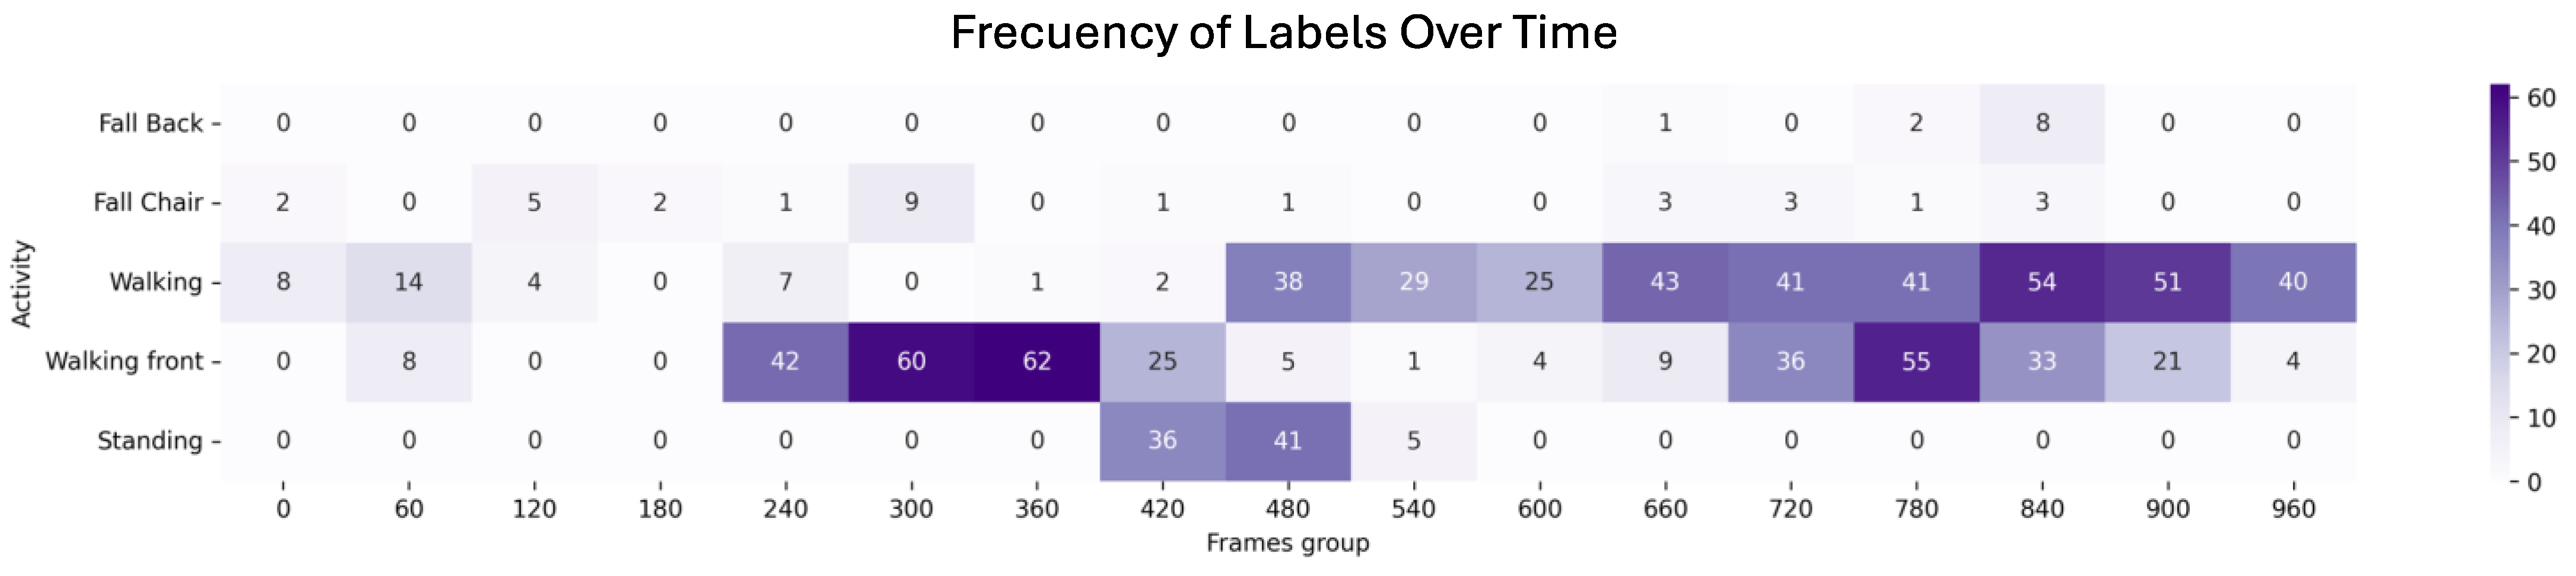
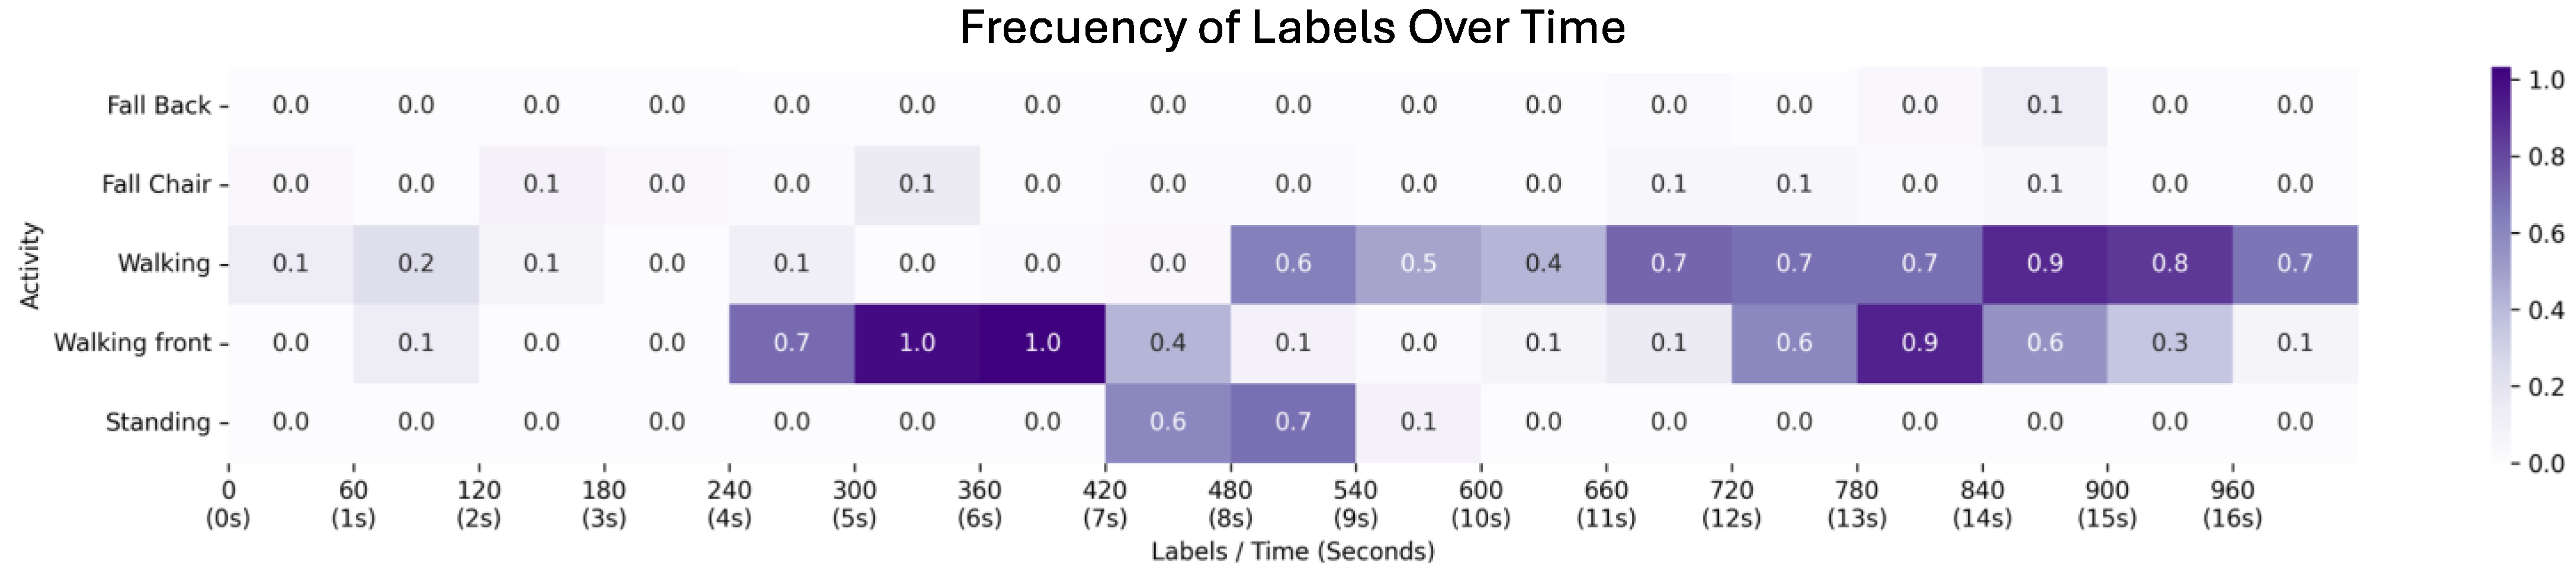
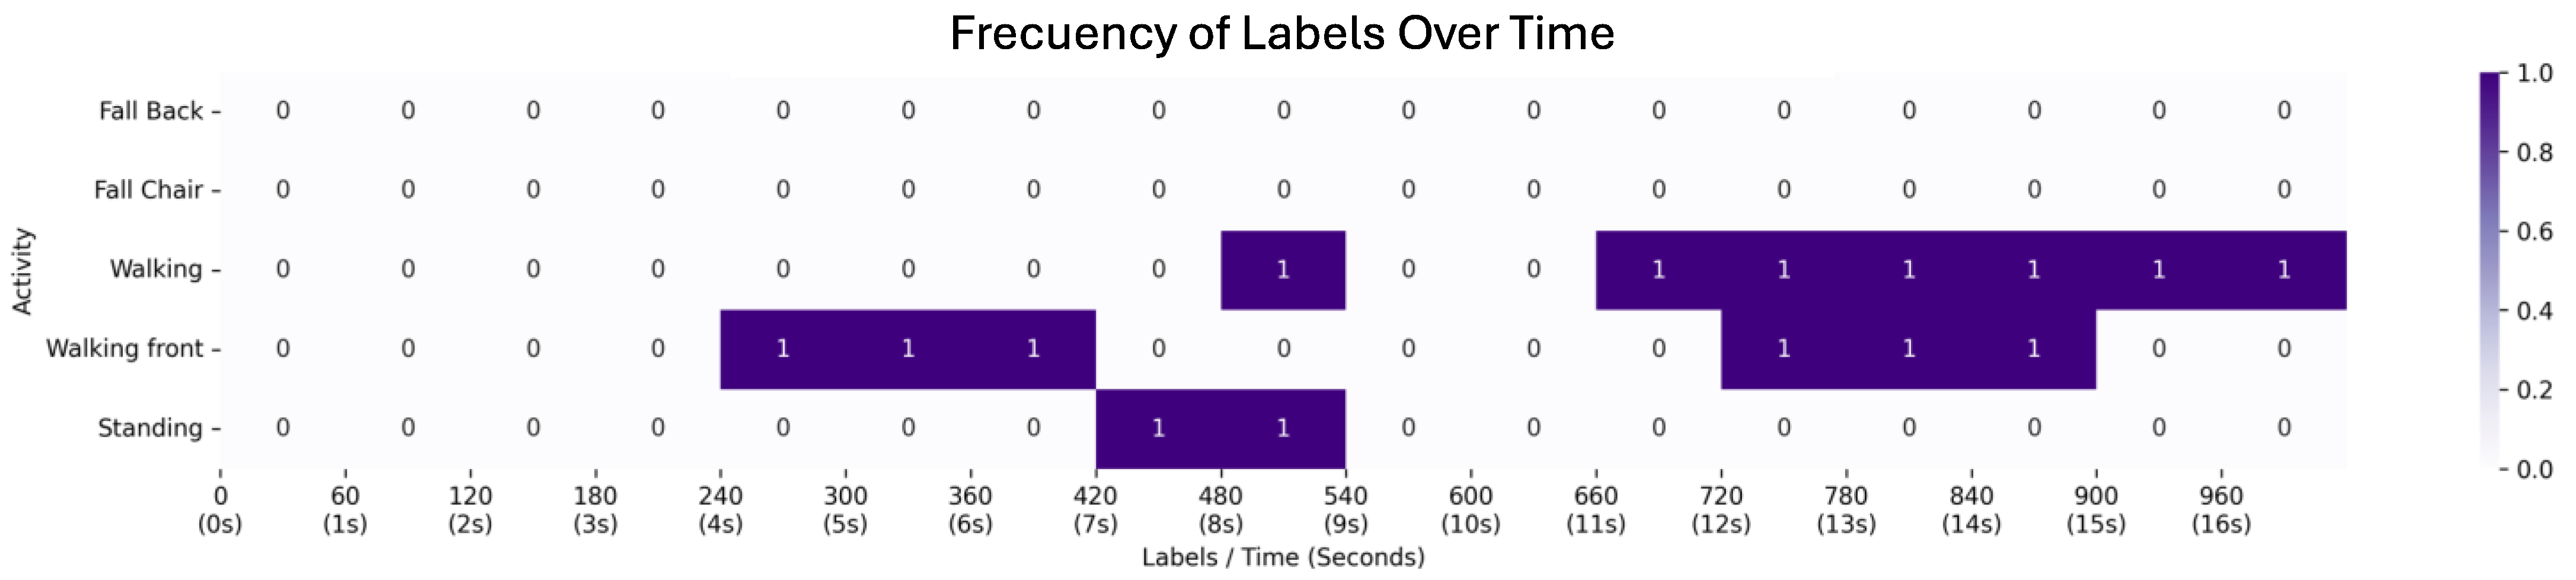
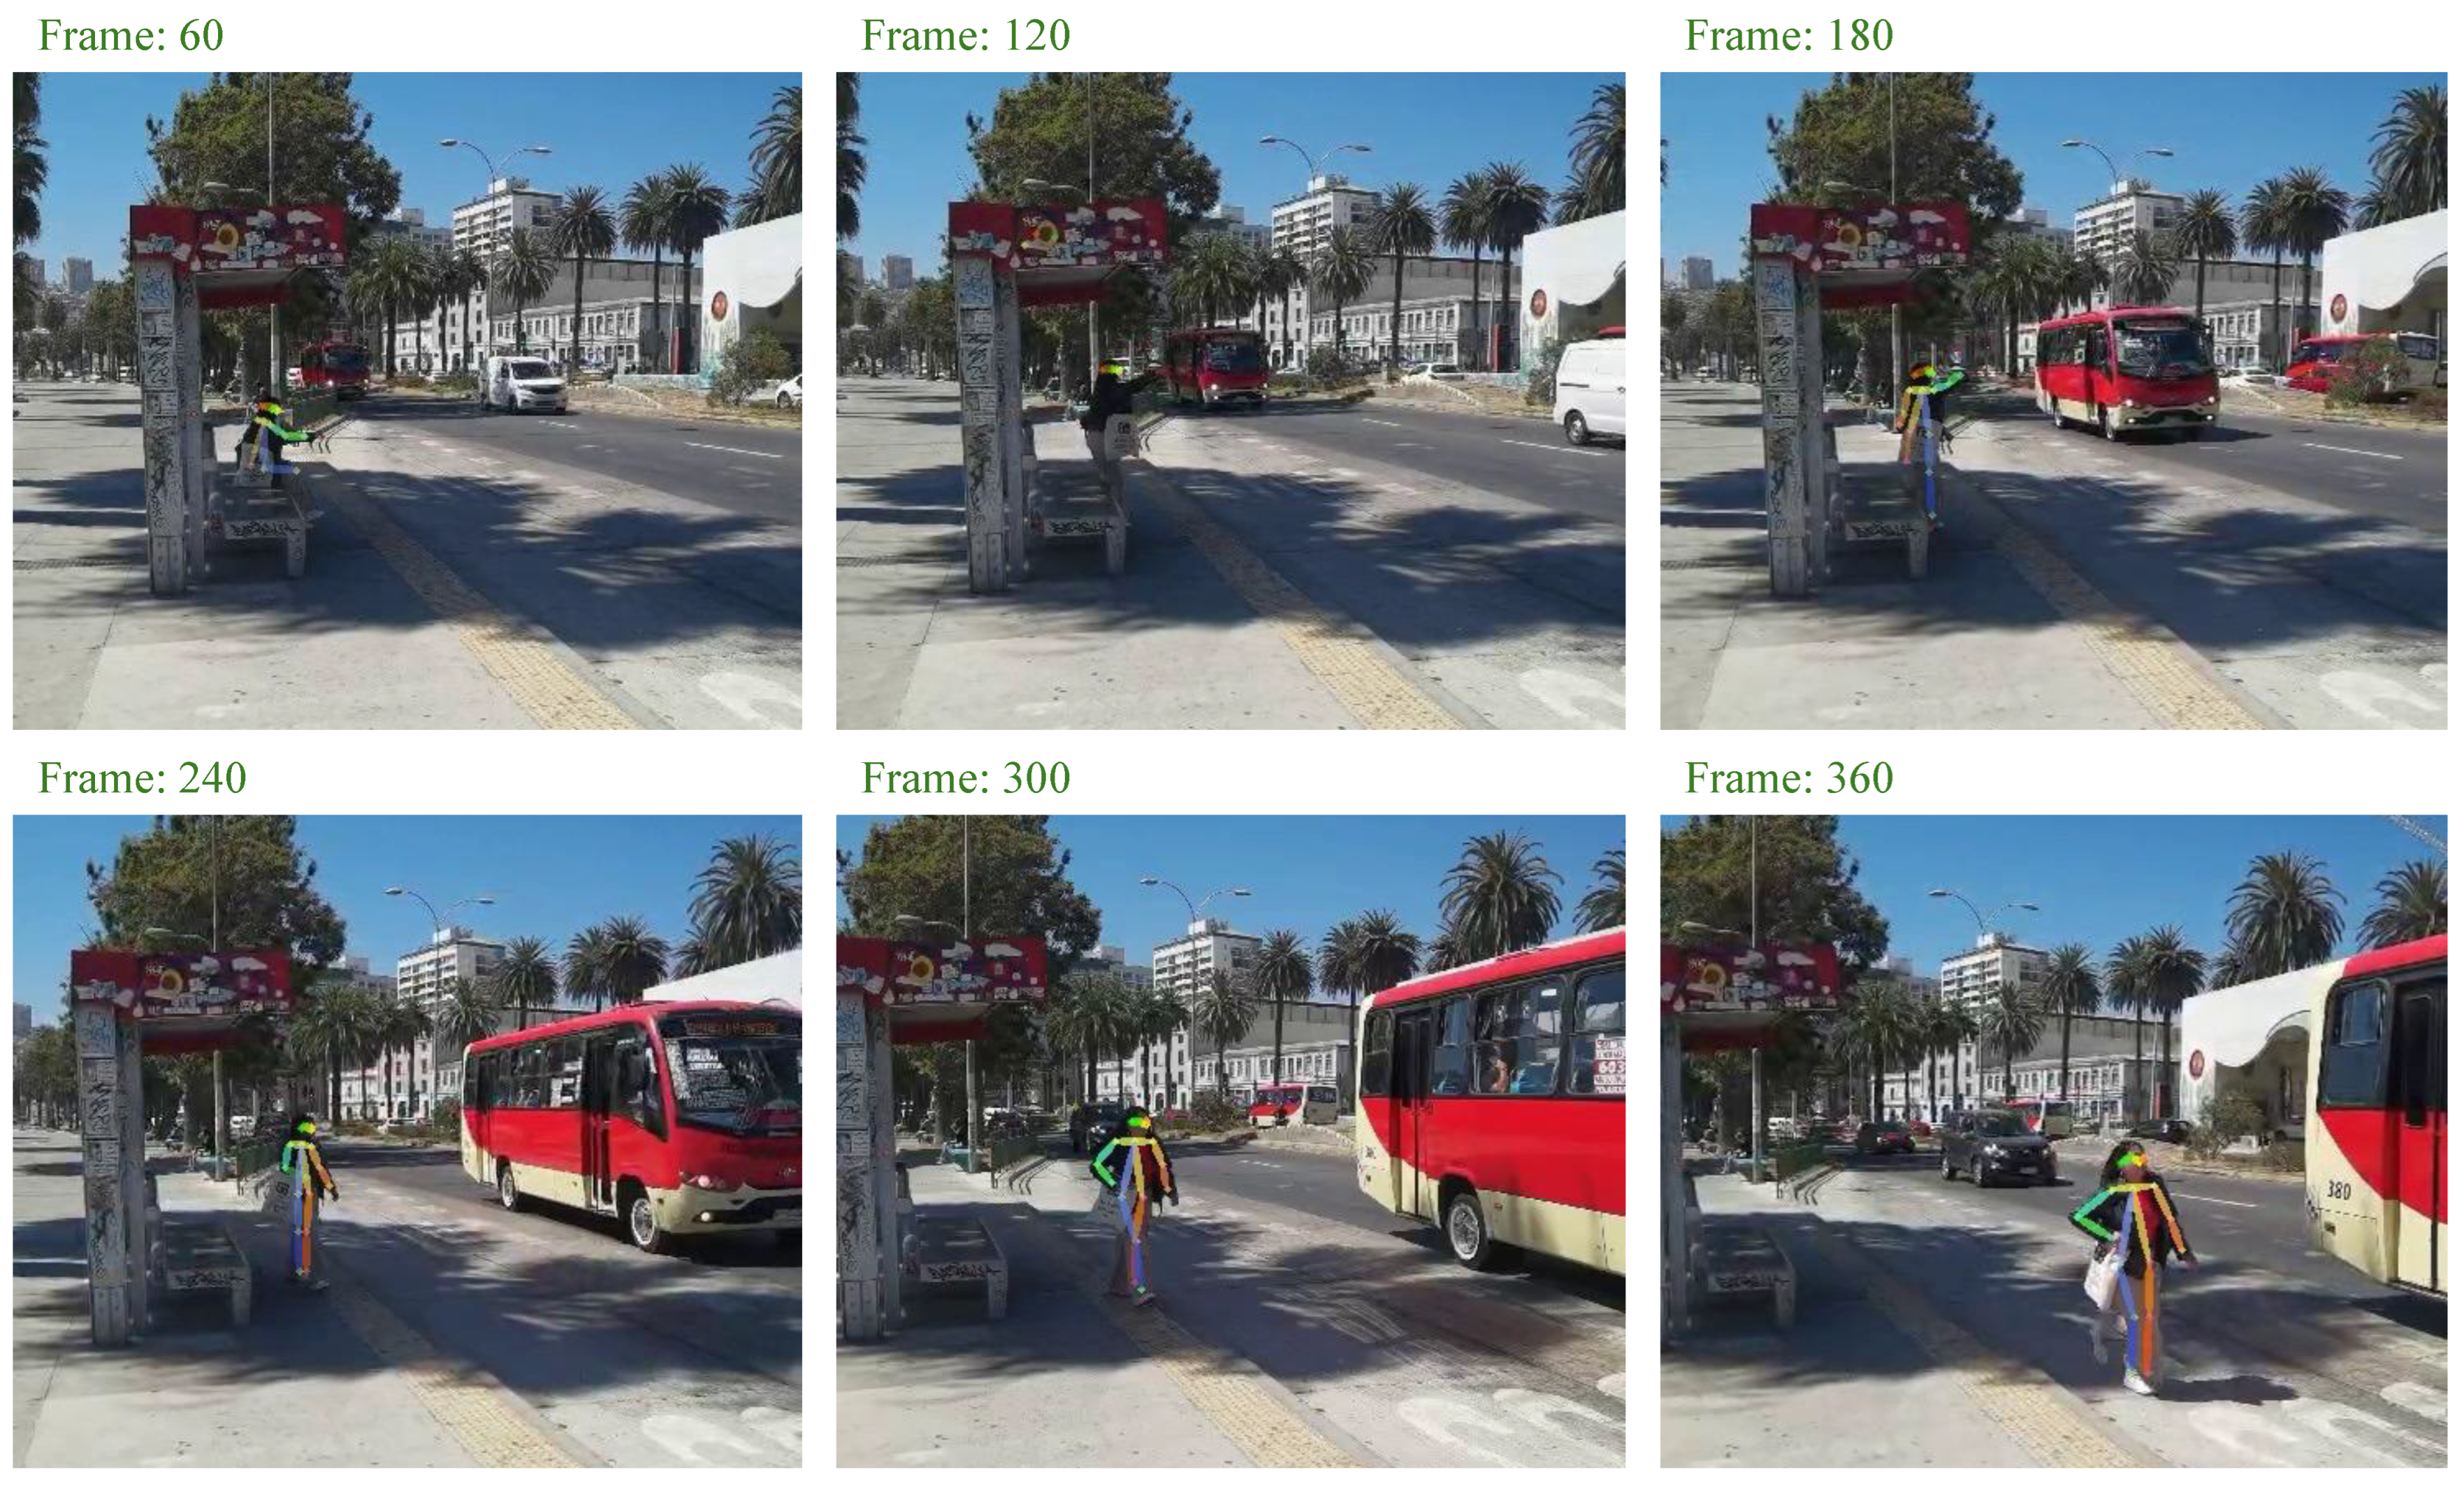
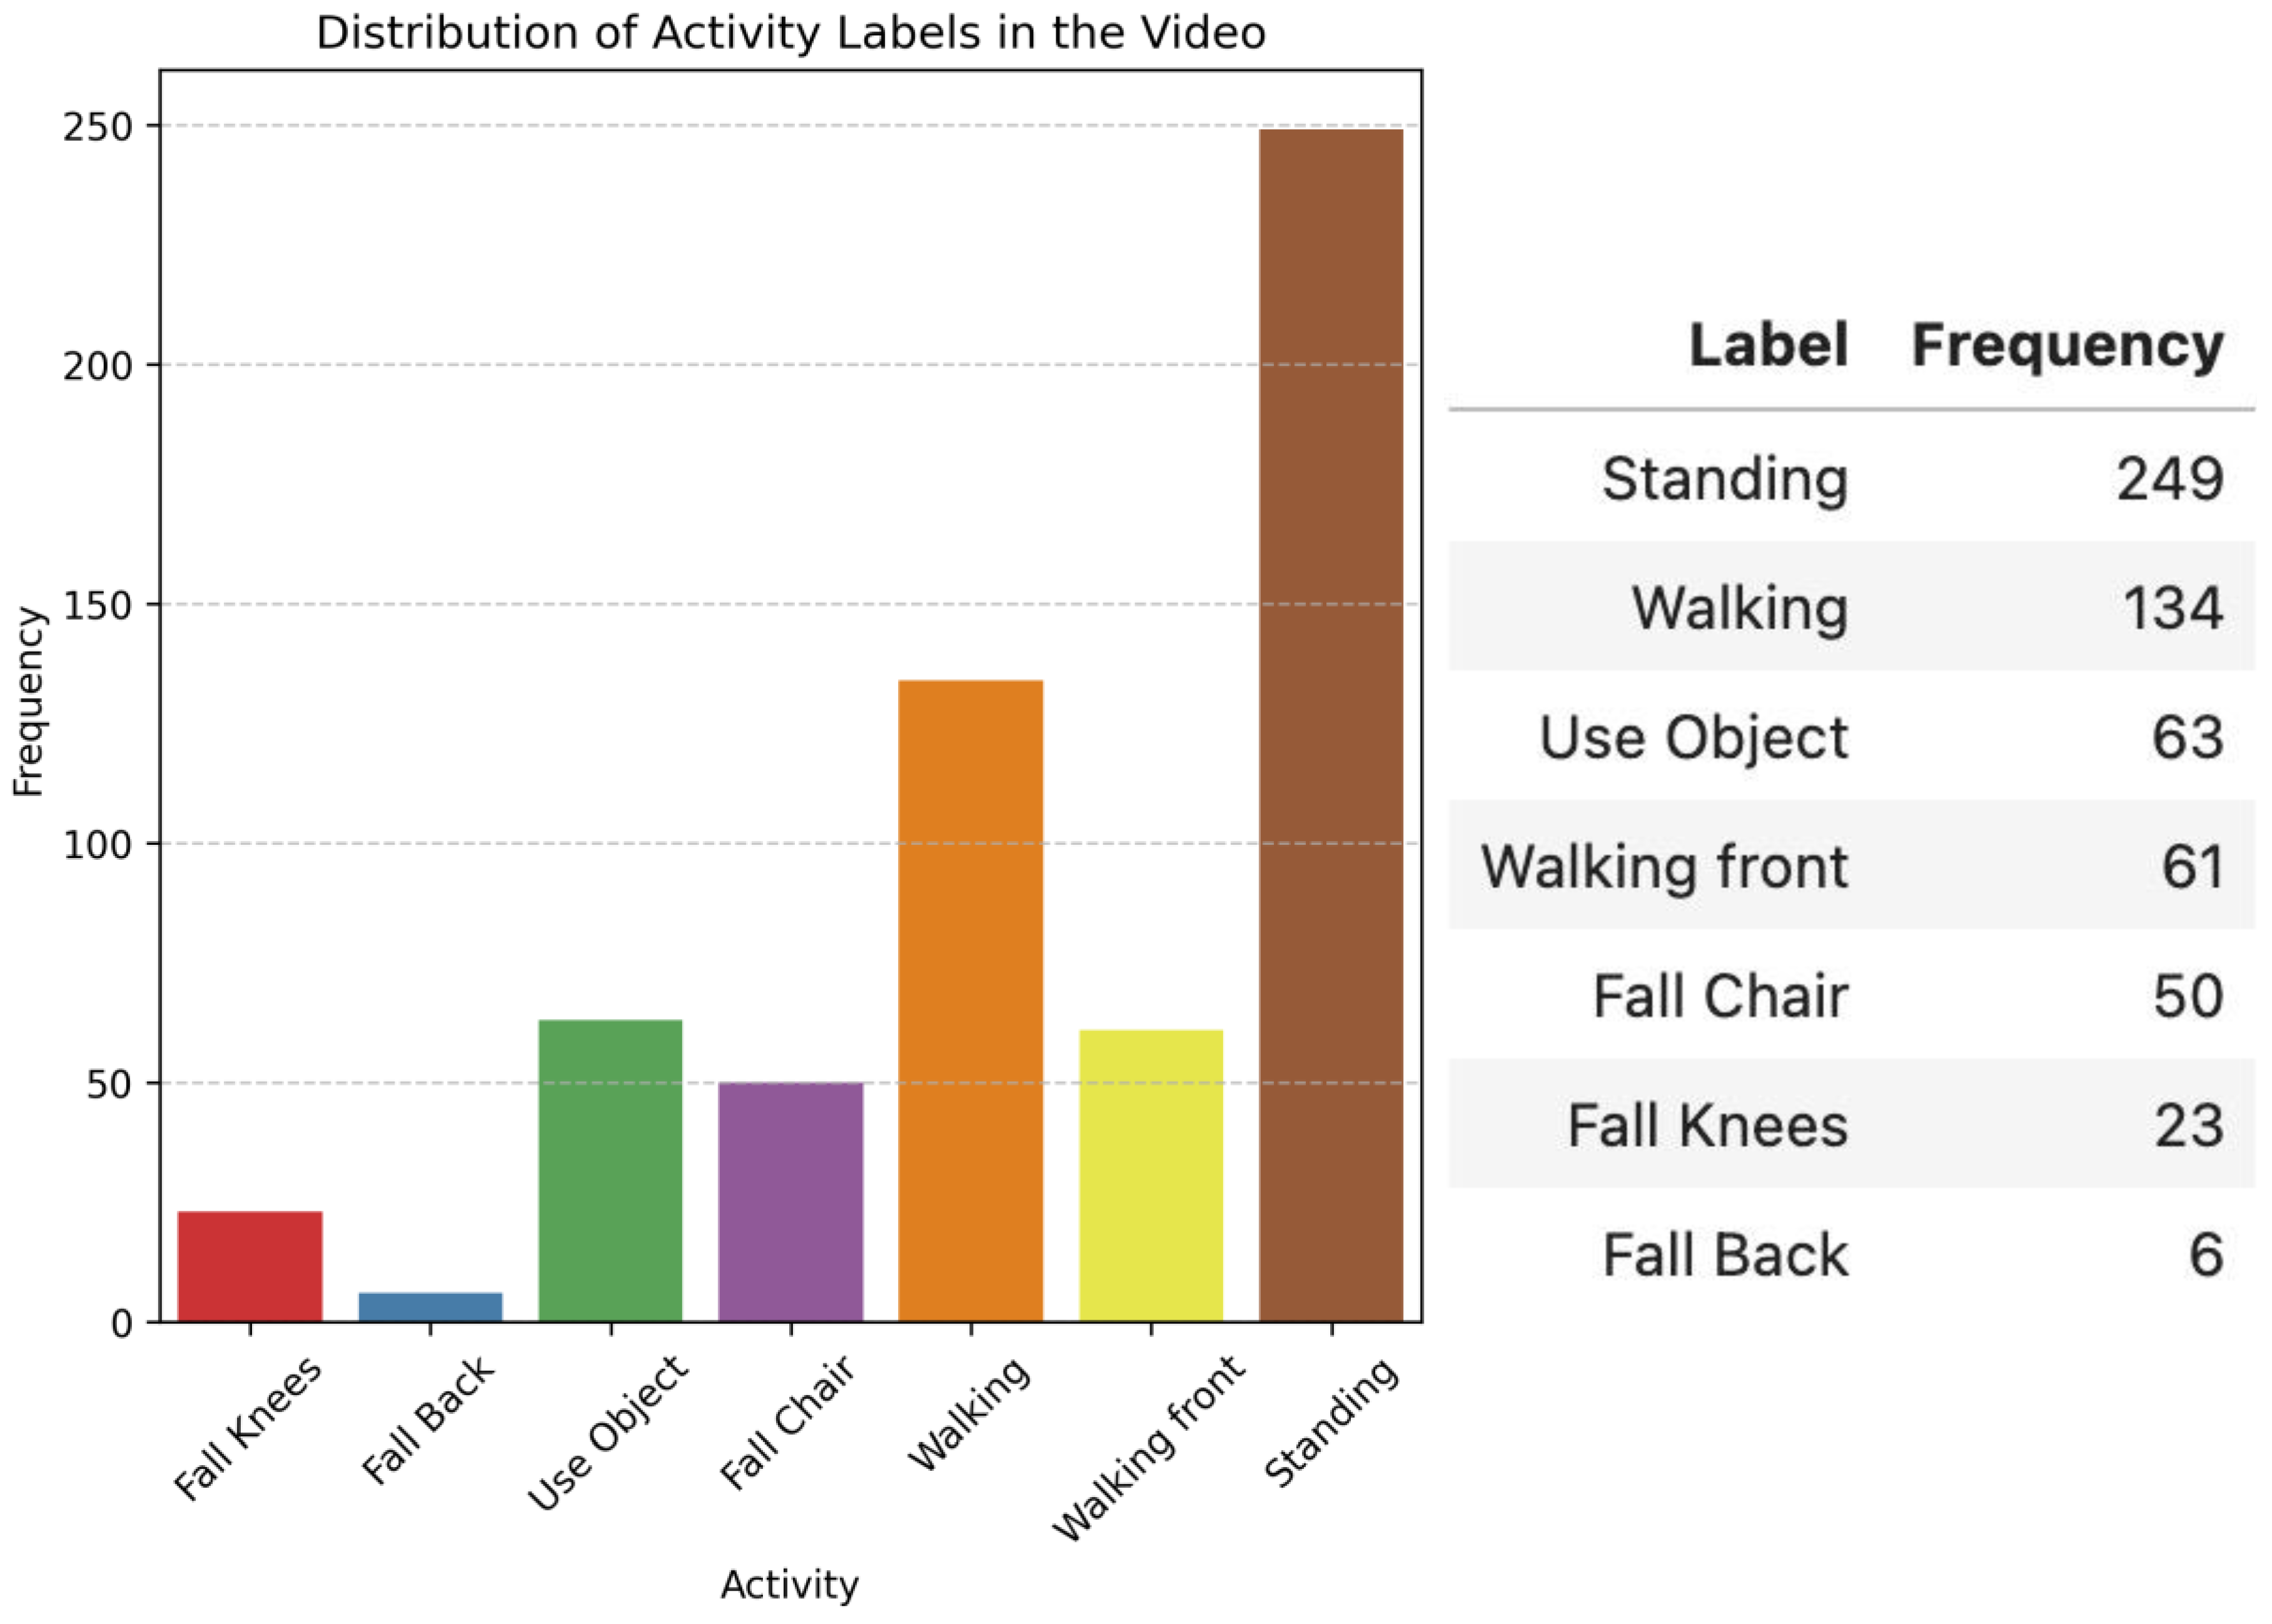
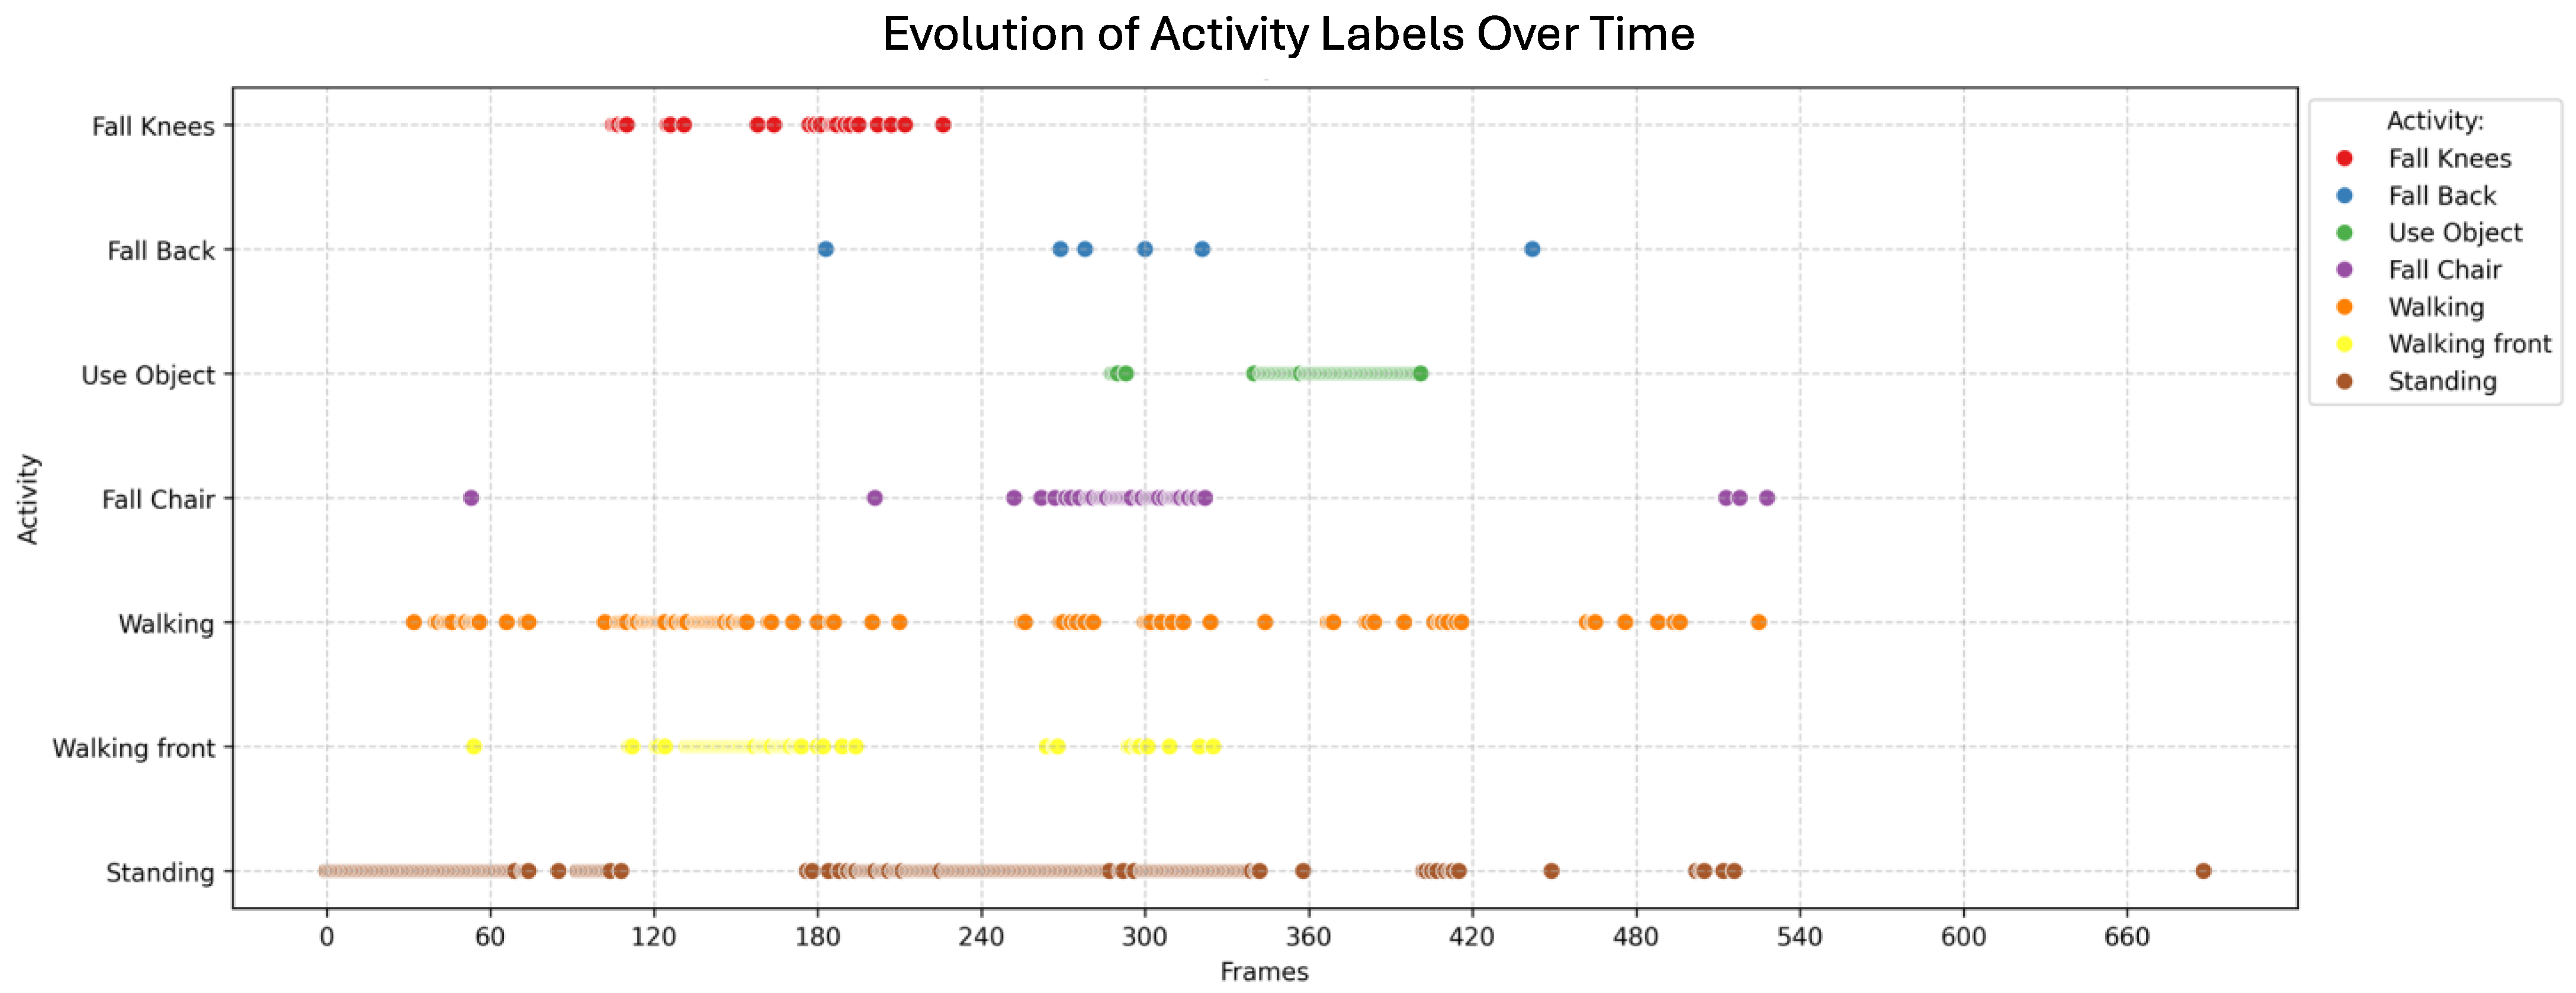
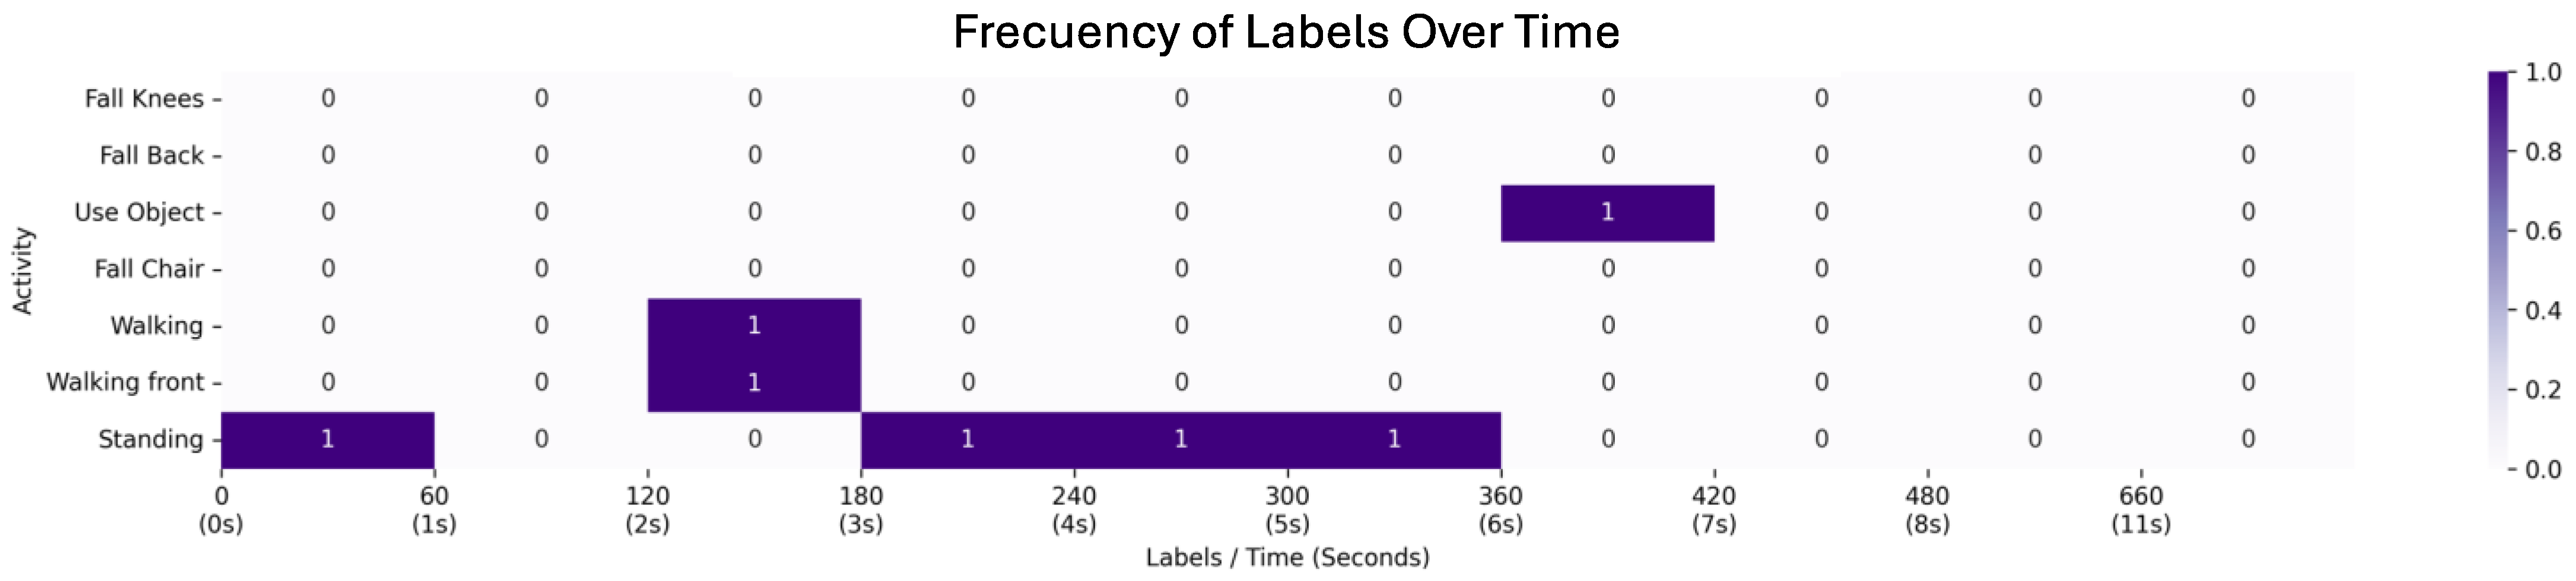
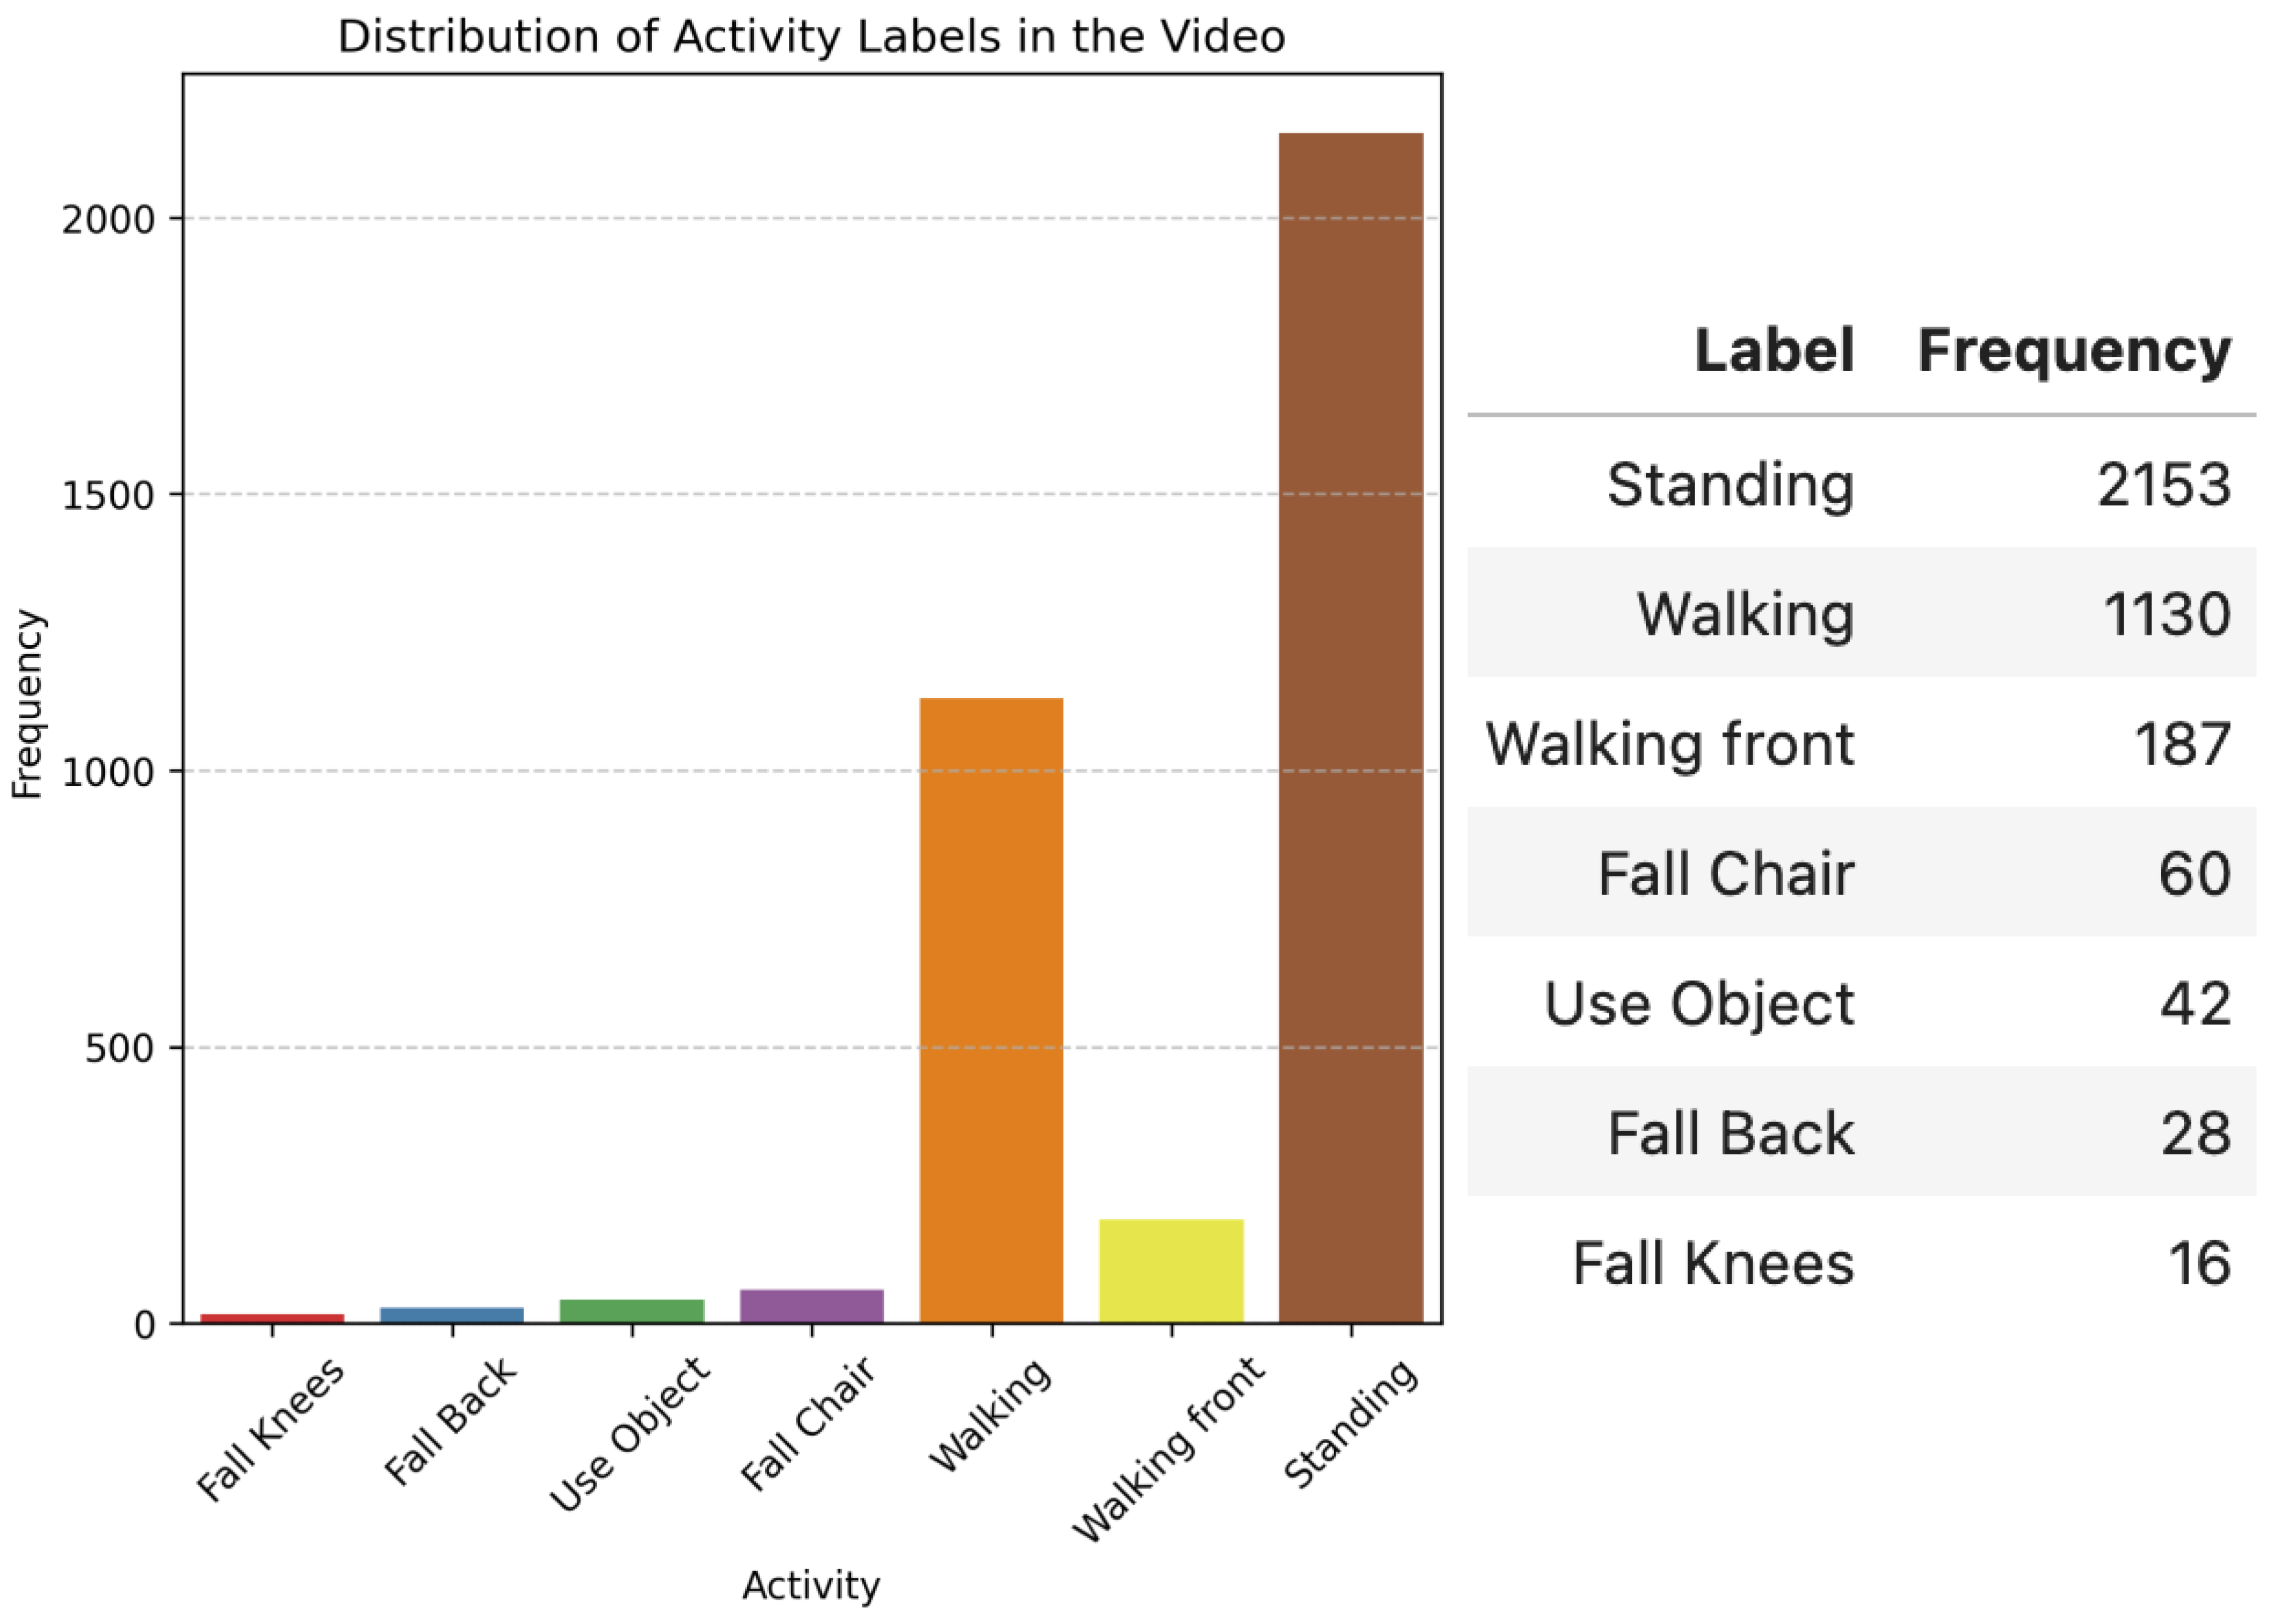
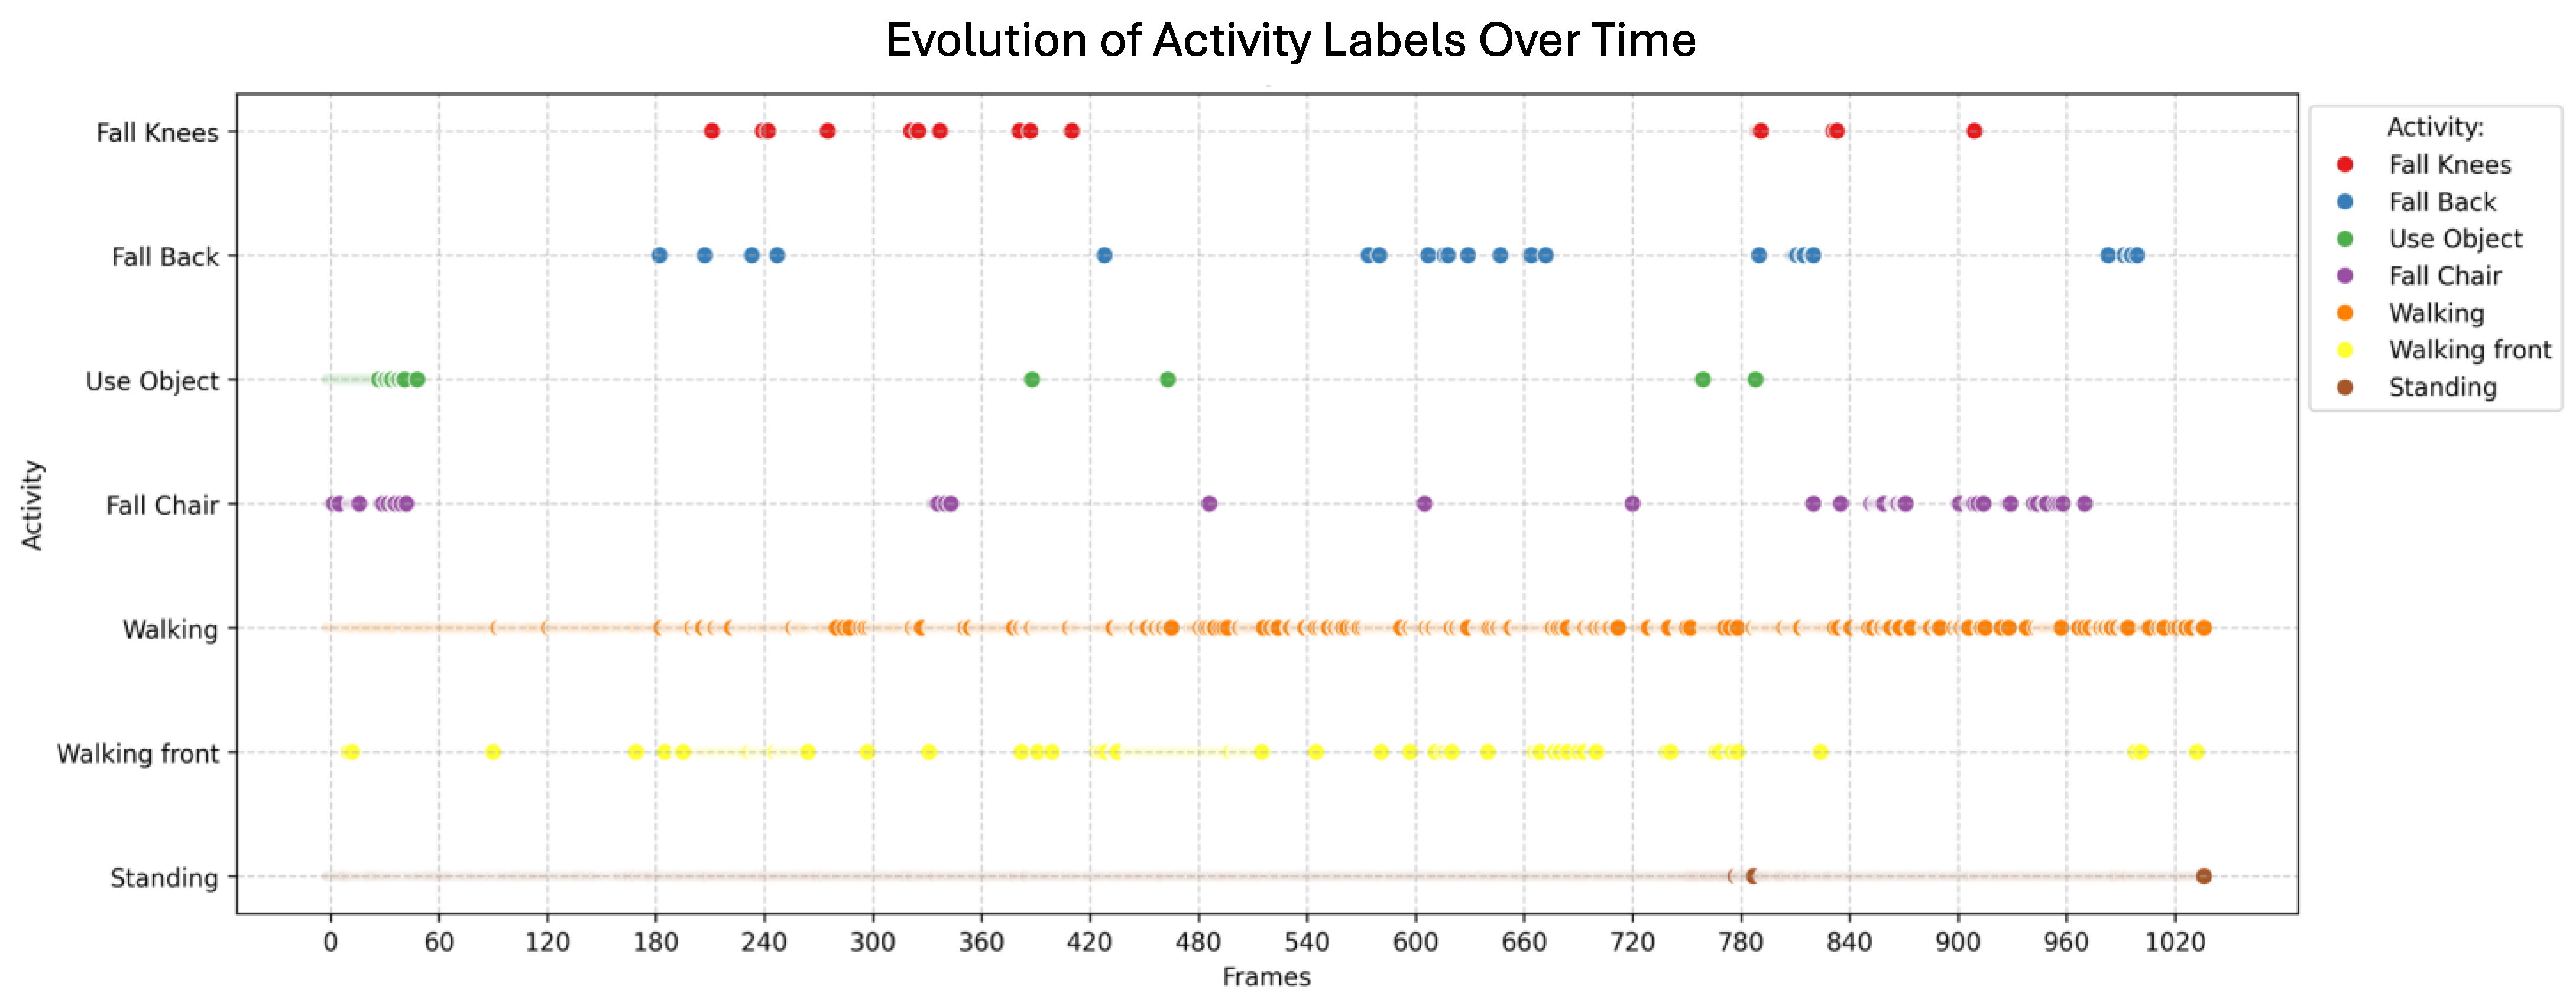
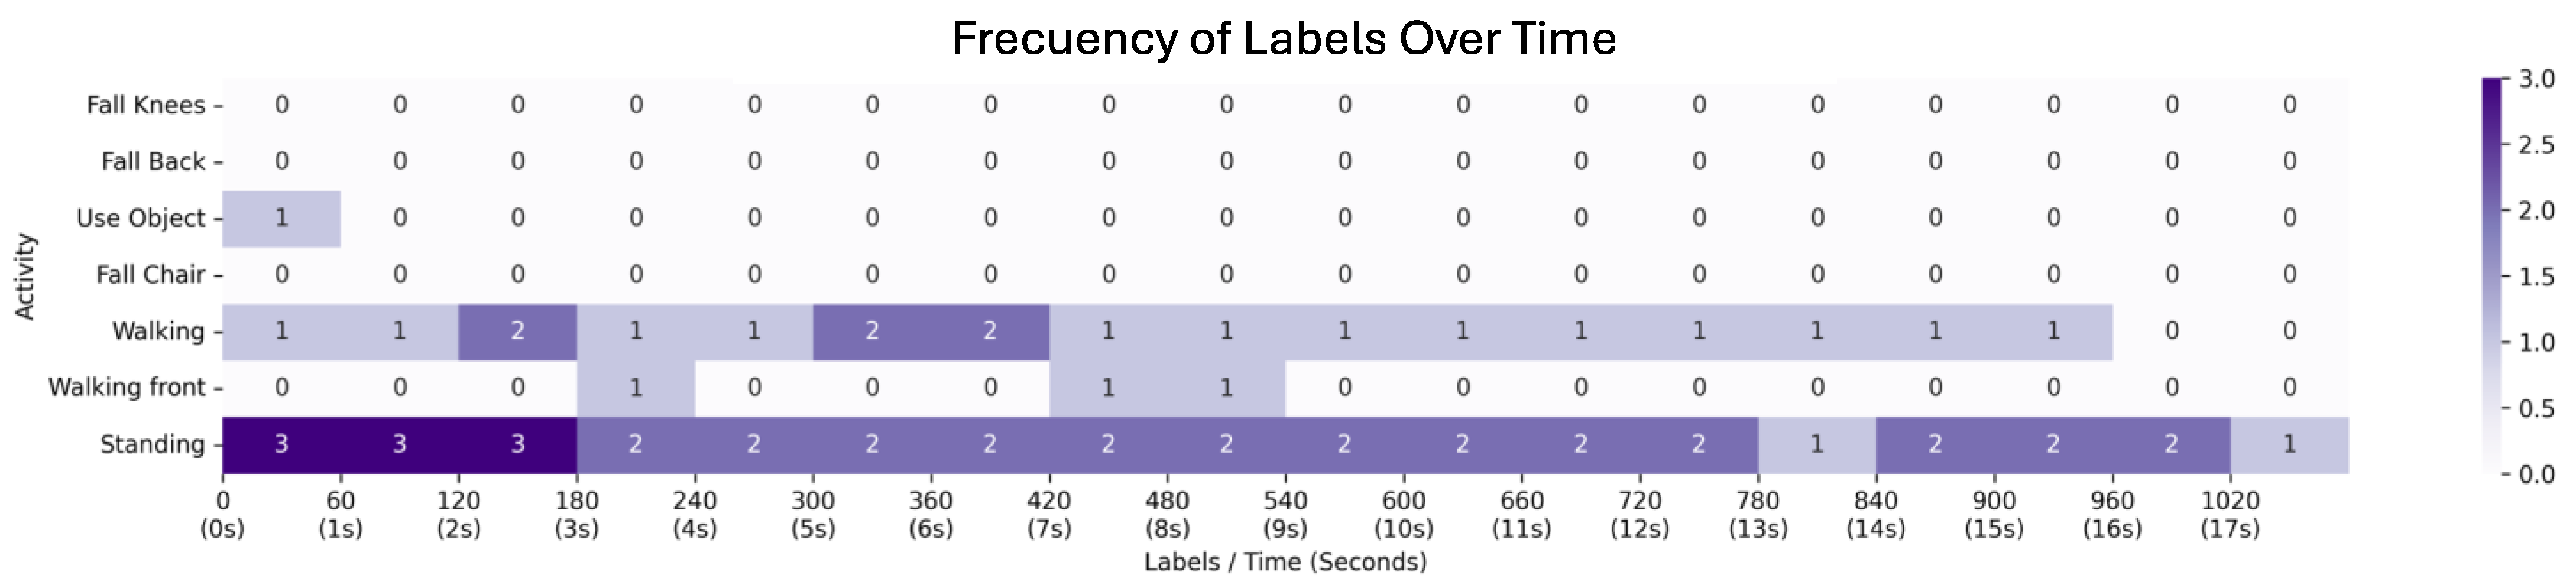
4.3. Third Scenario: Video with Pedestrians Waiting for the Bus

In the third scenario, the video (Figure 16) shows several people waiting for the bus. Additionally, one person walks away from the bus stop, and at certain moments in the video, people are seen getting on the bus (indicated by the red circle in frames 253 and 480 in Figure 16). The dominant activity throughout the video is likely “standing” as people wait for the bus. The model tracked subtle changes in pose, such as adjusting posture or shifting weight, but the general activity remains standing still.
Figure 17 shows the pose estimation for the people present in the video. It can be observed that AlphaPose is able to correctly estimate the skeleton and pose of all the individuals in the video, even when they are far away in the scene or boarding the bus. Additionally, AlphaPose can estimate the pose in frames where there is occlusion from objects or other people, which is crucial for maintaining accuracy in complex, crowded environments like bus stops.
Using pose estimation data and feature vectors, the ML-RF model predicts the activities of each person. Figure 17 illustrates the activities recognized by the model across the video. The model successfully identified 7 activities throughout the video:
  • Knee fall
  • Falling backward
  • Using an object
  • Sitting down on a chair
  • Walking
  • Walking towards the camera
  • Standing
Figure 18 shows the activities performed by all the people in the video for each frame. As we can see, the ML-RF model occasionally recognizes activities that do not actually occur, such as different forms of falling (e.g., falling to the knees or falling backward). These misclassifications can be misleading, especially when the person is simply adjusting their posture or making a small movement, like getting ready to board the bus or shifting their weight. However, the model mistakenly identifies movements like falling when there may be no fall at all. These errors might occur when the person’s pose shifts rapidly, or if there is some form of occlusion (e.g., the person moves behind an object or another person), making the model interpret the movement as a fall.
In some cases, false positives occurred due to AlphaPose estimating poses for individuals who were too far from the camera or partially occluded, leading to incorrect skeletons. These noisy inputs caused the ML-RF model to misclassify activities, especially falls. However, this behavior is not indicative of model overfitting, as the model was trained with limited fall data, used balanced class distributions, and employed 10-fold cross-validation (90:10) to ensure generalization. These errors are primarily due to environmental complexity and limitations in the pose estimation process.
As in the first and second cases, to identify the relevant activities, the predictions made by the ML-RF model are normalized and approximated for every 60 frames (1 s). Activities that do not actually occur in the video, such as “falling”, are given very little weight in each 60-frame block. This helps filter out irrelevant activities and focus on the meaningful actions that are present in the scene.
Figure 19 illustrates the normalized and approximated activities for each second of the video. By visualizing these data, we can see the transitions between the activities that were correctly recognized and those that were likely misclassified. For example, the “falling” activity will have very little weight in the graph, showing that the model detected it as a rare or irrelevant event, whereas activities like standing and walking will have a higher weight, indicating that they occurred more frequently and were accurately identified. This process provides insight into how often certain activities occurred, making it easier to analyze the overall behavior of pedestrians in the video.
Figure 19 shows that in the first 60 frames (the first second of the video), five people are detected in the scene: one person using an object, one person walking, and three people standing. By observing the video frames (Frame 0 in Figure 16), it is verified that the activities recognized by the ML-RF model are correct. Throughout the video, as shown in Figure 16, pedestrians are seen either standing and waiting or walking to board the bus. As illustrated in Figure 19, this is exactly what the ML-RF model predicts—people standing and people walking.
From frame 960 until the end of the video, the ML-RF model correctly predicts that only one or two people remain standing at the bus stop. This is consistent with the real events captured in the video.

5. Conclusions

This study demonstrates the viability of using artificial intelligence techniques for pose detection in public transportation. The combination of AlphaPose with Random Forest enables an accurate analysis of passenger behavior, providing valuable insights for the design of safer and more accessible infrastructures. This study was conducted using video data from a single urban area (Valparaíso, Chile), which, while complex, may not capture the full diversity of public transport scenarios. Future work will include the development of a larger and more diverse dataset specifically designed for human activity recognition in public transportation contexts. Additionally, preliminary tests are being conducted to evaluate the real-time performance of the system using dedicated hardware platforms.
In this paper, three scenarios are tested to be analyzed when applying AlphaPose. In the case of passengers getting off the bus, it can be concluded that the ML-RF model does identify some erroneous activities, which can be considered outliers since they do not have enough weight to be considered relevant. These activities are typically brief misclassifications that are filtered out due to their low relevance (weights close to 0). Additionally, false positives—such as the incorrect recognition of falls—were mainly caused by unreliable skeletal estimation under occlusions or when the subjects were very far from the camera. These errors are considered a limitation of the pose estimation stage rather than the classification model itself.
On the other hand, the model is capable of correctly recognizing the activities that take place at the appropriate time intervals, demonstrating that it can accurately track human motion in certain contexts.
This performance highlights the balance between accurately identifying relevant activities and filtering out noise. The outliers that are considered irrelevant can be ignored, while the model successfully classifies the significant events in the video.
One limitation identified is the misclassification of unfamiliar activities, such as ‘running’, which were not included in the training dataset. This results in incorrect labeling as similar activities (e.g., ‘standing’). When passengers are running to get the bus, AlphaPose fails to estimate the pose of the person for just 1 s of the video; however, the ML-RF model is still able to correctly identify key activities such as “standing” and “walking” at the appropriate times. In addition, when the model encounters an activity it has not been trained on (like “running”), it predicts it as a similar activity, in this case, “standing”. This demonstrates that the model has the capability to handle situations where it encounters unfamiliar activities by categorizing them under the most similar ones it has been trained on. Future work should include a broader range of activity classes during training to overcome this limitation.
In the case of passengers waiting for the bus, the results demonstrate that the ML-RF model successfully recognized all the activities in the video, such as standing and walking, at the correct time intervals. It shows that the model can accurately track the behavior of pedestrians as they wait for the bus or move towards it. Additionally, AlphaPose effectively detected all the people in the video, correctly estimating the skeleton and pose of everyone, even in crowded scenes or when they interacted with the bus. The model was able to maintain high accuracy despite potential challenges like occlusions or varying distances from the camera.
This behavior shows the strength of the system in dealing with common activities but also highlights a limitation: when faced with unfamiliar actions (like running), it can only fall back on similar activities. To improve the model, it could be trained with more activity types, such as running, to better recognize these movements and provide more accurate predictions.
As a future direction, it is proposed to incorporate deep learning models to improve the accuracy and generalization of the system. Deep learning could potentially enhance the model’s ability to handle more complex scenarios, such as varied lighting conditions, occlusions, or less common activities, leading to better overall performance in real-world applications.
The current combination of AlphaPose and Random Forest offers a powerful tool for understanding and improving the public transport experience, particularly by identifying passenger postures and activities in real time. The integration of deep learning will likely push this approach to the next level, making it even more robust in diverse and dynamic environments.

Author Contributions

Conceptualization, V.A., A.P., G.F. and S.S.; methodology, H.R. and S.S.; software, H.R.; validation, S.S. and G.F.; formal analysis, H.R.; investigation, V.A., A.P., G.F. and S.S.; resources, A.P.; data curation, B.A. and I.B.; writing—original draft preparation, S.S.; writing—review and editing, H.R.; visualization, B.A. and I.B.; supervision, V.A., A.P., G.F. and S.S.; project administration, S.S.; funding acquisition, S.S. All authors have read and agreed to the published version of the manuscript.

Funding

This research received no external funding.

Institutional Review Board Statement

The study was conducted in accordance with the Declaration of Helsinki and approved by the Institutional Review Board (or Ethics Committee) of Pontificia Universidad Católica de Valparaiso, Chile (protocol code BIOEPUCV-H 548-2022 and date of approval 3 October 2022).

Informed Consent Statement

Not applicable.

Data Availability Statement

The raw data supporting the conclusions of this article will be made available by the authors on request.

Acknowledgments

The authors would like to thank all researchers from the Mobility and Transport Laboratory at Pontificia Universidad Católica de Valparaiso, Chile.

Conflicts of Interest

The authors declare no conflicts of interest.

References

  1. Patni, S.; Srinivasan, S. Modeling boardings and alightings by route at transit stops. Public Transp. 2025, 1–29. [Google Scholar] [CrossRef]
  2. Warchoł-Jakubowska, A.; Szwoch, I.; Szczeciński, P.; Krejtz, I.; Krejtz, K. Accessible Public Transport: A Case Study of Warsaw. In Transforming Media Accessibility in Europe; Springer: Cham, Switzerland, 2024; pp. 21–38. [Google Scholar] [CrossRef]
  3. Yendra, D.; Haworth, N.; Watson-Brown, N. A comparison of factors influencing the safety of pedestrians accessing bus stops in countries of differing income levels. Accid. Anal. Prev. 2024, 207, 107725. [Google Scholar] [CrossRef]
  4. Gumasing, M.J.J.; Prasetyo, Y.T.; Ong, A.K.S.; Carcellar, M.R.I.M.; Aliado, J.B.J.; Nadlifatin, R.; Persada, S.F. Ergonomic design of apron bus with consideration for passengers with mobility constraints. Safety 2022, 8, 33. [Google Scholar] [CrossRef]
  5. Kaitaro, K.K.; Budiman, I.A.; Sahroni, T.R. Analysis and Assessment of Passenger Comfort Level in Sustainable Public Bus Transportation System. In Proceedings of the IOP Conference Series: Earth and Environmental Science, Banjarbaru, Indonesia, 5–6 October 2024; IOP Publishing: Bristol, UK, 2024; Volume 1324, p. 012067. [Google Scholar]
  6. Drabicki, A.; Cats, O.; Kucharski, R.; Fonzone, A.; Szarata, A. Should I stay or should I board? Willingness to wait with real-time crowding information in urban public transport. Res. Transp. Bus. Manag. 2023, 47, 100963. [Google Scholar] [CrossRef]
  7. Ramirez, H.; Velastin, S.A.; Meza, I.; Fabregas, E.; Makris, D.; Farias, G. Fall detection and activity recognition using human skeleton features. IEEE Access 2021, 9, 33532–33542. [Google Scholar] [CrossRef]
  8. Garcia, G.; Velastin, S.A.; Lastra, N.; Ramirez, H.; Seriani, S.; Farias, G. Train station pedestrian monitoring pilot study using an artificial intelligence approach. Sensors 2024, 24, 3377. [Google Scholar] [CrossRef]
  9. Hörcher, D.; Tirachini, A. A review of public transport economics. Econ. Transp. 2021, 25, 100196. [Google Scholar] [CrossRef]
  10. Andrade, A.; Escudero, M.; Parker, J.; Bartolucci, C.; Seriani, S.; Aprigliano, V. Perceptions of people with reduced mobility regarding universal accessibility at bus stops: A pilot study in Santiago, Chile. Case Stud. Transp. Policy 2024, 16, 101190. [Google Scholar] [CrossRef]
  11. Tirachini, A. Bus dwell time: The effect of different fare collection systems, bus floor level and age of passengers. Transp. A Transp. Sci. 2013, 9, 28–49. [Google Scholar] [CrossRef]
  12. Fernández, R.; Zegers, P.; Weber, G.; Tyler, N. Influence of platform height, door width, and fare collection on bus dwell time: Laboratory evidence for Santiago de Chile. Transp. Res. Rec. 2010, 2143, 59–66. [Google Scholar] [CrossRef]
  13. Ittamalla, R.; Kumar, D.V.S. Determinants of holistic passenger experience in public transportation: Scale development and validation. J. Retail. Consum. Serv. 2021, 61, 102564. [Google Scholar] [CrossRef]
  14. Vitale Brovarone, E. Design as if bus stops mattered: Exploring the potential role of public transport stops in the urban environment. Urban Des. Int. 2021, 26, 82–96. [Google Scholar] [CrossRef]
  15. Liu, K.; Lin, X.; Xu, J.; Ma, F.; Yang, W.; Cao, R.; Hu, X.; Wei, Y.; Jiang, L.; Wang, Z. Investigating the influence of platform design on the distribution of traffic particulate matter at the bus stop. Build. Environ. 2024, 255, 111395. [Google Scholar] [CrossRef]
  16. Hosseini, S.H.; Pourkhosro, S.; Gentile, G.; Miristice, L.M.B. GPS-based trip phase and waiting time detection to and from public transport stops via machine learning models. Transp. Res. Procedia 2024, 78, 530–537. [Google Scholar] [CrossRef]
  17. Shi, Y.; Zhang, C.; Zhang, L.; Yang, X. Optimal bus service frequency setting and limited-stop operation with varying vehicle capacity limit. Comput. Electr. Eng. 2024, 118, 109356. [Google Scholar] [CrossRef]
  18. Xu, J.; Yu, S.S. Assessing the time-varying spatial influence of bus stops on crime by context: A street network analysis. Secur. J. 2025, 38, 19. [Google Scholar] [CrossRef]
  19. Jevinger, Å.; Zhao, C.; Persson, J.A.; Davidsson, P. Artificial intelligence for improving public transport: A mapping study. Public Transp. 2024, 16, 99–158. [Google Scholar] [CrossRef]
  20. Lian, T.; Loo, B.P.; Fan, Z. Advances in estimating pedestrian measures through artificial intelligence: From data sources, computer vision, video analytics to the prediction of crash frequency. Comput. Environ. Urban Syst. 2024, 107, 102057. [Google Scholar] [CrossRef]
  21. Singh, N.; Kumar, K. A review of bus arrival time prediction using artificial intelligence. Wiley Interdiscip. Rev. Data Min. Knowl. Discov. 2022, 12, e1457. [Google Scholar] [CrossRef]
  22. Mahor, V.; Rawat, R.; Kumar, A.; Garg, B.; Pachlasiya, K. IoT and artificial intelligence techniques for public safety and security. In Smart Urban Computing Applications; River Publishers: Aalborg, Denmark, 2023; pp. 111–126. [Google Scholar]
  23. Nguyen, T.; Nguyen-Phuoc, D.Q.; Wong, Y.D. Developing artificial neural networks to estimate real-time onboard bus ride comfort. Neural Comput. Appl. 2021, 33, 5287–5299. [Google Scholar] [CrossRef]
  24. Liyanage, S.; Abduljabbar, R.; Dia, H.; Tsai, P.W. AI-based neural network models for bus passenger demand forecasting using smart card data. J. Urban Manag. 2022, 11, 365–380. [Google Scholar] [CrossRef]
  25. Kong, X.; Shen, Z.; Wang, K.; Shen, G.; Fu, Y. Exploring bus stop mobility pattern: A multi-pattern deep learning prediction framework. IEEE Trans. Intell. Transp. Syst. 2024, 25, 6604–6616. [Google Scholar] [CrossRef]
  26. Breiman, L. Random forests. Mach. Learn. 2001, 45, 5–32. [Google Scholar] [CrossRef]
  27. Espinosa-Zúñiga, J.J. Aplicación de algoritmos Random Forest y XGBoost en una base de solicitudes de tarjetas de crédito. Ing. Investig. Y Tecnología 2020, 21, 2000. [Google Scholar] [CrossRef]
  28. Martínez-Villaseñor, L.; Ponce, H.; Brieva, J.; Moya-Albor, E.; Núñez-Martínez, J.; Peñafort-Asturiano, C. UP-fall detection dataset: A multimodal approach. Sensors 2019, 19, 1988. [Google Scholar] [CrossRef]
  29. Sase, P.S.; Bhandari, S.H. Human fall detection using depth videos. In Proceedings of the 2018 5th International Conference on Signal Processing and Integrated Networks (SPIN), Noida, India, 22–23 February 2018; IEEE: New York, NY, USA, 2018; pp. 546–549. [Google Scholar]
Figure 1. Skeletonization for pose estimation of a passenger getting off an urban bus in Valparaíso, Chile.
Applsci 15 05367 g001
Figure 2. Diagram of the Random Forest algorithm.
Applsci 15 05367 g002
Figure 3. Workflow for activity prediction.
Applsci 15 05367 g003
Figure 4. Workflow for activity prediction using AlphaPose and Random Forest (RF) ML model.
Applsci 15 05367 g004
Figure 5. Passenger getting off a bus in Valparaíso, Chile.
Applsci 15 05367 g005
Figure 6. Passenger getting off a taxi in Valparaíso, Chile.
Applsci 15 05367 g006
Figure 7. Frequency of activities recognized by the ML-RF model throughout the video.
Applsci 15 05367 g007
Figure 8. Activity recognition performed by people in the video over time.
Applsci 15 05367 g008
Figure 9. Grouping of activities recognized every 60 frames (1 s).
Applsci 15 05367 g009
Figure 10. Normalized grouping of activities recognized per 60 frames (1 s).
Applsci 15 05367 g010
Figure 11. Significantly recognized activities for each second of the video.
Applsci 15 05367 g011
Figure 12. Passenger running to get on the bus in Valparaíso, Chile.
Applsci 15 05367 g012
Figure 13. Frequency of activities recognized by the ML-RF model throughout the video.
Applsci 15 05367 g013
Figure 14. Activity recognition performed by people in the video over time.
Applsci 15 05367 g014
Figure 15. Significantly recognized activities for each second of the video.
Applsci 15 05367 g015
Figure 16. Pedestrians waiting for the bus at a typical Valparaíso bus stop.
Applsci 15 05367 g016
Figure 17. Frequency of activities recognized by the ML-RF model throughout the video.
Applsci 15 05367 g017
Figure 18. Activity recognition performed by people in the video over time.
Applsci 15 05367 g018
Figure 19. Significantly recognized activities for each second of the video.
Applsci 15 05367 g019
Table 1. Parameters defined for the RF model in [7].
ML ModelParameters
estimators = 10
Random Forest (RF)min. samples splits = 2
min. samples leaf = 1
bootstrap = true
Disclaimer/Publisher’s Note: The statements, opinions and data contained in all publications are solely those of the individual author(s) and contributor(s) and not of MDPI and/or the editor(s). MDPI and/or the editor(s) disclaim responsibility for any injury to people or property resulting from any ideas, methods, instructions or products referred to in the content.

